1. Introduction
Human-wildlife conflicts, comprising both actual and perceived conflict, emerge from an array of social, ecological, political, and economic factors and are often exacerbated by human-human conflicts [
1]. People’s perception of the cost of living with or close to certain wildlife species is greatly influenced by social determinants that are borne from complex interactions between cultural, social, and personal factors [
2]. The perception of the level of negative interactions they are experiencing with wildlife is as important as the actual losses from wildlife damage [
3], as it affects the level of antagonism felt towards the perpetrating wildlife species and consequently influences what actions people are likely to take in such situations [
2]. Gaining a social perspective of negative interactions with wildlife can enable assessment of the perceived severity of these interactions and identify the varying capacity of individuals to cope with such losses [
3]. This can then illuminate the social factors that intensify negative interactions or favor coexistence [
4] and help guide effective management interventions that will be more acceptable or implementable [
5]. Indeed, understanding the social determinants of negative interactions between people and wildlife is critical in order to develop and implement successful, long-term mitigation strategies.
The perception of dangerous wildlife or pest species and the extent of HWC can often appear to be over-exaggerated or fabricated. Larger animals, protected animals, and those that cause more conspicuous damage, like elephants (
Africana loxodonta sp. and
Elephas maximus sp.), tend to receive a greater number of reports in interview studies (e.g., Arlet and Molleman [
6]; Linkie et al. [
7]; Siex and Struhsaker [
8]). Such discrepancies indicate that more than actual quantifiable damage contributes to perceived conflict levels [
7,
9]. Although previous studies have documented such discrepancies and consequently highlighted the need to assess both perceived as well as actual dimensions of negative wildlife interactions, a fundamental gap still exists in current knowledge surrounding what factors actually contribute to determining perceived conflict.
The extent to which people accept the presence of wildlife and tolerate interactions with wild animals is influenced by people’s experiences, attitudes, and values. A greater understanding of the drivers of these is needed to develop socially acceptable wildlife management strategies [
5,
10]. Such driving factors include species and size of the animal, how dangerous wildlife is considered to be, the degree of control an individual feels they have over wildlife, people’s religious and cultural beliefs, people’s education levels, and other social and cultural factors [
11,
12]. Negative feelings towards some wild animals can also be exacerbated by past experiences, e.g., the occurrence of crop raiding or livestock depredation [
2,
13,
14,
15,
16]. Attitudes toward dangerous animals such as elephants may also be influenced by the perceived risks of living near such wildlife species [
4,
17,
18]. If people believe they have little control over a conflict situation or have limited coping strategies, then they are also likely to further inflate perceptions of risk [
13].
If the aim of managing an HWC situation is to reduce the conflict, then reducing perceived risk, raising people’s tolerance of damage, and improving their attitude toward the perpetrating species appear to be as important as reducing the damage itself [
3,
19,
20]. Naughton-Treves and Treves [
3] also highlighted that local intolerance for wildlife may be enlarged by institutional constraints on coping strategies, with people being less tolerant of imposed risk than voluntary risk [
21]. Therefore, when wildlife species are perceived to belong to the government, people’s perception of risk may be heightened and tolerance reduced. For example, elephants, which are protected under international and national laws, are large and potentially dangerous animals that inspire animosity and fear among people living within their range [
22] and often compete with humans for space and limited resources (e.g., [
23]). People living close to elephants, therefore, often view them as a threat to their livelihoods and indeed their lives [
1]. Exploring people’s perceptions of negative interactions with and attitudes towards elephants can provide insights into drivers of HWC and aid in focusing management strategies to reduce HWC.
From the literature, it is clear that when designing HWC mitigation and management strategies it is important to consider perceived conflict levels alongside actual conflict types and measurements [
24]. To understand perceptions and attitudes, however, it is necessary to identify factors that influence them [
19]. This paper aims to determine factors affecting attitudes towards elephants and perceptions of conflict of subsistence farmers in the Okavango Delta Panhandle (ODP), Botswana. Five main questions are addressed: (a) What social factors affect attitudes towards wildlife and elephants? (b) What are the actual (measurable) conflict levels with elephants? (c) How severe is the perceived level of conflict with elephants? (d) What are the varying coping strategies of people experiencing conflict with elephants? and (e) How can perceived human–elephant conflict be addressed?
2. Materials and Methods
This study was located in the Wildlife Management Area (WMA) NG11 on the eastern side of the Okavango Delta Panhandle (ODP), an area of 5289 km
2 where the Okavango River enters Botswana before dispersing across the Okavango Delta [
25]. It used data collected between 2008 and 2010 due to the completeness of the data record; however, HEC research has been conducted here by the author for the past twenty years [
1,
23,
26,
27,
28,
29,
30,
31,
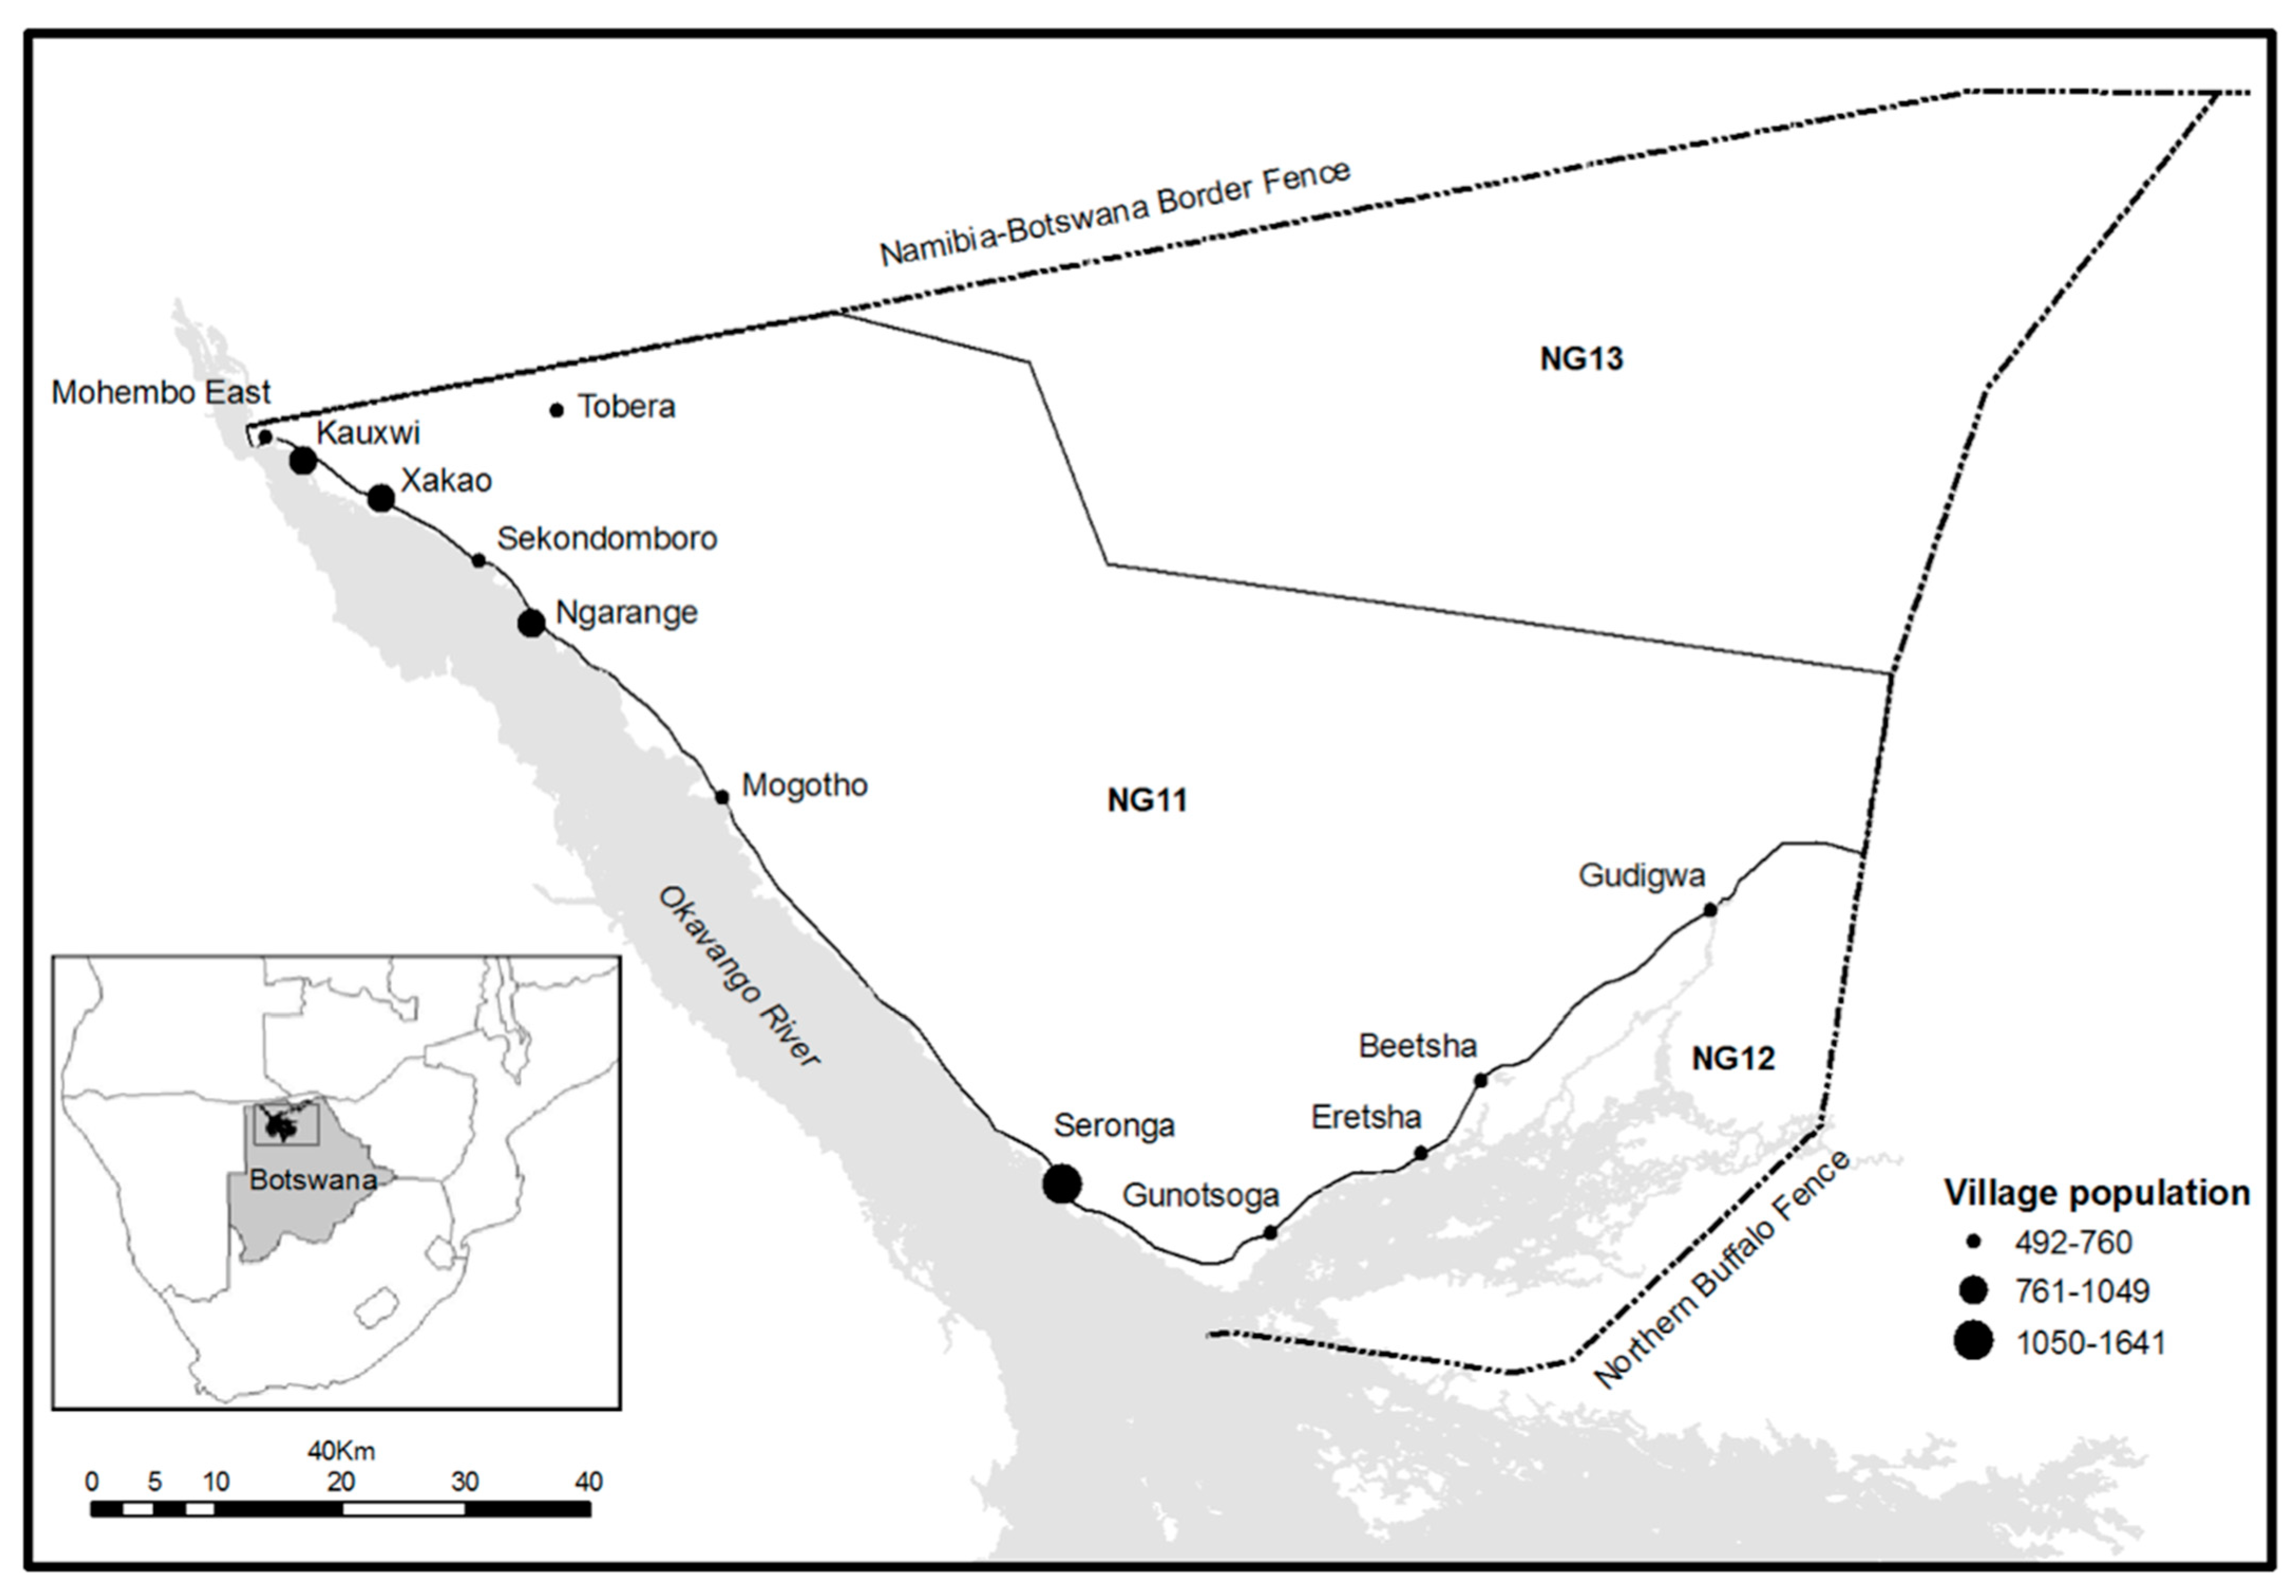
32]. Fourteen main villages (population > 500) are in the area, extending from Mohembo-East to Gudigwa, including Kauxwi, Kaputura, Xakao, Tobere, Sekondomboro, Ngarange, Mogotho, Mokatcha, Seronga, Gunotsoga, Eretsha, and Beetsha, with additional cattle posts and settlements between villages, and twelve of these villages were sampled during this study (see
Figure 1).
The 2011 census recorded 16,306 people living in the ODP, with six main ethnic groups, namely Bahambukushu (41%), Bayei (33%), Basawara (Anikwhe and Bukakwhe) (20%), Bakgalaghadi (1%), and Baxereku (5%), residing in the area, each with its own ethnic identity and language [
33]. The estimated elephant population in NG11, NG12, and NG13 was 15,492 elephants in 2010 [
27]. Subsistence agriculture is an important livelihood strategy [
33], and depending on the timing of annual rainfall (average 360–500 mm), the planting of crops occurs between November and January, and harvesting occurs between April and June [
27]. Elephants are distributed throughout NG11 WMA and utilize the dry land areas during the wet season and move past agricultural areas and settlements during the dry season to access the Okavango River and resources [
1]. People and elephants compete for space in the area, and human–elephant conflict incidents are high. Elephants damage crops; break fences; damage property; and chase, injure, and sometimes kill livestock and people. Crop damage by elephants is the most prevalent type of conflict in the area [
1].
2.1. Questionnaire Design and Sampling
The target population for the survey was subsistence farmers in the eastern ODP. A random sample of participants was selected from a database of farmers whose fields had been raided or not by elephants between 2008 and 2010. This dataset was collected using methods outlined by Songhurst and Coulson [
27], where the standardized data collection protocol of the International Union for the Conservation of Nature (IUCN) [
34] was used to collect primary data on HEC. All fields raided by elephants between January 2008 and May 2010 were visited by both the local enumerator and the principal investigator (A.S) to ensure consistency and reliability of data collection. Details on each damage incident were recorded on standardized data collection forms. The average pace size of each enumerator was measured, and the areas of all fields and damaged portions of the fields were estimated in square meters using enumerator paces [
34]. Each damage incident was geo-referenced in Universal Transverse Mercator (UTM) coordinates using a Garmin High Sensitivity global positioning unit (Garmin Corp., Ulathe, KA, USA), and location details were recorded. All fields reporting elephant raids were visited over three crop seasons. At the end of each crop season, a selection of non-raided fields in different localities was identified by enumerators in each village. Although this was not strictly random, it is comparable to methods used in other studies [
35,
36,
37,
38] and was logistically feasible for sampling non-raided fields.
To gather representative data and record the diverse opinions and views of the farming community, participants were selected through a stratified and randomized approach. Only one person per household was interviewed. Participants represented both genders, a range of ages, and individuals from different economic, social, and cultural backgrounds. Samples aimed to represent 5–10% of the total village population. Potential respondents were asked if they agreed to be interviewed; if they agreed, the interview proceeded. To reduce bias, the time-recall period was minimized, the principal investigator (A.S) spent two years in the community so that the interviewees’ and researcher’s understanding of each other’s motivations were more closely aligned, and all research assistants and translators were thoroughly trained. Questionnaires were designed to ask direct and relevant questions, and interview time was kept between 35 and 40 min to prevent respondent fatigue [
39]. The Imperial College Research Ethics Committee granted ethical approval, and the Ministry of Environment Wildlife and Tourism in Botswana granted permission for this research under permit EWT 8/36/4 XVII (79).
Respondents were interviewed either at their fields or in their homestead at the village. The questionnaire was written in English then translated into written Setswana and checked by a university lecturer at the University of Botswana for appropriateness and correctness of interpretation. Pilot studies were conducted on a random selection of 20 farmers from different cultural groups until questions were being answered consistently, to ensure question clarity and effectiveness of questions in gaining the required information. Interviewers were fluent in English and were familiar with the study area and the locations of fields/compounds where interviews were conducted. Each interviewer was assisted by a translator who was both fluent in English, Setswana, and the local tribal language (Hambukushu, Seyei, or Sisarwa) and familiar with farmers in the village. To ensure accuracy, the same interviewers were used and the same interview questions were administered during the study.
Structured and open-ended questions were used in interviews to collect quantitative and qualitative information (see
Supplementary Tables S1 and S2 for further details). A simple question-and-answer format was adopted to maximize the accuracy of data by minimizing possible biases caused by misinterpretation by respondents or researchers [
40]. A wealth ranking criterion was established which included ownership status of the field, number of cattle owned, house type, and other household possessions owned (i.e., radio, TV, car, etc.). Qualitative data arising from open-ended questions in the survey were recorded, systematically evaluated, and coded, and any emerging themes were identified [
41]. These themes were matched with quantitative findings. This mixed-methods approach was used to both triangulate responses and to further interpret the results, in a comparable way to other studies, e.g., [
42]. Each interview covered several topics, including the following: (1) interviewee socioeconomic details and wealth ranking; (2) agricultural practices; (3) opinions towards wildlife and elephants; (4) local knowledge of elephants; (5) problems with wildlife and elephants; (6) possible options for mitigating human–elephant conflicts; (7) feelings towards living with elephants.
2.2. Data Analysis
All data analysis was carried out using R 3.4.3 [
43]. The data were screened for collinearity and outliers prior to analysis (using box plots and scatter plots). Descriptive statistics were derived for all factual and attitudinal questions. Continuous data were square root transformed to approximate better to a normal distribution where appropriate. Questionnaires frequently produce a considerable amount of data, which may be interrelated; therefore, multivariate analysis is important [
40]. Multivariate OPMs and GLMs were used to test variables in combination. See
Supplementary Table S3 for more details on the variables analyzed.
2.2.1. Ordered Probit Model (OPM) Analysis
OPM analysis has been shown to be useful for various ecological studies where ordered categorical response variables are present; methods outlined by Karlsson and Sjostrom [
44] were followed. The dependent variable y
i (perceived conflict level (0–4) or attitude towards elephant (1–5)) in the OPMs is discrete and ordered. Predictor variables were removed successively from the model, and the likelihood ratio (χ
2 statistic) was calculated to determine whether the deviance increase upon removing each predictor was significant [
45]. The models were used to predict values of either perceived conflict level or feeling towards elephants, and the difference between predicted and actual values was calculated. Frequency distributions of this difference were drawn to illustrate the predictive capability of the model.
2.2.2. Generalized Linear Models (GLMs)
Only significant variables (
p < 0.05) from univariate analyses were included in multivariate analysis. Multivariate GLMs with binomial errors were used to investigate continuous and categorical correlates in combination [
46]. The maximum model for two-way interactions was fitted and simplified by stepwise deletion of non-significant terms. Model fit was checked using a chi-squared goodness-of-fit test, and significance was determined for multivariate analyses at
p < 0.01. Influential data points were left out one at a time, and the model was refitted to check if parameter estimates or standard errors were substantially affected.
2.3. Key Drivers of People’s Feelings towards Elephants and Wildlife
This study explored what social factors affect attitudes towards wildlife and elephants. Respondents were asked to identify (i) how they felt towards elephants (1 = love, 2 = like, 3 = neutral, 4 = dislike, 5 = hate), (ii) whether they liked living near wildlife (1 = yes, 0 = no, or neutral), (iii) level of feeling towards elephants (coded 1–5), and (iv) attitude towards wildlife (dislike = 0 or like = 1, or neutral). For questions ii and iv, no respondents gave neutral responses. The codes were used as the independent units of analysis in statistical analyses.
Ordered probit models (OPMs) were used to explore factors affecting feelings towards elephants (coded 1–5), with continuous and categorical explanatory variables tested in combination. Explanatory variables included socioeconomic factors (gender, age, highest education level reached, wealth ranking, totem, livelihood strategy other than farming), indicators of actual conflict level (number of times field raided this year, number of years field raided, area damaged, number of known people killed by elephants), perceived conflict level (coded 0–4), attitude towards living near wildlife (1 = like, 0 = dislike), and whether or not respondent’s village received a direct source of income from tourism (coded 0 or 1).
Generalized linear models (GLMs) were used to explore whether or not people liked living near wildlife (coded 0 or 1), with binomial error structure. Explanatory variables included socioeconomic factors (as above), indicators of actual conflict level (as above), perceived conflict level (coded 0–4), attitude towards elephants (coded 1–5), and whether or not the respondent’s village received a direct source of income from tourism (coded 0 or 1).
2.4. Perceived Conflict Level (PCL) with Elephants
Respondents were asked if they felt like they were in conflict with elephants, and if they answered yes, they were asked to grade the level of conflict they experience (0 = none to 5 = high). Data were collected on actual conflict levels (ACLs) per farmer by assessing fields raided by elephants and from DWNP problem animal control data records (see [
27] for details on the methodology used).
PCLs were compared with indicators of ACL using analysis of variance (ANOVA). Continuous independently measured actual conflict indicators (number of times raided this year (NTR), number of years previously raided (NYR), known number of people killed by elephants (PK), and the area damaged in most recent elephant raid (AD) were used as response variables.
To explore the effectiveness of using crop raiding (the most prevalent form of HEC in the study area) as an indicator of actual conflict, a conflict ranking for respondents was developed based on the elephant crop-raiding history of fields from Songhurst et al. [
1] (see
Table 1). This categorical indicator of actual conflict (0 = none to 5 = high) was compared to the perceived conflict ranking levels using a chi-squared goodness-of-fit test. The spatial distribution of calculated and perceived conflict levels was plotted to give a visual representation of differences.
2.5. Coping Strategies of People Experiencing Conflict with Elephants
First, the productivity of fields in good and bad harvests was summarized in relation to elephant damage relative to productivity levels needed to feed dependant people. Second, coping strategies that were available to respondents during years of bad harvests and which of these were the preferred strategies were investigated.
2.6. Addressing Perceived HEC
Here, the factors influencing the perception of conflict were explored. OPMs were used to test possible continuous and categorical explanatory variables in combination. Explanatory variables represented socioeconomic factors, attitudes towards wildlife and elephants, field location, raiding history of the field, and preferred mitigation options of respondents. Second, a GLM for whether or not people believed there is a solution to reduce the HEC they are experiencing (coded 0 or 1), with a binomial error structure, was used to test continuous and categorical explanatory variables independently and in combination. Explanatory variables included socioeconomic factors (as above), indicators of actual conflict level (as above), perceived conflict level (coded 0–4), productivity of the field (amount of crop usually harvested, amount of crop harvested in a year with crop failure (elephant or otherwise related), amount of crop needed to support dependants), acceptable management strategies (favored strategies, whether respondent is willing to move field (coded 1 = yes, 0 = no), whether elephant paths should be considered during land use planning (coded 1 = yes, 0 = no), whether respondent agrees with killing elephants (coded 1 = yes, 0 = no)), whether the respondent believes compensation rates are fair (coded 1 = yes, 0 = no), and who the respondent feels is responsible for reducing crop raiding by elephants and for protecting their field.
Finally, favored management strategies were summarized, and chi-squared tests were used to investigate differences between attitudes towards who is responsible for reducing crop raiding and protecting individual fields. Four main development issues were identified in the study area prior to questionnaire surveys through informal interviews with local residents, namely no electricity, no bridge across the river, no tarmac road, and problems with elephants.
3. Results
3.1. Respondents
A total of 909 structured interviews were conducted in 2010, over an 8-month period (January–August). Only three farmers declined to be interviewed (because they were “too angry with the elephants to answer questions about them”), giving a 99.7% response rate. The mean interview time was 36.9 (±12.5) minutes. Respondents were interviewed from raided fields in 2010 (34.1%) and non-raided fields in 2010 (65.8%), and raiding history in previous years was recorded. The ethnicity ratio of respondents was Bahambukushu (64.4%), Bayei (15.3%), Basawara (Anikwhe and Bukakwhe) (11.4%), Bakgalaghadi (1.2%), and Baxereku (7.7%). The median age of respondents was 48 years (range 18–92), and there was a higher number of female respondents (62%). Most respondents (71.2%) were placed in the poor or very poor wealth ranking, while 15% were classified as wealthy. Over half of the respondents relied solely on subsistence farming as a livelihood (56%), while 7% were in full-time employment.
3.2. Feeling towards Elephants
Most respondents (56%) did not like living with wildlife around them, and even more had negative views towards elephants (82%). When asked to select a level of feeling towards elephants, the mean feeling was 4.2 (±1.1) dislike for elephants. The main reasons given for disliking elephants were because they raid crops and they can kill people. Those people that saw an advantage of living near elephants gave reasons such as elephants bringing income, employment, and tourism and being “important for future generations”.
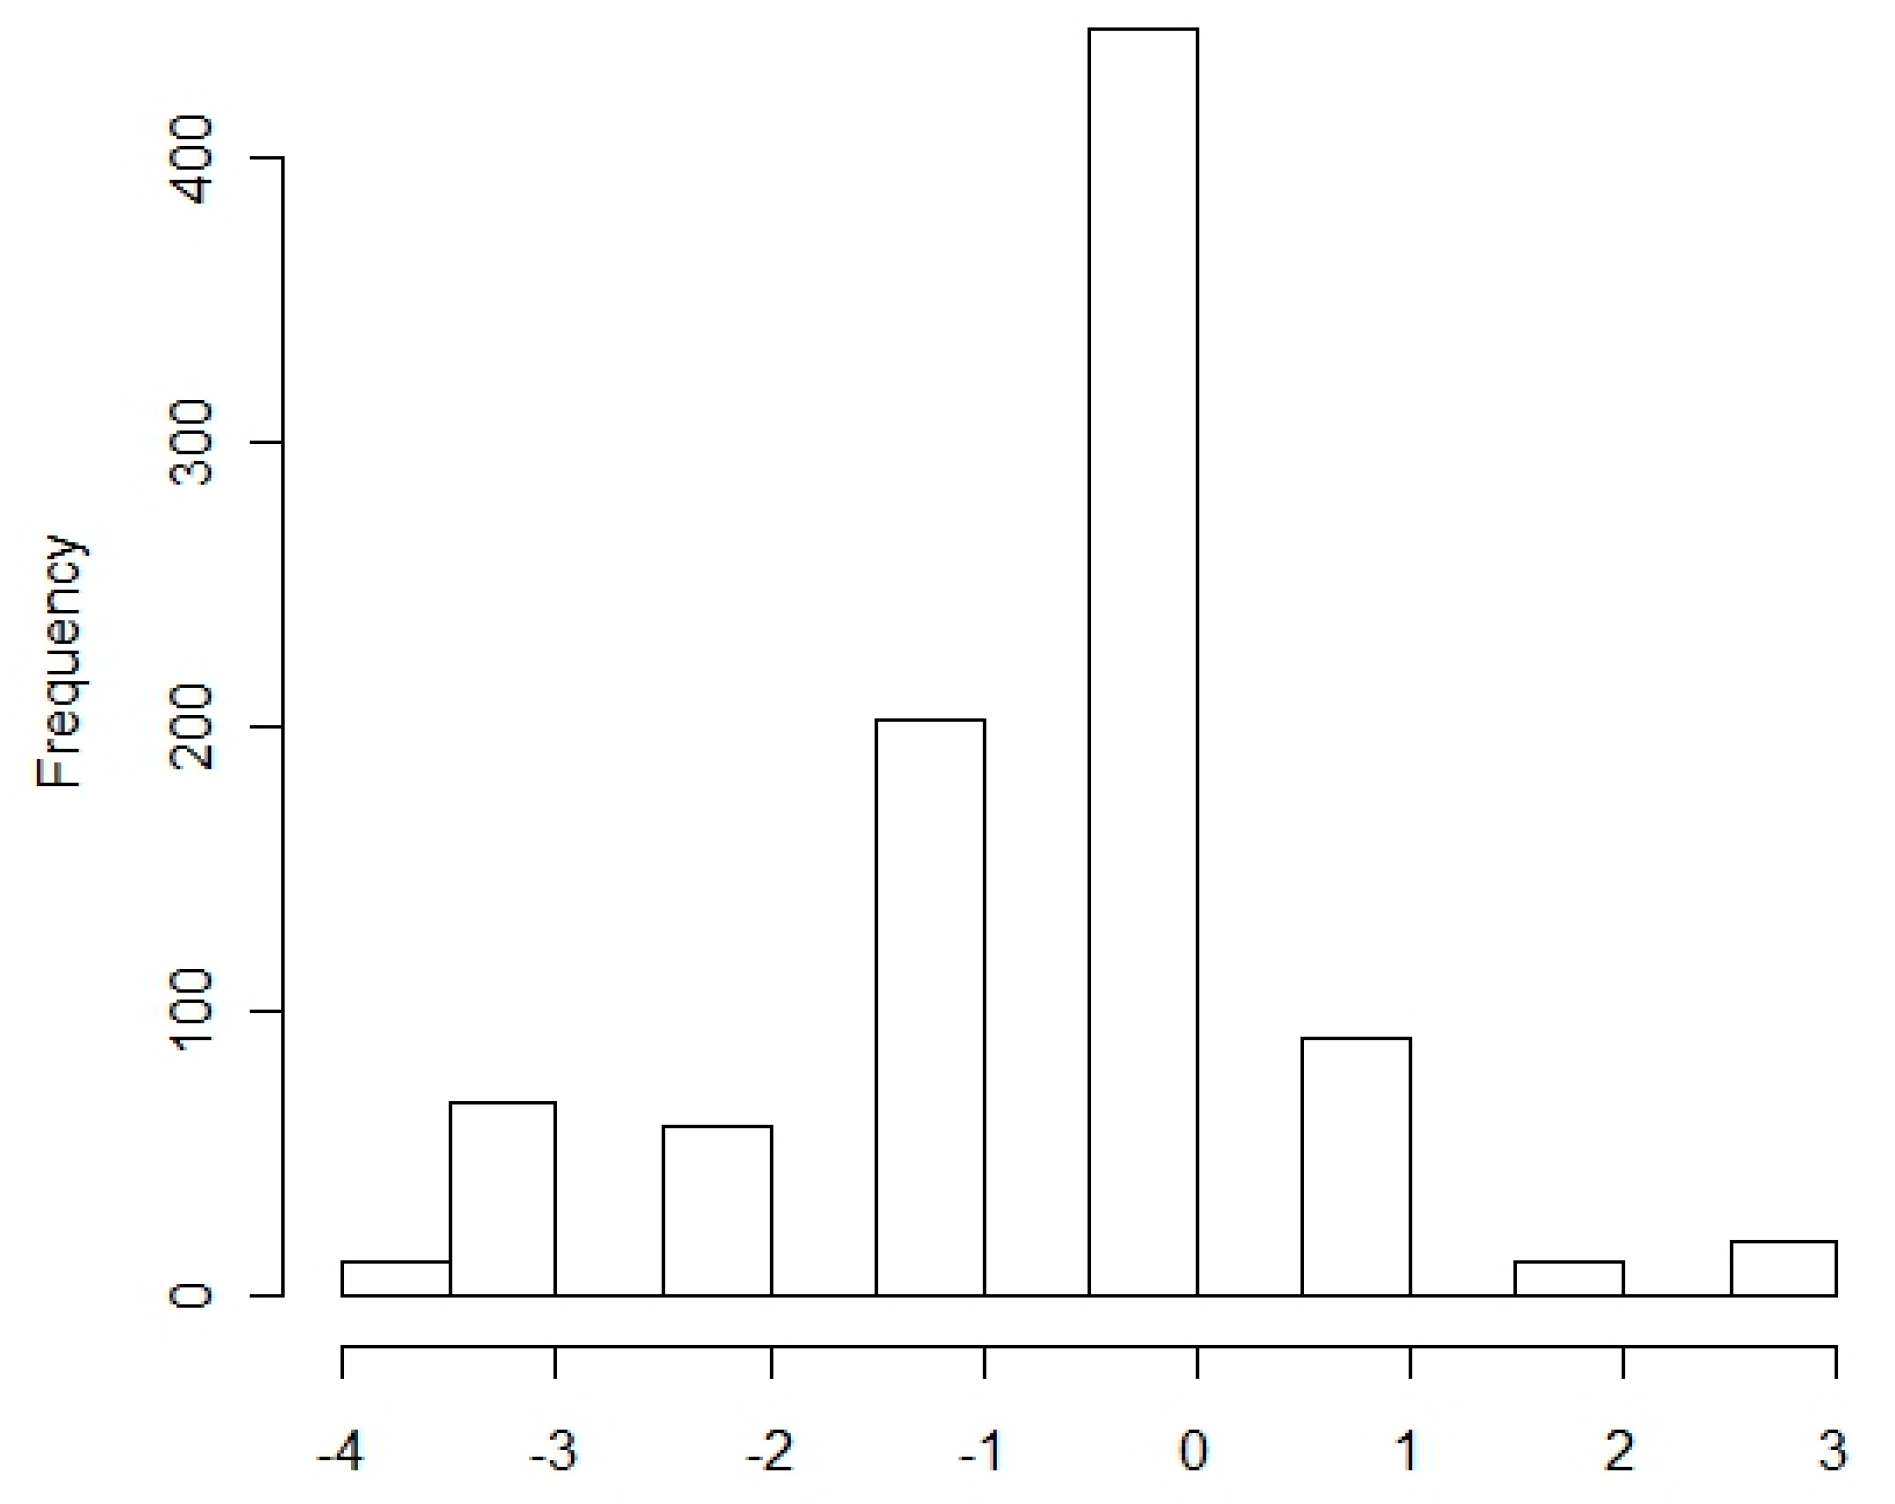
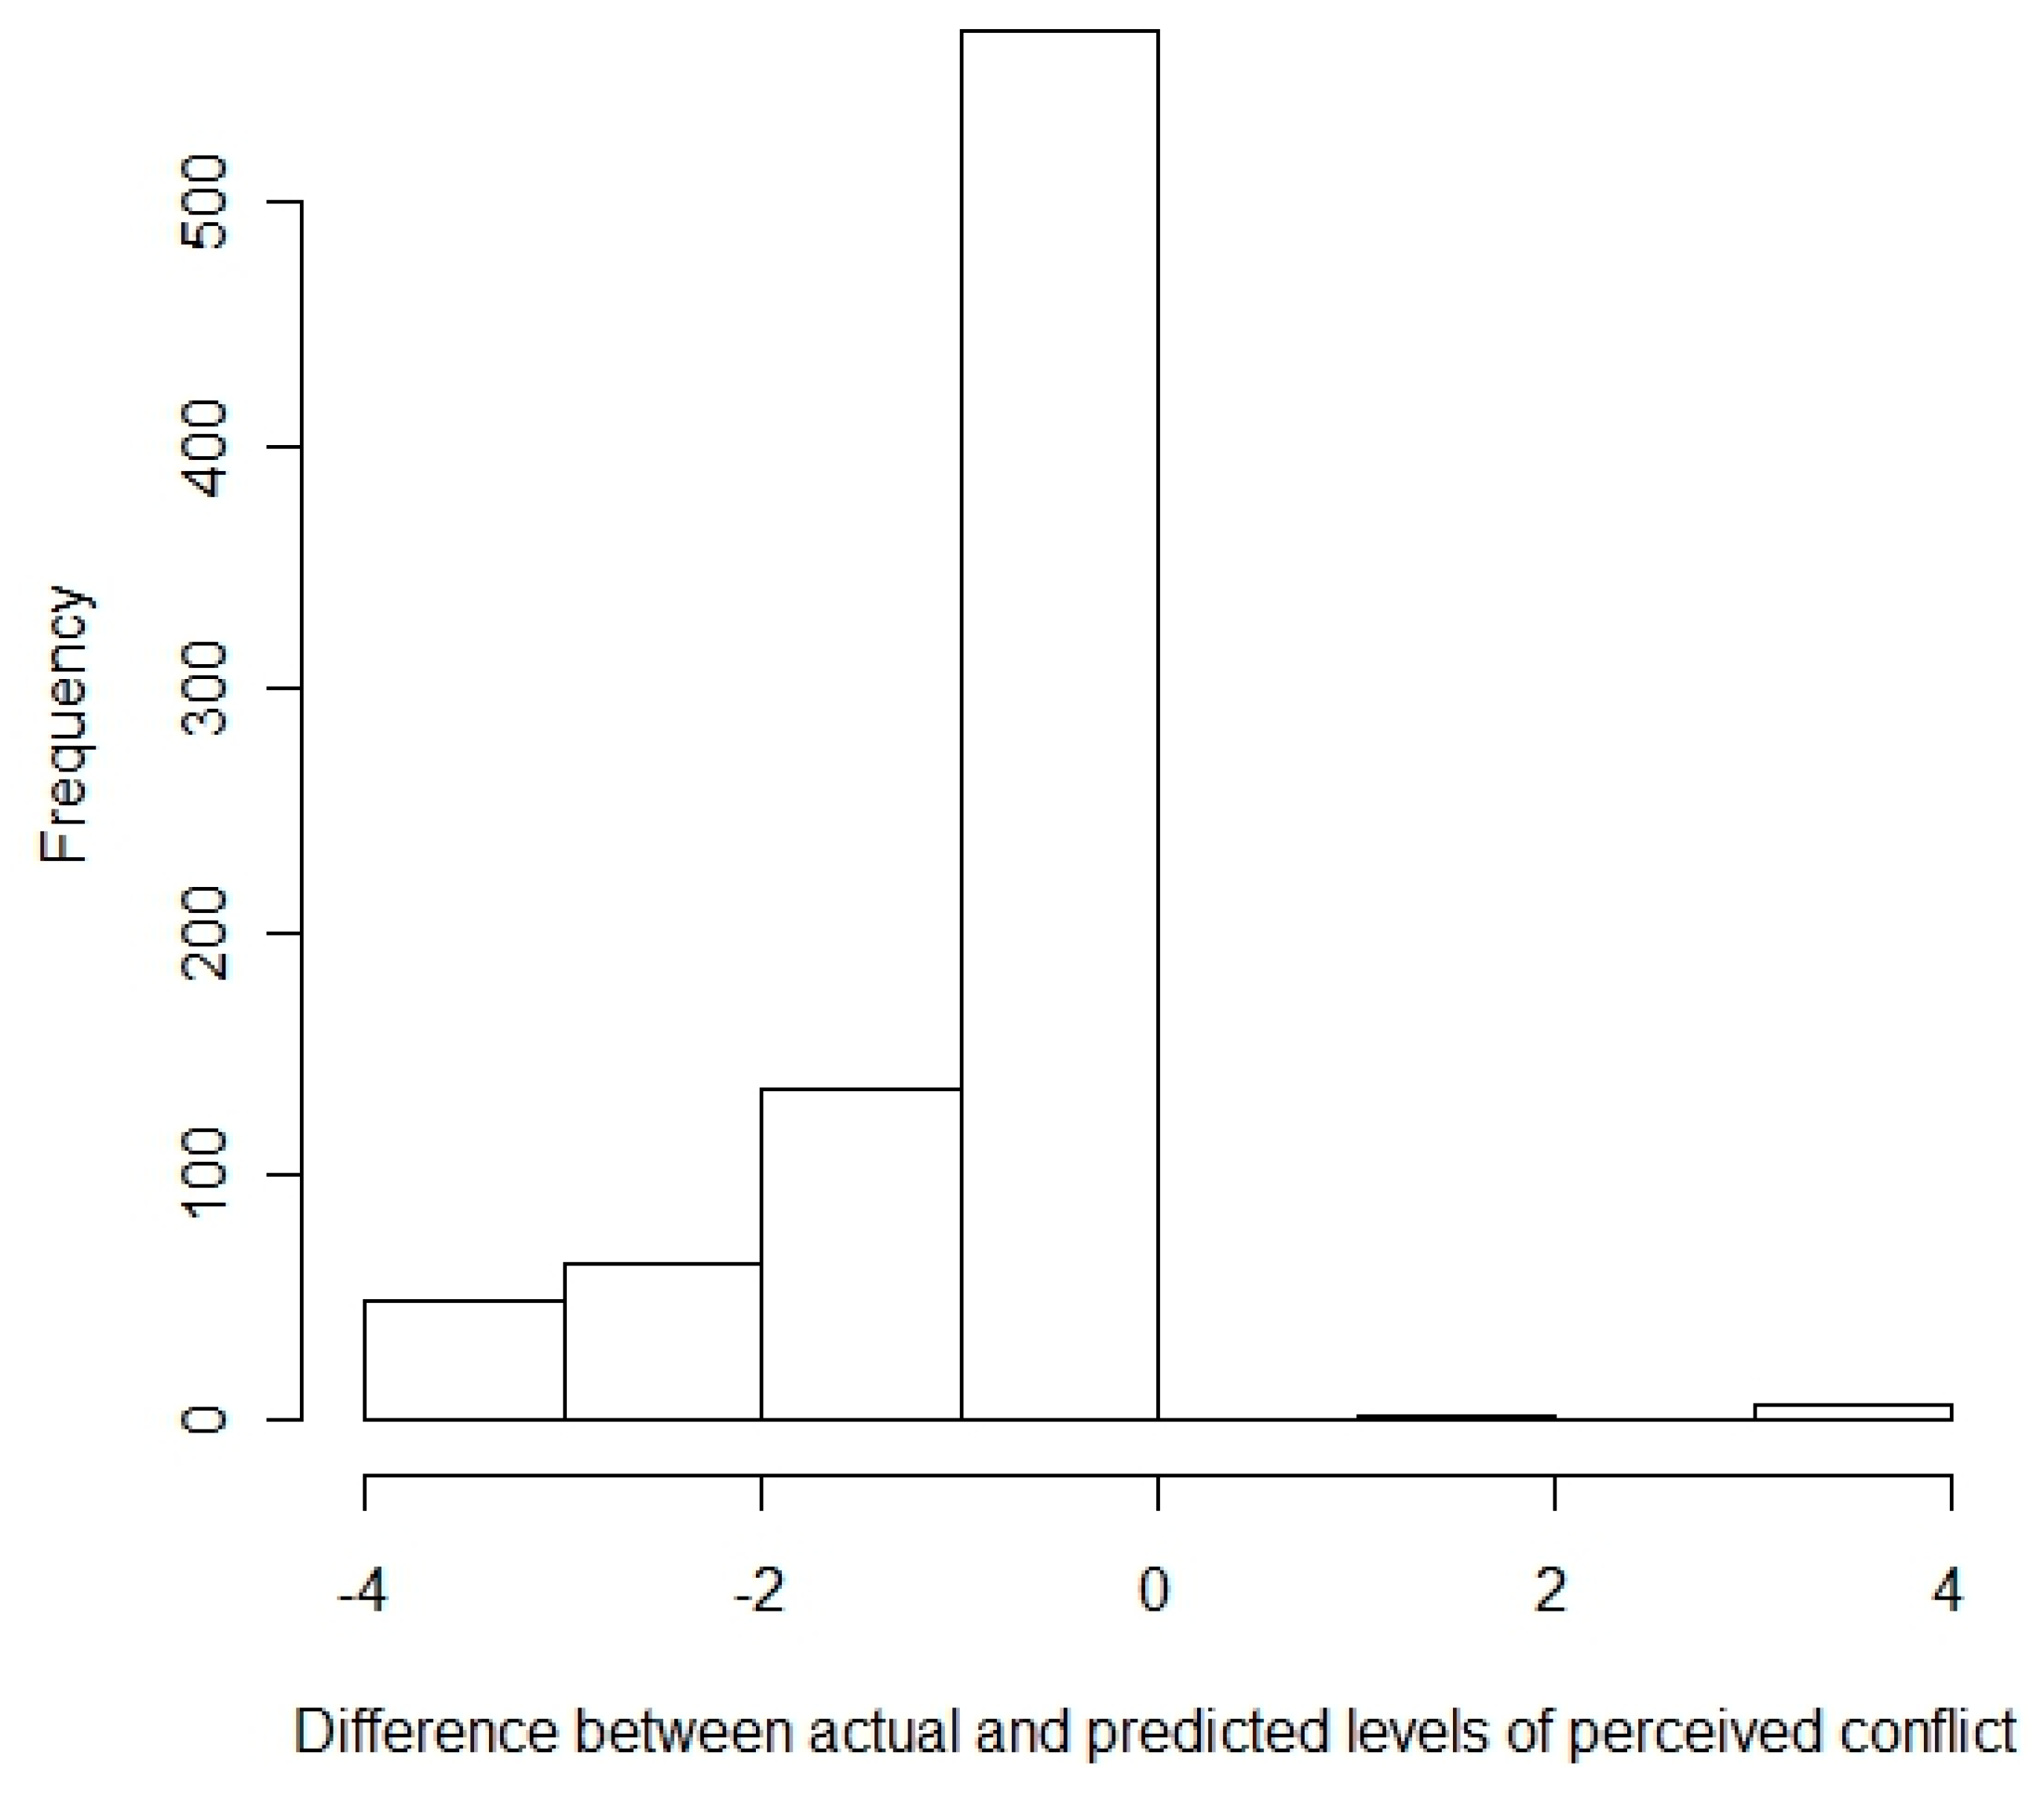
The OPM for the level of feeling towards elephants (FTE) retained the variables gender and ethnicity of the farmer, and attitude towards wildlife (ATW), as having statistically significant effects (see
Table 2). Interactions between ATW and gender, as well as ATW and ethnicity, were also retained, indicating that farmers who do not like wildlife have a higher probability of disliking elephants and male farmers had a higher probability of liking elephants. The ethnicity of the farmer affected the FTE, with Basarwa and Baxereku farmers having a higher probability of disliking elephants, while Bakgalaghadi and Bayei farmers had a higher probability of liking elephants. A respondent’s FTE did not appear to be affected by the raiding history or location of their field, or whether they had a cultural elephant totem or not (see
Supplementary Table S3 for full results). The ordered probit model appeared to predominantly predict correct attitudes towards elephants (0 on histogram) or more negative feelings towards elephants than actually occurred (see
Figure 2).
Interestingly, many respondents did not eat elephant meat (38%), either because they are Christian and believe it is forbidden in the bible, or they were allergic, disliked the taste, were forbidden under traditional beliefs (e.g., a traditional Bahambukushu belief states that elephant meat is made up of lots of other animal meat (including human), and therefore, people should not eat elephants), or felt that elephant bodies are too similar to humans. Some farmers also had elephants as their totem (n = 124); however, less than half of these respondents believed they should not eat elephant meat (n = 50).
3.3. Attitude towards Wildlife
The GLM for ATW retained the respondent’s gender (χ2 = 9.1, df = 1, p < 0.01) and whether the respondent’s village benefits directly from tourism (χ2 = 23.3, df = 1, p < 0.001) as significant positive effects (male farmers and farmers living in villages directly benefitting from tourism are more likely to like all wildlife). A respondent’s FTE (χ2 = 129.9, df = 4, p < 0.001) was retained as a significant negative effect, with farmers who expressed an attitude of neutrality, dislike, or hate towards elephants being more likely to dislike all wildlife. Education level (χ2 = 15.7, df = 4, p < 0.01) was retained as a significant effect, with non-formally educated respondents being more likely to dislike wildlife and those educated to a junior secondary level being more likely to like wildlife. Respondents’ ATW also appeared to be affected by an interaction between age and education level (χ2 = 13.3, df = 4, p < 0.01); older farmers with a non-formal education were more likely to like wildlife.
3.4. Perception of Conflict
Farmers identified a number of difficulties with growing crops in the ODP, ranging from unpredictable rains to domestic and wildlife crop-raiders. Most respondents (63%) identified elephant raiding as being the biggest difficulty with farming in the area, and 77% of respondents ranked elephants as the worst problem with everyday life. Most respondents (77%) said crop raiding by elephants was the biggest problem with elephants, while 16% felt that elephants killing and injuring people was the worst. Crop raiding by elephants was found to be the most prevalent form of HEC in the study area in previous studies assessing elephant HEC incidents [
1].
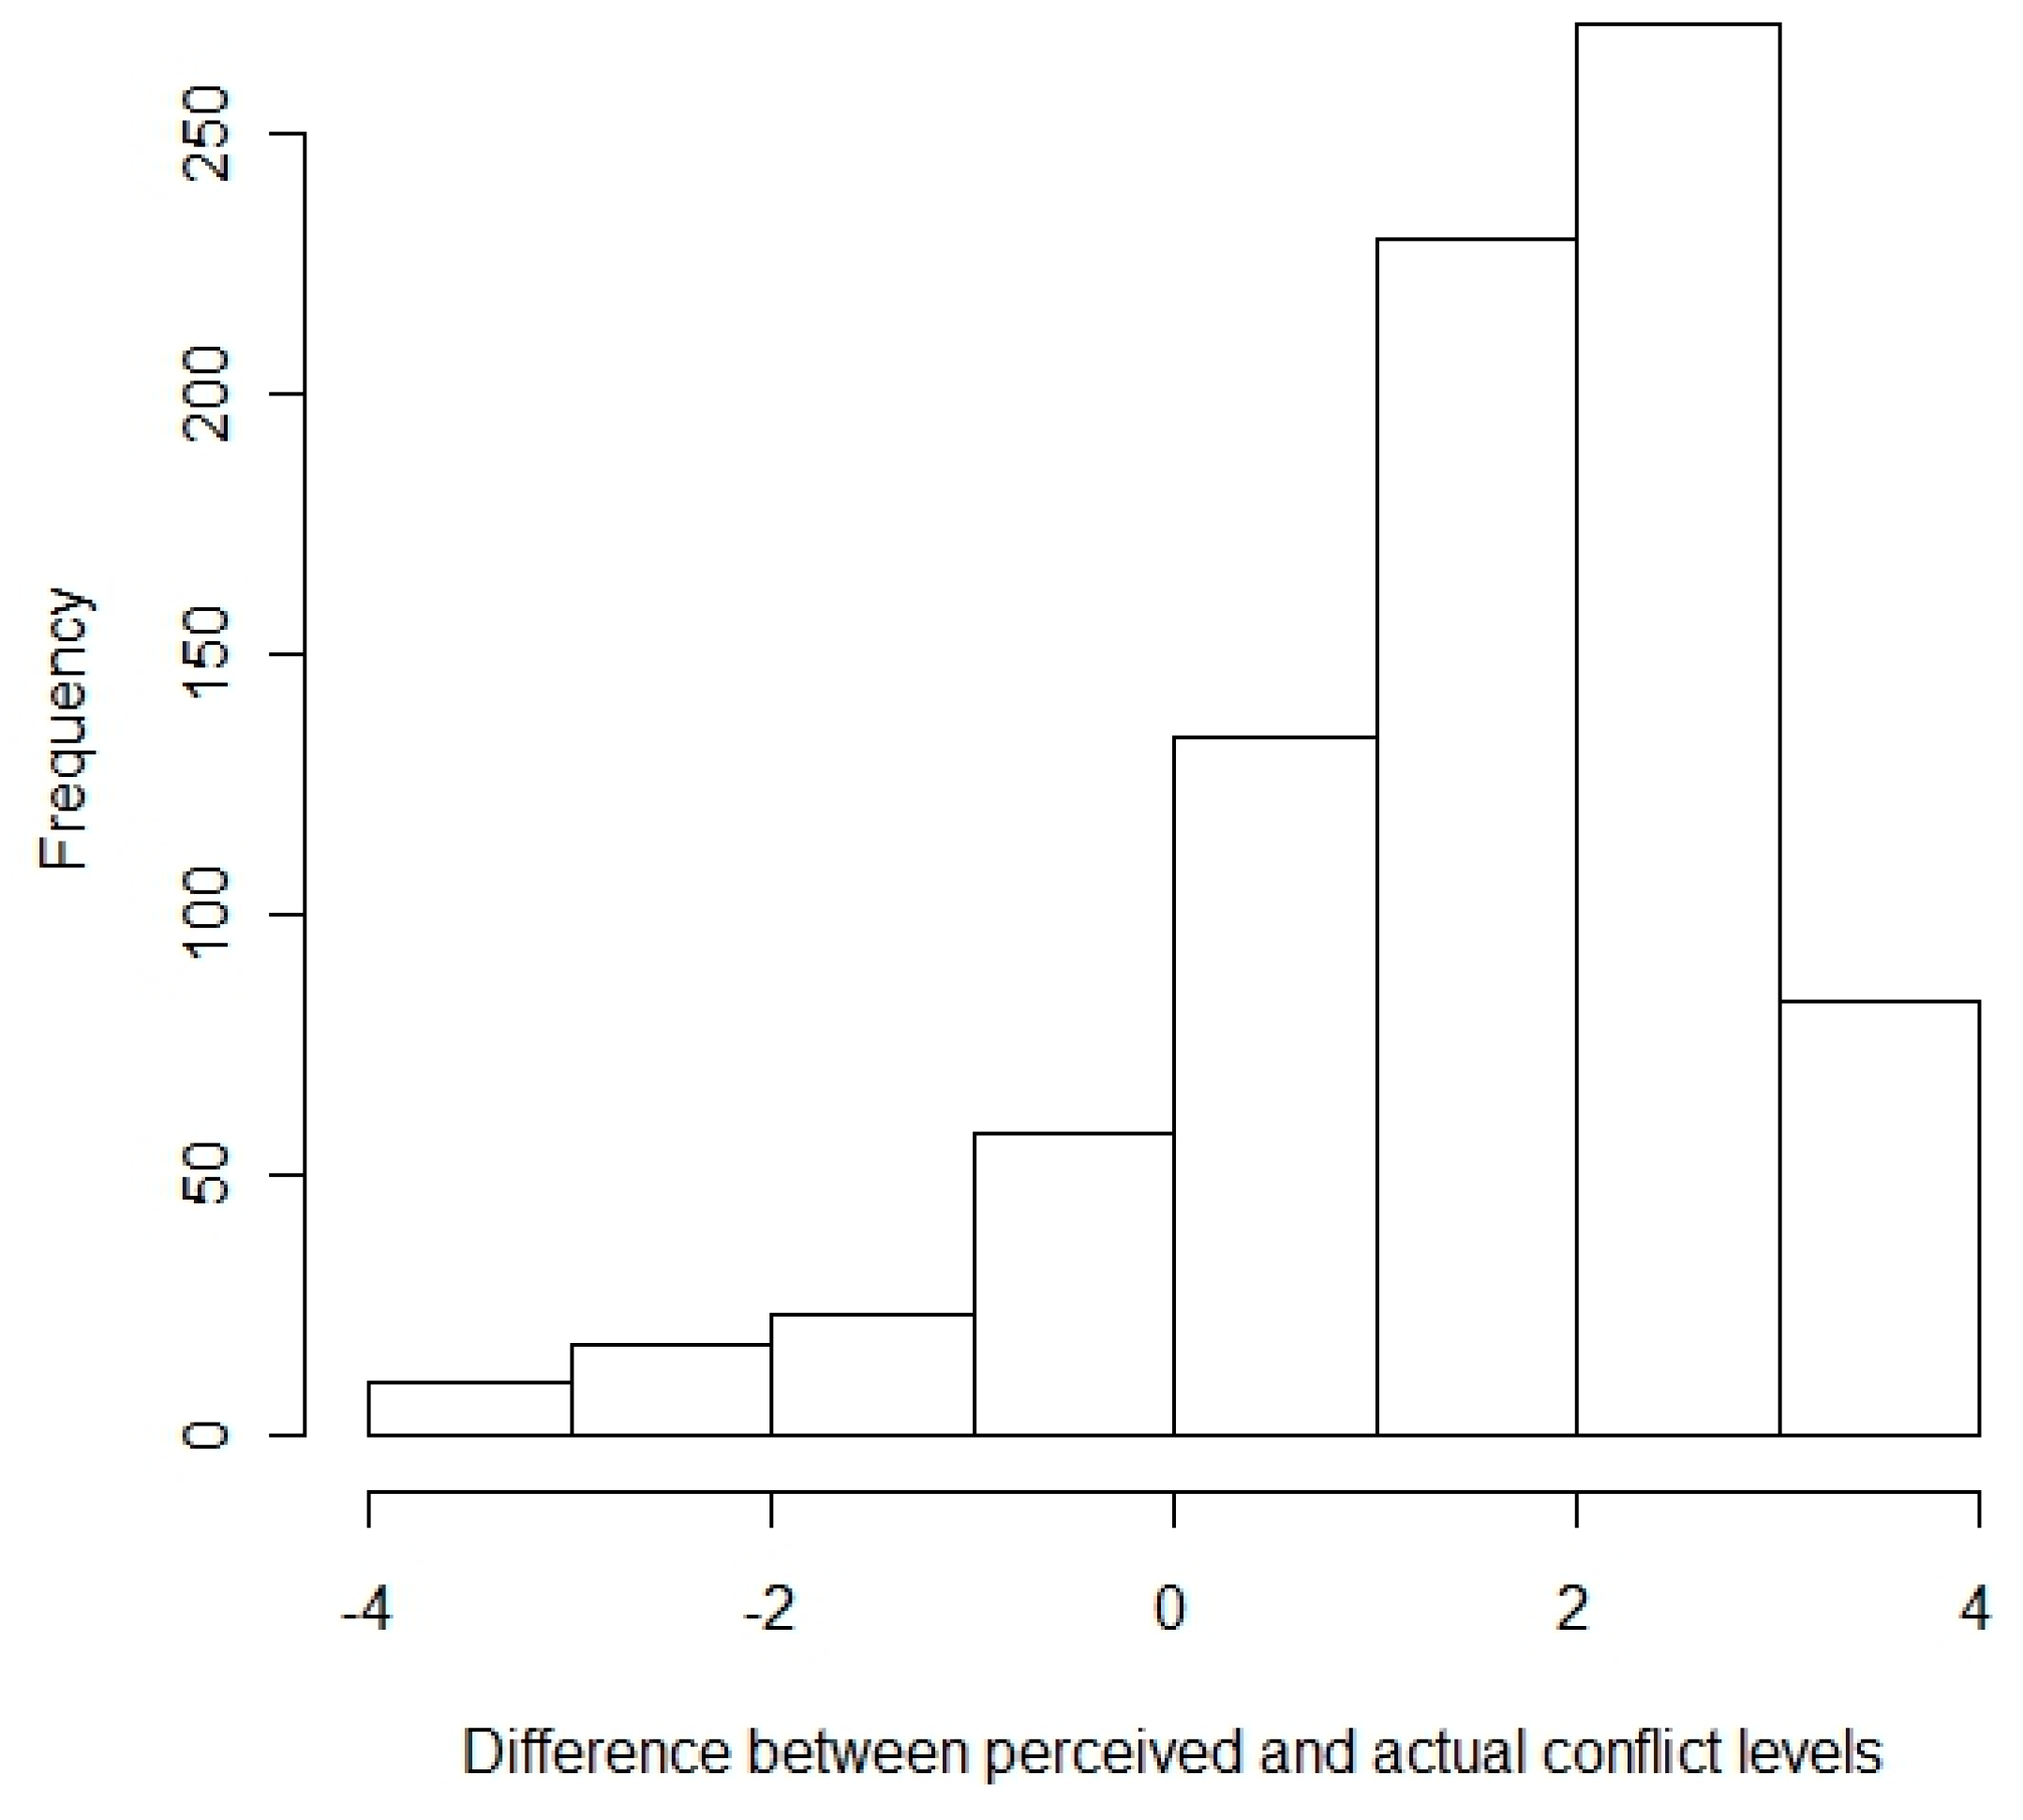
Most respondents (96%) felt they were in conflict with elephants and when asked to grade the level of conflict they were experiencing (scale 0 = none to 4 = high); 70% felt it was high, with a mean conflict rate of 3.5 (±0.99). Out of the 909 participants, 147 had never been raided by elephants (16%), while the median number of years a respondent had been raided in the past was 1 (range 0–70 years) and the median number of times raided this year was 0 (range 0–10 times).
Relationships between perceived conflict levels (PCLs) and NTR (F = 6.5, df = 4,
p < 0.001), NYR (F = 3.9, df = 4,
p < 0.001), and PK (F = 3.9, df = 4,
p < 0.001) were significant, but the area damaged (AD) was not. Levels of perceived conflict appear to be higher when certain indicators of actual levels of conflict are high. The PCLs were significantly different from actual crop-raiding levels (ACLs) (χ
2 = 44.8, df = 16,
p < 0.001), with PCLs generally being higher than ACLs (see
Figure 3).
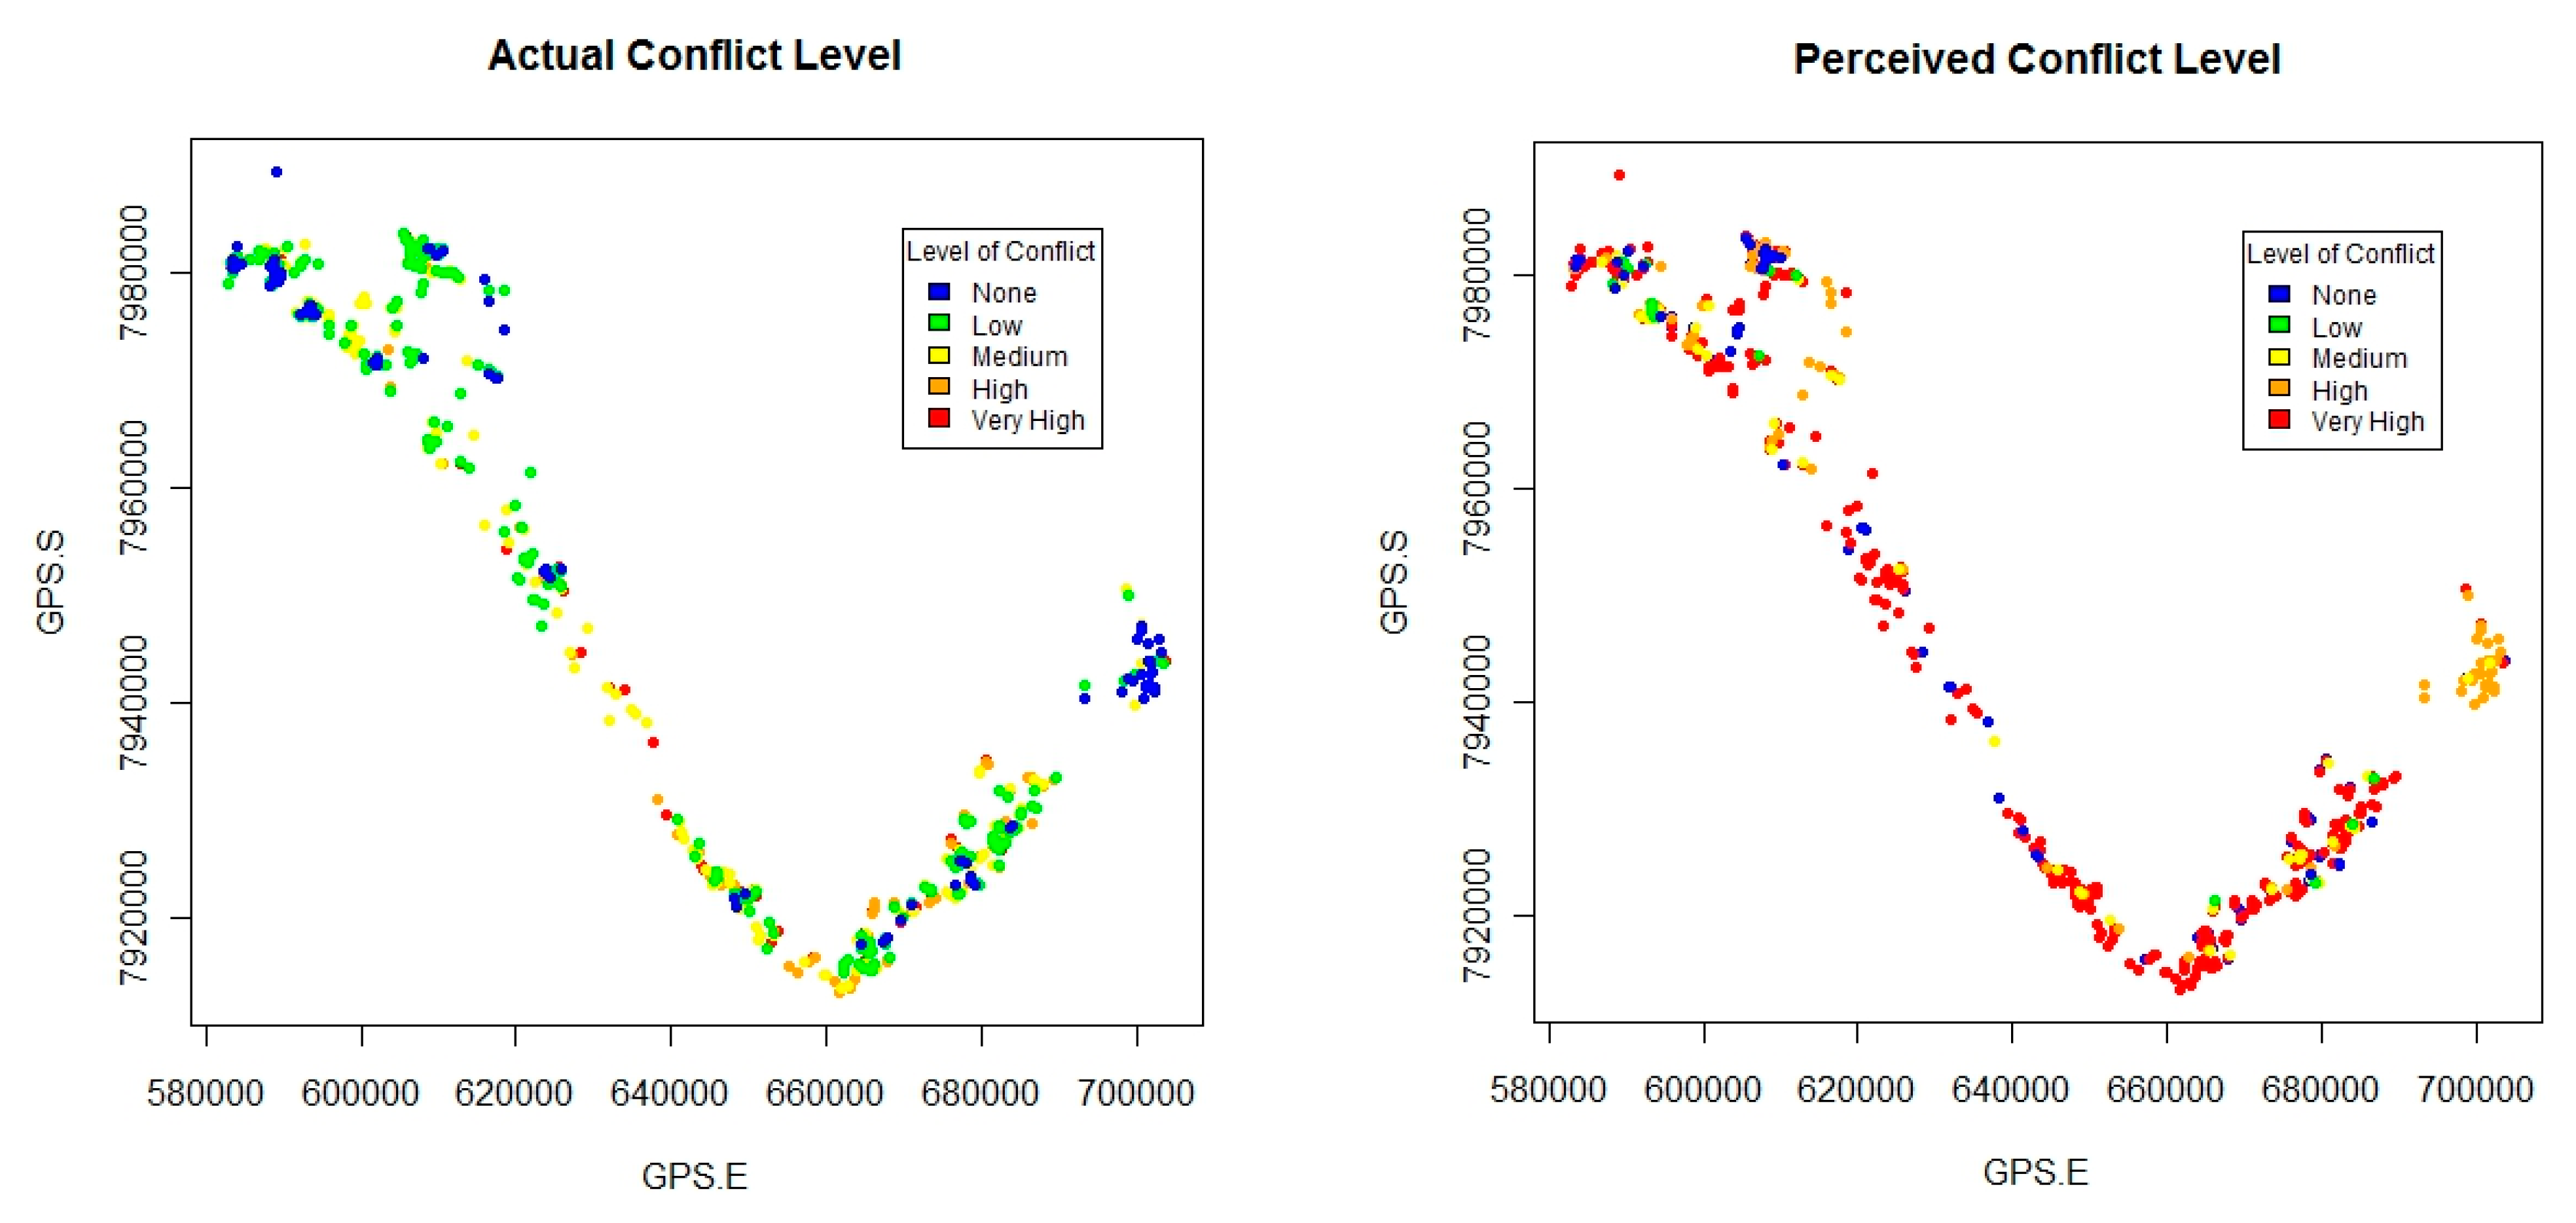
Figure 4 illustrates the spatial distribution of differences between PCLs and ACLs. These results indicate that either (i) farmers are over-inflating conflict levels or (ii) crop-raiding level ranks alone are not a good indicator of actual conflict levels. The graph axes reflect the UTM GPS coordinates of where actual crop-raiding or perceived crop-raiding incidents took place (GPS.S is the south coordinate and GPS.E is the east coordinate).
3.5. Coping Strategies
The main purpose of growing crops in the study area was for subsistence (
n = 813), with only 10% of farmers selling some crops for cash. The median number of people a field supports (dependants) was 7, ranging from 1 to 34, and the number of dependants was significantly higher than the number of people in the respondent’s immediate family (t = 3.09, df = 1615,
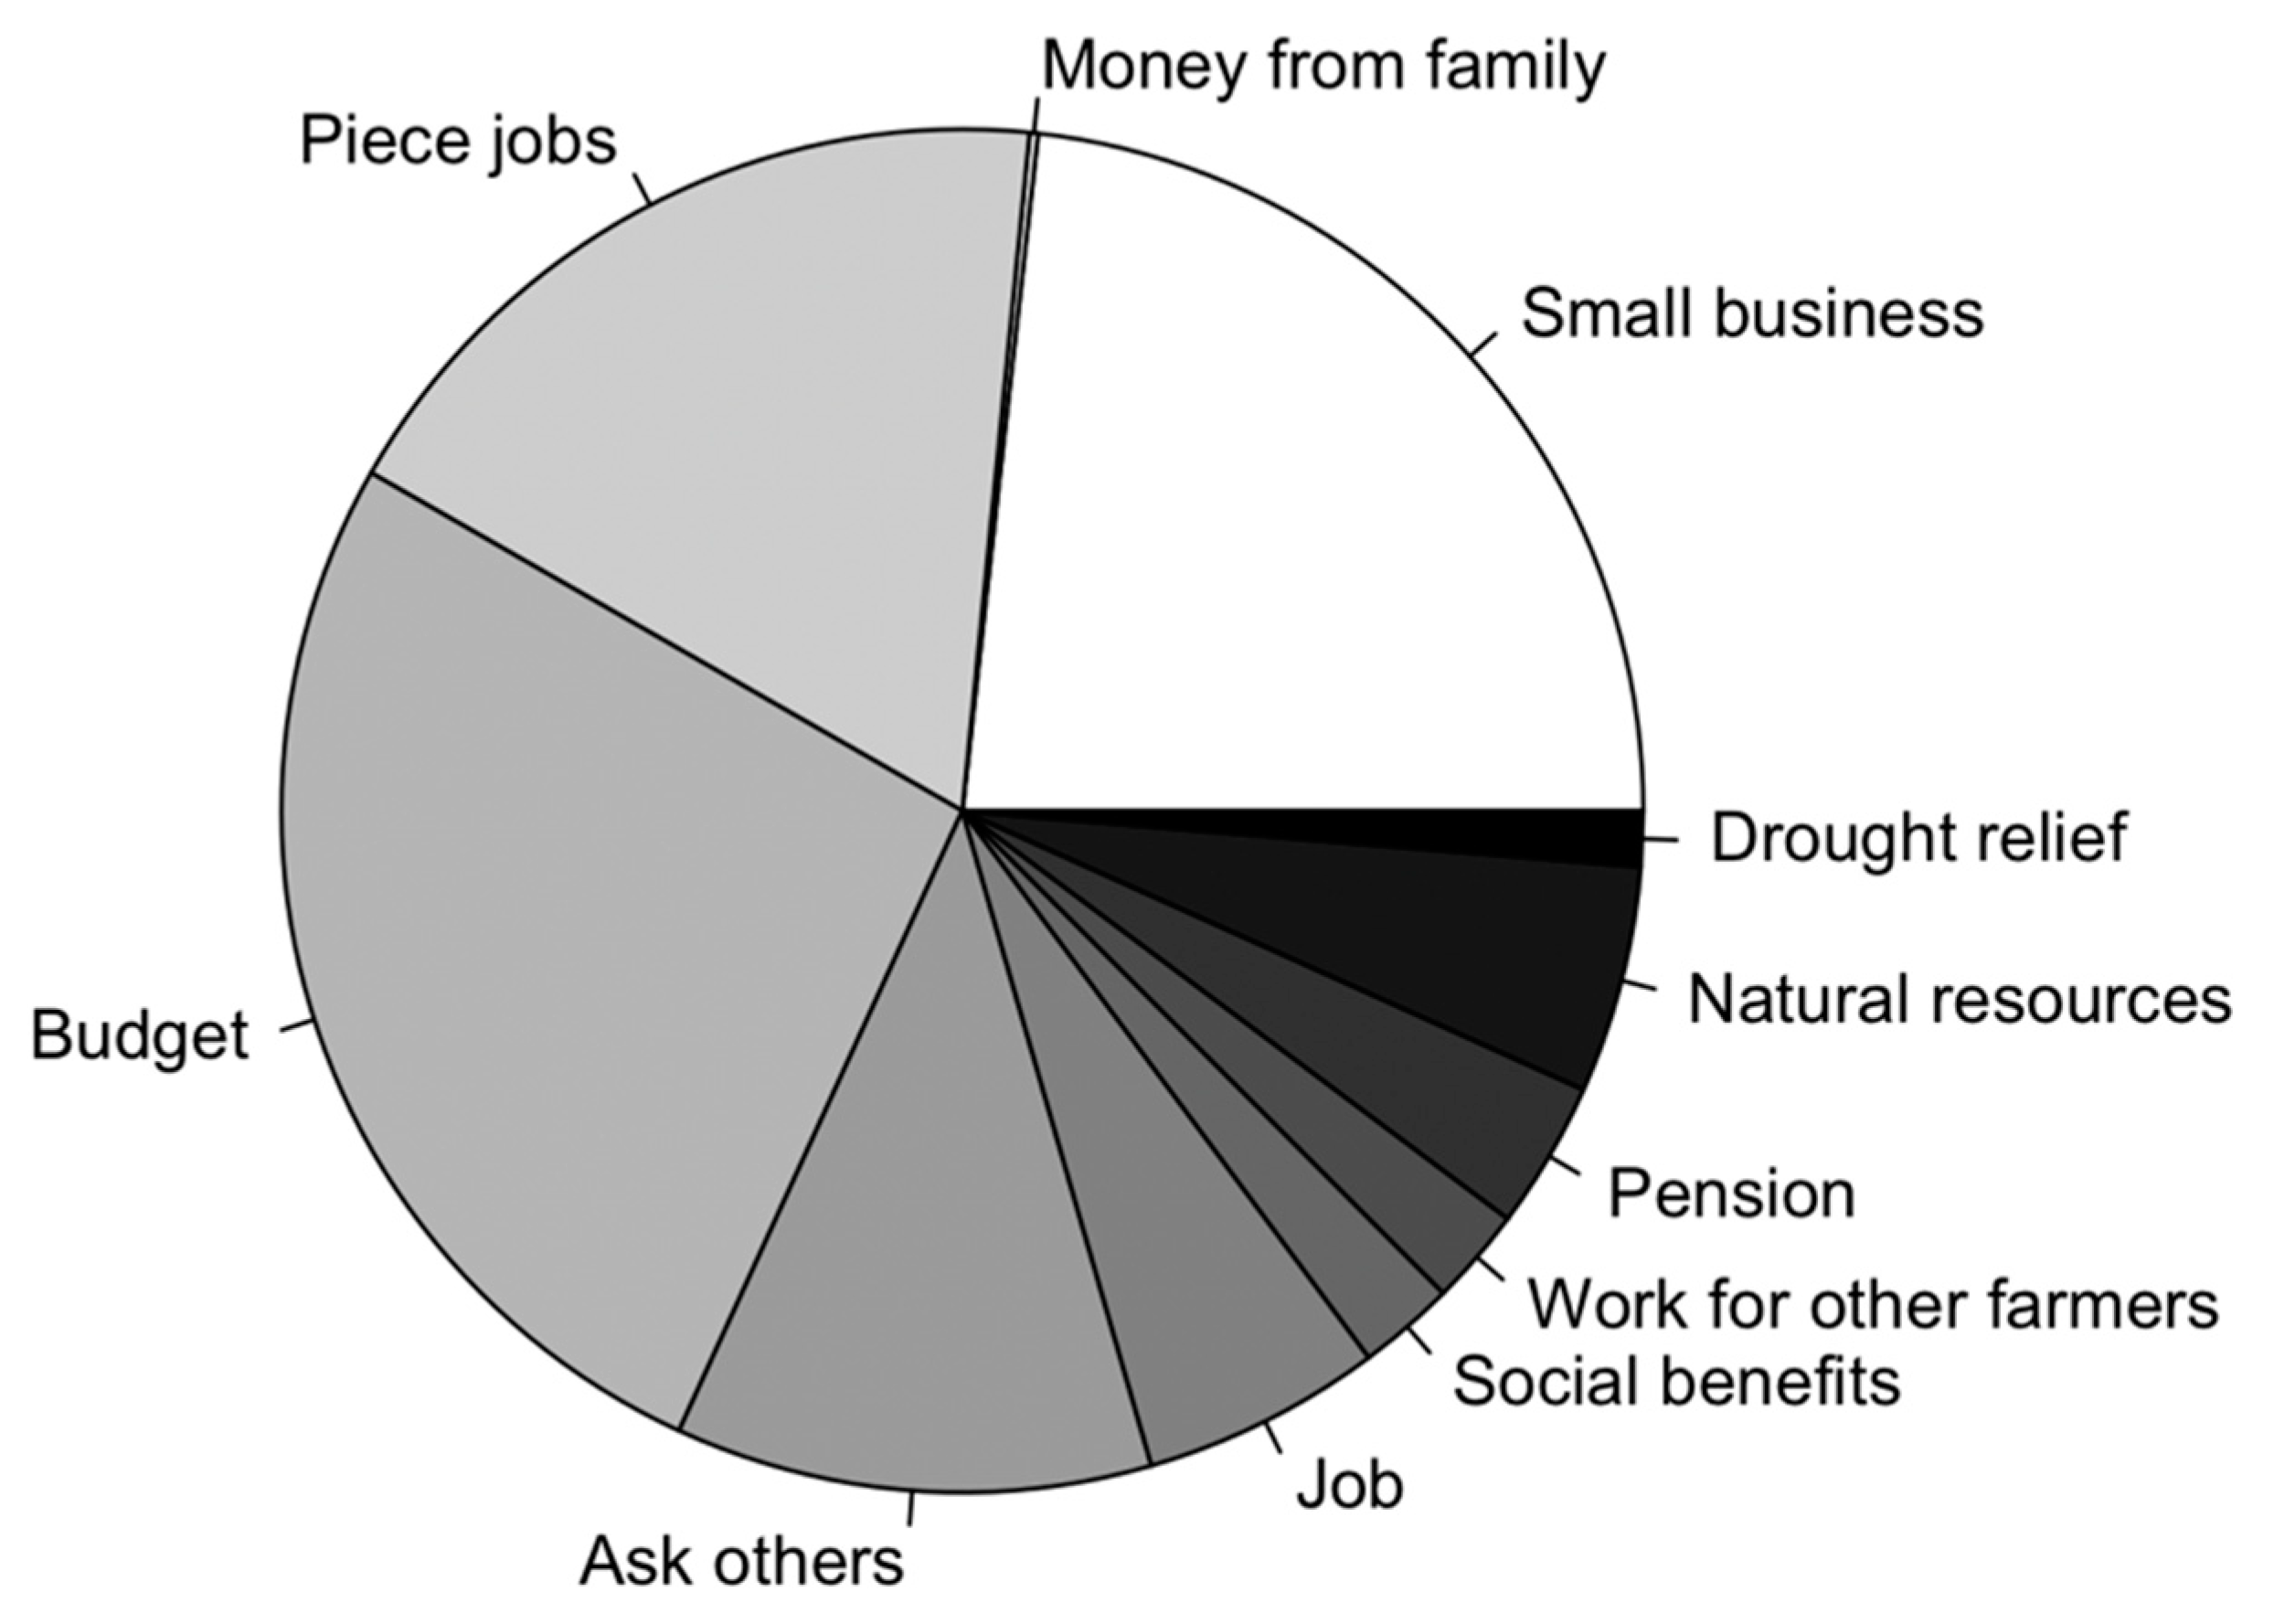
p < 0.01). The mean estimated harvest was 499 (±486) kg per field, while the mean quantity of cereal crop required for a year per respondent was 444 (±382) kg. In bad harvests, the estimated mean amount of crop produced per respondent was 213 (±199.5) kg. This indicates that on average farmers may not be able to produce enough food to support their dependants during bad harvests and are therefore vulnerable to the effects of elephant crop-raiding. Various coping strategies were identified by farmers for dealing with bad harvest years (see
Figure 5); many respondents (26.4%) indicated that the only coping strategy available to them was to eat less (budget) to ensure there is food for the year. Other popular coping strategies included establishing small businesses (e.g., selling baskets) (23.2%) or looking for piece jobs (18.3%) to be able to buy extra food.
3.6. Factors Influencing Perceived Conflict Levels
The OPM for PCL retained ethnicity of the farmer, FTE, NYR, and distance of a field to an elephant pathway (DEP) as having statistically significant effects (see
Table 3), indicating that farmers who perceive high levels of conflict dislike elephants. The ethnicity of the farmer affected the PCL, with Basarwa farmers having a higher probability of lower PCL. Farmers who had been raided more frequently in the past were more likely to have higher PCL and the location of a farmer’s field appeared to influence their PCL, with farmers closer to elephant pathways being likely to have a higher PCL. The OPM appeared to predominantly predict correct PCLs (0 on histogram) or higher PCLs than actually occurred (see
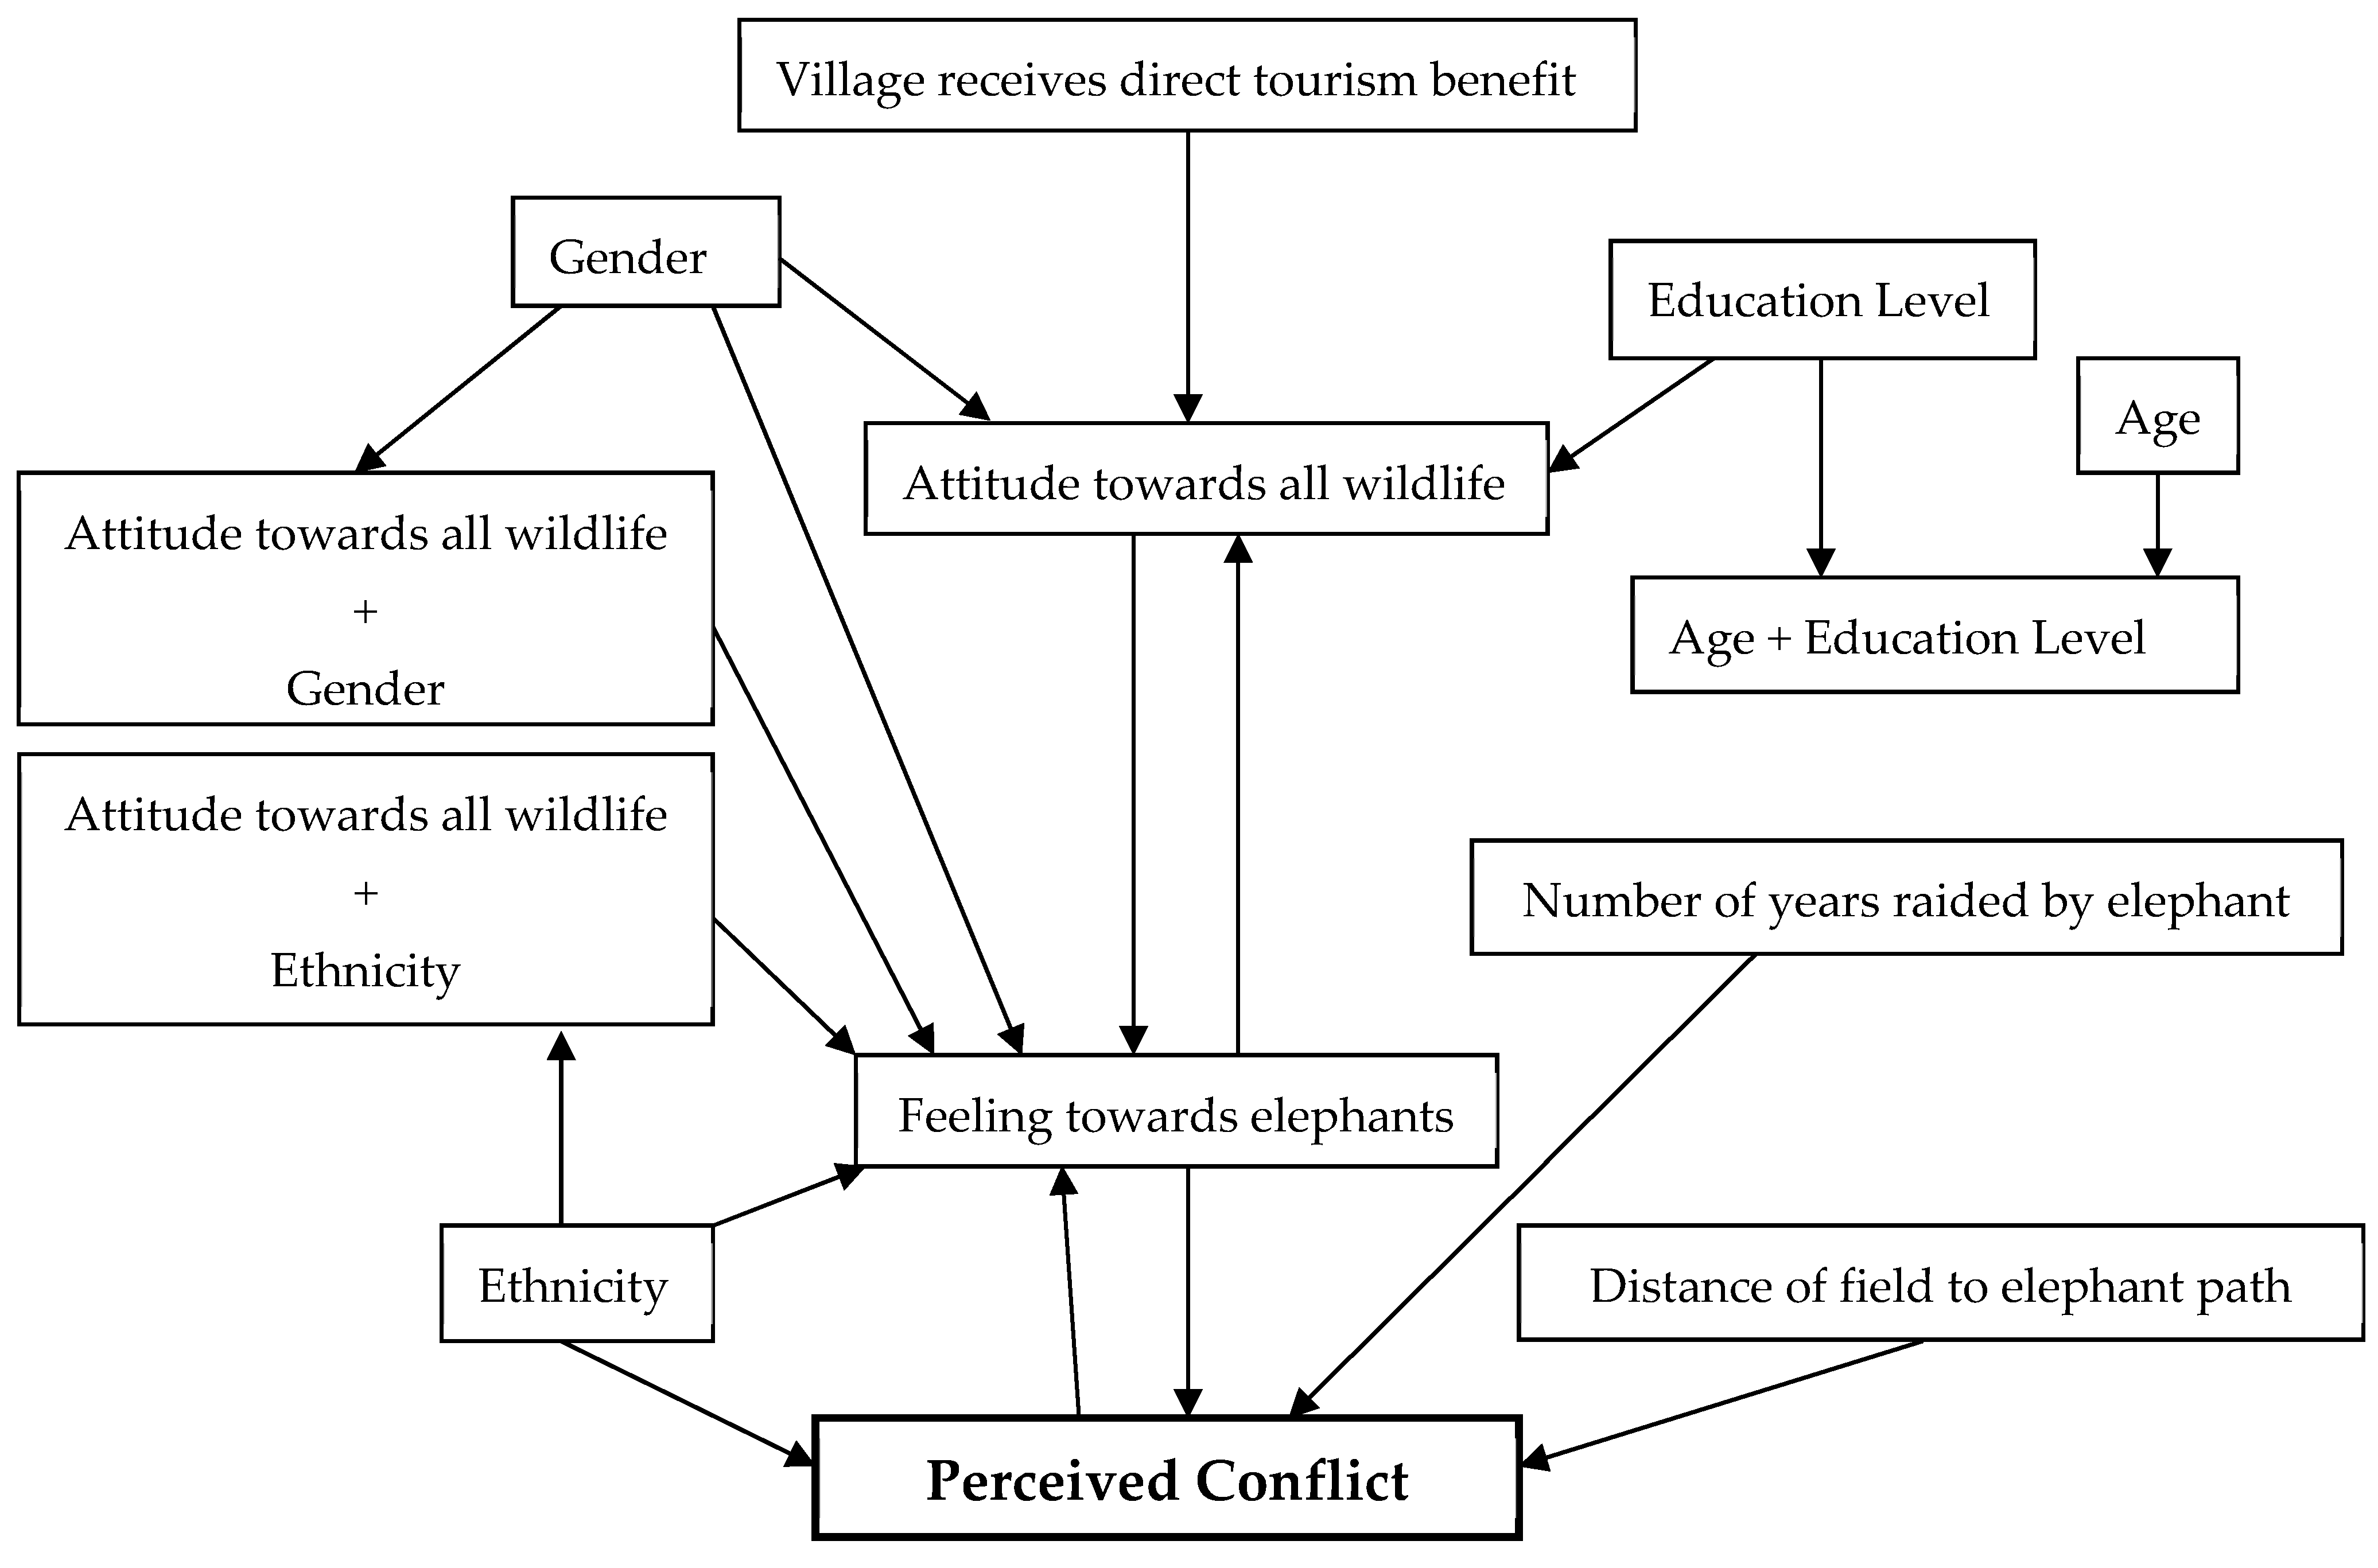
Figure 6). In summary, it is evident that a respondent’s PCL is influenced in a complicated way by a combination of factors both directly and indirectly. To illustrate the relationship between factors affecting PCLs in the ODP, a path diagram was constructed (see
Figure 7).
3.7. Addressing HEC
When respondents were asked “Do you think it is possible to reduce the problem with elephants here?”, most people (46%) replied yes, 30% replied no, and the remaining 24% were unsure. The GLM, with binomial error structure, for whether people thought there is a possible solution to reduce the problem with elephants or not (coded 1 or 0) retained the variables respondent’s education level (χ
2 = 30.4, df = 4,
p < 0.001) and whether the respondent thought elephant movement paths should be considered in land use planning (χ
2 = 6.3, df = 1,
p = 0.01) as having significant positive effects (respondents were more likely to believe in solutions if they had some form of education, or if they thought elephant paths should be considered in land use plans), See
Supplementary Table S4 for more details. The amount of damage a farmer had incurred from a recent (within the last 3 years) elephant raid (χ
2 = 7.1, df = 1,
p < 0.01) was retained as having a significant negative effect (farmers who had incurred more damage were less likely to think there was a possible solution). The opinion of respondents towards possible solutions was also affected by their preferred elephant management strategy (χ
2 = 34.8, df = 9,
p < 0.001). For example, farmers that are more likely to think there is a possible solution believe in mitigation.
The top four management strategies to reduce the problems people are experiencing with elephants were to kill some elephants (47%), move elephants away (20%), kill all elephants (16%), and mitigate crop damage (10%). Significantly more respondents believed that the government (rather than farmers) was responsible for reducing elephant crop-raiding (χ2 = 781.3, df = 1, p < 0.001); however, most people felt that farmers should be responsible for protecting their own fields from elephant raids (χ2 = 267.7, df = 1, p < 0.001).
5. Conclusions
Although the study was conducted more than a decade ago, it has value due to the ongoing mitigation work in the region. The study highlights how perceived HEC can be rated higher than actual HEC due to the complexity of numerous socio-ecological factors at play. Longitudinal research has been identified as an important component of HWC studies to understand the trends and shifts in wildlife populations and changes in human perception and attitudes [
65]. Ultimately, the level of HEC appears to be a combination of both actual elephant damage and perceived conflict; therefore, mitigation efforts need to address both aspects. If loss (actual and perceived) is matched by benefit (actual and perceived), then overall conflict can be reduced. Actual wildlife damage can be reduced through mitigation initiatives; however, improving perceived conflict levels is more difficult because they are so complex. Perceived conflict is affected by a myriad of factors including socio-demographic characteristics, cultural beliefs, socioeconomic circumstances of farmers, location of a field, crop-raiding history of a field, indirect and direct experiences with elephants, and acceptability of management options, and therefore investigations into perceptions of conflict are likely to be needed on a case-by-case basis to effectively manage HWC issues. The historical aspects of each HEC situation should also be incorporated into future studies to investigate how political and other past decisions have affected elephant human relations, livelihood opportunities, and coping strategies [
66]. While this study revealed key findings regarding perceptions of HEC, a few study limitations should be acknowledged. The principal researcher was not fluent in the local language, and therefore, translation was needed to complete questionnaires, which may have affected the interpretation of questions and answers. There is also a risk that social desirability bias may have arisen due to participant views and perceptions towards the interviewers, although the principal investigator resided in the study area for a year before interviews commenced. Further, given that surveys were conducted in one area of Botswana, results are best applied to the ODP and may vary from the experiences of people in other areas or contexts.
By gaining a greater understanding of the factors that shape attitudes towards wildlife and perceptions of conflict in the ODP, we can start to identify groups of farmers to concentrate different management strategies on, e.g., certain ethnic groups and farmers with fields close to elephant pathways. This study suggests, however, that farmers who have a higher perceived level of conflict are also likely to have negative feelings towards elephants, which may influence their adoption of mitigation techniques; i.e., people who hate elephants may be less willing to adopt passive mitigation techniques to reduce conflict. It would therefore be important to start by improving attitudes towards elephants through an education campaign before introducing the idea of passive mitigation methods or land use planning to reduce conflict levels. Encouragingly, most farmers felt they are responsible for protecting their own fields in this area; therefore, mitigation strategies that empower farmers to do so should also be a priority. Finding management strategies that provide benefits from elephants to the community, i.e., increasing tourism or wildlife-related enterprises, is also likely to be effective in reducing perceived conflict levels. A combination of different strategies and techniques (or a holistic approach) is needed to address the complexities of perceived and actual conflicts to ultimately reduce HWC.


