Abstract
The influence of landscape structure on species communities is intimately connected to the spatial scales at which measurements are made. If we do not measure landscape structure at its most impactful scale, otherwise known as the “scale of effect”, we might fail to detect crucial community–landscape relationships. In our study, we focused on the “scale of effect” as it pertains to the relationship between urban bird diversity and landscape structure. We investigated eight types of landscape structure variables alongside elevation attributes across 16 spatial scales around 28 sampling sites in Kunming, Yunnan Province, China. Our objective was to identify the most influential scale at which the environmental variables under investigation affect the taxonomic and functional diversity of bird species. We utilized PLSR and VIP scores to overcome challenges posed by multicollinearity among predictors. We found that the influence of landscape characteristics on bird species richness and functional dispersion index (FDis) was scale-dependent. Notably, the influence of the area of open water on FDis is most pronounced at smaller scales, while at larger scales, open water dispersion becomes more essential. Additionally, in a highly fragmented urban matrix, the importance of forest connectivity may exceed that of patch size at medium scales. However, the significance of forest coverage increases with scale, which underscores the importance of preservation efforts at larger scales to prevent forest fragmentation. We also noted a considerable impact from landscape-level subdivision across almost all scales. These findings highlight the importance of shifting urban conservation planning towards a multi-scale approach, which would allow for the identification of priority intervention scales.
1. Introduction
Urbanization significantly impacts avian communities in and around urban areas by causing the disappearance and deterioration of native habitats [1], amplifying edge effects [2], diminishing habitat interconnectivity [3,4,5], and exacerbating the effects of human activities and noise disruption [6]. The theory of island biogeography [7] is of great importance for understanding the dynamics of avian communities within urban landscapes. This theory suggests that larger habitat patches support more diverse species, known as the species–area relationship, while more isolated patches tend to harbor fewer species, known as the habitat–isolation relationship. Moreover, the increasingly fragmented habitats, largely caused by human activities, complicate these relationships and highlight the impact of landscape structure, which includes both composition and configuration, on urban bird diversity [8,9]. Studies indicate that the shape and area of open water habitats, along with the connectivity of urban wetlands, have been recognized as critical drivers of bird community diversity [10,11,12]. Furthermore, studies have underscored the importance of connectivity and the area of forest habitats in influencing bird diversity [13,14,15]. These findings point towards the complex, multi-scale impacts of habitat loss and fragmentation on biotic responses, highlighting the need for a multi-scale perspective in urban avian ecology [16,17].
The majority of studies investigating the relationship between urban bird diversity and landscape structure focus on a single scale [18,19] or incorporate a limited number of nested levels of hierarchy (such as patch-, local-, and landscape-scale) with different absolute sizes [20,21,22,23,24,25]. For instance, studies have evaluated the percentage of each land cover type at different spatial scales (e.g., 200 m, 1000 m, and 2500 m buffer zones from the green space) and have included these multi-scale variables in prediction models [20,23,25].
However, the influence of environmental variables on ecological communities is closely tied to the spatial scales used for measurements, which impact the strength, significance, and even direction of observed effects [26,27]. If we do not measure landscape structure at its most impactful scale, otherwise known as the “scale of effect” [17], we might fail to detect crucial community–landscape relationships. To identify these relationships between communities and landscape structure, recent studies adopt a hypothetical focal site multi-scale approach [17,26]. In this method, landscape structure is measured within nested scales (for example, 1, 2, and 3 km) of absolute size [17]. This approach allows for the determination of the “scale of effect”, ensuring comparability of metrics across scales. It has been applied to studies on primates [28], insects [29], and birds [30,31].
Though the hypothetical focal site multi-scale method has been employed in a handful of studies to investigate the multi-scale responses of avian species to landscape structure, the majority of research has predominantly focused on minimally human-disturbed forest ecosystems [30,31]. For instance, the effects of landscape variables on avian diversity in Brazilian Eucalyptus plantations were examined, revealing the negative impacts of forest fragmentation [31]. Another study explored the most appropriate spatial scale for the incidence of certain bird species in fragmented Brazilian Atlantic forests [30]. However, there is a dearth of studies regarding the “scale of effect” of bird community–landscape relationships on functional and taxonomic aspects in urban areas. Furthermore, there is a need for more discussion on landscape structure at the configuration aspect (such as dispersion, subdivision, and isolation) rather than merely at the composition aspect. Understanding these elements of dynamic, complex urban landscapes could enhance our comprehension of urban ecology and inform effective biodiversity conservation strategies.
In this study, by analyzing data from 28 sampling sites in the city of Kunming at 16 different spatial scales, we aimed to gain insights into the relationships between landscape structure, elevation attributes, and bird diversity (both taxonomic and functional) as they vary across different spatial scales. The study utilized variable importance in projection (VIP) scores, which are based on partial least squares regression (PLSR), to quantify the significance of each predictor variable in our model, incorporating both its effect and reliability. This approach effectively overcomes the limitations posed by multicollinearity among predictors. Our objective was to identify the “scale of effect”, which refers to the most influential scale at which the environmental variables being investigated impact the taxonomic and functional diversity of bird species. This multi-scale approach provides a comprehensive understanding of biodiversity and aids in identifying the conservation actions that have the greatest impact at various scales.
2. Materials and Methods
2.1. Study Sites
We carried out this study in the city of Kunming (24°53′ N, 102°42′ E), which is the capital of Yunnan Province in southwestern China. Yunnan is recognized for its unique geographical attributes, including the Yunnan–Guizhou Plateau and Hengduan Mountains, which support diverse ecosystems with over 60% of China’s bird species richness [32,33]. Kunming is Yunnan’s largest city, covering 21,013 square kilometers, housing 8.5 million people, and having an elevation ranging from 1500 to 2800 m [34]. Kunming’s principal vegetation consists mostly of subtropical evergreen broadleaf forests and coniferous–broadleaf mixed forests [34]. Moreover, human activities have resulted in the predominance of human-made forests, secondary forests, and secondary shrub forests in the main city and surrounding areas. Surrounded by mountains, the expansion of the city primarily occurs around Dian Lake, a plateau freshwater lake, with growth radiating from the northern old city area to the eastern and southern new city regions, eventually extending to the farmland-dominated southern areas. For our study, we selected 28 sampling sites across a variety of urban green spaces in both new and old city districts (Figure 1).
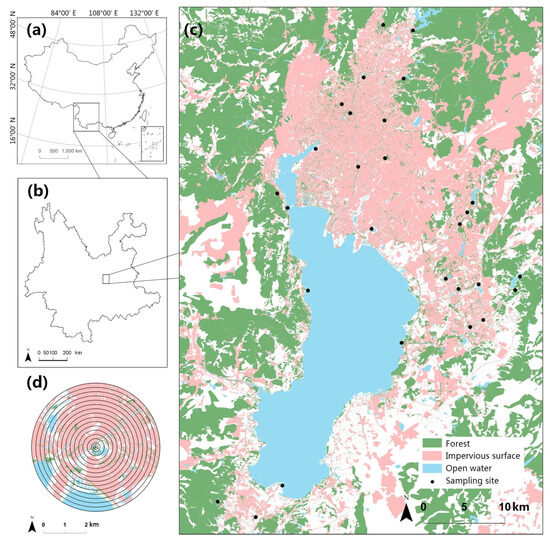
Figure 1.
(a) Yunnan province in southwest China. (b) The study area is situated in the central region of Yunnan. (c) The 28 sampling sites are distributed across the research region, comprising green spaces in both new and old city districts. (d) Buffer zones were established around each sampling site, with radii ranging from 100 to 3000 m, providing a total of 16 different scales for assessing landscape properties.
2.2. Bird Survey
From March 2021 to February 2022, we carried out regular bird surveys on a monthly basis, spanning both the breeding and non-breeding seasons. Each site was visited 12 times, with an approximately 30-day interval between successive visits. The surveys were conducted by two trained and expert bird survey observers during peak bird activity periods, from 7:00 to 10:00 and from 15:00 to 18:00, excluding days with severe weather conditions. We detected and counted birds within a 100 m radius in 10 min using the point count method [35]. The species nomenclature in this study adheres to the BirdLife taxonomic checklist version 7.0 [36]. The sampling sites were positioned 1500–6000 m apart to ensure data independence across locations.
2.3. Functional Diversity
We extracted three functional trait characteristics—body mass, diet, and foraging strata—from the EltonTraits database [37] to evaluate functional diversity. In the EltonTraits database, the diet and foraging strata data are organized into 10 and 7 categories, respectively, each expressed as a percentage. It breaks down the diet into percentages of fruit, seeds, nectar, other plants, invertebrates, reptiles, fish, birds, vertebrates in general, and scavenged items. In the same manner, it displays the foraging strata data, indicating the time distribution spent in the aerial, canopy, mid-high, understory, ground strata, and around or below the water surface [37]. Given that the total percentage for each species sums to 100%, it implies that the percentage values within these 10 food categories and 7 foraging strata are non-independent variables. To deal with this inherent interrelation and to condense these multi-dimensional data, we executed two separate principal component analyses (PCAs), one for diet and another for foraging strata during the breeding season, as well as two separate PCAs for diet and foraging strata during the non-breeding season [38]. We retained the first axis of each analysis, using it to depict these functional traits. We then standardized the three traits—diet, foraging strata, and body mass—and used these standardized values to create a trait matrix [38]. Functional diversity was measured using the functional dispersion index (FDis), which represents the average deviation of each species from the centroid of all species present within a given community [39]. We used the function “dbFD” from the “FD” package [39] in R 4.1.0 [40].
2.4. Evaluating Landscape Metrics at Multiple Scales
In our research, we established buffers—circular areas encompassing each sampling site—to assess the landscape structure and evaluation attributes. We first used a 100 m radius buffer, which has been frequently utilized in previous avian–landscape relationship studies [41,42]. Beyond this, we implemented a systematic progression of buffers, commencing at 200 m and incrementing by 200 m up to a ceiling of 3000 m. This process led to a total of 16 scales. To ensure that metrics were comparable across scales, we evaluated the same landscape characteristics at each scale. We utilized Google Earth Pro to access high-resolution satellite imagery, a resource widely used in previous research [14,21,43]. We also obtained elevation data from the Shuttle Radar Topography Mission (SRTM; [44]). Utilizing ArcGIS 10.0 [45], we extracted land-use data within a 3000 m radius around each sampling site and calculated five elevation indicators within each of the 16 buffers (detailed in Table 1).
The land-use classification comprised seven categories: (1) constructed land (impervious areas; municipal roads not included), (2) forest, (3) open green space (lawn, weed-dominated patch), (4) open water, (5) aquatic plant, (6) agricultural land, and (7) road (municipal roads). We applied the FRAGSTATS 2.4 software [46] to calculate eight types of landscape metrics indicative of both composition and configuration: area, edge, shape, dispersion, interspersion, subdivision, isolation, and diversity. We incorporated a total of 16 landscape-level metrics, 16 class-level metrics for each land-use category, and 5 elevation indices within the 16 distinct buffer sizes. Table 1 lists all of the metrics used in our study, with their detailed descriptions and methodological specifics following the approach presented in the reference [47].

Table 1.
A list of the 16 landscape-level metrics and 16 class-level metrics for each land-use category, as well as the five elevation indices within the 16 distinct buffer sizes. Their detailed descriptions and methodological specifics follow the approach presented in the reference [47]. The term “CL” represents Class Level, and “LL” refers to Landscape Level.
| Type | Metric Acronym | Metric Name | Level |
|---|---|---|---|
| Area | PLAND | Percentage of landscape | CL |
| LPI | Largest patch index | CL/LL | |
| Edge | ED | Edge density | CL/LL |
| Shape | PAFRAC | Perimeter–area fractal dimension | CL/LL |
| Dispersion | PLADJ | Percentage of like adjacencies | CL/LL |
| AI | Aggregation index | CL/LL | |
| CLUMPY | Clumpiness index | CL | |
| COHESION | Patch cohesion index | CL/LL | |
| Interspersion | IJI | Interspersion and juxtaposition index | CL/LL |
| Subdivision | PD | Patch density | CL/LL |
| DIVISION | Landscape division index | CL/LL | |
| SPLIT | Splitting index | CL/LL | |
| AREA_MN | Mean of patch area | CL/LL | |
| AREA_AM | Area-weighted mean of patch area | CL/LL | |
| Isolation | ENN_MN | Mean of Euclidean nearest-neighbor distance | CL/LL |
| ENN_AM | Area-weighted mean of Euclidean nearest-neighbor distance | CL/LL | |
| Diversity | RPR | Relative patch richness | LL |
| SHDI | Shannon’s diversity index | LL | |
| Altitude | Altitude_MEAN | Mean of altitude | LL |
| Altitude_RANGE | Range of altitude | LL | |
| Altitude_STD | Standard deviation of altitude | LL | |
| Altitude_MAX | Maximum altitude | LL | |
| Altitude_MIN | Minimum altitude | LL |
2.5. Statistical Analysis
A total of 12 surveys were conducted at each sampling site, and the data were segmented into breeding (March to August 2021) and non-breeding seasons (September 2021 to February 2022). This categorization allowed us to evaluate the bird species richness and FDis of each period throughout the year [48,49]. We used 16 landscape-level metrics, 16 class-level metrics per land-use category, and 5 elevation indices within the 16 buffer sizes as independent variables.
Since some land-use categories were not present at all sampling sites, certain metrics were missing. To enable cross-scale comparison, we used the “pca.mvreplace” function in the “mdatools” package [50] in R 4.1.0 [40] to handle missing values. This function approximates missing values in a data matrix through iterative PCA decomposition. We applied “pca.mvreplace” to columns with no more than three missing values, and we discarded columns with more than three missing values. This process ultimately yielded a total of 1523 independent variables.
In this case, where the number of explanatory variables exceeded the number of sampling sites, we adopted an approach by utilizing partial least squares regression (PLSR) to selectively identify key predictors before conducting multiple regression analysis. The primary principle of PLSR is to establish a linear regression model by projecting the predicted variables and the observable variables to a new space [51]. PLSR is a powerful method for analyzing data with multicollinearity issues [52], and it is utilized extensively in a variety of areas, including chemometrics, bioinformatics, and signal processing [52,53]. We applied PLSR using R 4.1.0 [40] and the “mdatools” package [50].
In further steps, the importance of predictors in our model was gauged through the variable importance in projection (VIP), which was calculated using PLSR. VIP scores provide a measure of the importance of predictors, incorporating both their effect and reliability, and are comparable across the different predictor variables in the PLSR model [54]. Any VIP score exceeding 1 was considered to make a substantial contribution to the prediction model [54]. This method is widely used in exploratory analyses [53,55], as it allows researchers to rank the importance of the predictors and identify the ones that are most likely to be meaningful. To calculate these VIP scores, we utilized the “vipscores” function in the “mdatools” package [50] in R 4.1.0 [40].
To mitigate multicollinearity, we selected the environmental variables from each land-use category or landscape level in each metric type across the 16 scales, with the highest VIP score as a candidate. This meant that each type of metric for each land cover type or landscape level was represented by only one scale. We set the VIP score threshold at 1.6 for richness in the breeding season and 1.7 for richness in the non-breeding season, as well as for FDis in both breeding and non-breeding seasons. Predictors with a variation inflation factor (VIF) greater than 10 were excluded to avoid multicollinearity, and we confined the number of predictor variables in any given model to no more than three to prevent overfitting [56]. Subsequently, we used generalized linear models (GLMs) with a Gaussian family to explore the relationship between these selected predictors and response variables (i.e., bird species richness and FDis). We ensured the validity of our parametric models by checking for outliers and the normal distribution of the data.
We implemented a model selection approach based on Akaike’s Information Criterion corrected for small samples (AICc) [57]. These models were compared using the ∆AICc (the difference in AICc value between a given candidate model and the minimum AICc), with those showing ∆AICc < 2 selected as the top-ranked model set [57]. Finally, we performed model averaging on the top-ranked model set. The selection and averaging of GLMs were conducted with R 4.1.0 [40], using the “MuMIn” package [58].
3. Results
3.1. Bird Species Diversity
During both the breeding and non-breeding seasons, we carried out a total of twelve replicated surveys at 28 sampling sites. This approach allowed us to gather comprehensive data across various locations and seasons. In total, we recorded 132 bird species from 44 families and 15 orders, for a total of 5386 counts (see Table S1). During the breeding season, bird species richness per sampling site ranged from 6 to 29, with a mean of 15.1 (s.e. = ±1.2), and FDis ranged from 0.77 to 1.88, with a mean of 1.14 (s.e. = ±0.05). In contrast, during the non-breeding season, species richness ranged from 6 to 34, with a mean of 17.3 (s.e. = ±1.5), and FDis ranged from 0.74 to 1.57, with a mean of 1.11 (s.e. = ±0.05). We conducted a spatial autocorrelation analysis using Moran’s I and found that neither species richness nor FDis exhibited significant spatial autocorrelation (richness during the breeding season p = 0.057; richness during the non-breeding season p = 0.144; FDis during the breeding season p = 0.538; FDis during the non-breeding season p = 0.955).
During the breeding season, the first principal component explained 56.83% of the total variance in diet and 44.48% in foraging strata (Figure S1). During the non-breeding season, it explained 48.25% and 43.96%, respectively (Figure S2). Each bird species was also assigned to one of five dominant diet categories based on the summed scores of the constituent individual diets. Our results revealed that the majority of diet categories of bird species were assigned to invertebrates (76 species, 57.58%), followed by omnivores (21 species, 15.91%), plants and seeds (15 species, 11.36%), vertebrates, fish, and carrion (15 species, 11.36%), and finally, fruits and nectar (5 species, 3.79%). The dominant diets and foraging strata of the most common 30 bird species from our survey can be found in Table 2.
Table 2.
Migratory status, dominant diets, foraging strata, and total count for the 30 most commonly observed bird species during the survey period. The migratory status of each bird species is presented as R for resident, S for summer migrant, W for winter migrant, and P for passage. Additionally, based on the summed scores of individual diets, each bird species is categorized into one of five dominant diet categories: IVB for invertebrates; OMN for omnivores; PLS for plants and seeds; VFC for vertebrates, fish, and carrion; and FN for fruits and nectar. Furthermore, the for-aging strata data reveal the time distribution across various layers: aerial, canopy, mid-high, understory, ground, and areas around or below the water surface.
3.2. Analyzing Species Diversity and Multiscale Landscape Metrics Relationships Using PLSR
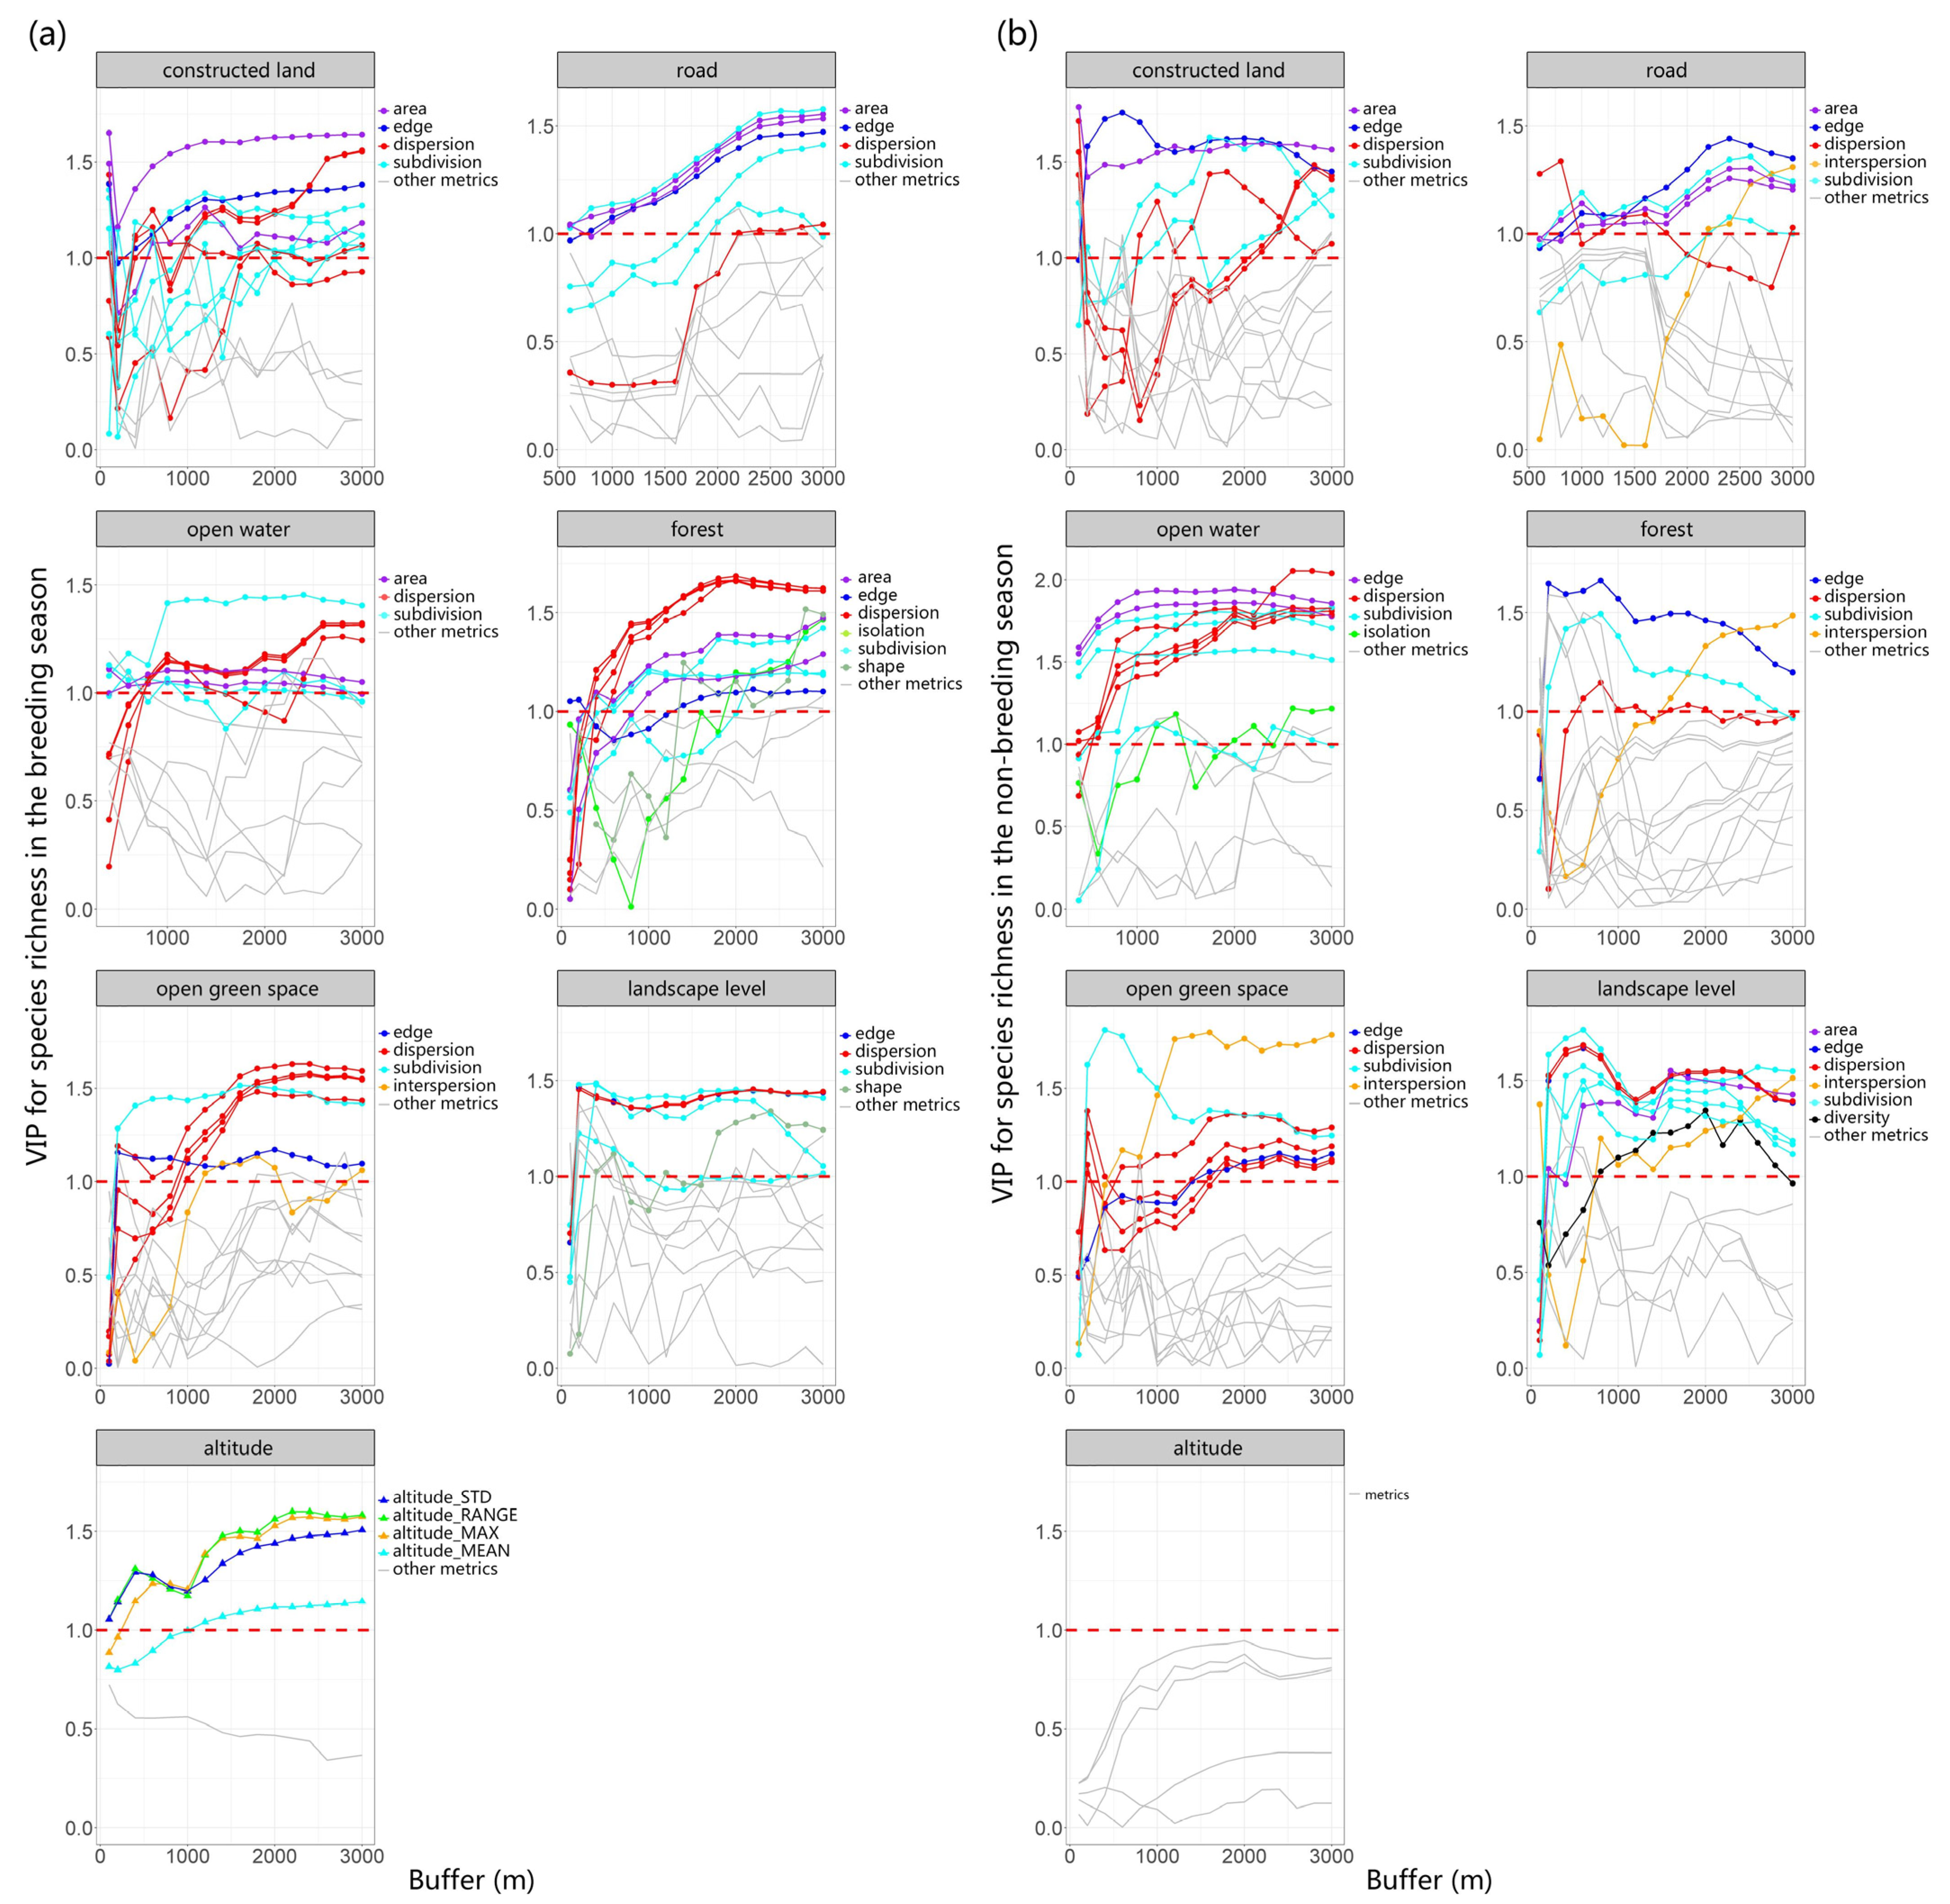
We utilized PLSR to investigate the relationship between multiscale landscape metrics (explanatory variables) and richness as well as FDis (response variables). The first components derived from the analysis explained 62.54% of the variation in richness during the breeding season, 44.91% of the variation in richness during the non-breeding season, 36.92% of the variation in FDis during the breeding season, and 43.46% of the variation in FDis during the non-breeding season. To provide a clearer understanding of the scale-dependent effect of these metrics on bird richness and FDis, we analyzed the changes in the VIP scores of multiple types of landscape metrics (including area, edge, shape, dispersion, subdivision, interspersion, isolation, and diversity) of different land-use types with varying buffer sizes (Figure 2 and Figure 3).
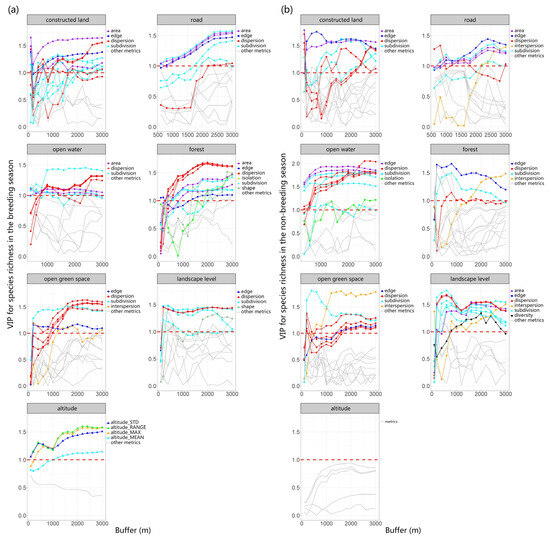
Figure 2.
Using PLSR, we evaluated bird richness as a response variable and multiscale landscape metrics as explanatory variables during both breeding (a) and non-breeding seasons (b). We examined the changes in VIP scores across multiple types of landscape metrics for different land-use types across varying buffer sizes, finding that with alterations in the scale of buffer zones, the VIP scores for certain metrics also varied. This indicates a scale dependency in the strength of the correlation between landscape parameters and species richness. The threshold value of 1 was depicted in the graph using red dotted lines.
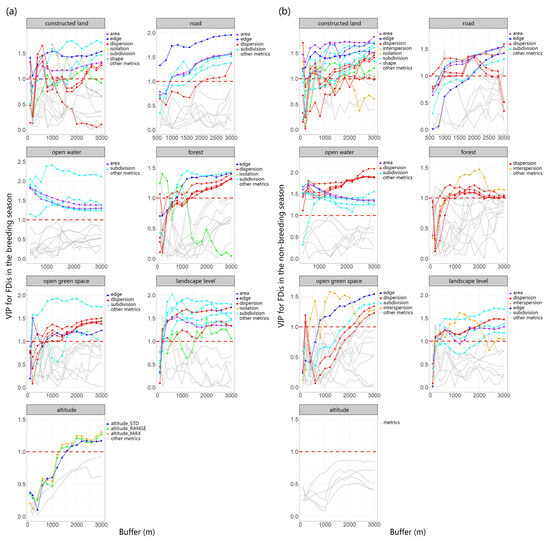
Figure 3.
Using PLSR, we evaluated FDis as a response variable and multiscale landscape metrics as explanatory variables during both breeding (a) and non-breeding seasons (b). We examined the changes in VIP scores across multiple types of landscape metrics for different land-use types across varying buffer sizes, finding that with alterations in the scale of buffer zones, the VIP scores for certain metrics also varied. This indicates a scale dependency in the strength of the correlation between landscape parameters and species FDis. The threshold value of 1 was depicted in the graph using red dotted lines.
The area and edge of constructed land play a crucial role in species richness and FDis, and their VIP scores remain relatively stable across different buffer areas. As spatial scale increases, the subdivision and dispersion of constructed land gradually become more important. The area, edge, and subdivision of roads exert a substantial influence on both richness and FDis, and this influence grows stronger with increasing scale. Notably, the dispersion of roads has a more pronounced effect on FDis (VIP > 1) compared to richness.
The dispersion and area of open water mainly influence species richness and FDis. The influence of open water’s area on FDis diminishes as the spatial scale expands, while its effect on richness remains stable. Therefore, the “scale of effect” of open water area for FDis likely occurs at small and medium scales, while the “scale of effect” of open water dispersion is most likely at scales greater than or equal to a 3000 m buffer.
Both richness and FDis are significantly impacted by several attributes of the forest, including edge, dispersion, subdivision, area, and interspersion. Similarly, the dispersion, subdivision, and interspersion of open green space also significantly impact both richness and FDis, with the significance of dispersion increasing as the spatial scale enlarges. Elevation has a pronounced effect on species richness and FDis during the breeding season, but this influence is not significant in the non-breeding season. In both breeding and non-breeding seasons, dispersion and subdivision at the landscape level are crucial factors influencing species richness and FDis. Among these, subdivision exerts a notably stronger effect on FDis. Therefore, reducing landscape-level subdivision is indispensable for safeguarding species richness and functional diversity across an urban matrix.
3.3. Analyzing Species Diversity and Multiscale Landscape Metrics Relationships Using GLMs
We used PLSR and VIP approaches to identify potential explanatory variables for bird richness and FDis during both breeding and non-breeding seasons. For the breeding and non-breeding seasons, these analyses resulted in a total of 712, 607, 606, and 659 variables, respectively, each with a VIP value greater than 1. To mitigate multicollinearity, we selected the highest VIP score from environmental variables in each land-use category or landscape level across the 16 scales. This approach ensured that each type of metric for every land cover type or landscape level was represented solely by one scale. We set the VIP score threshold at 1.6 for richness in the breeding season and 1.7 for richness in the non-breeding season, as well as for FDis in both breeding and non-breeding seasons. Further, we removed the explanatory variables with a VIF ≥ 10 to avoid multicollinearity. Ultimately, this process generated four and nine explanatory variables of interest for richness in breeding and non-breeding seasons, respectively, and eight and five explanatory variables of interest for FDis in breeding and non-breeding seasons. Then, we fitted separate GLMs with a Gaussian family for richness and FDis. By applying the criteria that the count of independent variables ≤ 3 and ΔAICc < 2, we identified three and six top-ranked models for richness in breeding and non-breeding seasons (Tables S2 and S3) and five and four top-ranked models for FDis in breeding and non-breeding seasons (Tables S4 and S5), respectively.
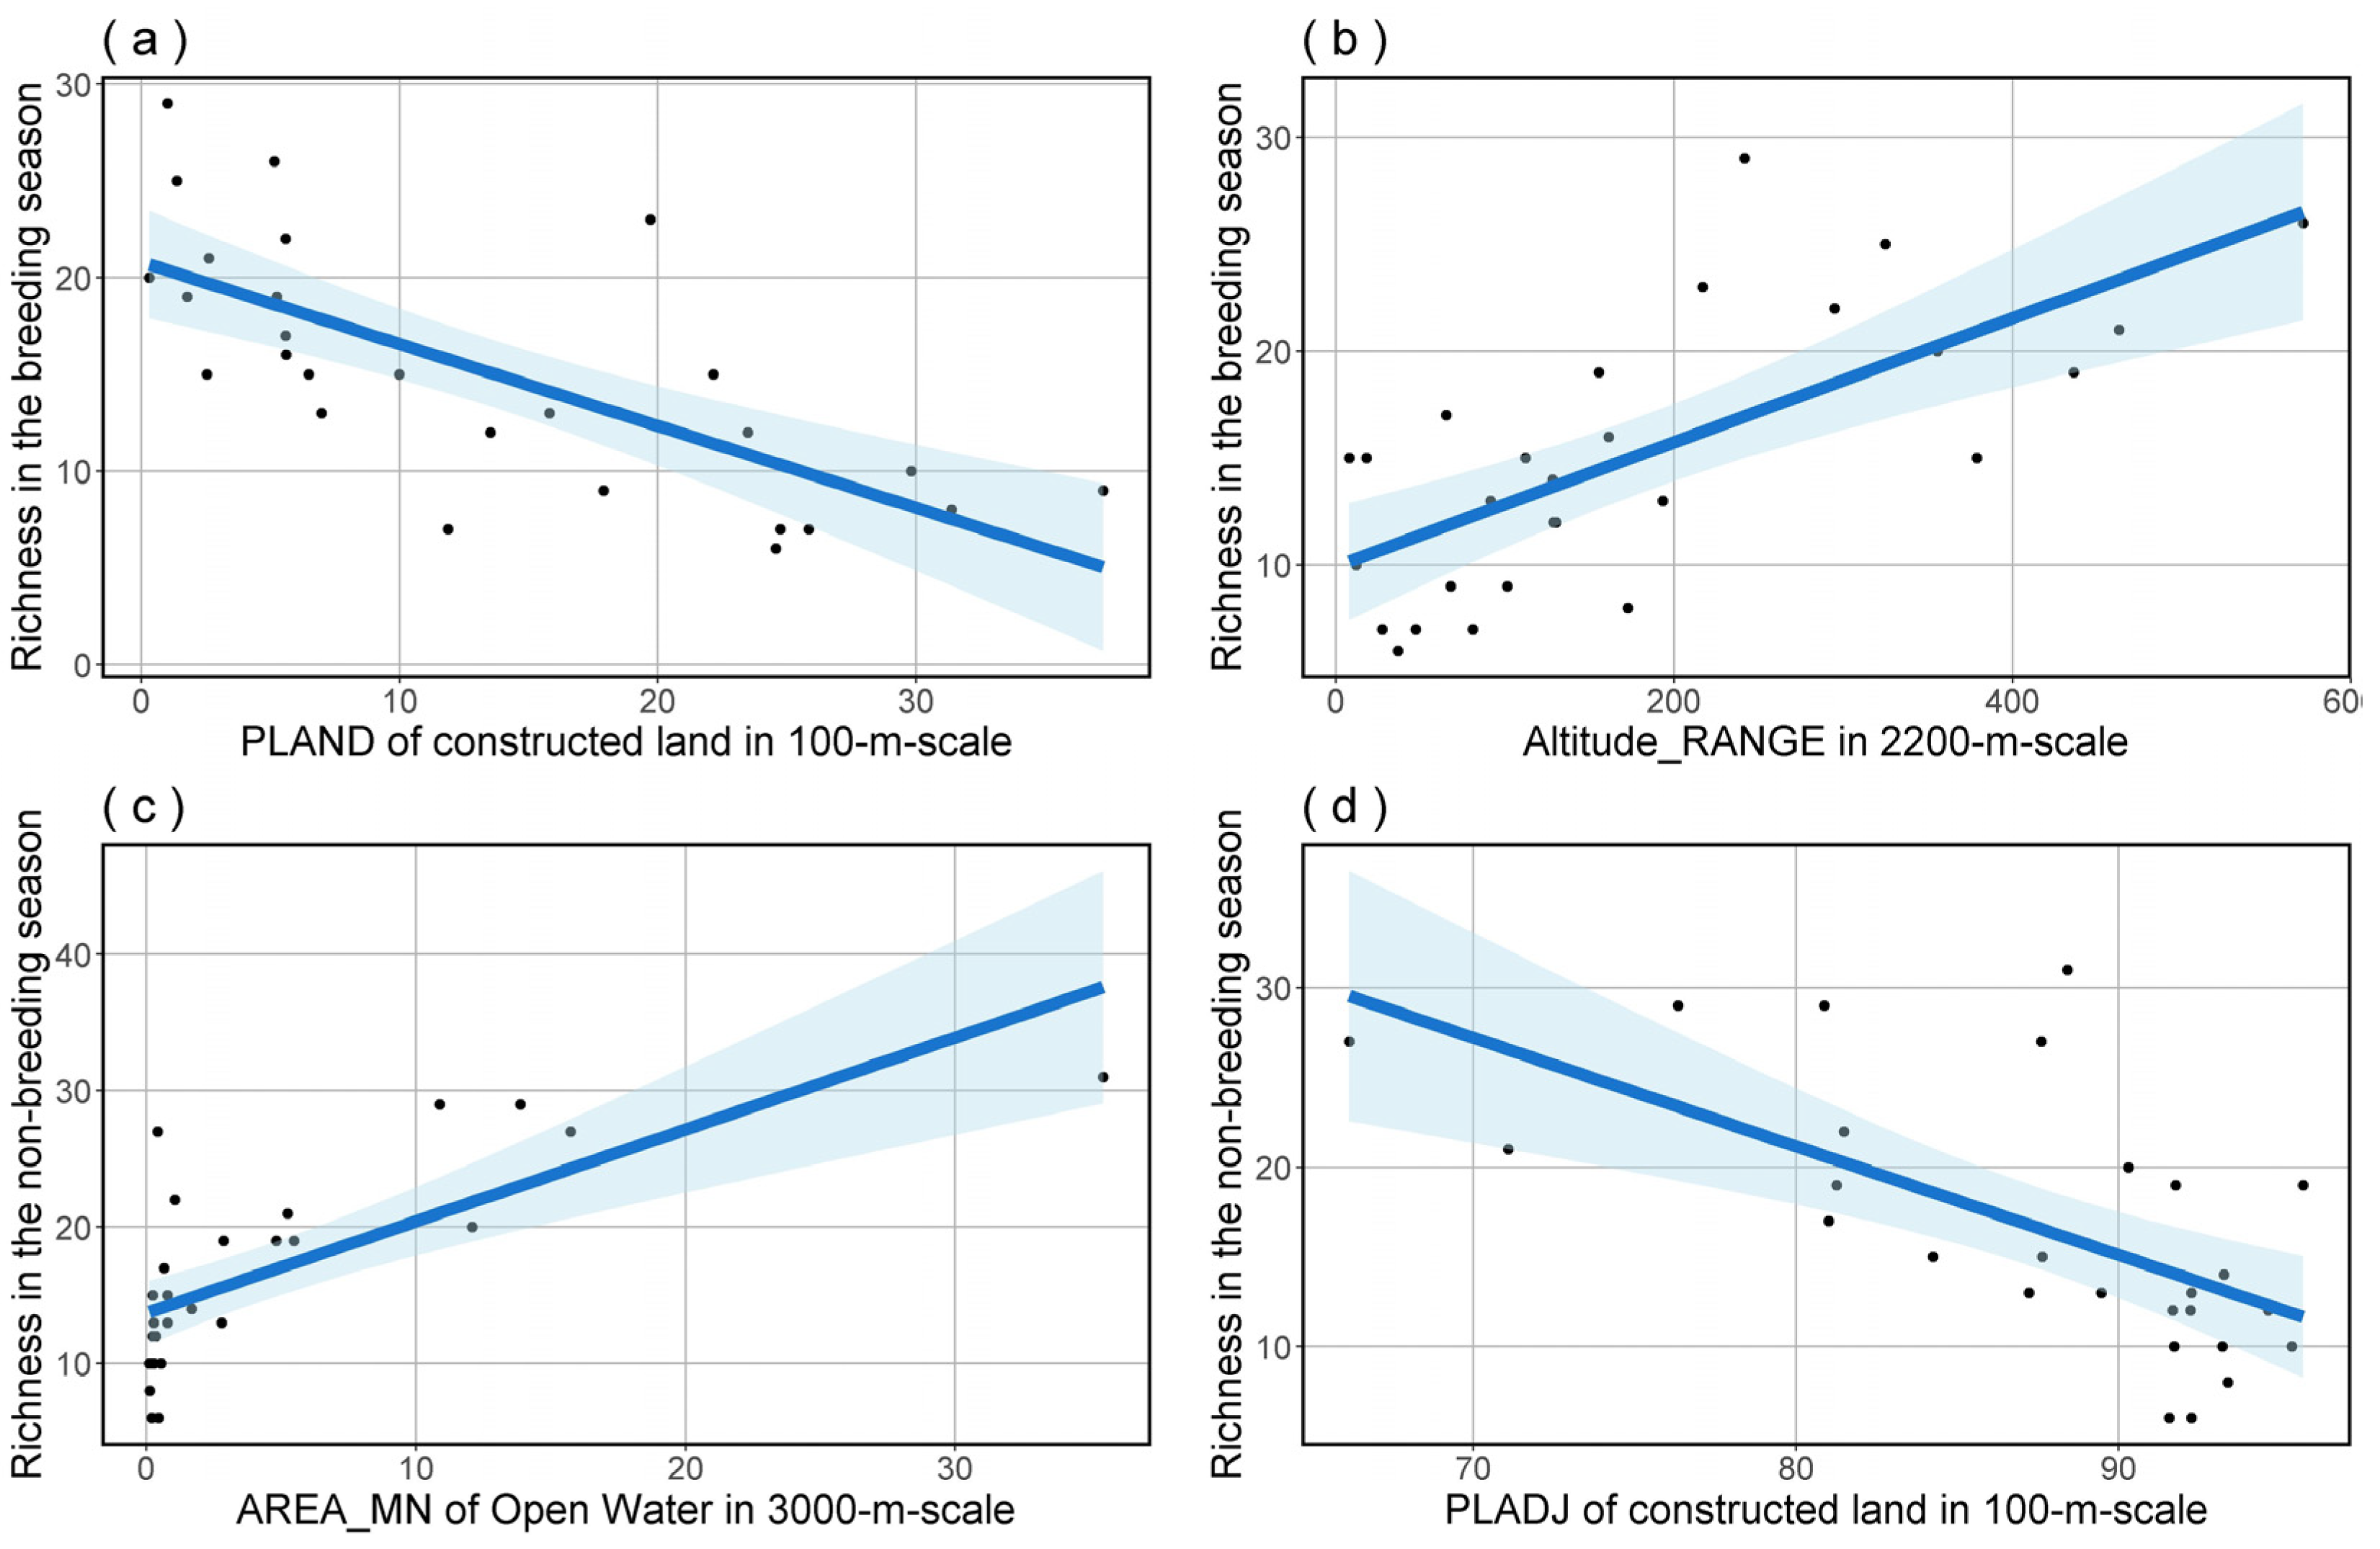
To further refine our analysis, we performed model averaging on the top-ranked model set for bird species richness and FDis in both breeding and non-breeding seasons. The outcomes indicated that bird species richness was significantly influenced by PLAND of constructed land at a 100 m scale and Altitude_RANGE at a 2200 m scale in the breeding season (Table 3 and Figure 4), as well as by PLADJ of constructed land at a 100 m scale and AREA_MN of Open Water at a 3000 m scale in the non-breeding season (Table 4 and Figure 4). The outcomes of model averaging also indicated that bird species FDis was significantly influenced by AREA_MN of open water at a 1200 m scale and ENN_MN in landscape level at a 200 m scale during the breeding season (Table 5 and Figure 5), and by COHESION of constructed land at a 100 m scale and COHESION of open water at a 3000 m scale during the non-breeding season (Table 6 and Figure 5).
Table 3.
The results of the model averaging approach applied to richness during the breeding season based on the top-ranked models, as indicated in Table S2.
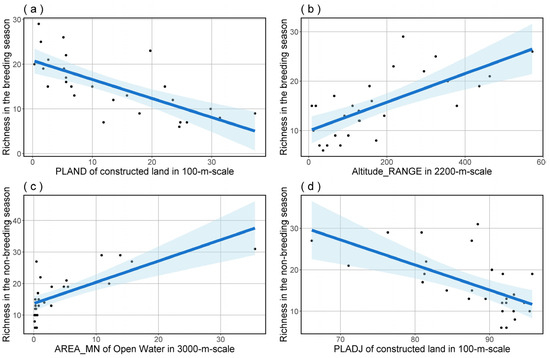
Figure 4.
The predictions for bird species richness in both breeding (a,b) and non-breeding (c,d) seasons, based on model averaging, show the effects of significant predictors. The blue shading delineates the 95% confidence interval for the regression analysis.
Table 4.
The results of the model averaging approach applied to richness during the non-breeding season based on the top-ranked models, as indicated in Table S3.
Table 5.
The results of the model averaging approach applied to FDis during the breeding season based on the top-ranked models, as indicated in Table S4.
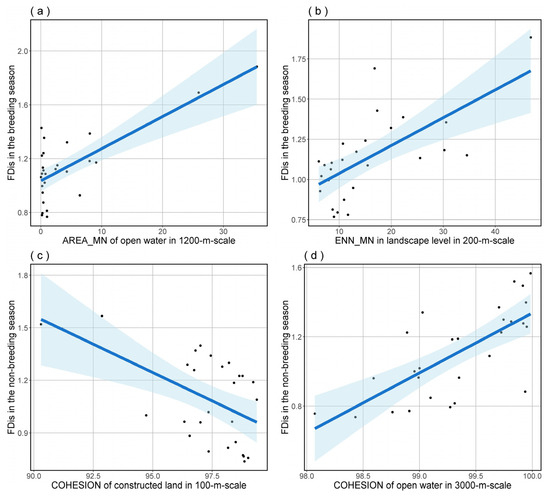
Figure 5.
The predictions for bird species FDis in both breeding (a,b) and non-breeding (c,d) seasons, based on model averaging, show the effects of significant predictors. The blue shading delineates the 95% confidence interval for the regression analysis.
Table 6.
The results of the model averaging approach applied to FDis during the non-breeding season based on the top-ranked models, as indicated in Table S5.
4. Discussion
Our study underlines the significant relationship between bird species richness, FDis, and multi-scale landscape metrics. The link between bird species diversity and landscape structure is scale-dependent. We recognize that the patterns and dynamics linking bird diversity to landscape structure can vary across different spatial scales. Notably, no single buffer size applies universally to all indicators, as illustrated in Figure 2 and Figure 3. Various ecological processes operate at different spatial scales, resulting in the observed variation in species responses [26,28,29]. Urban landscapes are characterized by high levels of heterogeneity, disturbance, complexity, and dynamism. These factors operate across multiple scales, with community responses intricately linked to both the composition and configuration of landscapes across a variety of scales [17,26].
In our study, bird species richness appears to be significantly influenced by the dispersion of open water, with its influence increasing as the scale expands. This implies that the “scale of effect” of open water dispersion on species richness is likely above 3 km. Interestingly, as the scale increases, the influence of area on the FDis diminishes, while its effect on species richness remains comparatively stable. Thus, for FDis, the area of open water assumes greater significance at small to medium scales. Accordingly, the “scale of effect” of open water area metrics on bird FDis in this study is likely to be at medium and small scales (<1 km buffer zones). Several studies underscore the importance of water coverage and connectivity in affecting avian diversity [4,43,59,60]. Additional research indicates the influence of the area of open water on bird community structure [61,62,63]. Our findings reinforce these relationships, illustrating how the interplay between open water parameters and spatial scales shapes bird species richness and functional diversity in our study area.
Both the richness of species and the FDis are notably influenced by forest edge and dispersion at almost all scales. Interestingly, we find that the impact of forest area metrics on bird species richness intensifies as the scale increases during the breeding season, suggesting that the “scale of effect” of forest area on richness could be at or beyond 3 km. In a highly fragmented urban matrix, forest connectivity may surpass patch size in importance at medium scales. This understanding echoes the findings from a study in Southeast Brazil, which found that small forest patches serving as connectivity and corridors may have greater importance than fragment size in landscapes with moderate amounts of remaining forest [13]. Research from urban parks in Beijing revealed the substantial influence of park green space area and its connectivity on bird occurrence and breeding bird communities [14]. Research in Bangkok reveals that urban parks closer to the city’s largest parks have a higher species richness compared to those more distant from the largest city parks [15]. A study on small forest patches embedded in urban landscapes found that total bird abundance was positively affected by habitat connectivity [64]. Research in Santiago, Chile, examining a 1-square-kilometer buffer, indicates that while increased woody cover in urban landscapes enhances local bird richness, aggregation of woody cover has no such effect [65], which might be related to the single survey scale employed. Our findings highlight the crucial role of scale in evaluating the effects of forest connectivity and area on bird diversity. However, as the dynamics may change on scales exceeding 3 km, further research is warranted to explore these potential shifts.
Our research indicates that the impact of the area of forest at larger scales significantly outweighs that at smaller scales, with its “scale of effect” being over 3 km. Therefore, priority should be placed on preserving large green spaces at larger scales to prevent fragmentation. This is supported by a study across 1581 cities in the U.S. that suggested that city-scale forest cover positively influenced bird species richness [4]. Similarly, a study conducted in Northeast Brazil’s metropolitan region, which included nine protected areas, emphasized the necessity of giving priority to larger reserves for bird conservation [66]. Other studies indicated that large trees contribute to increased bird species taxonomic and functional diversity [67] and that preserving forest remnants in agricultural landscapes supports bird functional richness [68].
For constructed land and roads, the area, edge, and dispersion of constructed land and roads have a profound impact on both richness and FDis. In the case of roads, this influence becomes more prominent as the scale increases. Other studies show that bird diversity significantly declines when built-up cover exceeds 70% [69]. Research indicates a negative correlation between the number of buildings and bird species richness, as well as functional richness and the maximum height of buildings, leading to a precipitous decline in functional evenness [70]. Moreover, a study in Latin American cities found a negative correlation between impervious surfaces [71]. The intricate interaction between roads and biodiversity has long intrigued researchers. Studies have demonstrated that road noise and traffic avoidance behaviors significantly impact species richness and community structure [6,72,73]. Connectivity and road density are crucial predictors of bird community composition in agricultural ecoregions [74]. This impact intensifies as the scale increases, as larger scales incorporate a wider extent of road networks, which could lead to landscape fragmentation on a large scale.
We observed that during the breeding season, the impact of elevation changes on both bird species richness and FDis intensifies as the spatial scale enlarges. However, this relationship is not discernible during the non-breeding season. This discrepancy may be linked to the migratory behavior of waterfowl. In the migration season, a diverse array of waterfowl species congregate near water bodies, where the terrain tends to be more level. This could explain why there is no clear link between terrain changes and diversity in the non-breeding season. It is worth noting that the relationship between elevation and biological diversity has always been of paramount importance. Specific species are supported in mountain habitats at differing altitudes [75,76]. In mountain ecosystems, particularly those in tropical and subtropical regions, high geological heterogeneity fosters conditions that promote species spatial turnover and the emergence of endemic forms [77,78,79]. This underlines the importance of incorporating elevation variation into conservation planning and management in urban areas. Besides, based on our observations, bird feeding, which is known to influence bird presence, was not common in our study area, ensuring a more authentic and naturalistic observation [80].
In our analysis of landscape-level characteristics, we found that both dispersion and subdivision significantly influence bird species richness and the FDis, with these effects being significant across nearly all scales. Furthermore, subdivision had a particularly strong impact on FDis compared to other types of indices. Habitat fragmentation has been found to decrease animal residency within fragmented areas by reducing the available habitat area, while increased isolation restricts movement among fragments, thereby hindering fragment recolonization following local extinction events [16]. A study in Brisbane, Australia, showed that fragmentation heightened the negative effects of built infrastructure on insectivore traits in birds [81]. Research conducted in the agricultural landscapes of southern Finland has shown that bird functional dispersion decreases in homogeneous regions at both local and regional scales [82].
5. Conclusions
In this study, we found that the influence of landscape characteristics on bird species richness and FDis was scale-dependent. Notably, the influence of the area of open water on FDis is most pronounced at smaller scales, while at larger scales, open water dispersion becomes more essential. Additionally, in a highly fragmented urban matrix, the importance of forest connectivity may exceed that of patch size at medium scales. However, the significance of forest coverage increases with scale, which underscores the importance of preservation efforts at larger scales to prevent forest fragmentation. We also noted a considerable impact from landscape-level subdivision across almost all scales. These findings highlight the importance of shifting urban conservation planning towards a multi-scale approach, which would allow for the identification of priority intervention scales.
Supplementary Materials
The following supporting information can be downloaded at: https://www.mdpi.com/article/10.3390/d15080943/s1, Figure S1: PCA plot for diet (a) and foraging strata (b) during the breeding season; Figure S2: PCA plot for diet (a) and foraging strata (b) during the non-breeding season; Table S1: List of bird species recorded in 28 sampling sites distributed across the research region, comprising green spaces in both new and old districts of Kunming city, conducted via point count surveys; Table S2: The top-ranked model set used generalized linear models (GLMs) with a Gaussian family to examine the relationship between multi-scale landscape metrics and bird species richness during the breeding season; Table S3: The top-ranked model set used generalized linear models (GLMs) with a Gaussian family to examine the relationship between multi-scale landscape metrics and bird species richness during the non-breeding season; Table S4: The top-ranked model set used generalized linear models (GLMs) with a Gaussian family to examine the relationship between multi-scale landscape metrics and bird species FDis during the breeding season; Table S5: The top-ranked model set used generalized linear models (GLMs) with a Gaussian family to examine the relationship between multi-scale landscape metrics and bird species FDis during the non-breeding season.
Author Contributions
Q.M. contributed to multiple aspects of the study, including conceptualization, investigation, manuscript drafting, bird surveying, land cover classification, and data curation and analysis. Z.W. participated in formulating and developing the research design. Q.M. and H.B. conducted the bird survey. Y.D. and J.S. participated in completing the land cover classification. L.G. and Z.J. assisted in processing the data. All authors participated in discussions and editing. All authors have read and agreed to the published version of the manuscript.
Funding
This research was financially supported by the National Natural Science Foundation of China (Project No. 52008195). The authors are also thankful for support from Kunming University of Science and Technology’s talent development program, “Research on Optimization of Land Use Structure in Kunming City from the Perspective of Ecological Protection” (Project No. KKZ3202155001).
Data Availability Statement
The datasets used in this study are available upon reasonable request from the corresponding authors.
Acknowledgments
We appreciate the support from Chencan Liao and Kexin Chen during our fieldwork. Additionally, our gratitude goes to the peer reviewers for their insights and the editors for their oversight.
Conflicts of Interest
The authors declare no conflict of interest.
References
- Garizábal-Carmona, J.A.; Mancera-Rodríguez, N.J. Bird Species Richness across a Northern Andean City: Effects of Size, Shape, Land Cover, and Vegetation of Urban Green Spaces. Urban For. Urban Green. 2021, 64, 127243. [Google Scholar] [CrossRef]
- Stratford, J.A.; Robinson, W.D. Distribution of Neotropical Migratory Bird Species across an Urbanizing Landscape. Urban Ecosyst. 2005, 8, 59–77. [Google Scholar] [CrossRef]
- McDonald, R.I.; Mansur, A.V.; Ascensão, F.; Colbert, M.; Crossman, K.; Elmqvist, T.; Gonzalez, A.; Güneralp, B.; Haase, D.; Hamann, M.; et al. Research Gaps in Knowledge of the Impact of Urban Growth on Biodiversity. Nat. Sustain. 2020, 3, 16–24. [Google Scholar] [CrossRef]
- Callaghan, C.T.; Poore, A.G.B.; Major, R.E.; Cornwell, W.K.; Wilshire, J.H.; Lyons, M.B. How to Build a Biodiverse City: Environmental Determinants of Bird Diversity within and among 1581 Cities. Biodivers. Conserv. 2021, 30, 217–234. [Google Scholar] [CrossRef]
- Schlesinger, M.D.; Manley, P.N.; Holyoak, M. Distinguishing Stressors Acting on Land Bird Communities in an Urbanizing Environment. Ecology 2008, 89, 2302–2314. [Google Scholar] [CrossRef] [PubMed]
- Summers, P.D.; Cunnington, G.M.; Fahrig, L. Are the Negative Effects of Roads on Breeding Birds Caused by Traffic Noise? J. Appl. Ecol. 2011, 48, 1527–1534. [Google Scholar] [CrossRef]
- MacArthur, R.H.; Wilson, E.O. The Theory of Island Biogeography; Princeton University Press: Princeton, NJ, USA, 1967; ISBN 978-0-691-08836-5. [Google Scholar]
- Turner, M.G. Landscape ecology: The Effect of Pattern on Process. Annu. Rev. Ecol. Syst. 1989, 20, 171–197. [Google Scholar] [CrossRef]
- Pickett, S.T.A.; Cadenasso, M.L. Landscape Ecology: Spatial Heterogeneity in Ecological Systems. Science 1995, 269, 331–334. [Google Scholar] [CrossRef]
- Andrade, R.; Bateman, H.L.; Franklin, J.; Allen, D. Waterbird Community Composition, Abundance, and Diversity along an Urban Gradient. Landsc. Urban Plan. 2018, 170, 103–111. [Google Scholar] [CrossRef]
- Sebastián-González, E.; Green, A.J. Habitat Use by Waterbirds in Relation to Pond Size, Water Depth, and Isolation: Lessons from a Restoration in Southern Spain. Restor. Ecol. 2014, 22, 311–318. [Google Scholar] [CrossRef]
- Sánchez-Zapata, J.A.; Anadón, J.D.; Carrete, M.; Giménez, A.; Navarro, J.; Villacorta, C.; Botella, F. Breeding Waterbirds in Relation to Artificial Pond Attributes: Implications for the Design of Irrigation Facilities. Biodivers. Conserv. 2005, 14, 1627–1639. [Google Scholar] [CrossRef]
- Bhakti, T.; Goulart, F.; Azevedo, C.S.; Antonini, Y. Does scale matter? The influence of three-level spatial scales on forest bird occurrence in a tropical landscape. PLoS ONE 2018, 13, e0198732. [Google Scholar] [CrossRef] [PubMed]
- Huang, Y.; Zhao, Y.; Li, S.; von Gadow, K. The Effects of Habitat Area, Vegetation Structure and Insect Richness on Breeding Bird Populations in Beijing Urban Parks. Urban For. Urban Green. 2015, 14, 1027–1039. [Google Scholar] [CrossRef]
- Chaiyarat, R.; Wutthithai, O.; Punwong, P.; Taksintam, W. Relationships between Urban Parks and Bird Diversity in the Bangkok Metropolitan Area, Thailand. Urban Ecosyst. 2019, 22, 201–212. [Google Scholar] [CrossRef]
- Haddad, N.M.; Brudvig, L.A.; Clobert, J.; Davies, K.F.; Gonzalez, A.; Holt, R.D.; Lovejoy, T.E.; Sexton, J.O.; Austin, M.P.; Collins, C.D.; et al. Habitat Fragmentation and Its Lasting Impact on Earth’s Ecosystems. Sci. Adv. 2015, 1, e1500052. [Google Scholar] [CrossRef] [PubMed]
- Jackson, H.B.; Fahrig, L. Are Ecologists Conducting Research at the Optimal Scale? Glob. Ecol. Biogeogr. 2015, 24, 52–63. [Google Scholar] [CrossRef]
- Gonçalves, S.F.; Lourenço, A.C.d.P.; Bueno Filho, J.S.d.S.; de Toledo, M.C.B. Characteristics of Residential Backyards That Contribute to Conservation and Diversity of Urban Birds: A Case Study in a Southeastern Brazilian City. Urban For. Urban Green. 2021, 61, 127095. [Google Scholar] [CrossRef]
- Ibáñez-Álamo, J.D.; Morelli, F.; Benedetti, Y.; Rubio, E.; Jokimäki, J.; Pérez-Contreras, T.; Sprau, P.; Suhonen, J.; Tryjanowski, P.; Kaisanlahti-Jokimäki, M.-L.; et al. Biodiversity within the City: Effects of Land Sharing and Land Sparing Urban Development on Avian Diversity. Sci. Total Environ. 2020, 707, 135477. [Google Scholar] [CrossRef]
- Chang, C.-R.; Chien, H.-F.; Shiu, H.-J.; Ko, C.-J.; Lee, P.-F. Multiscale Heterogeneity within and beyond Taipei City Greenspaces and Their Relationship with Avian Biodiversity. Landsc. Urban Plan. 2017, 157, 138–150. [Google Scholar] [CrossRef]
- Kaushik, M.; Tiwari, S.; Manisha, K. Habitat Patch Size and Tree Species Richness Shape the Bird Community in Urban Green Spaces of Rapidly Urbanizing Himalayan Foothill Region of India. Urban Ecosyst. 2022, 25, 423–436. [Google Scholar] [CrossRef]
- Lee, M.-B.; Zhang, M.; Chan, S.; Zhang, Q.; Che, X.; Wong, K.C.; Zhao, X.; Zou, F. Environmental Determinants of Avian Species Richness in Forests in a Highly Urbanized Subtropical City: The Effects of Spatial Scale and Open Space Feature. Glob. Ecol. Conserv. 2021, 30, e01802. [Google Scholar] [CrossRef]
- Litteral, J.; Wu, J. Urban Landscape Matrix Affects Avian Diversity in Remnant Vegetation Fragments: Evidence from the Phoenix Metropolitan Region, USA. Urban Ecosyst. 2012, 15, 939–959. [Google Scholar] [CrossRef]
- Mao, Q.; Sun, J.; Deng, Y.; Wu, Z.; Bai, H. Assessing Effects of Multi-Scale Landscape Pattern and Habitats Attributes on Taxonomic and Functional Diversity of Urban River Birds. Diversity 2023, 15, 486. [Google Scholar] [CrossRef]
- Meffert, P.J.; Dziock, F. The Influence of Urbanisation on Diversity and Trait Composition of Birds. Landsc. Ecol. 2013, 28, 943–957. [Google Scholar] [CrossRef]
- Miguet, P.; Jackson, H.B.; Jackson, N.D.; Martin, A.E.; Fahrig, L. What Determines the Spatial Extent of Landscape Effects on Species? Landsc. Ecol. 2016, 31, 1177–1194. [Google Scholar] [CrossRef]
- Smith, A.C.; Fahrig, L.; Francis, C.M. Landscape Size Affects the Relative Importance of Habitat Amount, Habitat Fragmentation, and Matrix Quality on Forest Birds. Ecography 2011, 34, 103–113. [Google Scholar] [CrossRef]
- Gestich, C.C.; Arroyo-Rodríguez, V.; Ribeiro, M.C.; da Cunha, R.G.T.; Setz, E.Z.F. Unraveling the Scales of Effect of Landscape Structure on Primate Species Richness and Density of Titi Monkeys (Callicebus nigrifrons). Ecol. Res. 2019, 34, 150–159. [Google Scholar] [CrossRef]
- da Silva Carneiro, L.; Ribeiro, M.C.; de Aguiar, W.M.; de Fátima Priante, C.; Frantine-Silva, W.; Gaglianone, M.C. Orchid Bees Respond to Landscape Composition Differently Depending on the Multiscale Approach. Landsc. Ecol. 2022, 37, 1587–1601. [Google Scholar] [CrossRef]
- Boscolo, D.; Metzger, J.P. Is Bird Incidence in Atlantic Forest Fragments Influenced by Landscape Patterns at Multiple Scales? Landsc. Ecol. 2009, 24, 907–918. [Google Scholar] [CrossRef]
- Cardoso, I.; Bueno, A.S.; Morante-Filho, J.C. Number of Forest Fragments and Understory Plants Exert Opposite Effects on Multiple Facets of Bird Diversity in Eucalypt Plantations. Landsc. Ecol. 2023, 38, 1069–1083. [Google Scholar] [CrossRef]
- Gao, Z.; Sun, H. (Eds.) Species Red List of Yunnan Province; Yunnan Science and Technology Press: Kunming, China, 2021. [Google Scholar]
- The Biodiversity Committee of Chinese Academy of Sciences. Catalogue of Life China: 2023 Annual Checklist; Science Press: Beijing, China, 2023. [Google Scholar]
- Yunnan Statistical Bureau. Yunnan Statistical Yearbook 2022; China Statistics Press: Beijing, China, 2022. [Google Scholar]
- Ralph, C.J.; Sauer, J.R.; Droege, S. Monitoring Bird Populations by Point Counts; Pacific Southwest Research Station: Albany, NY, USA, 1995.
- BirdLife International. The BirdLife Checklist of the Birds of the World: Version 7.0. Available online: http://datazone.birdlife.org/species/taxonomy (accessed on 6 July 2023).
- Wilman, H.; Belmaker, J.; Simpson, J.; de la Rosa, C.; Rivadeneira, M.M.; Jetz, W. EltonTraits 1.0: Species-Level Foraging Attributes of the World’s Birds and Mammals. Ecology 2014, 95, 2027. [Google Scholar] [CrossRef]
- Montaño-Centellas, F.A.; McCain, C.; Loiselle, B.A. Using Functional and Phylogenetic Diversity to Infer Avian Community Assembly along Elevational Gradients. Glob. Ecol. Biogeogr. 2020, 29, 232–245. [Google Scholar] [CrossRef]
- Laliberté, E.; Legendre, P. A Distance-Based Framework for Measuring Functional Diversity from Multiple Traits. Ecology 2010, 91, 299–305. [Google Scholar] [CrossRef]
- R Core Team. R: A Language and Environment for Statistical Computing; R Foundation for Statistical Computing: Vienna, Austria, 2021. [Google Scholar]
- Ferenc, M.; Sedláček, O.; Fuchs, R. How to Improve Urban Greenspace for Woodland Birds: Site and Local-Scale Determinants of Bird Species Richness. Urban Ecosyst. 2014, 17, 625–640. [Google Scholar] [CrossRef]
- Puan, C.L.; Yeong, K.L.; Ong, K.W.; Ahmad Fauzi, M.I.; Yahya, M.S.; Khoo, S.S. Influence of Landscape Matrix on Urban Bird Abundance: Evidence from Malaysian Citizen Science Data. J. Asia-Pac. Biodivers. 2019, 12, 369–375. [Google Scholar] [CrossRef]
- Xu, X.; Xie, Y.; Qi, K.; Luo, Z.; Wang, X. Detecting the Response of Bird Communities and Biodiversity to Habitat Loss and Fragmentation Due to Urbanization. Sci. Total Environ. 2018, 624, 1561–1576. [Google Scholar] [CrossRef]
- Farr, T.G.; Rosen, P.A.; Caro, E.; Crippen, R.; Duren, R.; Hensley, S.; Kobrick, M.; Paller, M.; Rodriguez, E.; Roth, L.; et al. The Shuttle Radar Topography Mission. Rev. Geophys. 2007, 45, RG2004. [Google Scholar] [CrossRef]
- ESRI. ArcGIS Desktop: Release 10; Environmental Systems Research Institute: Redlands, CA, USA, 2011. [Google Scholar]
- McGarigal, K.; Marks, B.J. FRAGSTATS: Spatial Pattern Analysis Program for Quantifying Landscape Structure; General Technical Report PNW-GTR-351; U.S. Department of Agriculture, Forest Service, Pacific Northwest Research Station: Portland, OR, USA, 1995. [CrossRef]
- McGarigal, K.; Cushman, S.A.; Neel, M.C.; Ene, E. FRAGSTATS: Spatial Pattern Analysis Program for Categorical Maps. Computer Software Program Produced by the Authors at the University of Massachusetts, Amherst. 2002. Available online: http://www.umass.edu/landeco/research/fragstats/fragstats.html (accessed on 6 July 2023).
- Ikin, K.; Beaty, R.M.; Lindenmayer, D.B.; Knight, E.; Fischer, J.; Manning, A.D. Pocket Parks in a Compact City: How Do Birds Respond to Increasing Residential Density? Landsc. Ecol. 2013, 28, 45–56. [Google Scholar] [CrossRef]
- Leveau, L.M.; Leveau, C.M. Street Design in Suburban Areas and Its Impact on Bird Communities: Considering Different Diversity Facets over the Year. Urban For. Urban Green. 2020, 48, 126578. [Google Scholar] [CrossRef]
- Kucheryavskiy, S. Mdatools—R Package for Chemometrics. Chemom. Intell. Lab. Syst. 2020, 198, 103937. [Google Scholar] [CrossRef]
- Mehmood, T.; Liland, K.H.; Snipen, L.; Sæbø, S. A Review of Variable Selection Methods in Partial Least Squares Regression. Chemom. Intell. Lab. Syst. 2012, 118, 62–69. [Google Scholar] [CrossRef]
- Carrascal, L.M.; Galván, I.; Gordo, O. Partial Least Squares Regression as an Alternative to Current Regression Methods Used in Ecology. Oikos 2009, 118, 681–690. [Google Scholar] [CrossRef]
- Rossi, J.-P.; van Halder, I. Towards Indicators of Butterfly Biodiversity Based on a Multiscale Landscape Description. Ecol. Indic. 2010, 10, 452–458. [Google Scholar] [CrossRef]
- Chong, I.-G.; Jun, C.-H. Performance of Some Variable Selection Methods When Multicollinearity Is Present. Chemom. Intell. Lab. Syst. 2005, 78, 103–112. [Google Scholar] [CrossRef]
- Sobhonslidsuk, A.; Chanprasertyothin, S.; Pongrujikorn, T.; Kaewduang, P.; Promson, K.; Petraksa, S.; Ongphiphadhanakul, B. The Association of Gut Microbiota with Nonalcoholic Steatohepatitis in Thais. BioMed Res. Int. 2018, 2018, 9340316. [Google Scholar] [CrossRef] [PubMed]
- Bickford, D.; Ng, T.H.; Qie, L.; Kudavidanage, E.P.; Bradshaw, C.J. Forest Fragment and Breeding Habitat Characteristics Explain Frog Diversity and Abundance in Singapore. Biotropica 2010, 42, 119–125. [Google Scholar] [CrossRef]
- Burnham, K.P.; Anderson, D.R. Model Selection and Multimodel Inference: A Practical Information-Theoretic Approach; Springer: New York, NY, USA, 2002; ISBN 978-1-280-00948-8. [Google Scholar]
- Bartoń, K. Multi-Model Inference. R Package, Version 1.43.6. Available online: https://cran.r-project.org/web/packages/MuMIn/MuMIn.pdf (accessed on 6 July 2023).
- Bidwell, M.T.; Green, A.J.; Clark, R.G. Random Placement Models Predict Species–Area Relationships in Duck Communities despite Species Aggregation. Oikos 2014, 123, 1499–1508. [Google Scholar] [CrossRef]
- Xia, S.; Wang, Y.; Lei, G.; Liu, Y.; Lei, J.; Yu, X.; Wen, L.; Zhou, Y. Restriction of Herbivorous Waterbird Distributions in the Middle and Lower Yangtze River Floodplain in View of Hydrological Isolation. Wetlands 2017, 37, 79–88. [Google Scholar] [CrossRef]
- Mao, Q.; Liao, C.; Wu, Z.; Guan, W.; Yang, W.; Tang, Y.; Wu, G. Effects of Land Cover Pattern Along Urban-Rural Gradient on Bird Diversity in Wetlands. Diversity 2019, 11, 86. [Google Scholar] [CrossRef]
- Rosselli, L.; Stiles, F.G. Wetland Habitats of the Sabana de Bogota Andean Highland Plateau and Their Birds. Aquat. Conserv. Mar. Freshw. Ecosyst. 2012, 22, 303–317. [Google Scholar] [CrossRef]
- Albanese, G.; Davis, C.A. Characteristics within and around Stopover Wetlands Used by Migratory Shorebirds: Is the Neighborhood Important? Condor 2015, 117, 328–340. [Google Scholar] [CrossRef]
- Kang, W.; Minor, E.S.; Park, C.-R.; Lee, D. Effects of Habitat Structure, Human Disturbance, and Habitat Connectivity on Urban Forest Bird Communities. Urban Ecosyst. 2015, 18, 857–870. [Google Scholar] [CrossRef]
- Villaseñor, N.R.; Escobar, M.A.H.; Hernández, H.J. Can Aggregated Patterns of Urban Woody Vegetation Cover Promote Greater Species Diversity, Richness and Abundance of Native Birds? Urban For. Urban Green. 2021, 61, 127102. [Google Scholar] [CrossRef]
- Enedino, T.R.; Loures-Ribeiro, A.; Santos, B.A. Protecting Biodiversity in Urbanizing Regions: The Role of Urban Reserves for the Conservation of Brazilian Atlantic Forest Birds. Perspect. Ecol. Conserv. 2018, 16, 17–23. [Google Scholar] [CrossRef]
- Morelli, F.; Benedetti, Y.; Su, T.; Zhou, B.; Moravec, D.; Simova, P.; Liang, W. Taxonomic Diversity, Functional Diversity and Evolutionary Uniqueness in Bird Communities of Beijing’s Urban Parks: Effects of Land Use and Vegetation Structure. Urban For. Urban Green. 2017, 23, 84–92. [Google Scholar] [CrossRef]
- Prescott, G.W.; Gilroy, J.J.; Haugaasen, T.; Medina Uribe, C.A.; Foster, W.A.; Edwards, D.P. Reducing the Impacts of Neotropical Oil Palm Development on Functional Diversity. Biol. Conserv. 2016, 197, 139–145. [Google Scholar] [CrossRef]
- Leveau, L.M.; Isla, F.I.; Isabel Bellocq, M. From Town to Town: Predicting the Taxonomic, Functional and Phylogenetic Diversity of Birds Using NDVI. Ecol. Indic. 2020, 119, 106703. [Google Scholar] [CrossRef]
- Melo, M.A.; Sanches, P.M.; Silva Filho, D.F.; Piratelli, A.J. Influence of Habitat Type and Distance from Source Area on Bird Taxonomic and Functional Diversity in a Neotropical Megacity. Urban Ecosyst. 2022, 25, 545–560. [Google Scholar] [CrossRef]
- Paz Silva, C.; Garcia, C.E.; Estay, S.A.; Barbosa, O. Bird Richness and Abundance in Response to Urban Form in a Latin American City: Valdivia, Chile as a Case Study. PLoS ONE 2015, 10, e0138120. [Google Scholar] [CrossRef]
- Barber, J.R.; Crooks, K.R.; Fristrup, K.M. The Costs of Chronic Noise Exposure for Terrestrial Organisms. Trends Ecol. Evol. 2010, 25, 180–189. [Google Scholar] [CrossRef]
- Kociolek, A.V.; Clevenger, A.P.; Clair, C.C.S.; Proppe, D.S. Effects of Road Networks on Bird Populations. Conserv. Biol. 2011, 25, 241–249. [Google Scholar] [CrossRef] [PubMed]
- Whited, D.; Galatowitsch, S.; Tester, J.R.; Schik, K.; Lehtinen, R.; Husveth, J. The Importance of Local and Regional Factors in Predicting Effective Conservation—Planning Strategies for Wetland Bird Communities in Agricultural and Urban Landscapes. Landsc. Urban Plan. 2000, 49, 49–65. [Google Scholar] [CrossRef]
- Peters, M.K.; Hemp, A.; Appelhans, T.; Becker, J.N.; Behler, C.; Classen, A.; Detsch, F.; Ensslin, A.; Ferger, S.W.; Frederiksen, S.B.; et al. Climate–Land-Use Interactions Shape Tropical Mountain Biodiversity and Ecosystem Functions. Nature 2019, 568, 88–92. [Google Scholar] [CrossRef] [PubMed]
- Körner, C.; Paulsen, J.; Spehn, E.M. A Definition of Mountains and Their Bioclimatic Belts for Global Comparisons of Biodiversity Data. Alp. Bot. 2011, 121, 73–78. [Google Scholar] [CrossRef]
- Liu, W.; Yu, D.; Yuan, S.; Yi, J.; Cao, Y.; Li, X.; Xu, H. Effects of Spatial Fragmentation on the Elevational Distribution of Bird Diversity in a Mountain Adjacent to Urban Areas. Ecol. Evol. 2022, 12, e9051. [Google Scholar] [CrossRef]
- Rahbek, C.; Borregaard, M.K.; Antonelli, A.; Colwell, R.K.; Holt, B.G.; Nogues-Bravo, D.; Rasmussen, C.M.Ø.; Richardson, K.; Rosing, M.T.; Whittaker, R.J.; et al. Building Mountain Biodiversity: Geological and Evolutionary Processes. Science 2019, 365, 1114–1119. [Google Scholar] [CrossRef]
- McCain, C.M. Area and Mammalian Elevational Diversity. Ecology 2007, 88, 76–86. [Google Scholar] [CrossRef]
- Reynolds, S.J.; Galbraith, J.A.; Smith, J.A.; Jones, D.N. Garden Bird Feeding: Insights and Prospects from a North-South Comparison of This Global Urban Phenomenon. Front. Ecol. Evol. 2017, 5, 24. [Google Scholar] [CrossRef]
- Suárez-Castro, A.F.; Maron, M.; Mitchell, M.G.E.; Rhodes, J.R. Disentangling Direct and Indirect Effects of Landscape Structure on Urban Bird Richness and Functional Diversity. Ecol. Appl. 2022, 32, e2713. [Google Scholar] [CrossRef]
- Jonason, D.; Ekroos, J.; Öckinger, E.; Helenius, J.; Kuussaari, M.; Tiainen, J.; Smith, H.G.; Lindborg, R. Weak Functional Response to Agricultural Landscape Homogenisation among Plants, Butterflies and Birds. Ecography 2017, 40, 1221–1230. [Google Scholar] [CrossRef]


Disclaimer/Publisher’s Note: The statements, opinions and data contained in all publications are solely those of the individual author(s) and contributor(s) and not of MDPI and/or the editor(s). MDPI and/or the editor(s) disclaim responsibility for any injury to people or property resulting from any ideas, methods, instructions or products referred to in the content. |
© 2023 by the authors. Licensee MDPI, Basel, Switzerland. This article is an open access article distributed under the terms and conditions of the Creative Commons Attribution (CC BY) license (https://creativecommons.org/licenses/by/4.0/).