Abstract
Epiphytic subaerial algae represent an assemblage of micro-organisms widely distributed in terrestrial environments, including urban environments. Urban habitats present many challenges for the survival of photosynthetic micro-organisms, yet many species of subaerial microalgae have been reported from these environments, demonstrating a high tolerance to the harsh conditions of urban environments. In this study, the epiphytic subaerial communities of five parks in the urban area of Bangkok were studied using a metabarcoding approach (sequencing of the 23S rDNA marker), with the goal of unraveling their diversity and assessing potential bioindicators with levels of air pollution. Diversity indexes were determined for the algal taxa detected, which were separated into groups corresponding to different collection sites by cluster analysis. Relationships between taxa and air pollutants were analyzed by PCA and the Pearson correlation coefficient (r). The results showed a high diversity of epiphytic subaerial algae. We recorded 101 taxa belonging to the Cyanophyta (70 taxa), Chlorophyta (21 taxa), Charophyta (5 taxa), Bacillariophyta (3 taxa), and Eustigmatophyta (2 taxa). The most abundant taxon was Chroococcidiopsis sp. 1, for which up to 13,254 sequences/cm2 were recorded. The Shannon–Weaver index ranged between 1.37 and 2.51, the Margalef index between 3.84 and 4.75, and the Pielou index between 0.30 and 0.54. The similarity index was between 8.00% and 64.82%, according to the cluster analysis results for the three groups. The PCA indicated that all air pollutants affected the diversity and abundance of epiphytic subaerial algae. Cyanothece sp. 2 was negatively related to O3 and positively related to NO2 and CO and is suggested as a potential bioindicator of air pollution.
1. Introduction
Epiphytic subaerial microalgae are a widespread subgroup of photosynthetic organisms living on many different aerial surfaces, including parts of vascular plants such as trunks, leaves, and fruits [1,2,3,4]. They are either single-celled or form colonies or filaments that, when sufficiently abundant to produce mats or crusts, are visible to the naked eye. Green algae (Chlorophyta and Charophyta), diatoms (Bacillariophyta), and cyanobacteria (Cyanophyta) include most of the species found in subaerial algal communities, but other microalgal groups may also be represented. Typically, cyanobacteria are the dominant group in subaerial assemblages of tropical regions, whereas in temperate regions, green algae are usually the most abundant forms [2,3].
Most of the current knowledge of the diversity of subaerial algal assemblages is due to morphological studies based on microscopic observation of field-collected or, more frequently, cultured material. However, the small size and simple morphology of subaerial algae make it challenging to identify these organisms based on morphology only (and consequently, to correctly assess the diversity of their communities in nature). In recent decades, the introduction of DNA sequence data has revolutionized the taxonomy and systematics of microalgae, unraveling a great deal of cryptic diversity. Molecular data have demonstrated that phenotypic plasticity and morphological convergence are widespread phenomena in the evolution of these organisms, implying that morphologically similar strains may be only distantly related from the phylogenetic point of view. Consequently, numerous new genera and species have been described using molecular phylogenetic data. More recently, molecular methods have also been applied to the study of subaerial algal communities in nature based on the use of metagenomic approaches [5,6,7,8,9,10]. These studies showed that subaerial algal communities are often extremely diverse and formed by a much higher number of taxa than suggested by morphological investigations, whether culture-based or not.
In terms of metabolism and ecological requirements, subaerial algae differ in many aspects from algae that live in water or conditions of high humidity. Many subaerial algae can tolerate drought and low atmospheric humidity, although they are metabolically active only when there is liquid water or high atmospheric moisture [2,4,11]. In general, they are more tolerant than their aquatic counterparts to many physico-chemical stressors typical of aerial habitats (e.g., extreme dehydration, strong variation in temperature, exposure to high UV radiation, and atmospheric pollutants). Urban areas are artificial environments in which such stressful conditions are often realized. Despite this, numerous taxa of subaerial microalgae have been reported from urban habitats [3]. Species of microalgae growing in urban habitats in large cities are constantly exposed to high levels of air pollution; it has been suggested that some species can be used as biological indicators of air pollution in different areas and weather conditions [11,12,13,14,15,16]. Refs. [16,17] argued that some of these organisms may be used as bioindicators of specific air pollutants such as sulfur dioxide (SO2), nitrogen oxides (NOx), carbon monoxide (CO), and fine particulate matter (PM2.5).
The objectives of this study were to assess the diversity and abundance of epiphytic subaerial algae at several sites within the Metropolitan Region of Bangkok, Thailand, based on metabarcoding methods. Using data on urban pollutants, we also looked for possible correlations between the abundance of individual microalgal taxa and specific pollutants, trying to identify taxa with the potential to be used as indicators of air pollution in this area.
2. Materials and Methods
2.1. Study Sites
Bangkok is the capital city of Thailand, and it is governed by the Bangkok Metropolitan Administration. The city is in the tropical region, with a population of more than 10 million people [18,19,20]. Today, it suffers from severe air pollution [20,21]. The pollution derives from emissions by cars, factories, and various types of waste [22], such as hydrocarbons, particulate matter (PM10), carbon monoxide (CO), sulfur dioxide (SO2), nitrogen oxides (NOx), benzene, and black smoke from diesel-powered vehicles [23,24,25].
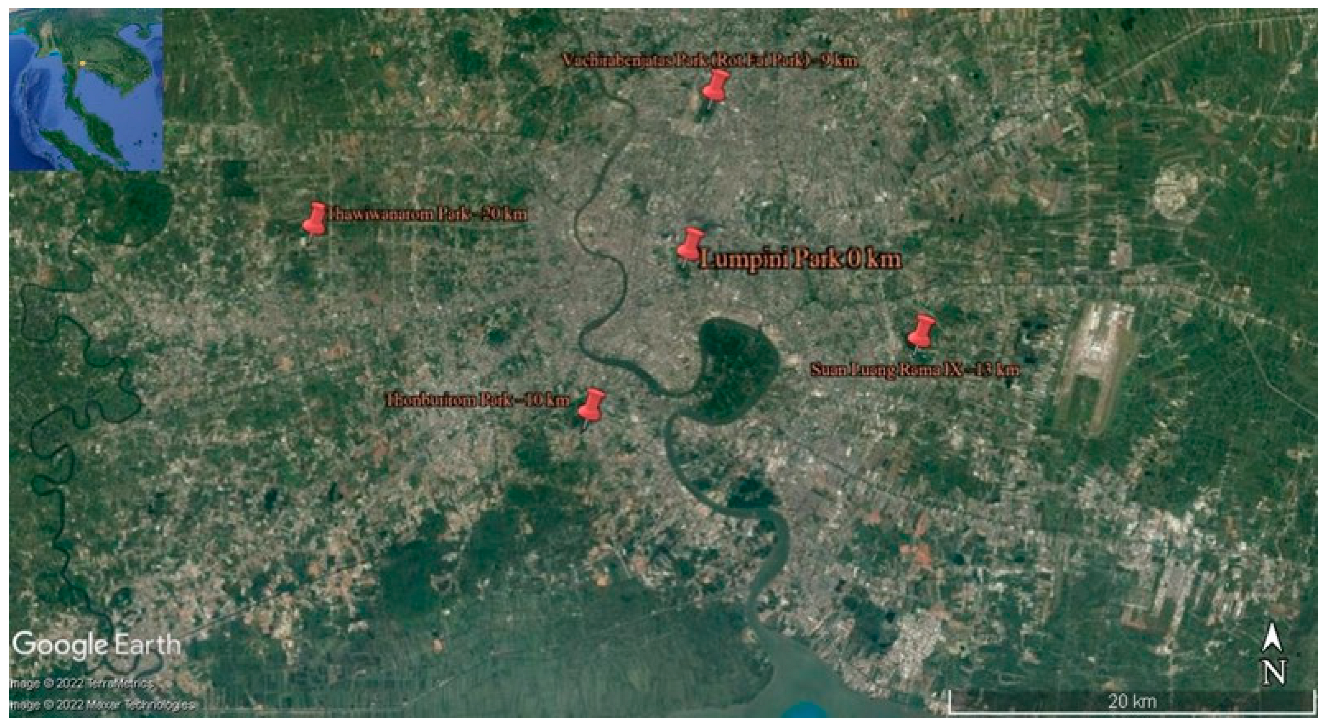
Extensive collections of epiphytic subaerial algae were made in May 2022 (the wet season, which in Bangkok spans from May to October) from five parks selected as sampling sites in the Bangkok Metropolitan Region (hereafter reported simply as Bangkok). They were in the city’s northern area (Vachirabenjatas Park, or Rot Fai Park), eastern area (Suan Luang Rama IX), central area (Lumpini Park), western area (Thawi Wanarom Park), and southern area (Thonburirom Park). Distances among these sites ranged between 10 and 30 km (Figure 1 and Table 1).
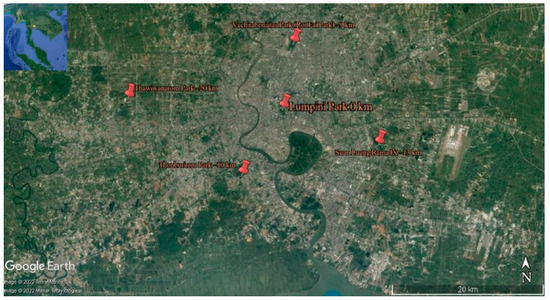
Figure 1.
Map showing the five sampling sites within the urban area of Bangkok.

Table 1.
Details of the five sampling sites within the urban area of Bangkok.
2.2. Sample Collection
At each site, samples of epiphytic subaerial algae were collected from five trees with a circumference of more than 130 cm, at approximately 1.5 m height from the ground, by the method of line transect sampling by walking in the line of 5 trees in 4 corners and a center [26]. A sterile scraper or knife was used to scrape off a surface of 1 cm2, and each sample was placed in a paper bag containing silica gel. Information concerning the orientation of the sampled surface, species of tree, and characteristics of the surrounding environment was annotated for each sample. The geographical coordinates and altitude were recorded based on GPS data (Table 1). The paper bags containing the samples were sealed and transferred to the laboratory at the Department of Botany, Kasetsart University.
2.3. Measurement of Air Pollutants
The general atmospheric air quality standards for six types of air pollutants were used in this study. For ozone (O3), nitrogen dioxide (NO2), carbon monoxide (CO), and sulfur dioxide (SO2), the measurements were recorded in units of parts per billion (ppb) or parts per million (ppm). For particulate matter less than 10 microns in size (PM10) or less than 2.5 microns in size (PM2.5), the measurements were recorded in units of micrograms per cubic meter (µg/m3). The measurements used were averages of the pollutant measurements taken every hour over 24 h in the algal collection dates. The measurements were taken in each site by the Air Quality and Noise Management Divisions of the Pollution Control Department and the Bureau of the Environment of the Bangkok Metropolitan Administration; the data are available from http://air4thai.pcd.go.th/webV2/ (accessed on 4 October 2022).
2.4. Assessment of Diversity of the Subaerial Epiphytic Communities
The diversity of the sampled subaerial algal communities was assessed using a metagenomic approach based on high-throughput sequencing of 23S rDNA [27,28], a marker present in all photosynthetic organisms (chloroplast-encoded in eukaryotic algae). The samples scraped from 5 trees at each site were mixed, and DNA was extracted using the OnePCR Kit (GeneDireX, Las Vegas, NV, USA) following the manufacturer’s recommendations. For the amplification of 23S rDNA, the primers P23SrV_f1 (GGACAGAAAGACCCT) and P23SrV_r1 (TCAGCCTGTTATCCC) were used, following the amplification protocol of [27]. PCR amplification was performed using the following cycling conditions: initial denaturation at 94 °C for 2 min, followed by 35 cycles of 94 °C for 20 s, 55 °C for 30 s, and 72 °C for 30 s, with a final extension of 72 °C for 10 min [27]. PCR products with the expected size and yield were selected after a check on 2% agarose gel electrophoresis. The same amount of PCR products from each sample were pooled, end-repaired, A-tailed, and further ligated with Illumina adapters. Libraries were sequenced on a paired-end Illumina platform to generate 450-bp paired-end raw reads. The library was checked with QubitTM 4.0 Fluorometer (Thermo Fisher Scientific, Waltham, MA, USA) following [29] and the real-time polymerase chain reaction (rtPCR) for quantification and a bioanalyzer (2100 Bioanalyzer Instrument, Santa Clara, CA, USA) for size distribution detection. Quantified libraries were pooled and sequenced on MGISEQ-2000 Sequencing Illumina platforms according to effective library concentrations and the amount of data required.
2.4.1. Merging of Paired-End Reads and Quality Control
Paired-end reads were assigned to samples based on their unique barcodes and were truncated by cutting off the barcodes and primer sequences. Then, the paired-end reads were merged using FLASH (Version 1.2.11, http://ccb.jhu.edu/software/FLASH/ (accessed on 10 September 2022)) [30], a very fast and accurate analysis tool designed to merge paired-end reads when at least some of the reads overlap with the reads generated from the opposite end of the same DNA fragment; the splicing sequences are called raw tags. Quality filtering of the raw tags was performed using fastp (Version 0.20.0) software to obtain high-quality clean tags. Finally, the clean tags were compared with the reference database (SILVA database: https://www.arbsilva.de/ (accessed on 12 September 2022) for 23S; UNITE database: https://unite.ut.ee/ (accessed on 13 September 2022) for rDNA) using VSEARCH (Version 2.15.0) to detect the chimera sequences, and then the chimera sequences were removed to obtain the effective tags [31].
2.4.2. Amplicon Sequence Variants (ASVs) Denoising and Taxon Annotation
First, for the effective tags obtained as described above, denoising was performed with the DADA2 or deblurring module in QIIME2 software (Version QIIME2-202006) to obtain the initial ASVs (default: DADA2), and then ASVs with an abundance of less than 5 were filtered out [32]. Taxon annotation was performed using the QIIME2 software. For 23S, the annotation database was the SILVA database from LPSN and NCBI taxonomy [33], while for markers, primer, and protocols from [27], it was the UNITE database. To assess the phylogenetic relationship of each ASV and the differences in dominant taxa in different samples, multiple sequencing alignment was performed using the QIIME2 software. Finally, the absolute abundance (individuals, meaning an individual cell, colony, or filament of subaerial algae) of ASVs was normalized using a standard sequence number corresponding to the sample with the fewest sequences.
2.5. Indices of Algal Community Structure
The diversity index (Shannon–Weaver index (H’)), richness index (Margalef index), equitability (evenness) index (Pielou index (J’)), and similarity index or the percentage of overlap algae, were calculated from abundance data of epiphytic subaerial algae. They were used to compare the diversity and abundance of epiphytic subaerial algae at various sites. Cluster analysis using the Bray–Curtis method was used to determine the similarities index for the various sites of collection of epiphytic subaerial algae by PC-ORDTM 6 program [34] and IBM SPSS Statistics version 21.0 (IBM Corporation, Armonk, NY, USA) [35].
2.6. Potential for Use of the Relationship between Algal Diversity and Abundance and the Air Pollutants
The possible relationships between the diversity and abundance of the epiphytic subaerial algae and the air pollutants at this time were analyzed using a Principal Component Analysis (PCA) with a Bray–Curtis distance in the PC-ORDTM 6 program [34]. The statistical values of the Pearson’s correlation coefficient (r) obtained with IBM SPSS Statistics version 21.0 (IBM Corporation, Armonk, NY, USA) also analyzed the relationships between the diversity and abundance of the epiphytic subaerial algae and the air pollutants [35,36].
3. Results
3.1. Diversity and Abundance of Algae
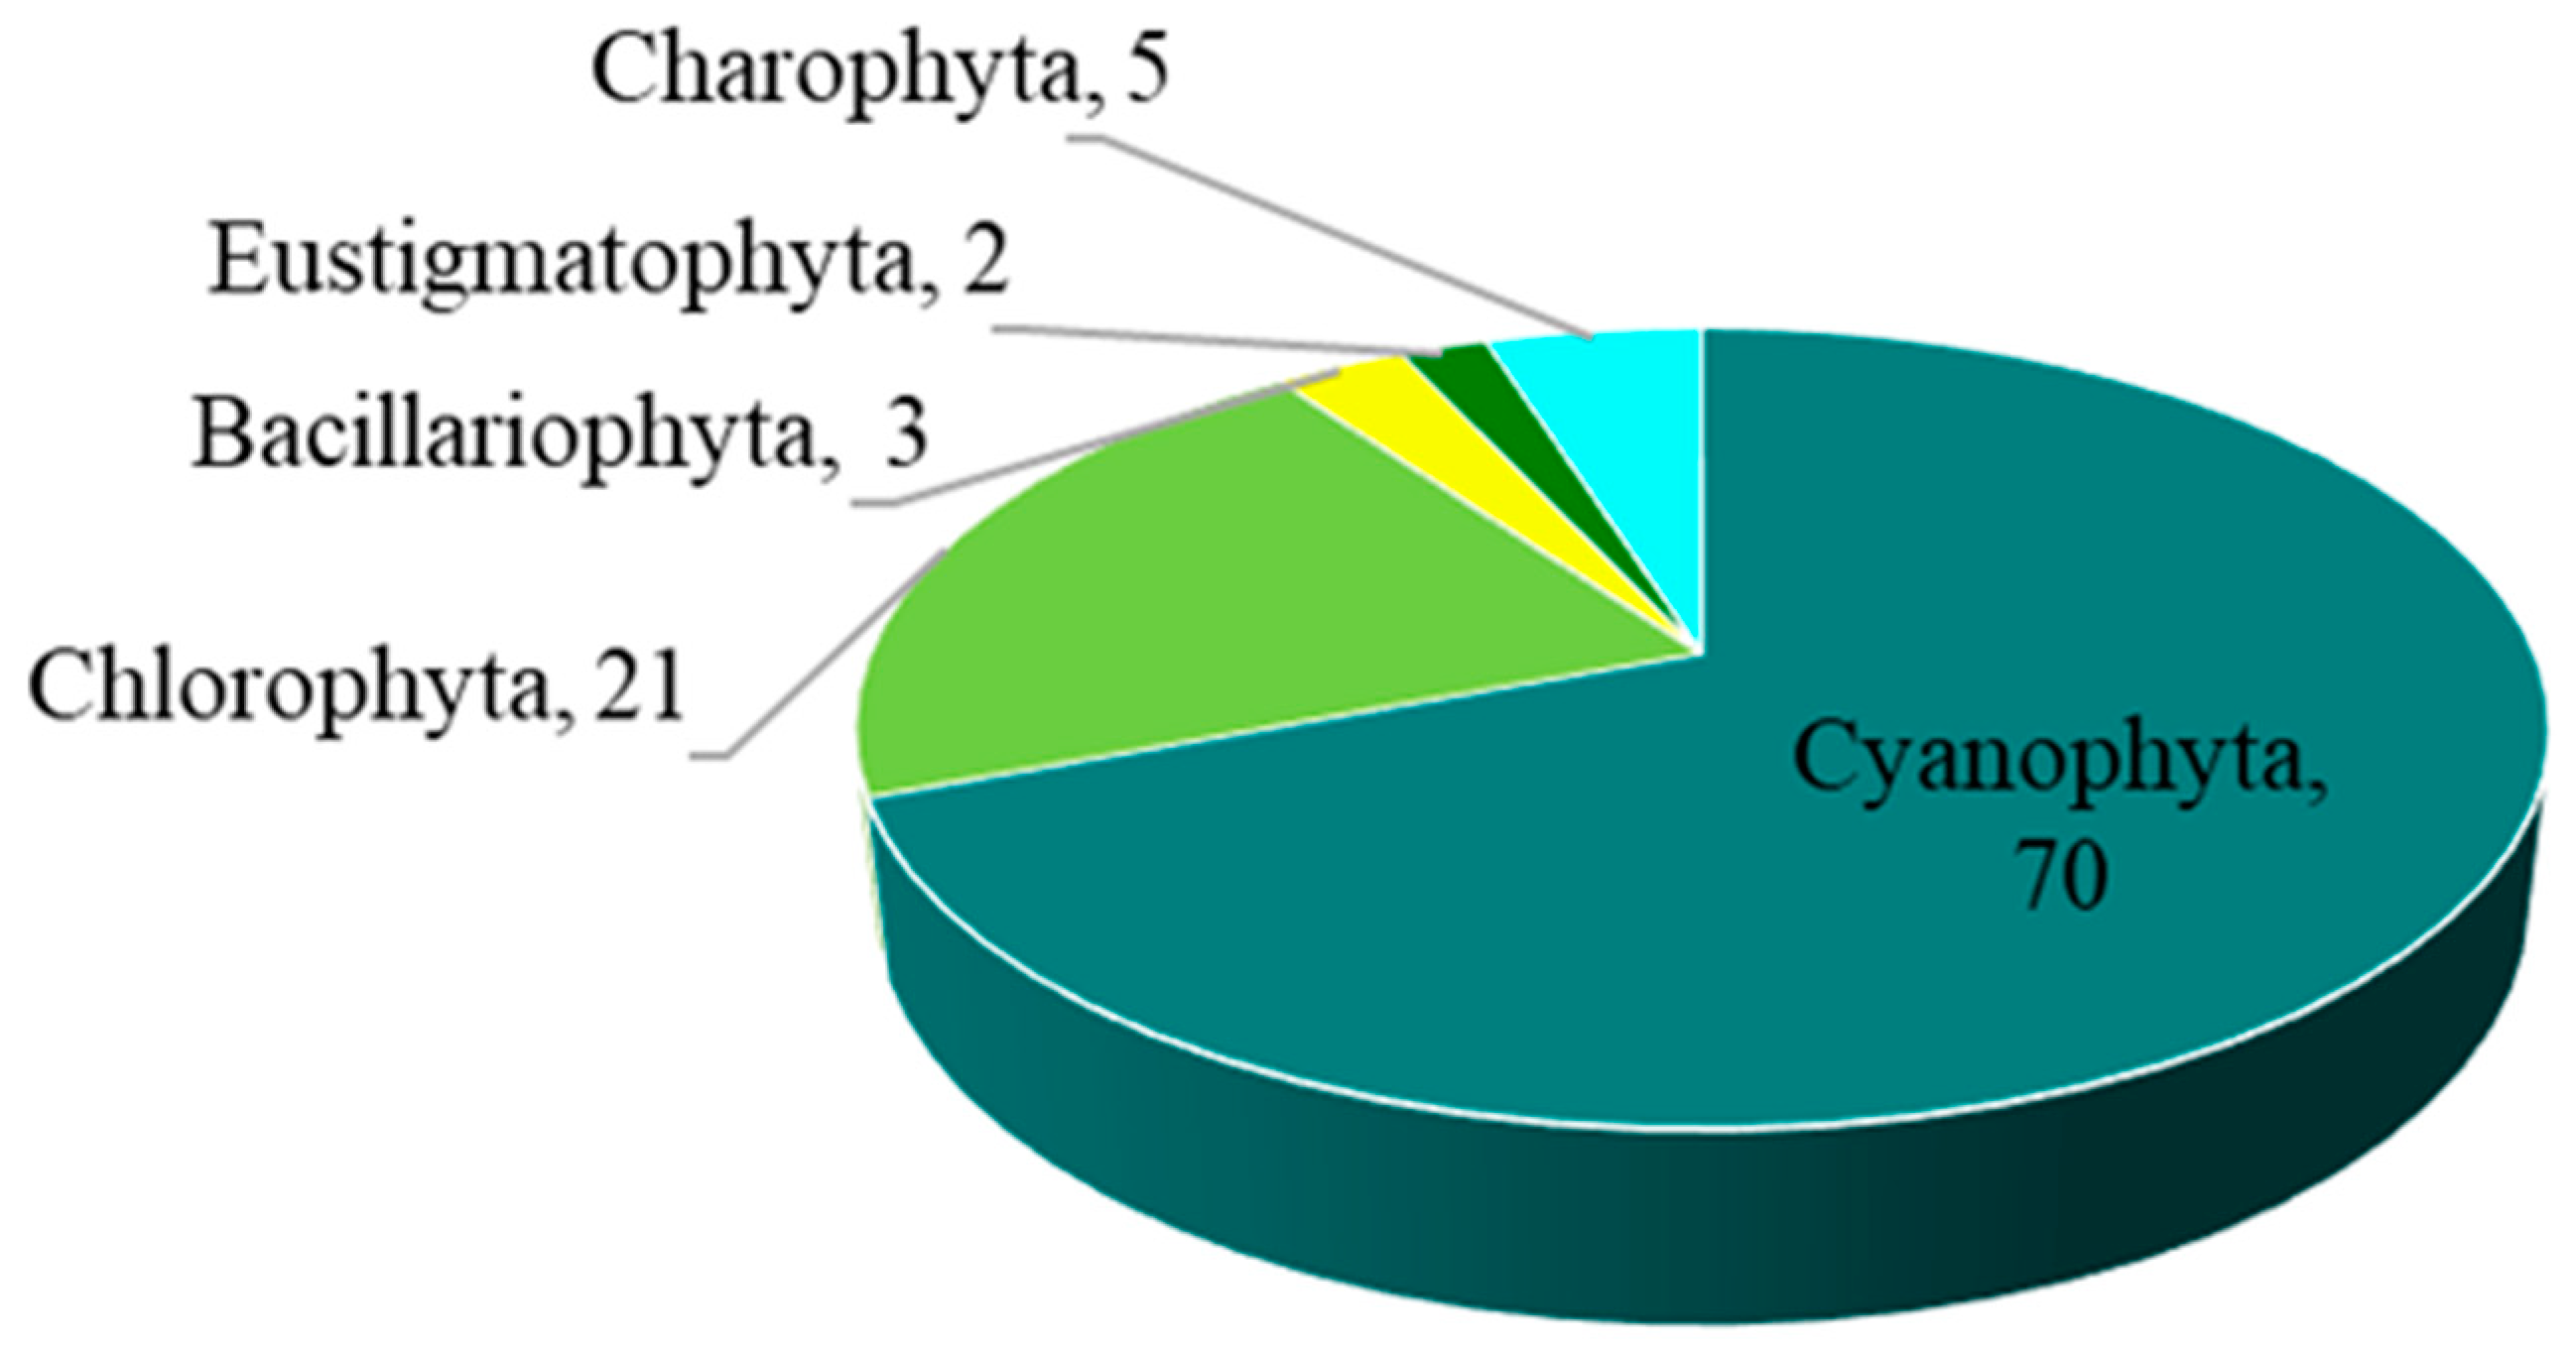
The overall number of taxa of epiphytic subaerial algae recorded in the urban area of Bangkok was 101. Overall, 101 taxa of algae belonging to the phyla Cyanophyta (70 taxa), Chlorophyta (21 taxa), Charophyta (5 taxa), Bacillariophyta (3 taxa), and Eustigmatophyta (2 taxa) were identified in the urban area of Bangkok from the algal samples (Figure 2; Table 2).

Figure 2.
The number of taxa of the five phyla of epiphytic subaerial algae found at the sampling sites in Bangkok.
Table 2.
List of epiphytic subaerial algae recorded from sites within Bangkok. Nomenclature and taxonomy follow AlgaeBase [37].
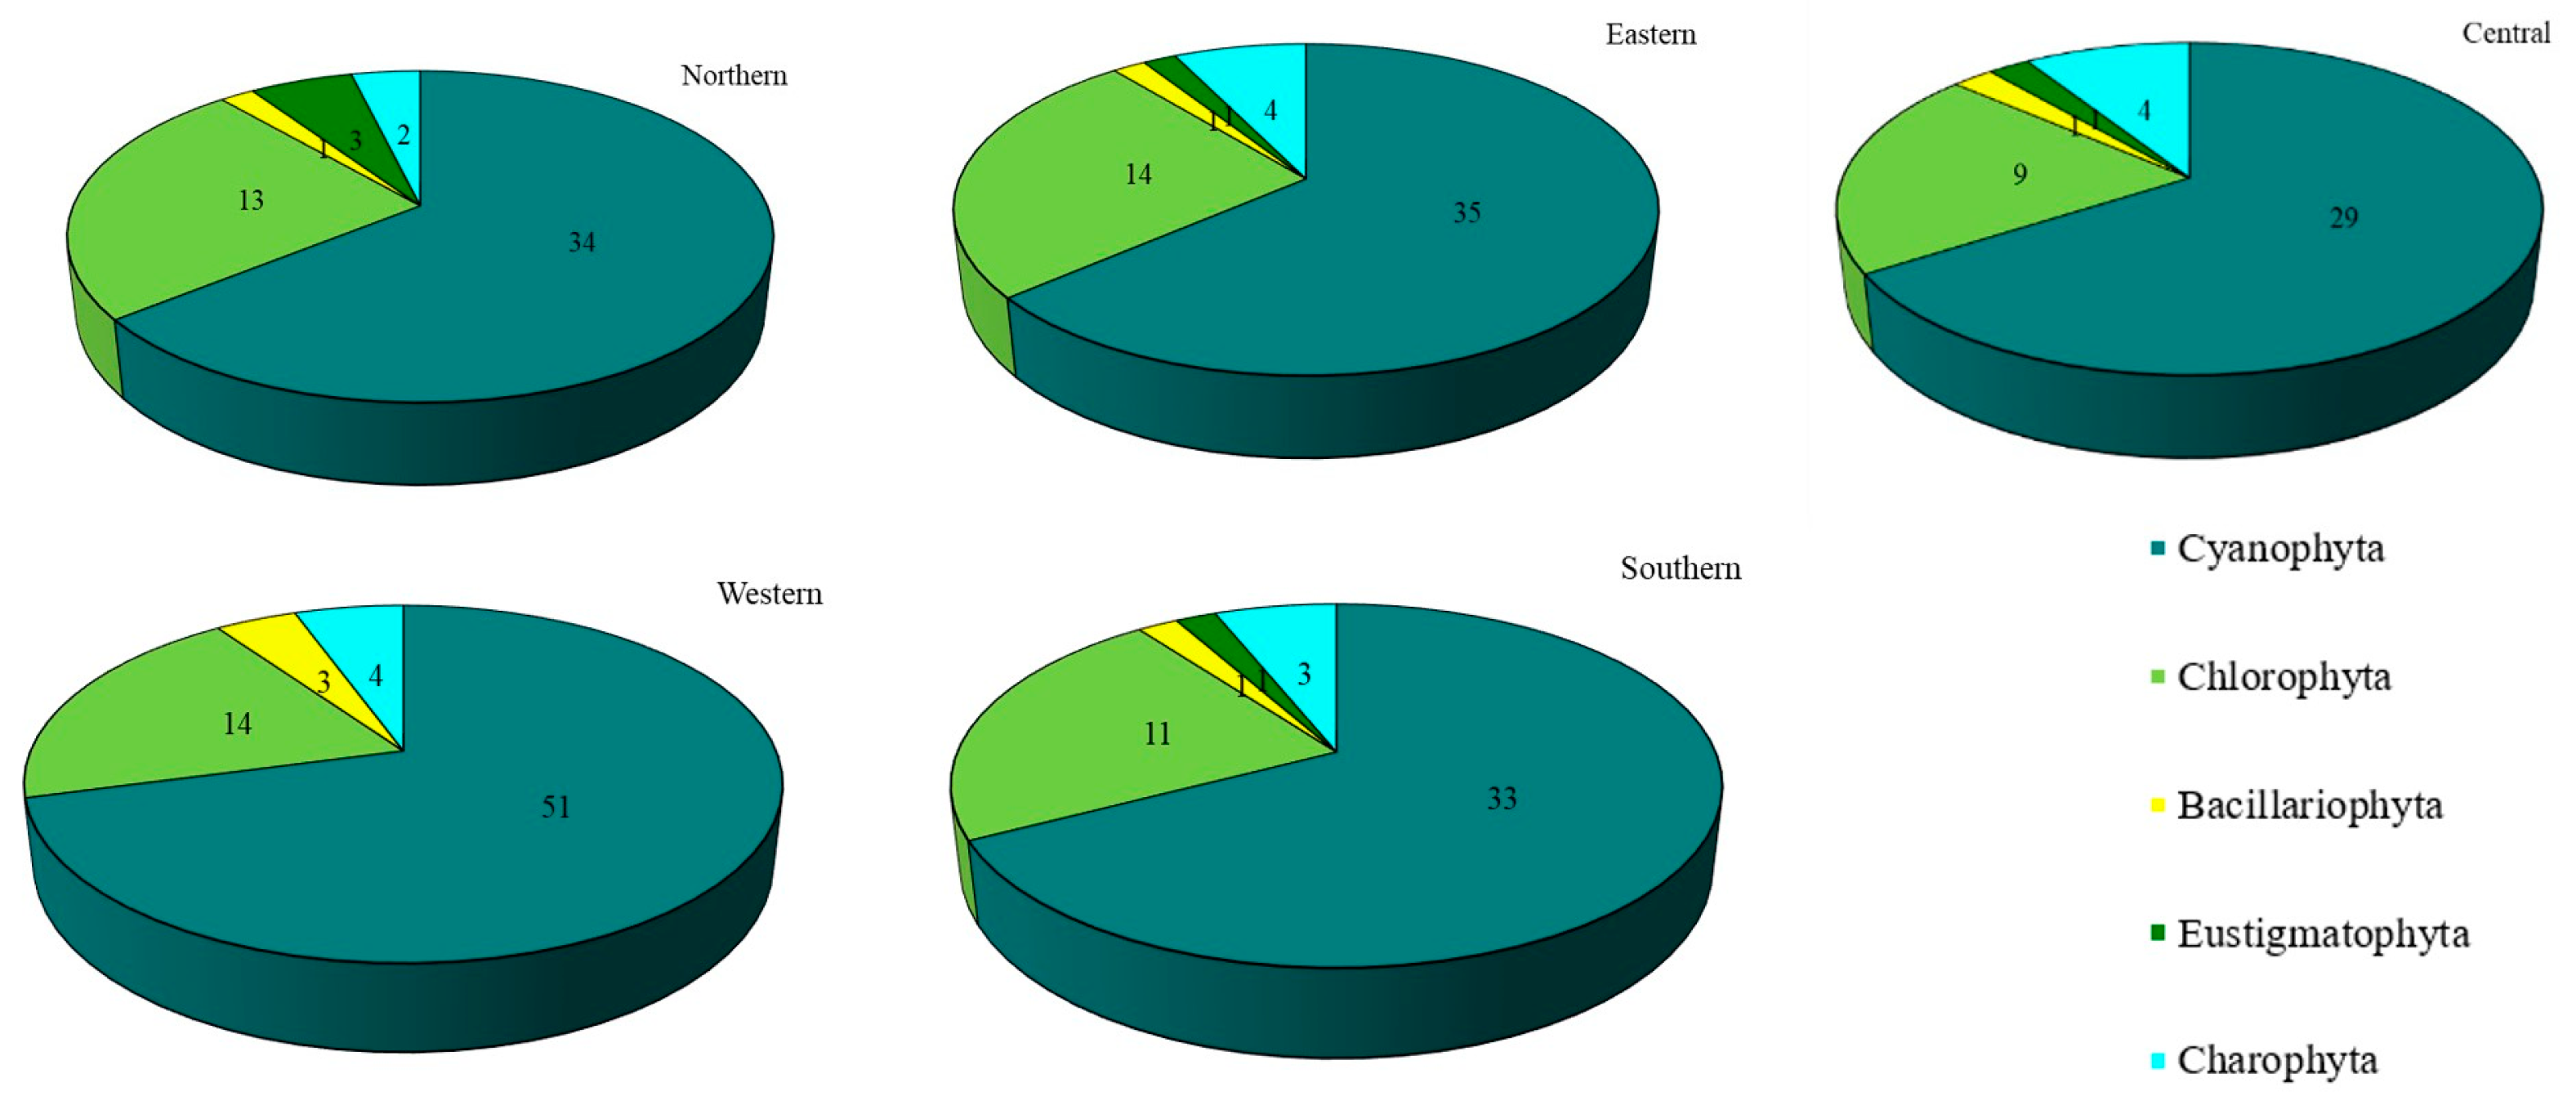
Concerning each site individually, 72 taxa were recovered in the western site (Thawi Wanarom Park), 55 in the eastern site (Suan Luang RAMA IX), 53 in the northern site (Vachirabenjatas Park), 49 in the southern site (Thonburirom Park) and 44 in the central site (Lumpini Park). Moreover, when comparing the abundance of the five phyla at each site, Cyanophyta had the highest diversity of taxa, followed by Chlorophyta. Charophyta, Bacillariophyta, and Eustigmatophyta were found in smaller numbers (Figure 3).

Figure 3.
The number of taxa of epiphytic subaerial algae recorded at the five sites in Bangkok.
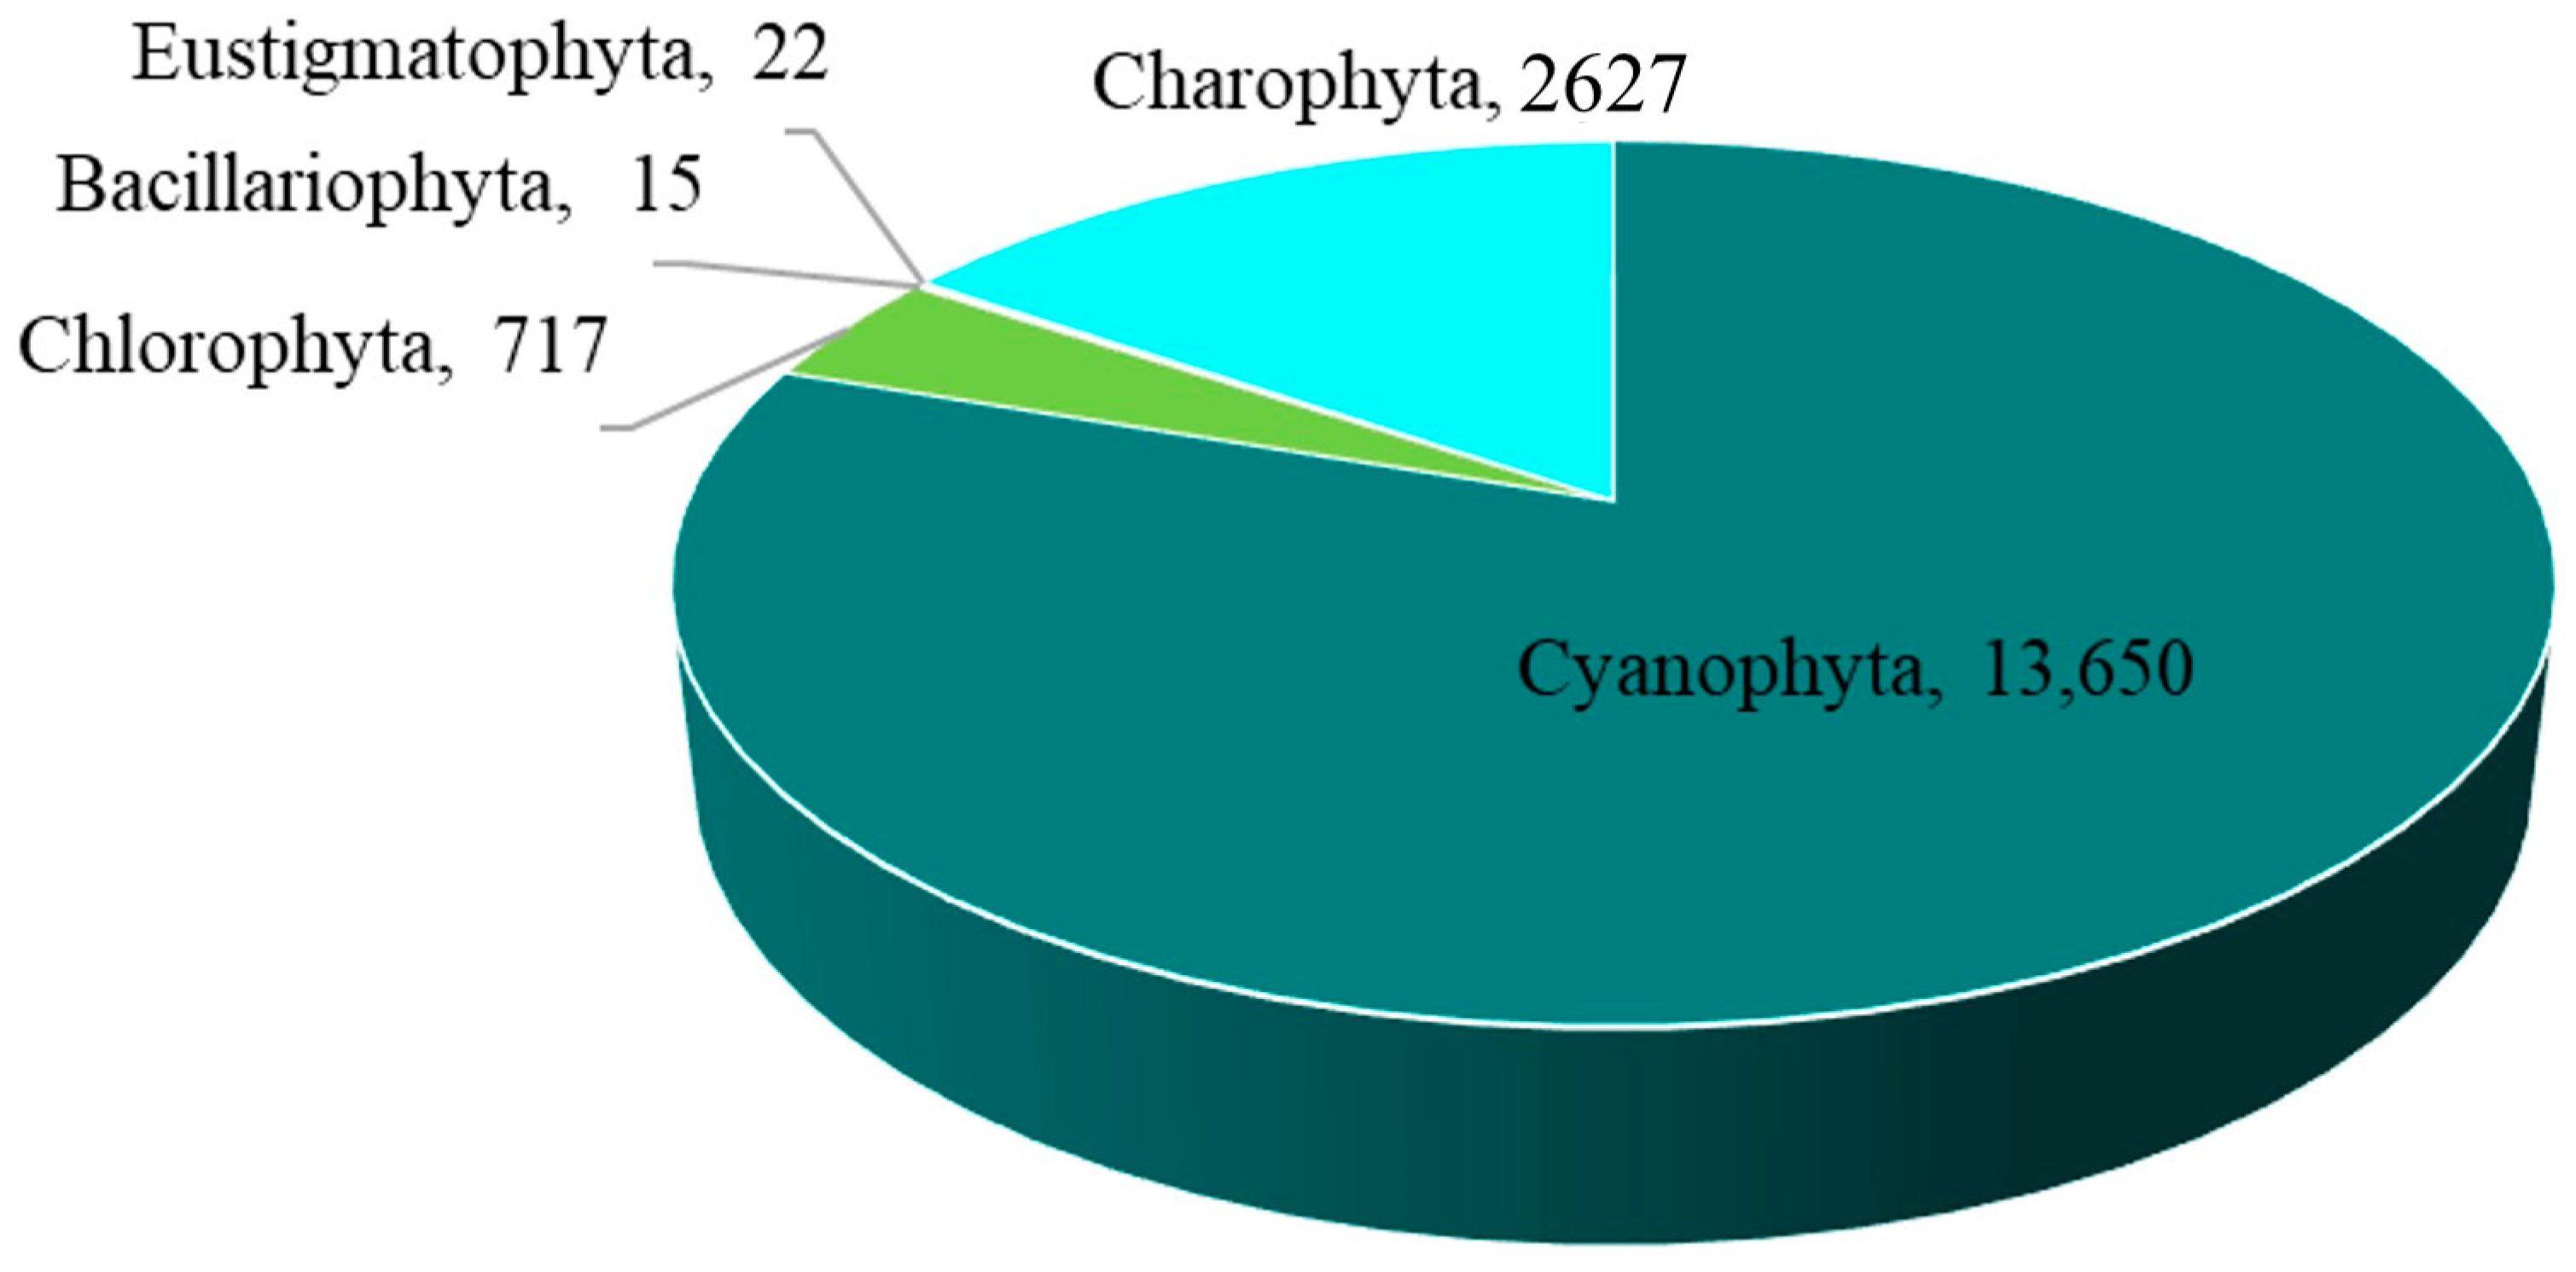
The overall abundance of epiphytic subaerial algae in Bangkok, expressed as a number of sequences, was 17,031 sequences/cm2. Cyanophyta had the highest abundance, followed by Charophyta, Chlorophyta, Eustigmatophyta, and Bacillariophyta (Figure 4 and Table A1).
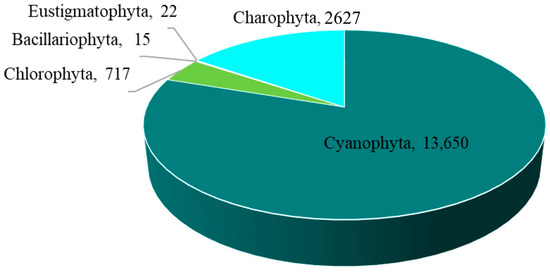
Figure 4.
The abundance of the five phyla of epiphytic subaerial algae found during the wet season in Bangkok expressed as a number of sequences.
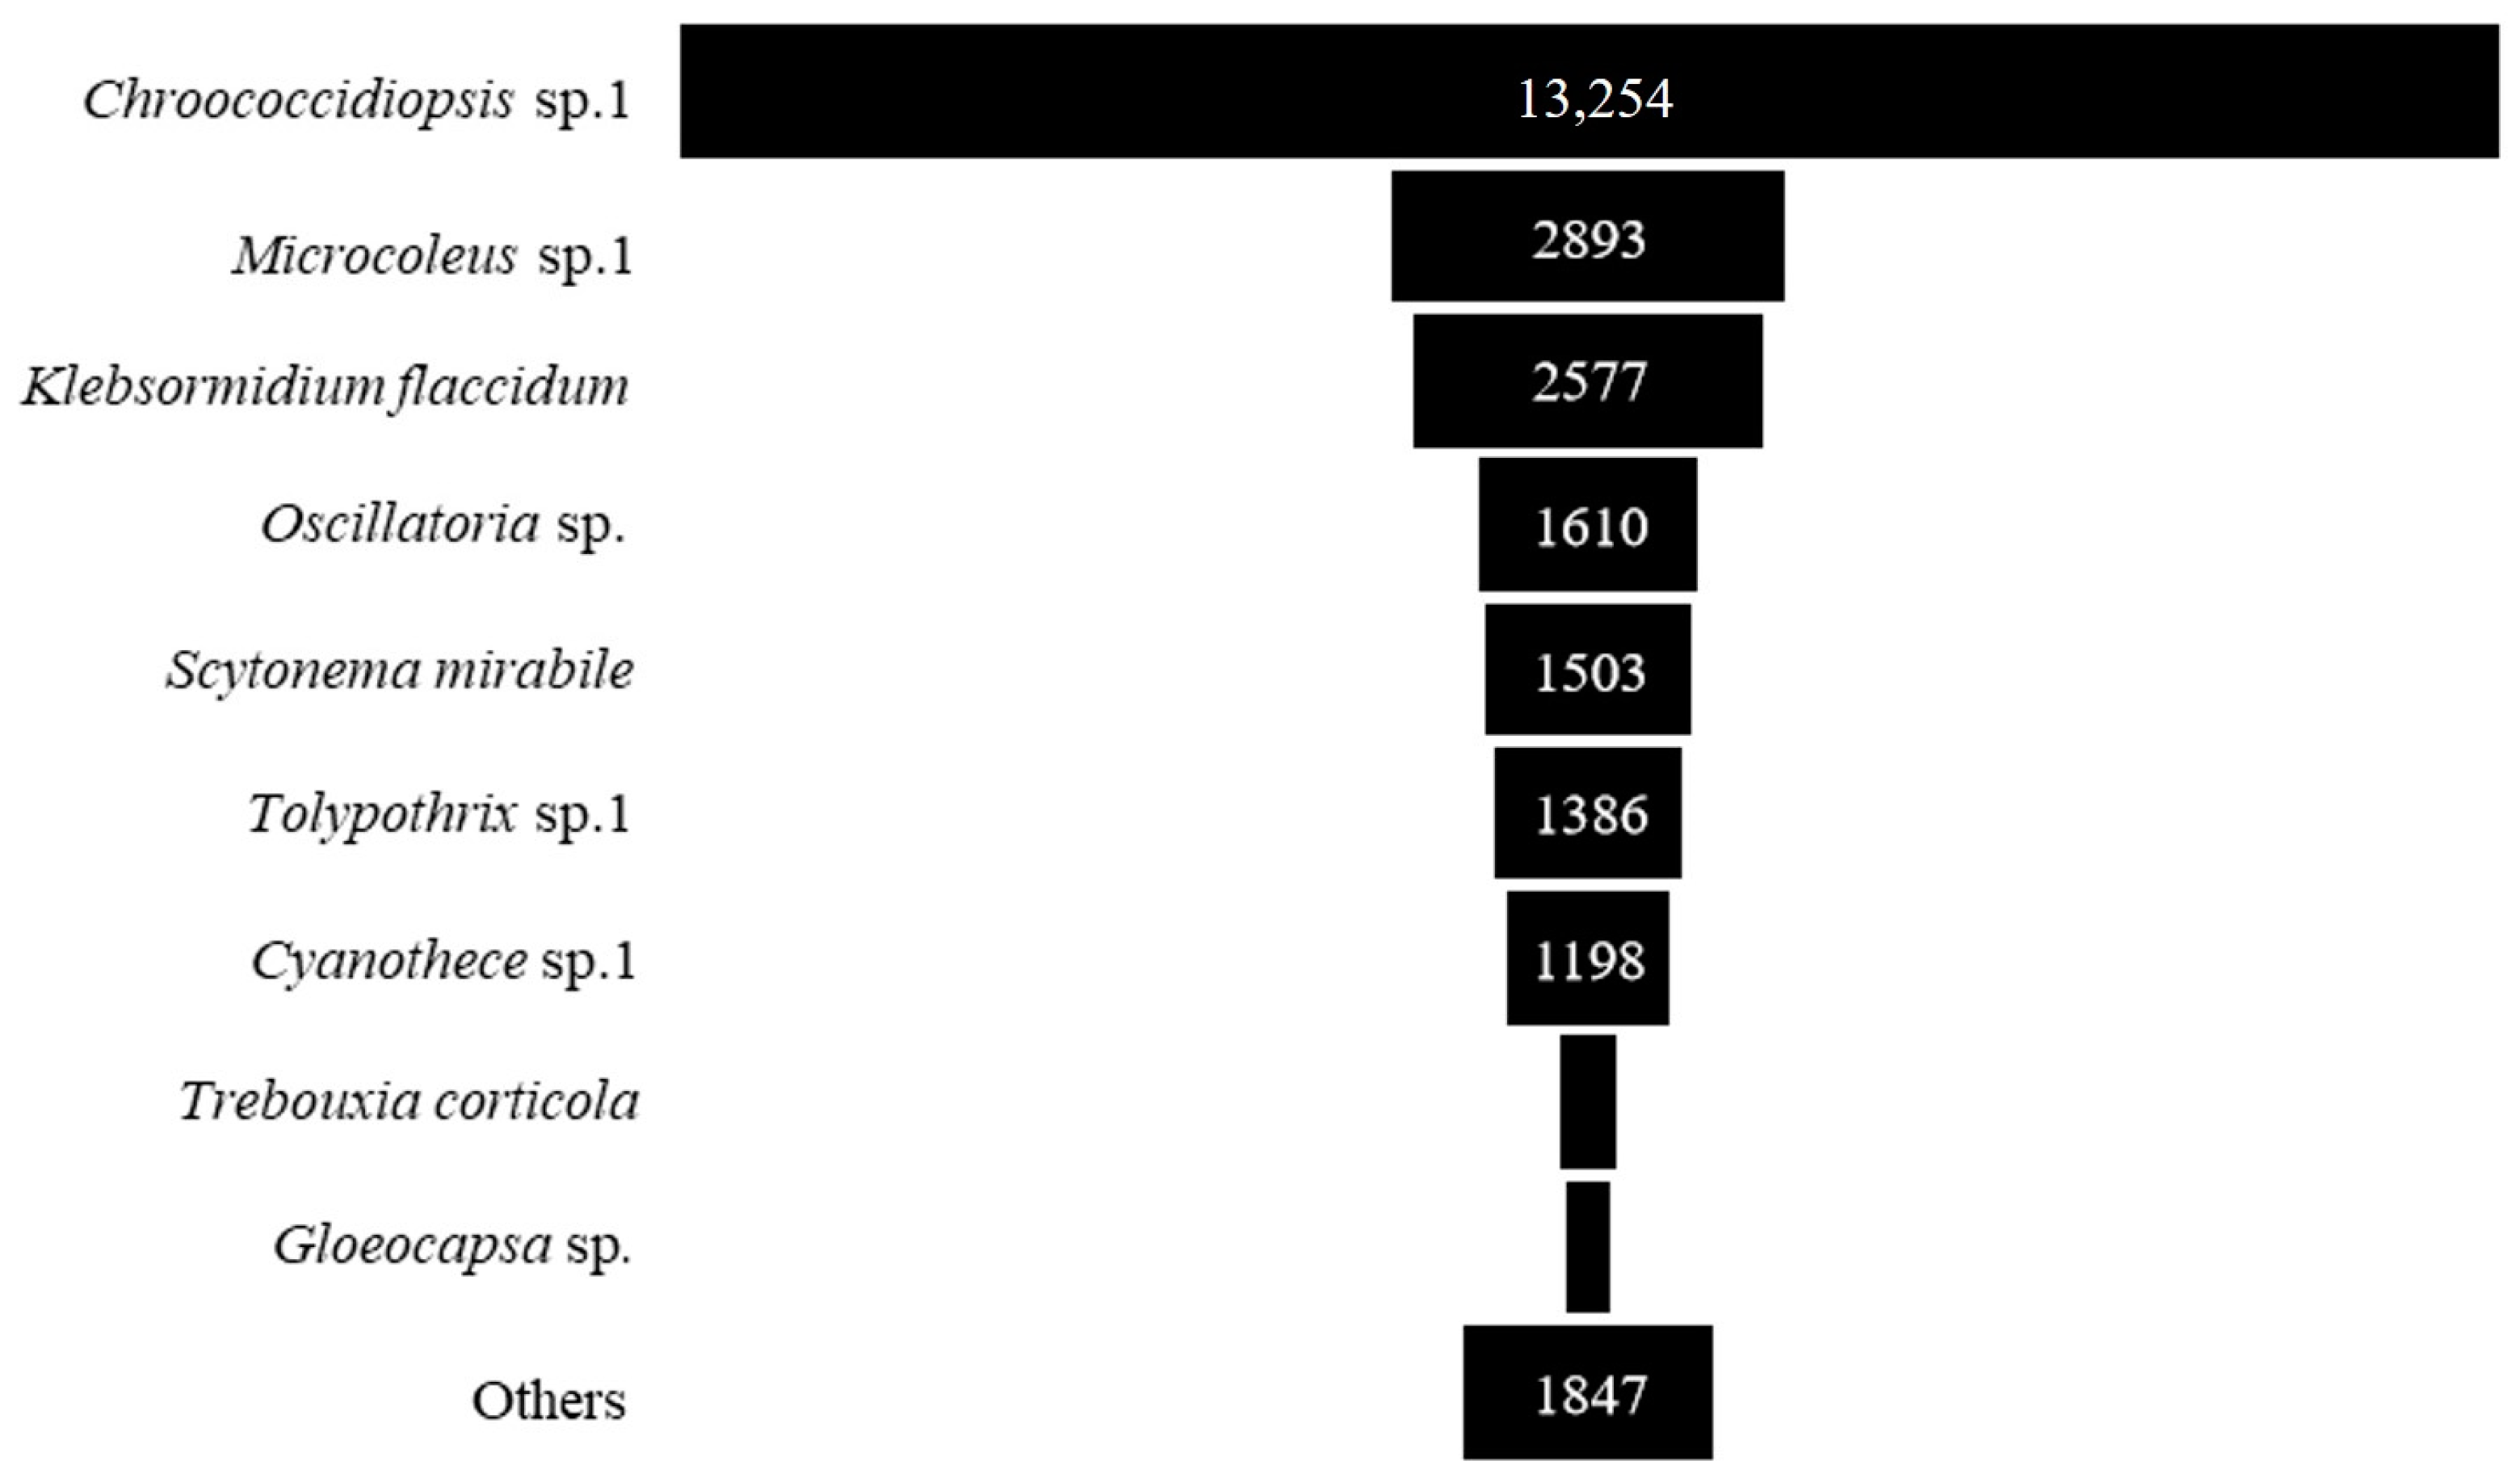
Concerning the most abundant taxa, Chroococcidiopsis sp. 1 had the highest abundance, followed by Microcoleus sp. 1, Klebsormidium flaccidum, Oscillatoria sp., Scytonema mirabile, Tolypothrix sp. 1, Cyanothece sp., Trebouxia corticola and Gloeocapsa sp. (Figure 5 and Table A1).

Figure 5.
The abundance of individuals of the dominant taxa of epiphytic subaerial algae (number of sequences/cm2) found during the wet season in Bangkok.
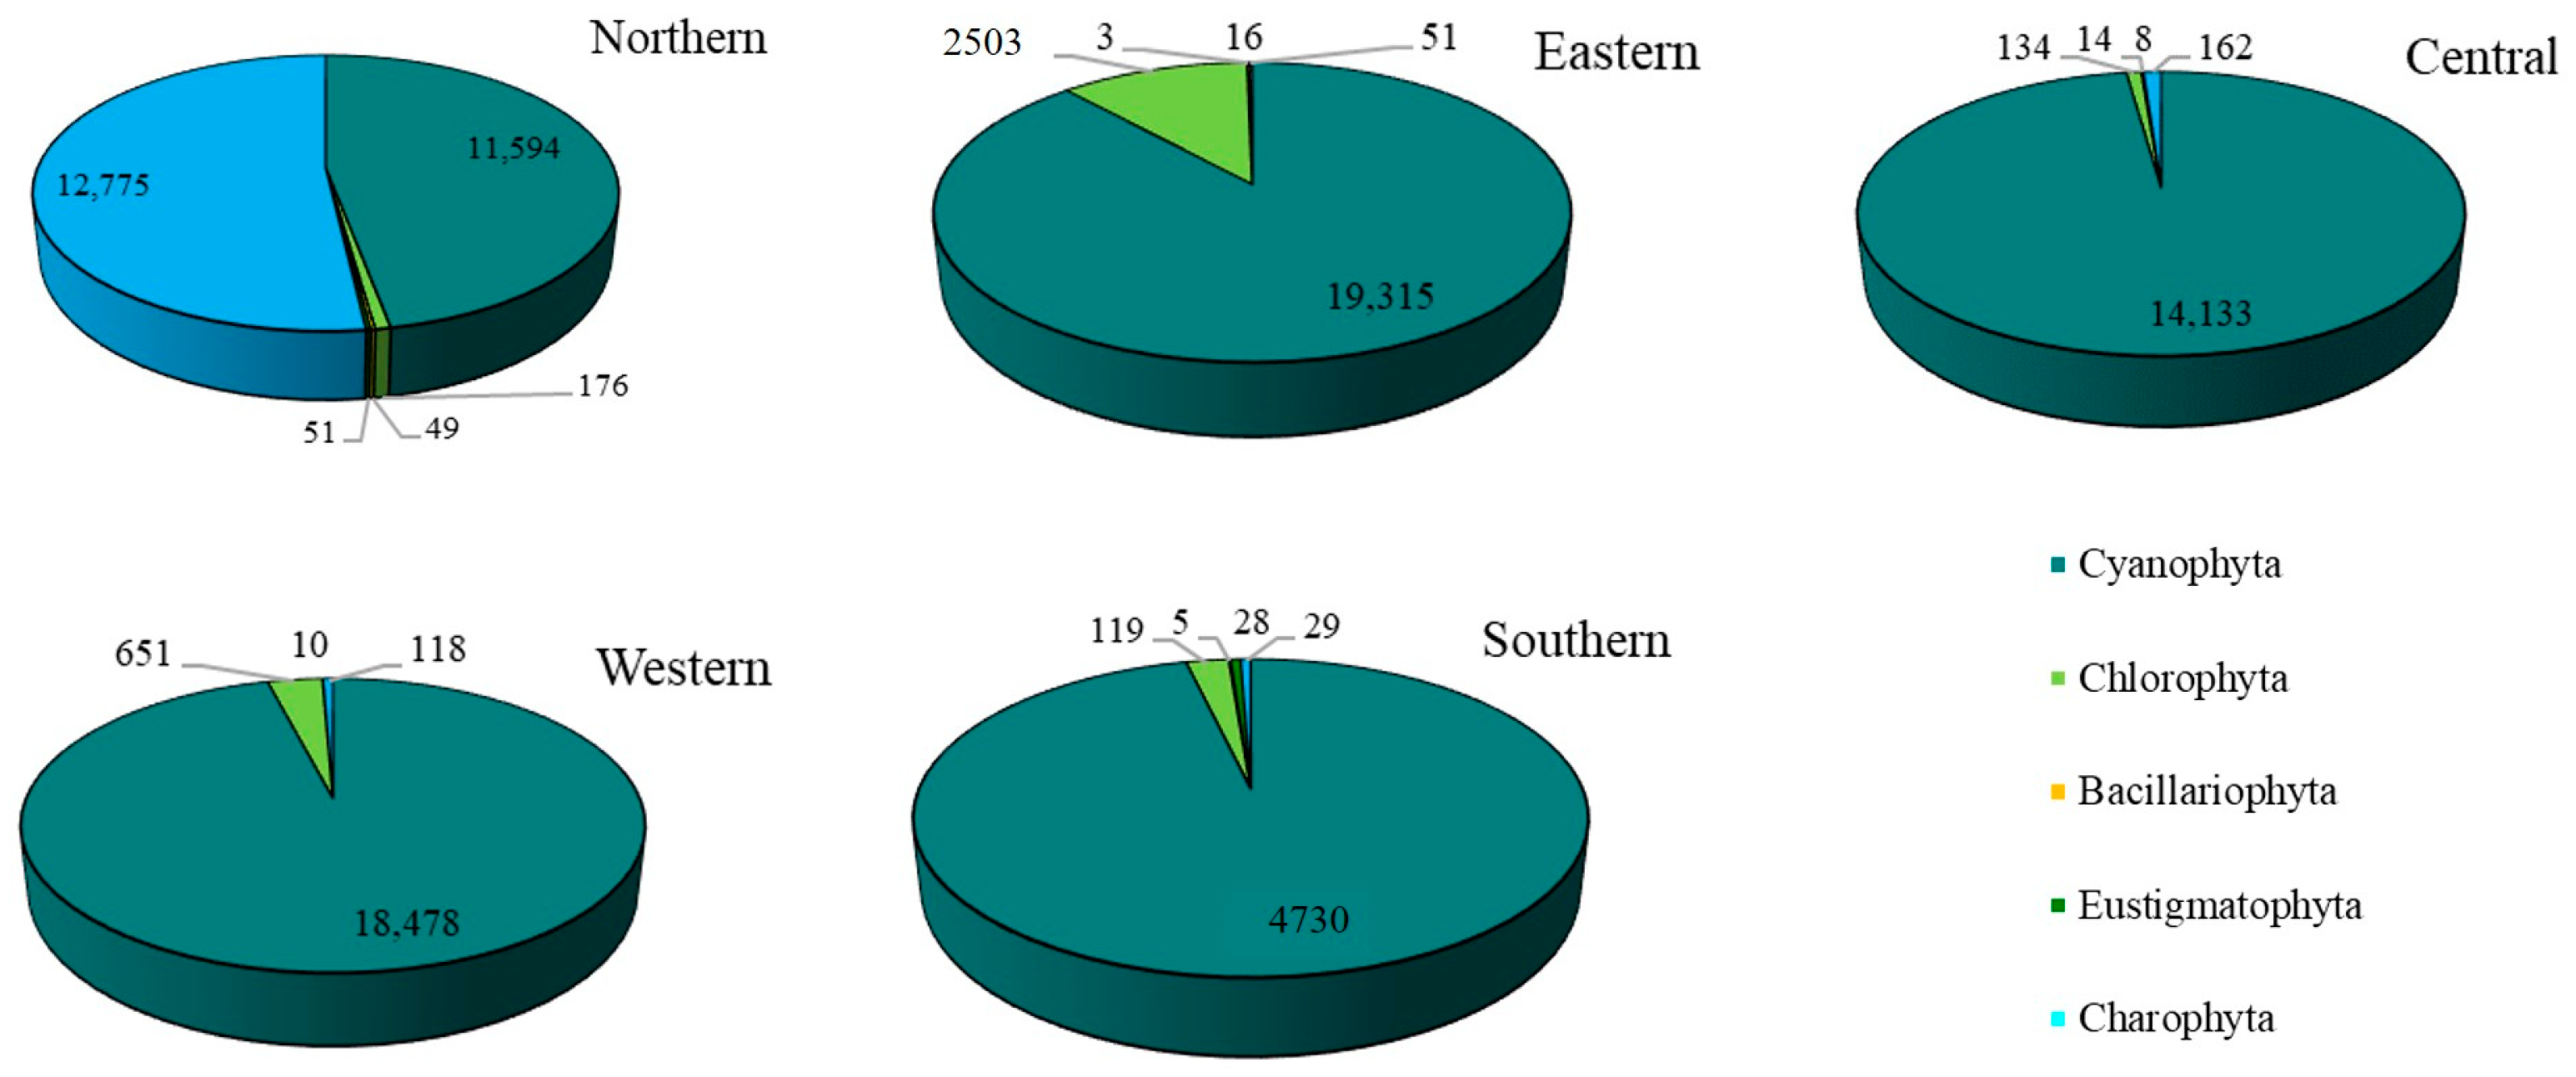
For the epiphytic subaerial algae collected at the five sampling sites in Bangkok, in terms of the number of sequences, Cyanophyta was the most abundant group at four sites. At the fifth (the northern site), Charophyta had a slightly higher number of sequences than Cyanophyta. At the eastern, western, and southern sites, Chlorophyta was the most abundant phylum after the Cyanophyta. At the central site, Chlorophyta and Charophyta were recorded, but in small abundances (see Figure 6).

Figure 6.
The abundance of the phyla of epiphytic subaerial algae found during the wet season at the five sites in Bangkok.
Figure 7 shows the relative abundance of different subaerial epiphytes at the five study sites within Bangkok. At the northern site and southern site, the most abundant taxa were the same, i.e., Klebsormidium flaccidum, Microcoleus sp. 1, and Chroococcidiopsis sp. 1. At the eastern site, Chroococcidiopsis sp. 1, Trebouxia corticola and Cyanothece sp. 1 had the highest abundance. At the central site, the most abundant taxa were Tolypothrix sp. 1, Cyanothece sp. 1 and Microcoleus sp.1; at the western site, Oscillatoria sp., Scytonema mirabile, and Microcoleus sp. 1. From these results it can be seen that in general Microcoleus sp. 1 and Chroococcidiopsis sp. 1 were the taxa with the highest abundance at the 5 sites sampled in Bangkok.
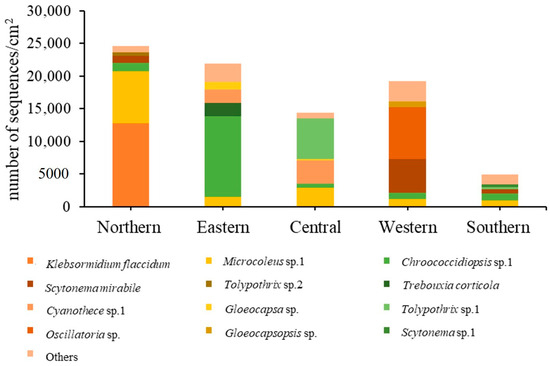
Figure 7.
Taxon abundance of epiphytic subaerial algae expressed in terms of number of sequences at the five study sites in Bangkok.
3.2. Types of Air Pollutants
The air pollutants affecting the general atmospheric air quality at the time of sampling in Bangkok are presented in Figure 8. The amounts of ozone (O3) were at 16.34 to 23.84 ppb. Amounts of nitrogen dioxide (NO2) ranged between 6.67 to 24.18 ppb; carbon monoxide between (CO) 29 and 233 ppb (a large amount), and sulfur dioxide (SO2) between 1.34 and 2.41 ppb. Particulate matter less than 10 microns in size (PM10) was present at high levels, from 26.8 to 53.85 µg/m3. Finally, particulate matter less than 2.5 microns (PM2.5) was present at 10 to 15 µg/m3.
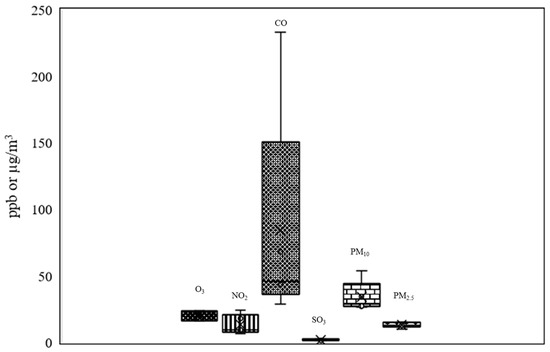
Figure 8.
Air pollutants (O3, NO2, CO, SO2, PM10, and PM2.5) found during the wet season in Bangkok (the error bars meaning standard error; these were the pollutant measurements taken every hour over 24 h (24 times) in algal collection date).
3.3. Index Values for Algal Communities
The diversity index (Shannon–Weaver index (H’)), richness index (Margalef index), equitability, or evenness, index (Pielou index (J’)), and similarity index were determined for the algal communities found at the sampling sites in Bangkok (Table 3 and Table 4). The diversity index ranged between 1.37 and 2.51, with the highest value for the southern site and the lowest value for the northern site. The western site had the highest richness index value (6.19), whereas the lowest was found for the central site (3.84). The equitability index values ranged between 0.30 and 0.54. Finally, the similarity index values ranged from 8.00% to 64.82%, with the highest similarity recorded between the central and southern sites and the lowest similarity between the northern and eastern sites.
Table 3.
The diversity indices, richness indices, and equitability indices for the algal communities found in the five sampling sites in Bangkok.
Table 4.
The similarity indices for the algal communities found at the five sampling sites in Bangkok.
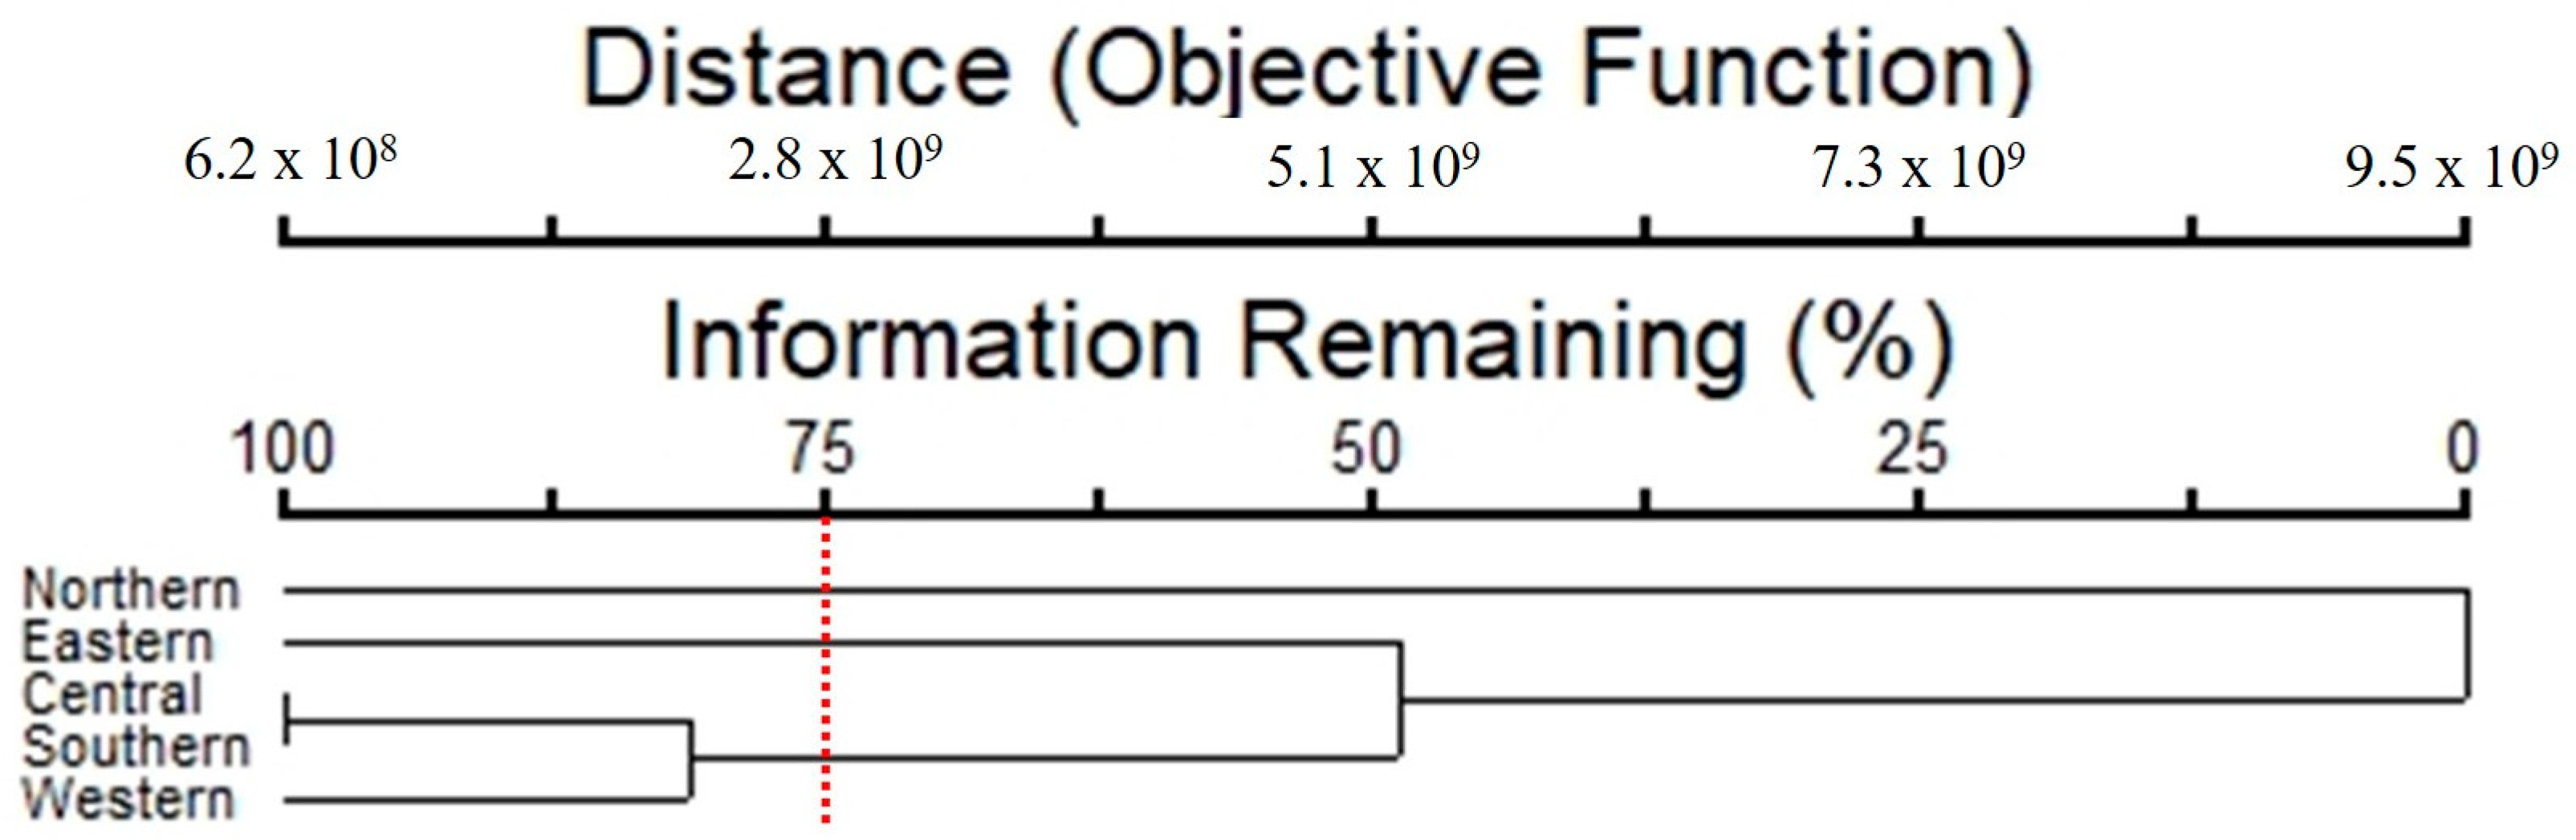
A cluster analysis showed that the composition of taxa and abundance of epiphytic subaerial algae separated the subaerial epiphytic communities into three groups of sampling sites (Figure 9), with 75% of the information remaining. For Group 1, represented by the northern site, Klebsormidium flaccidum, Microcoleus sp. 1, and Chroococcidiopsis sp. 1 were the dominant taxa. In Group 2 (eastern site), Chroococcidiopsis sp. 1, Trebouxia corticola, and Cyanothece sp. were the dominant taxa. In Group 3 (which clustered the central, western, and southern sites), Microcoleus sp.1, and Tolypothrix sp. 1 were the dominant taxa.
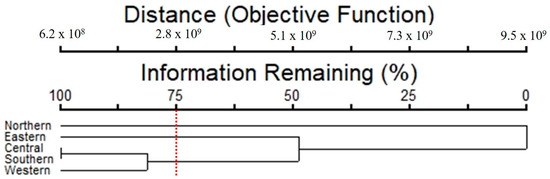
Figure 9.
Cluster analysis results of the epiphytic subaerial algal communities found at the five sampling sites in Bangkok (the red dotted line = separated with 75% of the information remaining).
3.4. Relationship between Diversity of Taxa and Air Pollutants
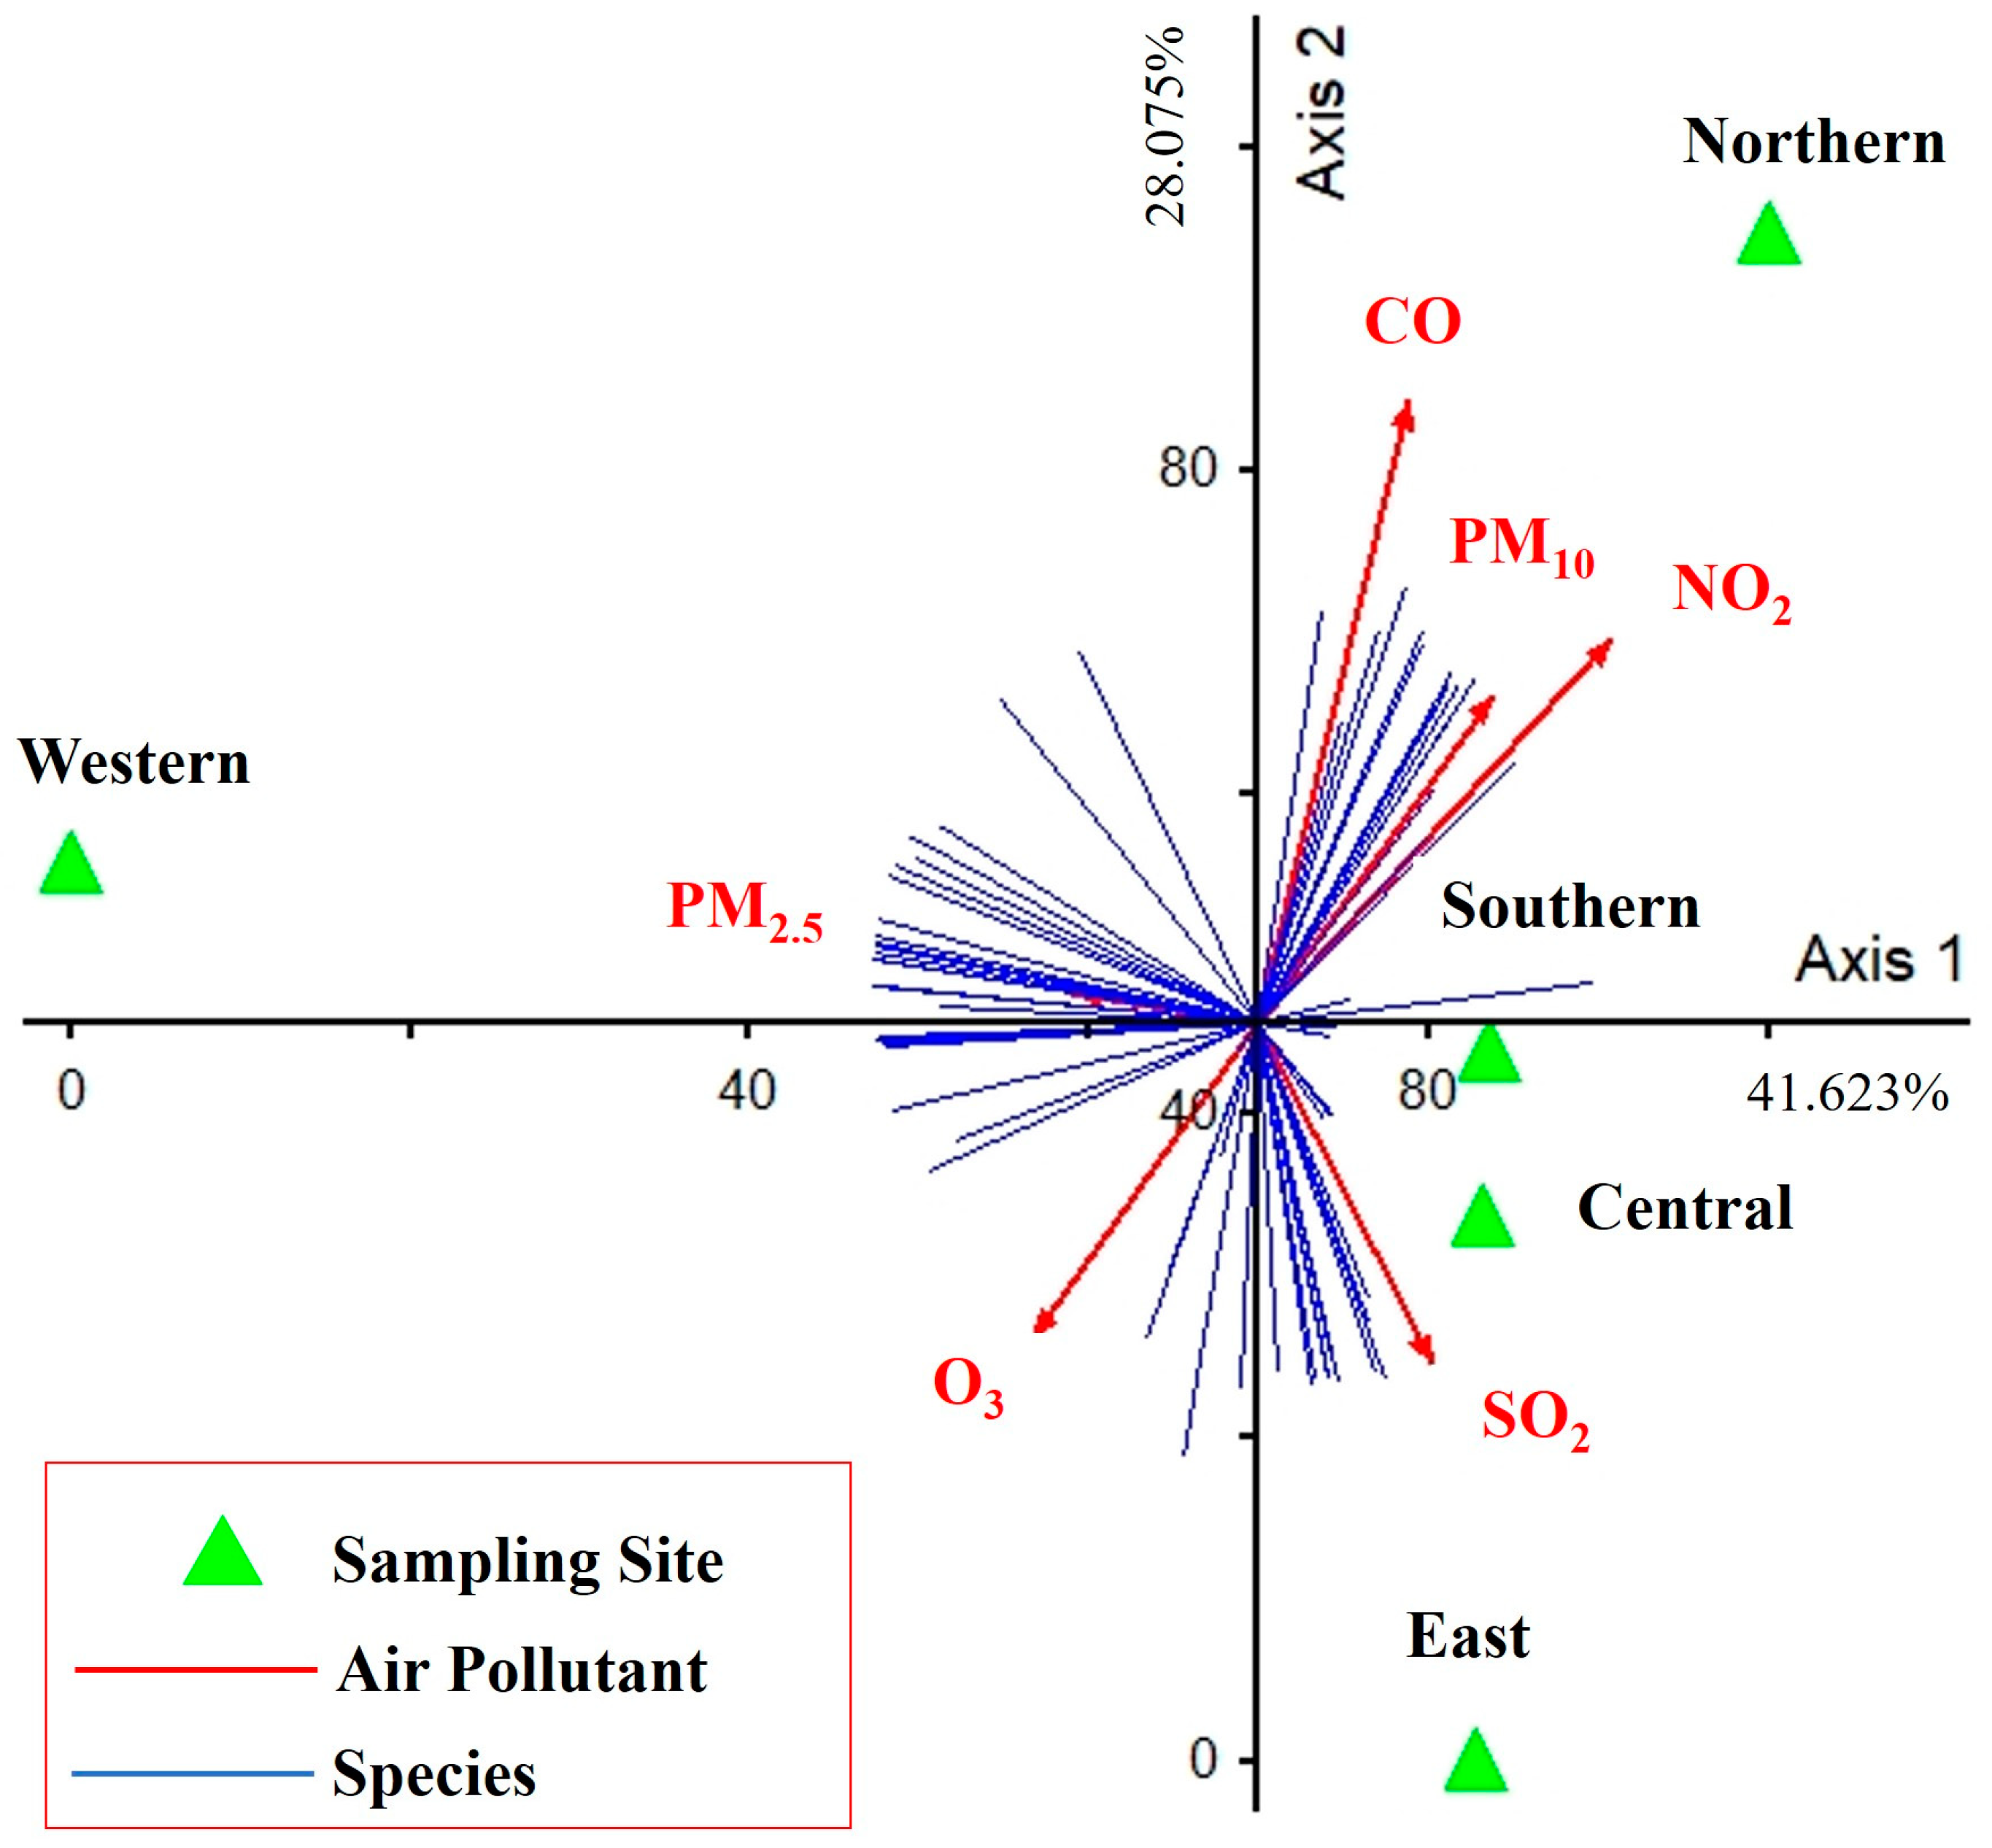
The PCA showed the influence of air pollutants on the diversity and abundance of algal taxa (41.623% and 28.075% of variance explained for the first and second axes, respectively) (Figure 10). Only PM2.5 was a major contributor to the first PCA axis (r = −0.468, r = 0.187), which was directly positively correlated for the western site but negatively correlated for the southern and central sites. CO, NO2, and PM10 were the major contributors to the second PCA axis (r = 0.423, r = 0.856; r = 0.646, r = 0.673; and r = 0.527, r = 0.621, respectively), which was directly positively correlated for the northern site. SO2 also was a major contributor to the second PCA axis (r = 0.455, r = −0.634), which was directly positively correlated with the eastern site. Finally, O3 also was a major contributor to the second PCA axis (r = −0.514, r = −0.611), which was negatively correlated to the northern site.

Figure 10.
PCA performed on data of air pollutants, diversity, and abundance of epiphytic subaerial algae found during the wet season in Bangkok. Axis 1 represents 41.623% and Axis 2 represents 28.075% of the observed variance.
The relationship between the diversity of epiphytic subaerial algae found in the study and air pollutants showed indicated correlations of subaerial taxa with several air pollutants (see Figure 10). The abundance of subaerial taxa was broadly classified into 3 groups related to different air pollutants. The first group, based on PM2.5, was the only major factor on the first PCA axis, meaning that areas with high PM2.5 pollution had a high abundance and composition of most subaerial algal communities. The second group of pollutants, CO, NO2, and PM10, contributed significantly to the second PCA axis and had the same abundance and composition of most subaerial algal communities as PM2.5 but a different taxon group. Conversely, O3 was a similar major contributor to the second PCA axis as CO, NO2, and PM10, but in the opposite direction; that is when the area had high O3, the abundance and diversity of subaerial algal communities was low. Finally, the third group, following SO2, contributed significantly to the second PCA axis in most epiphytic subaerial algae, as did CO, N2, and PM10, but had an impact on several taxa.
The possible relationship between the abundance of each subaerial algal taxon and chemical pollutants was tested using Pearson’s correlation coefficient (r). Pearson’s correlation coefficient (r) showed that all air pollutants had a significant correlation * = statistically significant difference (p ≤ 0.05), 0.01, ** = high statistically significant difference (p ≤ 0.01)) with the abundance of several epiphytic subaerial algae (Table A2). Cyanothece sp. 2 correlated with many air pollutants: it was negatively correlated with O3 (−0.941 **) and positively with NO2 (0.988 **) and CO (0.914 *) (Table A2). Leptolyngbya sp. 1, Nostoc carneum, Phormidium tinctorium, Synechococcus sp., Symbiochloris irregularis, Stichococcus sp., Chlamydomonas zebra, and Nannochloropsis oculata were positively correlated with CO (0.986 **) and PM10 (0.964 **). Significant correlations with these pollutants were also detected for Klebsormidium flaccidum (0.986 **) (0.963 **), Tolypothrix sp. 2 (0.925 *) (0.999 **), Nostoc sp. 1 (0.975 *) (0.943 *), Microcoleus sp. 1 (0.939 *) (0.916 *), Oscillatoria nigro-viridis (0.949 *) (0.893 *), Cylindrospermum sp. (0.949 *) (0.994 **), Diadesmis sp. (0.986 **) (0.940 *), and Parachlorella kessleri (0.957 *) (0.980 **).
Chroococcidiopsis thermalis and Watanabea reniformis were positively correlated with SO2 (0.880 * and 0.957 *, respectively). Scytonema hofmannii (0.964 **) was positively correlated with CO. Calothrix sp. 4 (0.917 *) was positively correlated with O3, whereas Chloromonas perforata (−0.962 **) was negatively correlated with this pollutant. Symbiochloris reticulata (0.944*) was positively correlated with PM10. Finally, Acutodesmus sp. (−0.896 *) was negatively correlated with PM2.5.
4. Discussion
The 23S rDNA maker is a ~410 bp long region present in the genome of cyanobacteria and encoded in the chloroplast of eukaryotic algae [27]. Sherwood and Presting [27] successfully tested a couple of universal primers that amplify this region in a wide range of cyanobacterial and eukaryotic algal lineages. Since then, universality and easy amplification have made 23S rDNA a popular tool for metabarcoding studies of many microalgal communities; this marker has been largely used for freshwater and marine communities, usually in combination with other markers (e.g., [28,38,39,40,41,42,43]). It has been less frequently used for terrestrial and aerial communities (e.g., [6,9,44,45,46]), although with interesting results that unraveled a great diversity of microalgal lineages. The high diversity that we discovered for the subaerial epiphytic assemblages of Bangkok agreed with these studies and was not unexpected since this city is in a tropical region in Southeast Asia, with a humid climate characterized by high levels of rainfall, and therefore particularly suitable for the growth of subaerial algae [13,16,47,48]. Our results, however, also highlight some potential limitations for the use of this marker. Although its universality and easy amplification are its major strengths [41], it looks like, in some eukaryotic lineages, this marker is not easily amplified. This is suggested by the fact that in our results, we could not retrieve any sequences referable to the green algal order Trentepohliales; notably, this was also the case in other studies that used 23S rDNA for aerial algal communities [6,9,45]. The Trentepohliales is an order of subaerial green algae widespread in areas with humid climates, particularly in tropical regions [3,49,50]. Species of this order have been reported from urban habitats in the tropics [51,52,53], where they typically form bright red or orange patches on the colonized surfaces. Their dispersal takes place mainly by sporangia and vegetative fragments that are carried by wind and rain [3,49]. Therefore, it is reasonable to expect that metabarcoding of subaerial communities in tropical regions should recover some sequences of Trentepohliales, considering also that other studies based on high-throughput sequencing that used different markers recovered large sequences of these algae [7,8], revealing their great phylogenetic diversity in natural environments. This result is even more striking considering that the sampling for this study was carried out in Bangkok’s wet season, which should be a favorable time of the year for the growth of Trentepohliales. We suggest that the nature of this unexpected result is probably technical (i.e., the primers normally used for 23S rDNA do not work for the Trentepohliales), and we remark that future studies specifically focused on amplification of this marker in these algae are necessary.
The other limitation of the use of 23S rDNA with subaerial communities is the currently insufficient resolution at a species level, related to the insufficient taxon coverage in databases for this marker. Sherwood et al. [6], studying airborne algal communities in O’ahu, Hawaiian Islands, remarked that much of the diversity discovered by these authors appeared to be still uncharacterized at the species level, and this seems to be partially still the case today. When taxon annotations were made, some of our ASVs were assigned to taxa that are known to occur in freshwater (e.g., Dolichospermum compactum, Cylindrospermum stagnale, Anabaena spp.) or in marine habitats (e.g., Lyngbya aestuarii, Cylindrotheca closterium), so their presence on tree bark in an urban area was unexpected. It cannot be excluded that this might be due to incorrect identification of some strains for which sequences were deposited in public databases with identification wrongly assigned to these taxa. However, it is more likely that this incongruity is due to the limited coverage of subaerial taxa in 23S databases (so freshwater and marine taxa were the nearest matches for some of the ASVs retrieved in our results). If, as we expect, this is the case, future studies extending the public datasets for subaerial taxa will gradually resolve these discrepancies.
In conclusion, based on our results, we argue that 23S rDNA is a valuable tool with the potential to unravel a great deal of diversity in subaerial algal communities. However, the technical aspects of its amplification should be further investigated, and we agree with [41] that it should be used in combination with other markers.
Cyanobacteria (Cyanophyta) had the highest diversity and abundance among the epiphytic subaerial algae recorded in our study, followed by chlorophytan green algae and diatoms (Bacillariophyta). This result agrees well with studies from other tropical and subtropical regions in which microalgal communities were sampled from air and soil based on both culturing and metabarcoding approaches [6,9,45,54,55]. The tropics are well known to host a large diversity of cyanobacteria, which often grow in large amounts on many surfaces [56], especially artificial [3,57]. Chlorophyte green algae have a wide range of thallus and cellular organization compared to other groups of microalgae and have developed several adaptations for survival and growth in subaerial habitats [3]. Diatoms are another algal group widely distributed in this type of environment [56,58,59]. Because they are limited by the availability of dissolved silica, their numbers are higher during periods of higher humidity and in habitats in which silica is more readily available [56,60]. In a study similar to ours conducted in tropical South America and Hawaii, recorded environmental sequences were inferred to be diatoms.
ASVs assigned to Chroococcidiopsis sp. 1, Microcoleus sp. 1, and Klebsormidium flaccidum represented the most abundant subaerial algae found in Bangkok. Unicellular cyanobacteria belonging to the genus Chroococcidiopsis are well-known members of terrestrial microalgal communities; taxa referred to this genus have been reported to be extremely resistant to desiccation, UV irradiation, salt toxicity, and high temperatures [61,62]. They grow well in high light intensities and are protected from high-energy UV light by pigments such as carotenoids and scytonemin [61,62]. Microcoleus is a widespread genus of filamentous cyanobacteria that is resistant to desiccation thanks to several desiccation tolerance mechanisms, including accumulation of trehalose [63], stabilization of the photosynthetic apparatus [64], and accumulation of UV-protecting pigments [65]. A recent study reported the expression of genes involved in the oxidative and osmotic stress response, the desaturation of membrane lipids, and the production of EPS at the onset of desiccation [66]. Many read sequences recovered from our samples were assigned to Klebsormidium flaccidum, which was one of the most common taxa recorded in this study. The cosmopolitan genus Klebsormidium includes 24 species distributed in a wide range of freshwater and terrestrial habitats [37,67,68,69]. Species of Klebsorbidium are fast-evolving organisms that may rapidly develop physiological adaptations, enabling them to colonize new habitats, including some with extreme conditions [70,71]. For several terrestrial species, the capacity to withstand extreme desiccation has been demonstrated [72,73], demonstrating good adaptation to terrestrial habitats, including urban ones [74]. Sherwood et al. [9] reported Klesbormidium as an occasionally abundant component of the airborne algal diversity in O’ahu without an evident correlation with seasonality. Further investigation is necessary to assess whether the abundance of this genus has similar variation in Bangkok.
The wet season in Bangkok has an AQI of 28, or green, which indicates that a “good quality of air” is present and that residents “can participate in outdoor activities and travel as usual”. The AQI is a universal index with five levels from 0 to 201 or more [75,76]. It is widely used in many countries, such as the United States, Australia, Singapore, Malaysia, and Thailand, and measures levels of O3, NO2, CO, SO2, PM10, and PM2.5 [75,76,77].
A significant relationship between air pollutants and some epiphytic subaerial algae, in particular PM10, was detected. Cyanothece sp. 2 corresponds to Cyanothece sp. ATCC 51142 in the NCBI (National Center for Biotechnology Information of USA) databases. This study showed a negative correlation with O3 and a positive correlation with NO2 and CO. Species of Cyanothece are widely distributed in various environments worldwide, usually at a pH lower than 7 [78,79,80,81,82]. Typically, this genus is associated with water in benthic marine environments, rice fields, acidic marshes, peaty bogs, intertidal zones, moors, and clear lakes, but it is sometimes found in mountain soils [78,83], and records of it are also available from rocks and trees. The taxa Leptolyngbya sp. 1, Nostoc carneum, Phormidium tinctorium, Synechococcus sp., Symbiochloris irregularis, Stichococcus sp., Chlamydomonas zebra, Nannochloropsis oculata, and Klebsormidium flaccidum were also positively correlated with CO and PM10 and were found only at some sites. These correlations suggest that these taxa are potential candidates to be used as bioindicators of these pollutants for the Bangkok area. This agrees with the highly tolerant nature of some of these taxa demonstrated in physiological and ecological studies. We acknowledge, however, that further studies are necessary to explore this potential in full. Our study was restricted to a limited timespan corresponding to a single season (the wet season), and other studies have shown that communities of aerial algae may be subject to substantial variation in relation to seasonality [9]. We performed our sampling during the wet season, which is a time of the year with high rainfall and temperatures; these conditions have been reported to be associated with the highest abundance of cyanobacteria [9]. In addition, experimental laboratory studies performed in controlled conditions are necessary to test the tolerance of the candidate microalgae to individual pollutants.
5. Conclusions
This study unraveled the presence of 101 taxa of epiphytic subaerial algae, consisting mainly of Cyanophyta, on tree barks in Bangkok. In terms of abundance, the three most abundant taxa were Chroococcidiopsis sp. 1, Microcoleus sp. 1, and Klebsormidium flaccidum. All environmental pollutants had correlations with the abundance of epiphytic subaerial algae. Cyanothece sp. 2 was the taxon that showed the strongest correlation and has, therefore, the best potential to be used as a bioindicator, being negatively correlated with O3 and positively correlated with NO2 and CO.
Author Contributions
Conceptualization, S.S. and N.S.; Methodology, S.S., N.S. and F.R.; Software, S.S.; Validation, S.S. and N.S.; Formal Analysis, S.S.; Investigation, S.S.; Resources, S.S.; Data Curation, S.S.; Writing—Original Draft Preparation, S.S.; Writing—Review and Editing, S.S., N.S. and F.R.; Visualization, S.S. and N.S.; Supervision, N.S.; Project Administration, N.S.; Funding Acquisition, S.S. and N.S. All authors have read and agreed to the published version of the manuscript.
Funding
This work was financially supported by the Office of the Ministry of Higher Education, Science, Research and Innovation; and the Thailand Science Research and Innovation through the Kasetsart University Reinventing University Program 2021. Additionally, funding was received from the International SciKU Branding (ISB), Faculty of Science, Kasetsart University.
Institutional Review Board Statement
Not applicable.
Data Availability Statement
The data presented in this study are available on request from the corresponding author, Nuttha Sanevas. E-mail: fscintsv@ku.ac.th.
Acknowledgments
We would like to express my sincere gratitude to Ekaphan Kraichak and the members of BEER LAB for their generous assistance and support in facilitating the use of the laboratory for DNA extraction.
Conflicts of Interest
The authors declare no conflicts of interest.
Appendix A
Table A1.
The abundances of taxa (number of sequences/cm2) of epiphytic subaerial algae found during the wet season in Bangkok at five sites.
Table A1.
The abundances of taxa (number of sequences/cm2) of epiphytic subaerial algae found during the wet season in Bangkok at five sites.
| Northern Site | Eastern Site | Central Site | Western Site | Southern Site | |
|---|---|---|---|---|---|
| Oscillatoria sp. | 163 | 9 | 22 | 7911 | 102 |
| Scytonema mirabile | 1106 | 265 | 255 | 5232 | 656 |
| Microcoleus sp. 1 | 7941 | 1454 | 2922 | 1144 | 1004 |
| Chroococcidiopsis sp. 1 | 1302 | 12,391 | 602 | 962 | 1013 |
| Gloeocapsopsis sp. | 7 | 28 | 8 | 900 | 19 |
| Stanieria sp. | 16 | 7 | 18 | 793 | 14 |
| Tolypothrix sp. 1 | 61 | 140 | 6186 | 242 | 301 |
| Microchaete diplosiphon | 0 | 0 | 0 | 199 | 3 |
| Scytonema sp. 1 | 0 | 164 | 22 | 160 | 444 |
| Tolypothrix sp. 2 | 506 | 244 | 140 | 152 | 165 |
| Calothrix sp. 3 | 36 | 0 | 0 | 131 | 1 |
| Pleurocapsa minor | 90 | 22 | 20 | 122 | 32 |
| Cyanothece sp. 1 | 4 | 2057 | 3543 | 92 | 291 |
| Hyella patelloides | 0 | 0 | 0 | 78 | 2 |
| Calothrix sp. 2 | 64 | 6 | 18 | 40 | 156 |
| Nostoc piscinale | 0 | 1 | 1 | 39 | 0 |
| Chondrocystis sp. | 2 | 0 | 0 | 37 | 0 |
| Chroococcidiopsis thermalis | 15 | 98 | 10 | 33 | 52 |
| Brasilonema sp. | 0 | 2 | 0 | 17 | 2 |
| Calothrix sp. 1 | 0 | 396 | 6 | 17 | 6 |
| Cyanothece sp. 3 | 6 | 3 | 0 | 13 | 5 |
| Gloeocapsa sp. | 164 | 1118 | 282 | 13 | 95 |
| Microcoleus sp. 3 | 1 | 3 | 0 | 12 | 0 |
| Lusitaniella coriacea | 0 | 0 | 0 | 12 | 198 |
| Cyanothece sp. 4 | 0 | 3 | 0 | 11 | 0 |
| Nostoc linckia | 1 | 76 | 1 | 11 | 0 |
| Calothrix brevissima | 0 | 2 | 3 | 10 | 0 |
| Cyanothece sp. 5 | 2 | 0 | 0 | 10 | 0 |
| Nostoc sp. 1 | 61 | 1 | 1 | 8 | 0 |
| Scytonema hofmannii | 33 | 0 | 11 | 8 | 12 |
| Oscillatoria nigro-viridis | 28 | 0 | 0 | 8 | 0 |
| Nostoc sp. 2 | 0 | 0 | 0 | 6 | 0 |
| Cylindrospermum stagnale | 0 | 551 | 13 | 6 | 0 |
| Scytonema crispum | 0 | 0 | 7 | 5 | 17 |
| Gloeobacter kilaueensis | 0 | 0 | 0 | 5 | 0 |
| Coleofasciculus chthonoplastes | 1 | 0 | 0 | 5 | 2 |
| Oculatella neakameniensis | 0 | 0 | 0 | 4 | 0 |
| Leptolyngbya sp. 2 | 0 | 0 | 0 | 4 | 1 |
| Leptolyngbya sp. 3 | 0 | 0 | 0 | 4 | 0 |
| Scytonema sp. 2 | 0 | 7 | 0 | 3 | 0 |
| Lyngbya aestuarii | 0 | 0 | 0 | 3 | 0 |
| Calothrix sp. 4 | 0 | 3 | 5 | 3 | 0 |
| Synechococcus lividus | 0 | 0 | 0 | 2 | 4 |
| Oscillatoria acuminata | 0 | 0 | 0 | 2 | 0 |
| Trichormus azollae | 0 | 0 | 0 | 1 | 0 |
| Nodosilinea sp. | 0 | 0 | 0 | 1 | 0 |
| Thermosynechococcus sp. | 0 | 0 | 0 | 1 | 0 |
| Crinalium epipsammum | 0 | 0 | 0 | 1 | 0 |
| Sphaerospermopsis kisseleviana | 0 | 0 | 0 | 1 | 0 |
| Fischerella muscicola | 0 | 19 | 1 | 1 | 0 |
| Pleurocapsa sp. | 1 | 0 | 0 | 1 | 0 |
| Dolichospermum compactum | 2 | 0 | 0 | 0 | 72 |
| Stanieria cyanosphaera | 2 | 0 | 0 | 0 | 23 |
| Cyanothece sp. 2 | 40 | 4 | 0 | 0 | 22 |
| Nostoc punctiforme | 1 | 211 | 2 | 0 | 15 |
| Cylindrospermum muscicola | 0 | 0 | 0 | 0 | 1 |
| Calothrix sp. 6 | 0 | 0 | 0 | 0 | 1 |
| Anabaena sp. 1 | 0 | 0 | 25 | 0 | 1 |
| Calothrix sp. 5 | 0 | 0 | 5 | 0 | 0 |
| Jaaginema litorale | 9 | 0 | 4 | 0 | 0 |
| Cylindrospermum sp. | 75 | 13 | 0 | 0 | 0 |
| Cyanothece sp. 6 | 0 | 6 | 0 | 0 | 0 |
| Camptylonemopsis sp. | 0 | 3 | 0 | 0 | 0 |
| Gloeocapsopsis crepidinum | 0 | 2 | 0 | 0 | 0 |
| Chroococcidiopsis sp. 2 | 0 | 2 | 0 | 0 | 0 |
| Cyanobium gracile | 0 | 1 | 0 | 0 | 0 |
| Leptolyngbya sp. 1 | 5 | 0 | 0 | 0 | 0 |
| Nostoc carneum | 3 | 0 | 0 | 0 | 0 |
| Phormidium tinctorium | 2 | 0 | 0 | 0 | 0 |
| Synechococcus sp. | 2 | 0 | 0 | 0 | 0 |
| Diadesmis sp. | 49 | 3 | 8 | 5 | 5 |
| Nitzschia sp. | 0 | 0 | 0 | 3 | 0 |
| Cylindrotheca closterium | 0 | 0 | 0 | 1 | 0 |
| Watanabea reniformis | 21 | 97 | 17 | 16 | 53 |
| Ignatius tetrasporus | 37 | 20 | 5 | 20 | 27 |
| Nannochloris normandinae | 17 | 135 | 36 | 47 | 13 |
| Scenedesmus | 4 | 104 | 24 | 236 | 13 |
| Trebouxia corticola | 5 | 2090 | 38 | 6 | 5 |
| Trebouxia australis | 0 | 9 | 0 | 14 | 2 |
| Chloromonas perforata | 1 | 0 | 0 | 0 | 2 |
| Pyramimonas disomata | 3 | 13 | 0 | 232 | 2 |
| Xylochloris irregularis | 0 | 1 | 0 | 6 | 1 |
| Lobosphaera incisa | 3 | 13 | 0 | 18 | 1 |
| Edaphochlorella mirabilis | 0 | 4 | 2 | 2 | 1 |
| Dilabifilum sp. | 0 | 0 | 0 | 46 | 0 |
| Heterochlorella | 0 | 0 | 4 | 5 | 0 |
| Friedmannia sp. | 0 | 0 | 0 | 1 | 0 |
| Symbiochloris reticulata | 12 | 7 | 0 | 1 | 0 |
| Acutodesmus sp. | 0 | 2 | 5 | 0 | 0 |
| Parachlorella kessleri | 46 | 6 | 4 | 0 | 0 |
| Trebouxia decolorans | 0 | 1 | 0 | 0 | 0 |
| Symbiochloris irregularis | 20 | 0 | 0 | 0 | 0 |
| Stichococcus sp. | 4 | 0 | 0 | 0 | 0 |
| Chlamydomonas zebra | 2 | 0 | 0 | 0 | 0 |
| Monodopsis sp. 2 | 22 | 16 | 14 | 0 | 28 |
| Nannochloropsis oculata | 29 | 0 | 0 | 0 | 0 |
| Chlorokybus atmophyticus | 0 | 0 | 0 | 1 | 21 |
| Klebsormidium sp. 2 | 12 | 3 | 35 | 11 | 6 |
| Klebsormidium sp. 1 | 0 | 19 | 13 | 83 | 1 |
| Klebsormidium flaccidum | 12,763 | 10 | 91 | 22 | 0 |
| Klebsormidium sp. 3 | 0 | 20 | 23 | 0 | 0 |
Table A2.
Pearson’s correlation coefficient (r) of CO, NO2, O3, PM2.5, PM10, and SO2 found during the wet season in Bangkok (p ≤ 0.05, 0.01, n = 30 and * = statistically significant difference (p ≤ 0.05), 0.01, ** = high statistically significant difference (p ≤ 0.01)).
Table A2.
Pearson’s correlation coefficient (r) of CO, NO2, O3, PM2.5, PM10, and SO2 found during the wet season in Bangkok (p ≤ 0.05, 0.01, n = 30 and * = statistically significant difference (p ≤ 0.05), 0.01, ** = high statistically significant difference (p ≤ 0.01)).
| CO | NO2 | O3 | PM2.5 | PM10 | SO2 | |
|---|---|---|---|---|---|---|
| Oscillatoria sp. | −0.236 | −0.509 | 0.400 | 0.498 | −0.358 | −0.547 |
| Scytonema mirabile | −0.097 | −0.378 | 0.274 | 0.549 | −0.239 | −0.580 |
| Microcoleus sp. 1 | 0.939 * | 0.730 | −0.510 | −0.307 | 0.916 * | −0.354 |
| Chroococcidiopsis sp. 1 | −0.327 | −0.276 | 0.294 | −0.026 | 0.046 | 0.784 |
| Gloeocapsopsis sp. | −0.264 | −0.532 | 0.420 | 0.500 | −0.377 | −0.524 |
| Stanieria sp. | −0.247 | −0.521 | 0.413 | 0.487 | −0.370 | −0.551 |
| Tolypothrix sp. 1 | −0.287 | −0.334 | 0.475 | −0.857 | −0.368 | −0.369 |
| Microchaete diplosiphon | −0.254 | −0.521 | 0.409 | 0.499 | −0.375 | −0.538 |
| Scytonema sp. 1 | −0.386 | 0.034 | −0.317 | 0.678 | −0.460 | 0.562 |
| Tolypothrix sp. 2 | 0.925 * | 0.773 | −0.610 | −0.022 | 0.999 ** | −0.048 |
| Calothrix sp. 3 | 0.017 | −0.312 | 0.244 | 0.498 | −0.114 | −0.633 |
| Pleurocapsa minor | 0.399 | 0.061 | −0.081 | 0.505 | 0.258 | −0.648 |
| Cyanothece sp. 1 | −0.499 | −0.495 | 0.638 | −0.866 | −0.371 | 0.082 |
| Hyella patelloides | −0.255 | −0.520 | 0.406 | 0.504 | −0.377 | −0.536 |
| Calothrix sp. 2 | 0.222 | 0.583 | −0.781 | 0.572 | 0.000 | 0.209 |
| Nostoc piscinale | −0.277 | −0.555 | 0.450 | 0.469 | −0.387 | −0.536 |
| Chondrocystis sp. | −0.194 | −0.484 | 0.386 | 0.486 | −0.317 | −0.573 |
| Chroococcidiopsis thermalis | −0.470 | −0.263 | 0.145 | 0.329 | −0.175 | 0.880 * |
| Brasilonema sp. | −0.320 | −0.553 | 0.419 | 0.557 | −0.413 | −0.432 |
| Calothrix sp. 1 | −0.388 | −0.340 | 0.353 | −0.041 | −0.017 | 0.734 |
| Cyanothece sp. 3 | 0.079 | −0.110 | −0.036 | 0.785 | −0.051 | −0.384 |
| Gloeocapsa sp. | −0.332 | −0.279 | 0.347 | −0.262 | 0.042 | 0.713 |
| Microcoleus sp. 3 | −0.262 | −0.555 | 0.459 | 0.502 | −0.305 | −0.427 |
| Lusitaniella coriacea | −0.122 | 0.324 | −0.561 | 0.527 | −0.288 | 0.414 |
| Cyanothece sp. 4 | −0.364 | −0.631 | 0.524 | 0.491 | −0.380 | −0.347 |
| Nostoc linckia | −0.402 | −0.390 | 0.398 | 0.004 | −0.035 | 0.682 |
| Calothrix brevissima | −0.445 | −0.750 | 0.691 | 0.205 | −0.522 | −0.564 |
| Cyanothece sp. 5 | −0.056 | −0.374 | 0.297 | 0.495 | −0.183 | −0.615 |
| Nostoc sp. 1 | 0.975 * | 0.752 | −0.591 | −0.001 | 0.943 * | −0.342 |
| Scytonema hofmannii | 0.964 ** | 0.841 | −0.709 | −0.059 | 0.805 | −0.444 |
| Oscillatoria nigro-viridis | 0.949 * | 0.689 | −0.547 | 0.079 | 0.893 * | −0.427 |
| Nostoc sp. 2 | −0.252 | −0.524 | 0.416 | 0.491 | −0.370 | −0.542 |
| Cylindrospermum stagnale | −0.376 | −0.327 | 0.349 | −0.070 | −0.003 | 0.734 |
| Scytonema crispum | −0.329 | 0.044 | −0.259 | 0.296 | −0.577 | 0.111 |
| Gloeobacter kilaueensis | −0.252 | −0.524 | 0.416 | 0.491 | −0.370 | −0.542 |
| Coleofasciculus chthonoplastes | −0.097 | −0.226 | 0.044 | 0.737 | −0.300 | −0.447 |
| Oculatella neakameniensis | −0.252 | −0.524 | 0.416 | 0.491 | −0.370 | −0.542 |
| Leptolyngbya sp. 2 | −0.287 | −0.451 | 0.280 | 0.634 | −0.450 | −0.446 |
| Leptolyngbya sp. 3 | −0.252 | −0.524 | 0.416 | 0.491 | −0.370 | −0.542 |
| Scytonema sp. 2 | −0.486 | −0.563 | 0.530 | 0.178 | −0.167 | 0.491 |
| Lyngbya aestuarii | −0.252 | −0.524 | 0.416 | 0.491 | −0.370 | −0.542 |
| Calothrix sp. 4 | −0.585 | −0.790 | 0.917 * | −0.705 | −0.503 | 0.281 |
| Synechococcus lividus | −0.226 | 0.103 | −0.384 | 0.728 | −0.441 | 0.185 |
| Oscillatoria acuminata | −0.252 | −0.524 | 0.416 | 0.491 | −0.370 | −0.542 |
| Trichormus azollae | −0.252 | −0.524 | 0.416 | 0.491 | −0.370 | −0.542 |
| Nodosilinea sp. | −0.252 | −0.524 | 0.416 | 0.491 | −0.370 | −0.542 |
| Thermosynechococcus sp. | −0.252 | −0.524 | 0.416 | 0.491 | −0.370 | −0.542 |
| Crinalium epipsammum | −0.252 | −0.524 | 0.416 | 0.491 | −0.370 | −0.542 |
| Sphaerospermopsis kisseleviana | −0.252 | −0.524 | 0.416 | 0.491 | −0.370 | −0.542 |
| Fischerella muscicola | −0.402 | −0.367 | 0.389 | −0.077 | −0.031 | 0.711 |
| Pleurocapsa sp. | 0.600 | 0.231 | −0.184 | 0.356 | 0.485 | −0.662 |
| Dolichospermum compactum | −0.079 | 0.375 | −0.600 | 0.493 | −0.238 | 0.436 |
| Stanieria cyanosphaera | −0.010 | 0.438 | −0.654 | 0.495 | −0.172 | 0.423 |
| Cyanothece sp. 2 | 0.914 * | 0.988 ** | −0.941 ** | 0.210 | 0.842 | 0.045 |
| Nostoc punctiforme | −0.377 | −0.293 | 0.299 | −0.031 | −0.009 | 0.783 |
| Cylindrospermum muscicola | −0.106 | 0.350 | −0.578 | 0.491 | −0.263 | 0.440 |
| Calothrix sp. 6 | −0.106 | 0.350 | −0.578 | 0.491 | −0.263 | 0.440 |
| Anabaena sp. 1 | −0.272 | −0.310 | 0.453 | −0.861 | −0.353 | −0.358 |
| Calothrix sp. 5 | −0.265 | −0.321 | 0.472 | −0.873 | −0.339 | −0.372 |
| Jaaginema litorale | 0.875 | 0.668 | −0.430 | −0.456 | 0.818 | −0.442 |
| Cylindrospermum sp. | 0.949 * | 0.774 | −0.599 | −0.066 | 0.994 ** | −0.139 |
| Cyanothece sp. 6 | −0.364 | −0.312 | 0.331 | −0.055 | 0.008 | 0.743 |
| Camptylonemopsis sp. | −0.364 | −0.312 | 0.331 | −0.055 | 0.008 | 0.743 |
| Gloeocapsopsis crepidinum | −0.364 | −0.312 | 0.331 | −0.055 | 0.008 | 0.743 |
| Chroococcidiopsis sp. 2 | −0.364 | −0.312 | 0.331 | −0.055 | 0.008 | 0.743 |
| Cyanobium gracile | −0.364 | −0.312 | 0.331 | −0.055 | 0.008 | 0.743 |
| Leptolyngbya sp. 1 | 0.986 ** | 0.807 | −0.641 | −0.055 | 0.964 ** | −0.268 |
| Nostoc carneum | 0.986 ** | 0.807 | −0.641 | −0.055 | 0.964 ** | −0.268 |
| Phormidium tinctorium | 0.986 ** | 0.807 | −0.641 | −0.055 | 0.964 ** | −0.268 |
| Synechococcus sp. | 0.986 ** | 0.807 | −0.641 | −0.055 | 0.964 ** | −0.268 |
| Diadesmis sp. | 0.986 ** | 0.802 | −0.627 | −0.107 | 0.940 * | −0.332 |
| Nitzschia sp. | −0.252 | −0.524 | 0.416 | 0.491 | −0.370 | −0.542 |
| Cylindrotheca closterium | −0.252 | −0.524 | 0.416 | 0.491 | −0.370 | −0.542 |
| Watanabea reniformis | −0.371 | −0.112 | 0.035 | 0.164 | −0.063 | 0.957 * |
| Ignatius tetrasporus | 0.774 | 0.801 | −0.835 | 0.589 | 0.761 | 0.142 |
| Nannochloris normandinae | −0.494 | −0.538 | 0.563 | −0.090 | −0.138 | 0.564 |
| Scenedesmus | −0.461 | −0.713 | 0.611 | 0.437 | −0.429 | −0.252 |
| Trebouxia corticola | −0.370 | −0.319 | 0.340 | −0.069 | 0.003 | 0.739 |
| Trebouxia australis | −0.500 | −0.676 | 0.547 | 0.528 | −0.404 | −0.010 |
| Chloromonas perforata | 0.547 | 0.857 | −0.962 ** | 0.424 | 0.386 | 0.236 |
| Pyramimonas disomata | −0.263 | −0.537 | 0.428 | 0.500 | −0.364 | −0.511 |
| Xylochloris irregularis | −0.396 | −0.572 | 0.406 | 0.632 | −0.460 | −0.285 |
| Lobosphaera incisa | −0.369 | −0.605 | 0.524 | 0.469 | −0.230 | −0.021 |
| Edaphochlorella mirabilis | −0.758 | −0.735 | 0.700 | −0.073 | −0.462 | 0.542 |
| Dilabifilum sp. | −0.252 | −0.524 | 0.416 | 0.491 | −0.370 | −0.542 |
| Heterochlorella | −0.406 | −0.701 | 0.693 | −0.086 | −0.566 | −0.750 |
| Friedmannia sp. | −0.252 | −0.524 | 0.416 | 0.491 | −0.370 | −0.542 |
| Symbiochloris reticulata | 0.762 | 0.584 | −0.415 | −0.038 | 0.944 * | 0.106 |
| Acutodesmus sp. | −0.452 | −0.481 | 0.641 | −0.896 * | −0.333 | 0.015 |
| Parachlorella kessleri | 0.957 * | 0.771 | −0.578 | −0.153 | 0.980 ** | −0.211 |
| Trebouxia decolorans | −0.364 | −0.312 | 0.331 | −0.055 | 0.008 | 0.743 |
| Symbiochloris irregularis | 0.986 ** | 0.807 | −0.641 | −0.055 | 0.964 ** | −0.268 |
| Stichococcus sp. | 0.986 ** | 0.807 | −0.641 | −0.055 | 0.964 ** | −0.268 |
| Chlamydomonas zebra | 0.986 ** | 0.807 | −0.641 | −0.055 | 0.964 ** | −0.268 |
| Monodopsis sp. 2 | 0.382 | 0.763 | −0.775 | −0.034 | 0.384 | 0.560 |
| Nannochloropsis oculata | 0.986 ** | 0.807 | −0.641 | −0.055 | 0.964 ** | −0.268 |
| Chlorokybus atmophyticus | −0.119 | 0.329 | −0.564 | 0.520 | −0.284 | 0.419 |
| Klebsormidium sp. 2 | −0.085 | −0.230 | 0.392 | −0.802 | −0.232 | −0.618 |
| Klebsormidium sp. 1 | −0.405 | −0.689 | 0.597 | 0.381 | −0.459 | −0.461 |
| Klebsormidium flaccidum | 0.986 ** | 0.806 | −0.638 | −0.060 | 0.963 ** | −0.272 |
| Klebsormidium sp. 3 | −0.506 | −0.516 | 0.661 | −0.798 | −0.288 | 0.243 |
References
- John, D.M. Phylum Chlorophyta (green algae). In The Freshwater Algal Flora of the British Isles; John, D.M., Whitton, B.A., Brook, A.J., Eds.; Cambridge University Press: Cambridge, UK, 2002; pp. 287–612. [Google Scholar]
- López-Bautista, J.M.; Rindi, F.; Casamatta, D. The systematics of subaerial algae. In Algae and Cyanobacteria in Extreme Environments; Seckbach, J., Ed.; Springer: Dordrecht, The Netherlands, 2007; pp. 599–617. [Google Scholar]
- Rindi, F. Diversity, distribution and ecology of green algae and cyanobacteria in urban habitats. In Algae and Cyanobacteria in Extreme Environments; Seckbach, J., Ed.; Springer: Dordrecht, The Netherlands, 2007; pp. 619–638. [Google Scholar]
- Graham, L.; Graham, J.; Wilcox, L. Algae, 2nd ed.; Benjamin Cummings (Pearson): San Francisco, CA, USA, 2009. [Google Scholar]
- Hallmann, C.; Hoppert, M.; Mudimu, O.; Friedl, T. Biodiversity of green algae covering artificial hard substrate surfaces in a suburban environment: A case study using molecular approaches. J. Phycol. 2016, 52, 732–744. [Google Scholar] [CrossRef]
- Sherwood, A.R.; Dittbenr, M.N.; Johnston, E.T.; Conklin, K.Y. A metabarcoding comparison of windward and leeward airborne algal diversity across the Ko’olau mountain range on the island of O’ahu, Hawai’i. J. Phycol. 2017, 53, 437–455. [Google Scholar] [CrossRef] [PubMed]
- Johnston, E.; Conklin, K.; Fredrick, P.; Sherwood, A. Pyrosequencing and culturing of Hawaiian corticolous biofilms demonstrate high diversity and confirm phylogenetic placement of the green alga Spongiochrysis hawaiiensis in Cladophorales (Ulvophyceae). Phycologia 2018, 57, 572–580. [Google Scholar] [CrossRef] [PubMed]
- Zhu, H.; Li, S.; Hu, Z.; Liu, G. Molecular characterization of eukaryotic algal communities in the tropical phyllosphere based on real-time sequencing of the 18S rDNA gene. BMC Plant Biol. 2018, 18, 365. [Google Scholar] [CrossRef] [PubMed]
- Sherwood, A.R.; Wade, R.M.; Conklin, K.Y. Seasonality of tropical airborne algae: A 16-month study based on high-throughput sequencing in the Hawaiian Islands. Grana 2020, 5, 354–365. [Google Scholar] [CrossRef]
- Rybalka, N.; Blanke, M.; Tzvetkova, A.; Noll, A.; Roos, C.; Boy, J.; Boy, D.; Nimptsch, D.; Godoy, R.; Friedl, T. Unrecognized diversity and distribution of soil algae from Maritime Antarctica (Fildes Peninsula, King George Island). Front. Microbiol. 2023, 14, 1118747. [Google Scholar] [CrossRef] [PubMed]
- Haapala, H.; Goltsova, N.; Seppälä, H.S.; Kouki, J.; Lamppu, J.; Popovichev, B. Ecological condition of forests around the eastern part of the Gulf of Finland. Environ. Pollut. 1996, 91, 253–265. [Google Scholar] [CrossRef]
- Marmor, L.; Degtjarenko, P. Trentepohlia umbrina on Scots pine as bioindicator of alkaline dust pollution. Ecol. Indic. 2014, 45, 717–720. [Google Scholar] [CrossRef]
- Razli, S.A.; Azlam, A.; Ismail, A.; Murnira, O.; Ahmad, M.A.A.; Hafizah, B.N.; Kadaruddin, A.; Talib, L.M. Epiphytic microalgae as biological indicators for carbon monoxide concentrations in different areas of Peninsular Malaysia. Environ. Forensics 2022, 23, 314–323. [Google Scholar] [CrossRef]
- Roy-Ocotla, G.; Carrera, J. Aeroalgae: Response to some aerobiological questions. Grana 1993, 32, 48–56. [Google Scholar] [CrossRef]
- Ra, H.S.Y.; Crang, F.E. Changes in thallus and algal cell components of two lichen species in response to low-level air pollution at Pacific Northeast Forests. Microsc. Microanal. 2002, 8, 1078–1079. [Google Scholar] [CrossRef]
- Ismail, A.; Wahab, N.A.; Latif, M.T.; Said, M.; Ismail, A.; Zulkifli, A.R.; Alwi, I.; Daud, D.; Sulaiman, F.N. Atmospheric air pollution and roughness of bark as possible factors in increasing density of epiphytic terrestrial algae. Asian J. Appl. Sci. 2016, 4, 256–261. [Google Scholar]
- Hemond, H.F.; Fechner-Levy, E.J. Chemical Fate and Transport in The Environment; Academic Press: London, UK, 2000. [Google Scholar]
- Zhang, B.N.; Oanh, N.T. Photochemical smog pollution in the Bangkok Metropolitan Region of Thailand in relation to O3 precursor concentrations and meteorological conditions. Atmos. Environ. 2002, 36, 4211–4222. [Google Scholar] [CrossRef]
- Organization for Economic Cooperation and Development [OECD]. OECD Green Growth Studies: Green Growth in Bangkok, Thailand; OECD: Paris, France, 2015. [Google Scholar]
- Dhakal, S.; Shrestha, A. Bangkok, Thailand. In Cities on A Finite Planet: Towards Transformative Responses to Climate Change; Bartlett, S., Satterthwaite, D., Eds.; Routledge: London, UK, 2016; pp. 63–81. [Google Scholar]
- Klongvessa, P.; Chotpantarat, S. Statistical analysis of rainfall variations in the Bangkok urban area, Thailand. Arab. J. Geosci. 2015, 8, 4207–4219. [Google Scholar] [CrossRef]
- Bangkok Metropolitan Administration and Chulalongkorn University. Executive Summary 20-Year Development Plan for Bangkok Metropolis; Strategy and Evaluation Department Bangkok Metropolitan Administration and Faculty of Political Sciences; Chulalongkorn University: Bangkok, Thailand, 2011. [Google Scholar]
- Schwela, D.; Zali, O. Urban Traffic Pollution; E & FN Spon: London, UK, 1999. [Google Scholar]
- Muttamara, S.; Leong, S.T. Monitoring and assessment of exhaust emission in Bangkok Street air. Environ. Monit. Assess. 2000, 60, 163–180. [Google Scholar] [CrossRef]
- Afroz, R. Review of air pollution and health impacts in Malaysia. Environ. Res. 2003, 92, 71–77. [Google Scholar] [CrossRef] [PubMed]
- Jorge, N.; Díaz-Gamboa, R.E. Chapter: 4. line transect sampling. In Introduction to Ecological Sampling; Manly, B., Navarro, J., Eds.; CRC Press: Boca Raton, FL, USA, 2015; pp. 47–62. [Google Scholar]
- Sherwood, A.R.; Presting, G.G. Universal primers amplify a 23S rDNA plastid marker in eukaryotic algae and Cyanobacteria. J. Phycol. 2007, 43, 605–608. [Google Scholar] [CrossRef]
- Sherwood, A.R.; Chan, Y.L.; Presting, G.G. Application of universally amplifying plastid primers to environmental sampling of a stream periphyton community. Mol. Ecol. Resour. 2008, 8, 1011–1014. [Google Scholar] [CrossRef]
- Haendiges, J.; Timme, R.; Ramachandran, P.; Balkey, M. DNA Quantification Using the Qubit Fluorometer. Available online: https://www.protocols.io/view/dna-quantification-using-the-qubit-fluorometer-81wgbp3x3vpk/v15 (accessed on 1 July 2022).
- Magoč, T.; Salzberg, S.L. FLASH: Fast length adjustment of short reads to improve genome assemblies. Bioinformatics 2011, 27, 2957–2963. [Google Scholar] [CrossRef]
- Haas, B.J.; Gevers, D.; Earl, A.M.; Feldgarden, M.; Ward, D.V.; Giannoukos, G.; Ciulla, D.; Tabbaa, D.; Highlander, S.K.; Sodergren, E.; et al. Chimeric 16S rRNA sequence formation and detection in Sanger and 454-pyrosequenced PCR amplicons. Genome Res. 2011, 21, 494–504. [Google Scholar] [CrossRef]
- Li, M.; Shao, D.; Zhou, J.; Gu, J.; Qin, J.; Chen, W.; Wei, W. Signatures within esophageal microbiota with progression of esophageal squamous cell carcinoma. Chin. J. Cancer Res. 2020, 32, 755–767. [Google Scholar] [CrossRef] [PubMed]
- Berney, C.; Ciuprina, A.; Bender, S.; Brodie, J.; Edgcomb, V.; Kim, E.; Rajan, J.; Parfrey, L.W.; Adl, S.; Audic, S.; et al. UniEuk: Time to speak a common language in protistology! J. Eukaryot. Microbiol. 2017, 64, 407–411. [Google Scholar] [CrossRef]
- McCune, B.; Mefford, M.J. PC-ORD Multivariate Analysis of Ecological Data. Version 6; MjM Software: Gleneden Beach, OR, USA, 2011. [Google Scholar]
- Clarke, K.R.; Warwick, R.M. Change in Marine Communities: An Approach to Statistical Analysis and Interpretation; Plymouth Marine Laboratory: Plymouth, UK, 1994. [Google Scholar]
- McCune, B. Community Structure and Analysis Biology 570/670; Department of Botany and Plant Pathology, Oregon State University: Corvallis, OR, USA, 2007. [Google Scholar]
- Guiry, M.D.; Guiry, G.M. AlgaeBase. Available online: https://www.algaebase.org (accessed on 10 September 2022).
- Yoon, T.; Kang, H.; Kang, C.; Lee, S.H.; Ahn, D.; Park, H.; Kim, H. Development of a cost-effective metabarcoding strategy for analysis of the marine phytoplankton community. PeerJ 2016, 4, e2115. [Google Scholar] [CrossRef] [PubMed]
- Bombin, S.; Wysor, B.; Lopez-Bautista, J.M. Assessment of littoral algal diversity from the northern Gulf of Mexico using environmental DNA metabarcoding. J. Phycol. 2021, 57, 269–278. [Google Scholar] [CrossRef] [PubMed]
- Azevedo, J.; Antunes, J.T.; Machado, A.M.; Vasconcelos, V.; Leão, P.N.; Froufe, E. Monitoring of biofouling communities in a Portuguese port using a combined morphological and metabarcoding approach. Sci. Rep. 2020, 10, 13461. [Google Scholar] [CrossRef]
- Kezlya, E.; Tseplik, N.; Kulikovsky, M. Genetic markers for metabarcoding of freshwater microalgae: Review. Biology 2023, 12, 1038. [Google Scholar] [CrossRef]
- van der Reis, A.L.; Sewell, M.A.; Nelson, W.A. Investigating seed bank potential of crustose coralline algae using DNA metabarcoding. J. Phycol. 2023, 00, 1–8. [Google Scholar] [CrossRef]
- Schulte, N.O.; Craine, J.M.; Leopold, D.R.; Devitt, J.K.; Fierer, N. Diversity of freshwater algal assemblages across the United States as revealed by DNA metabarcoding. Environ. DNA 2023, 00, 1–20. [Google Scholar] [CrossRef]
- Lentendu, G.; Wubet, T.; Chatzinotas, A.; Wilhelm, C.; Buscot, F.; Schlegel, M. Effects of long-term differential fertilization on eukaryotic microbial communities in an arable soil: A multiple barcoding approach. Mol. Ecol. 2014, 23, 3341–3355. [Google Scholar] [CrossRef]
- Sherwood, A.R.; Conklin, K.Y.; Lidddy, Z.J. What’s in the air? Preliminary analyses of Hawaiian airborne algae and land plant spores reveal a diverse and abundant flora. Phycologia 2014, 53, 579–582. [Google Scholar] [CrossRef]
- Wei, L.; Zhao, Q.; Chen, X.; Sun, Q.; Zhang, X.; Chen, Y. Seasonal variation in soil algal community structure in different forest plantations in subtropic China. Front. Plant Sci. 2023, 14, 1181184. [Google Scholar] [CrossRef]
- Neustupa, J.; Škaloud, P. Diversity of subaerial algae and cyanobacteria on tree bark in tropical mountain habitats. Biologia 2008, 63, 806–812. [Google Scholar] [CrossRef]
- Neustupa, J.; Škaloud, P. Diversity of subaerial algae and cyanobacteria growing on bark and wood in the lowland tropical forests of Singapore. Plant Ecol. Evol. 2010, 143, 51–62. [Google Scholar] [CrossRef]
- Škaloud, P.; Rindi, F.; Boedeker, C.; Leliaert, F. Chlorophyta: Ulvophyceae. In Süßwasserflora von Mitteleuropa–Freshwater Flora of Central Europe 13; Büdel, B., Gärtner, G., Krienitz, L., Schagerl, M., Eds.; Springer Spektrum: Berlin, Germany, 2018; pp. 1–289. [Google Scholar]
- Klimešová, M.; Rindi, F.; Skaloud, P. DNA cloning demonstrates high genetic heterogeneity in populations of the subaerial green alga Trentepohlia (Trentepohliales, Chlorophyta). J. Phycol. 2019, 55, 224–235. [Google Scholar] [CrossRef]
- Islam, A.K.M.N. Subaerial algae of Bangladesh. Bangladesh J. Bot. 1972, 1, 13–64. [Google Scholar]
- Ho, K.K.; Tan, K.H.; Wee, Y.C. Growth conditions of Trentepohlia odorata (Chlorophyta, Ulotrichales). Phycologia 1983, 22, 303–308. [Google Scholar] [CrossRef]
- Ong, B.M.; Lim, M.; Wee, Y.C. Effects of desiccation and illumination of photosynthesis and pigmentation of an edaphic population of Trentepohlia odorata (Chlorophyta). J. Phycol. 1992, 28, 768–772. [Google Scholar] [CrossRef]
- Sharma, N.K.; Singh, S.; Rai, A.K. Diversity and seasonal variation of viable algal particles in the atmosphere of a subtropical city in India. Environ. Res. 2006, 102, 252–259. [Google Scholar] [CrossRef] [PubMed]
- Sharma, N.K.; Singh, S. Differential aerosolization of algal and cyanobacterial particles in the atmosphere. Indian J. Microbiol. 2011, 50, 468–473. [Google Scholar] [CrossRef]
- Nienow, J.A. Subaerial communities. In Encyclopedia of Environmental Microbiology; Bitton, G., Ed.; Wiley: New York, NY, USA, 2002; pp. 3055–3065. [Google Scholar]
- Gorbushina, A.A. Life on the rocks. Environ. Microbiol. 2007, 9, 1613–1631. [Google Scholar] [CrossRef]
- Sharma, N.K.; Rai, A.K.; Singh, S.; Brown, J.R.M. Airborne algae: Their present status and relevance. J. Phycol. 2007, 43, 615–627. [Google Scholar] [CrossRef]
- Neustupa, J.; Štifterová, A. Distribution patterns of subaerial corticolous microalgae in two European regions. Plant Ecol. Evol. 2013, 146, 279–289. [Google Scholar] [CrossRef]
- Lam, D.W. Biodiversity and Systematics of Subaerial Algae from the Neotropics and Hawaii. Doctoral Degree, University of Alabama, Tuscaloosa, AL, USA, 2010. [Google Scholar]
- Billi, D.; Wilmotte, A.; McKay, C.P. Desert strains of Chroococcidiopsis: A platform to investigate genetic diversity in extreme environments and explore survival potential beyond Earth. In EPSC Abstracts; European Planetary Science Congress: Rome, Italy, 2010. [Google Scholar]
- Bothe, H. The cyanobacterium Chroococcidiopsis and its potential for life on Mars. J. Astrobiol. Space Sci. Rev. 2019, 2, 398–412. [Google Scholar]
- Hershkovitz, N.; Oren, A.; Cohen, Y. Accumulation of trehalose and sucrose in cyanobacteria exposed to matric water stress. Appl. Environ. Microbiol. 1991, 57, 645–648. [Google Scholar] [CrossRef]
- Harel, Y.; Ohad, I.; Kaplan, A. Activation of photosynthesis and resistance to photoinhibition in cyanobacteria within biological desert crust. Plant Physiol. 2004, 136, 3070–3079. [Google Scholar] [CrossRef]
- Quesada, A.; Vincent, W.F. Strategies of adaptation by Antarctic cyanobacteria to ultraviolet radiation. Eur. J. Phycol. 1997, 32, 335–342. [Google Scholar] [CrossRef]
- Rajeev, L.; da Rocha, U.N.; Klitgord, N.; Luning, E.G.; Fortney, J.; Axen, S.D.; Shih, P.M.; Bouskill, N.J.; Bowen, B.P.; Kerfeld, K.C.; et al. Dynamic cyanobacterial response to hydration and dehydration in a desert biological soil crust. ISME J. 2013, 7, 2178–2191. [Google Scholar] [CrossRef]
- Lokhorst, G.M. Comparative taxonomic studies on the genus Klebsormidium (Charophyceae) in Europe. In Cryptogamic Studies; Gustav Fischer Verlag: Stuttgart, Germany, 1996; Volume 5, pp. 1–132. [Google Scholar]
- Gaysina, L.A.; Purina, E.S.; Safiullina, L.M.; Bakieva, G.R. Resistance of Klebsormidium flaccidum (Kützing) Silva, Mattox & Blackwell (Streptophyta) to heavy metals. NBU J. Plant Sci. 2009, 3, 39–42. [Google Scholar]
- Gaysina, L.A.; Bohunická, M.; Hazuková, V.; Johansen, J.R. Biodiversity of terrestrial cyanobacteria of the South Ural Region. Cryptogam. Algol. 2018, 39, 167–198. [Google Scholar] [CrossRef]
- Škaloud, P.; Rindi, F. Ecological differentiation of cryptic species within an asexual protist morphospecies: A case study of filamentous green alga Klebsormidium (Streptophyta). J. Eukaryot. Microbiol. 2013, 60, 350–362. [Google Scholar] [CrossRef]
- Škaloud, P.; Lukešova, A.; Malavasi, V.; Ryšánek, D.; Hrčková, K.; Rindi, F. Molecular evidence for the polyphyletic origin of low pH adaptation in the genus Klebsormidium (Klebsormidiophyceae, Streptophyta). Plant Ecol. Evol. 2014, 147, 333–345. [Google Scholar] [CrossRef]
- Samolov, E.; Mikhailyuk, Y.; Lukešová, A.; Glaser, K.; Büdel, B.; Karsten, U. Usual alga from unusual habitats: Biodiversity of Klebsormidium (Klebsormidiophyceae, Streptophyta) from the phylogenetic superclade G isolated from biological soil crusts. Mol. Phylogenet. Evol. 2019, 133, 236–255. [Google Scholar] [CrossRef]
- Pierangelini, M.; Glaser, K.; Mikhailyuk, T.; Karsten, U.; Holzinger, A. Light and dehydration but not temperature drive photosynthetic adaptations of basal Streptophytes (Hormidiella, Streptosarcina and Streptofilum) living in terrestrial habitats. Environ. Microbiol. 2019, 77, 380–393. [Google Scholar] [CrossRef]
- Karsten, U.; Rindi, F. Ecophysiological performance of an urban strain of the aeroterrestrial green alga Klebsormidium sp. (Klebsormidiales, Klebsormidiophyceae). Eur. J. Phycol. 2010, 45, 426–435. [Google Scholar] [CrossRef]
- Kowalska, M.; Ośródka, L.; Klejnowski, K.; Zejda, J.; Krajny, E.; Wojtylak, M. Air quality index and its significance in environmental health risk communication. Arch. Environ. Prot. 2009, 35, 13–21. [Google Scholar]
- Environment Bureau Bangkok. AQI Information. Available online: https://bangkokairquality.com/bma/aqi?lang=en (accessed on 4 October 2022).
- Hossain, I.; Rahman, S.; Sattar, S.; Haque, M.; Mullick, A.; Siraj, S.; Sultana, N.; Uz-zaman, M.A.; Samima, I.; Haidar, A.; et al. Environmental overview of air quality index (AQI) in Bangladesh: Characteristics and challenges in present era. Int. J. Res. Eng. Technol. 2021, 4, 110–115. [Google Scholar]
- Reddy, K.J.; Haskell, J.B.; Sherman, D.M.; Sherman, L.A. Unicellular, aerobic nitrogen-fixing cyanobacteria of the genus Cyanothece. J. Bacteriol. 1993, 175, 1284–1292. [Google Scholar] [CrossRef] [PubMed]
- Gao, F.; Zhang, C.T. Origins of replication in Cyanothece 51142. Proc. Natl. Acad. Sci. USA 2008, 105, 125. [Google Scholar] [CrossRef]
- Welsh, E.A.; Liberton, M.; Stockel, J.; Loh, T.; Elvitigala, T.; Wang, C.; Wollam, A.; Fulton, R.S.; Clifton, S.W.; Jacobs, J.M.; et al. The genome of Cyanothece 51142, a unicellular diazotrophic cyanobacterium important in the marine nitrogen cycle. Proc. Natl. Acad. Sci. USA 2008, 105, 15094–15099. [Google Scholar] [CrossRef] [PubMed]
- Mareš, J.; Johansen, J.R.; Hauer, T.; Zima, J., Jr.; Ventura, S.; Cuzman, O.; Tiribilli, B.; Kaštovský, J. Taxonomic resolution of the genus Cyanothece (Chroococcales, Cyanobacteria), with a treatment on Gloeothece and three new genera, Crocosphaera, Rippkaea, and Zehria. J. Phycol. 2019, 55, 578–610. [Google Scholar] [CrossRef]
- Komarek, J.; Cepak, V. Cytomorphological characters supporting the taxonomic validity of Cyanothece (Cyanoprokaryota). Plant Syst. Evol. 1998, 210, 25–39. [Google Scholar] [CrossRef]
- Porta, D.; Rippka, R.; Hernandez-Marine, M. Unusual ultrastructural features in three strains of Cyanothece (cyanobacteria). Arch. Microbiol. 2000, 173, 154–163. [Google Scholar] [CrossRef] [PubMed]


Disclaimer/Publisher’s Note: The statements, opinions and data contained in all publications are solely those of the individual author(s) and contributor(s) and not of MDPI and/or the editor(s). MDPI and/or the editor(s) disclaim responsibility for any injury to people or property resulting from any ideas, methods, instructions or products referred to in the content. |
© 2024 by the authors. Licensee MDPI, Basel, Switzerland. This article is an open access article distributed under the terms and conditions of the Creative Commons Attribution (CC BY) license (https://creativecommons.org/licenses/by/4.0/).