Abstract
Wilderness areas are important in maintaining biodiversity, and “retaining existing intact and wilderness areas” is listed as the first of 21 action targets for 2030 in the first draft of the post-2020 Global Biodiversity Framework. However, the quantity and quality of regional-scale wilderness mapping and identification of priority areas for conservation are still insufficient. Here, an approach integrating Boolean and Multi-Criteria Evaluation is used to conduct wilderness mapping, and priority conservation areas are identified based on ecosystem service values and the current status of wilderness protection in protected areas in the state-owned forest region of Daxing’anling. It is found that the wilderness areas account for 96.72% of the total area of the study area, of which high-quality wilderness areas constitute for 50.34% of the total area of wilderness areas, and the quality of wilderness is greatly affected by the railroads. Secondly, wilderness areas have higher ecosystem service values per square kilometer than non-wilderness areas, except for food supply service. In addition, 72.26% of the wilderness areas are not protected, and 52.26% of these high-quality wilderness areas with high ecosystem service values still have conservation gaps. This study can provide data support and scientific reference for future wilderness conservation works in different regions.
1. Introduction
Wilderness areas (WAs), as natural areas unmodified by humans [1,2], play a crucial role in maintaining biodiversity [3,4,5], regulating climate [6], providing aesthetic value [7,8], and so on. Nevertheless, currently only 23.2% of the world’s land WAs exist [9] as well as 13.2% of the marine WAs [10]. More importantly, WAs are disappearing rapidly. Since the early 1990s, about one-tenth of the world’s terrestrial WAs had disappeared in two decades [9]; from 2000 to 2013, 1.9 million square kilometers of intact land was highly modified [11]. The main drivers of this are issues such as land-use change resulting from human activities [12]. Previous studies show that 75% of the earth’s land is being disturbed by humans [13], and that even a third of the world’s terrestrial protected areas (PAs) are still under anthropogenic pressure [14]. And it is estimated that the size of WAs will decrease further in the future [15,16], which will not only have negative impacts on natural ecosystems [15] but also lead to the loss of cultural diversity [17].
To meet the challenge, the first draft of the post-2020 Global Biodiversity Framework (GBF) proposes to “retaining existing intact and wilderness areas”, which is listed as the first of the 21 action goals for 2030. In addition, the designation of protected WAs is also an important direction for the further development of China’s national park system [18]. For wilderness protection, understanding the location and extent of WAs is the cornerstone [19]. Wilderness mapping plays a fundamental role in identifying biodiversity conservation hotspots [20] and ecological corridor construction [21]. With the development of remote sensing technology and related theories, global wilderness mapping projects have made great progress. In 1985, Lesslie and Taylor firstly combined a geographic information system (GIS) with the concept of wilderness continuums to carry out wilderness mapping in southern Australia [22]. Subsequent wilderness mapping studies used different methods—e.g., Boolean [23], weighted linear combination (WLC) [24], and perceptual studies [25].
Currently, wilderness mapping has been conducted at different scales and in different regions by different methods, from global [26,27] and national [28,29] to local [30], and in addition to terrestrial wilderness studies, marine wilderness works [31,32] are gradually being carried out. As seen in some researches, there are large conservation gaps in WAs [33]; for example, 77% of China’s existing WAs are not protected [34]. At the same time, there are also papers that indicate that simply increasing the area significantly does not actually achieve conservation goals [35]. A case in point is that energy instead of area is the main influencing factor of forest biodiversity [36]. Moreover, an increase in the area of PAs means more conservation resources, which also needs to be considered in terms of return on investment [37,38]. Therefore, it is impractical to include all WAs in the conservation network [39], and a more refined approach to defining the scope of wilderness protection needs to minimize the negative impacts on other aspects [40]. For instance, several studies prioritize wilderness protection in terms of ecosystem service values (ESVs) [41,42] and wilderness threat factors [43,44,45]. Nowadays, national-scale [34,46,47] and regional-scale [48,49,50,51,52,53] wilderness researches have been carried out in China, involving wilderness connectivity [54,55] and so on. But there are still some deficiencies in the relevant domestic studies. First of all, the study areas mainly focus on the southwest and southeast in China, and there is still a lack of work in the northwest and northeast regions. Also, it is necessary to conduct small-scale wilderness mapping [56]. Secondly, in terms of wilderness mapping methods, many regional-scale studies [29,52] choose simpler treatments, like the Euclidean distance method for distance analysis, which leads to insufficient accuracy. What is more, most of the current projects stop at wilderness identification and lack analysis of priority conservation areas [57].
Located in the northernmost part of China, Daxing’anling is one of the most sensitive areas to global climate change and plays an important role in addressing climate change and maintaining ecological security [58]. At the same time, as part of the northeast forest belt, the forests of Daxing’anling have high conservation value in the national ecological security pattern [59]. However, the forests in the region have been degraded by fires and logging [60]. Meanwhile, due to the development of domestic tourism and infrastructure improvement in recent years [61], human activities in the northeast area have also caused high pressure on the ecological environment [62]. Some work has revealed that one of the main sources of China’s WA reduction between 2010 and 2020 is the northeast region [63]. Herein, the state-owned forest region of Daxing’anling is selected as the study area to build a wilderness mapping indicator system based on regional characteristics, explore the spatial pattern of wilderness by combining Boolean and Multi-Criteria Evaluation, and identify the priority conservation areas based on the ESVs and the current status of wilderness protection in the PAs.
2. Materials and Methods
2.1. Study Area
The state-owned forest region of Daxing’anling is located in the north of Heilongjiang Province and Nei Mongol Zizhiqu of China (121°10′–127°01′ E, 50°07′–53°33′ N), connecting with Xiaoxing’anling Mountains in the east and Daxing’anling Mountains in the west, neighboring with Songnen Plain in the south, and arriving at Russia in the north [64] with a total area of 80,301.78 km2 (Figure 1). The region is the main water catchment area for Heilongjiang, Nenjiang River, and the northern water tower at a high latitude, with a significant role in water conservation [65]. Among the six key state-owned forest regions in China, the total value of ecosystem services provided by forests and wetlands in the state-owned forest region of Daxing’anling tops the list [66]. The terrain of the study area is generally high in the west and low in the east, with an elevation of 130–1523 m, which belongs to the typical low mountain and hilly landscape. The vegetation type is dominated by the southern cold-temperate deciduous needle-leaved forest represented by larch, and gradually changes to the temperate mixed-broad leaved forest represented by Mongolian oak in the south. The region is regarded as a natural protection barrier for wildlife in the northeast of China [60] in that the forest coverage rate reaches 86.2% and there are abundant wildlife resources, including 43 species of key protected and rare animals [67]. According to the ecological value and protection intensity, China’s PAs are divided into three kinds: national parks, nature reserves, and nature parks. There are a total of 47 PAs in the study area, including 31 nature reserves (NRs) and 16 nature parks (NPs), with a total area of 23,355.95 km2. At the end of 2022, the Daxing’anling National Park was formally listed as one of the 49 candidate national parks in the Spatial Layout Plan for National Parks. And the creation of this national park is being steadily promoted.
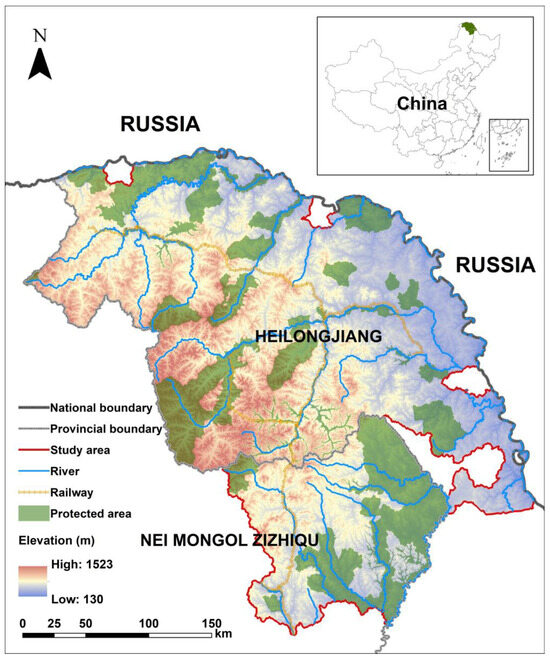
Figure 1.
The state-owned forest region of Daxing’anling.
2.2. Wilderness Mapping
In this study, a combination of Boolean and Multi-Criteria Evaluation (MCE) [34,54] for wilderness mapping was adopted, which could both identify wilderness boundaries and perform relative wilderness quality evaluation, where MCE assesses wilderness quality by considering multiple metrics.
2.2.1. Data Sources
In this context, several datasets (Table 1) were collected from different sources in order to select those with high accuracy and completeness [68]. Then, the relevant data were spliced and cropped. The resolution was resampled to 30 m, and the coordinate system was defined as CGCS_2000 uniformly.

Table 1.
Year, resolution, and source of the selected data.
2.2.2. Identifying WAs Using Boolean
According to the International Union for Conservation of Nature (IUCN) definition of category 1b, wilderness areas are large unmodified or slightly modified areas that retain their natural character without permanent or significant human habitation, and they are protected and managed so as to preserve their natural conditions [69]. This definition is used in this work to exclude areas with relatively strong human disturbance when identifying WAs. Based on the criteria of current land use classification in China, areas with relatively strong human interference include construction land (e.g., residential land) and parts of agricultural land (e.g., cultivated land). Meanwhile, considering the spatial heterogeneity and the importance of preserving the original information of WAs, buffer zones were not set for settlements and roads [70], and the size of WAs was not taken as the Boolean criteria [34,62].
2.2.3. Mapping Wilderness Quality Using MCE
In the present study, biophysical naturalness, apparent naturalness, remoteness from settlements, remoteness from access, population density, and terrain ruggedness were selected to evaluate the quality of WAs based on the consideration of naturalness, remoteness, disturbance, and ruggedness.
Biophysical naturalness (BN) reflects the degree of interference of human activities on natural ecosystems [22,28], and the size of its value usually depends on the experienced judgment of experts [53,71]. Based on the work by [34], the biophysical naturalness evaluation (Table 2) was formed by considering land use types in this study area. Through the focal statistics tool in GIS 10.7, the average value of each center cell was calculated with a moving rectangular window of 3×3 cells, so that the biophysical naturalness of neighboring patches of different land use types could be smoothly transitioned [48].
Table 2.
Biophysical naturalness of land-use type (0 = lowest, 10 = highest).
Apparent naturalness (AN) reflects the effect of artificial facilities (e.g., building facilities, transportation facilities) on wilderness perception. The higher the visibility of artificial facilities within the field of view, the lower the quality of the wilderness [70]. In this study, taking the occlusion phenomenon of topography and facilities into account [24], the visibility tool in 3D analysis was used to extract the settlements and roads in the study area and input the digital surface model (DSM) to identify the visible areas. The output raster recorded the number of times that each cell location in the DSM raster was visible for the location of the construction land. In order to keep the result in this layer consistent with the other layers, the output raster data were inverted.
Remoteness from settlements (RS) and remoteness from access (RA), which are commonly used indicators for wilderness mapping [70,72], reflect the remoteness from settlements and transportation roads. Here, Naismith’s Rule [73] was used to take into account a range of factors affecting walking speed, including distance, land use type, and topography. And according to researches [71,74], a travel time model (Table 3) was formed to calculate the time it took to walk from any location in the study area to neighboring settlements and roads.
Table 3.
Travel time model.
Population density (PD) is an effective indicator of the degree of human disturbance [75,76]. In our study, the kilometer grid dataset of China’s population distribution was used, and the mean value of each center cell was calculated with a rectangular moving window of 3*3 cells, which was smoothed to avoid the edge effect [34].
Terrain ruggedness (TR) is a measure of terrain. Generally, there is less population pressure and more complex habitats in areas with rugged terrain [77,78]. It is necessary to include ruggedness as a metric because the study area is a low hilly area with some complexity in the terrain [74]. Here, vector ruggedness measurement (VRM) [79] was used to calculate the terrain ruggedness.
Since the six indicator layers had different units and scales, the logarithmic function [34,48] was used to standardize the above indicator layers. It ranged from 0 to 1, with higher values resulting in higher quality wilderness.
where NIi is the standardized indicator value, ai is the cell value in the indicator i, and aimax is the cell maximum value in the indicator i.
Strong correlations between indicators may affect negatively the results [74,80]. In this study, the correlation between indicators was calculated via the band collection statistics tool in GIS 10.7 [29]. The results showed that there was a weak correlation between any pair of indicators selected (Table 4), which indicates that the information reflected by the above indicators is not redundant.
Table 4.
Pearson correlation matrix for the indicators.
Next, a principal component analysis [48] was performed on the above six indicator layers, resulting in the first four principal components accounting for 99.03% of the total eigenvalues (Appendix A). Then, on the basis of the information of the first four principal components, the ISO clustering unsupervised classification method of spatial analysis in GIS 10.7 [29,71] was used to classify the quality of WAs. And the quality was divided into 10 levels, where 10 indicated the highest quality wilderness [48]. The 10 levels were then classified into three categories: high-quality WAs (levels 8–10), medium-quality WAs (levels 4–7), and low-quality WAs (levels 1–3) [51]. Through the mask tool in GIS 10.7, the wilderness map layer obtained by Boolean was overlaid with the wilderness quality layer to obtain the results of the spatial distribution of wilderness quality of the study area.
2.3. Analysis of Spatial Patterns in WAs
The proportion of area occupied by high, medium, and low-quality WAs was calculated in terms of elevation and land use types, and the spatial pattern of WAs was summarized in the study area. The elevation was divided into four intervals in the vertical spatial analysis, namely <450 m, 450 m-750 m, 750 m-1050 m, and >1050 m, while the land use types were divided into four major categories: forest land, grassland, water area, and other land.
2.4. Analysis of Priority Conservation Areas for Wilderness Based on ESVs and PAs
The sum and proportion of ESVs of non-WAs and WAs of different quality levels were calculated by the tabulate area tool, and the total value of ecosystem services was categorized into high, medium, and low through the Jenks natural breaks classification, which were >3.95 million dollars/km2, 1.69–3.95 million dollars/km2, and <1.69 million dollars/km2, respectively. Secondly, WAs with different quality levels were overlaid with 47 PAs in the study area to calculate the coverage of WAs by current PAs and to further assess the wilderness protection status. Finally, high-quality WAs with high ESVs but not included in PAs were prioritized for protection by overlaying the wilderness quality layer with the ecosystem service value level layer.
3. Results
3.1. Spatial Patterns of WAs
The area of WAs is 77,671.80 km2, accounting for 96.72% of the total area of the study area. Among them, high, medium, and low-quality WAs make up 50.34%, 31.81%, and 17.85% of the total WAs. In terms of horizontal distribution (Figure 2), high and medium-quality WAs are evenly distributed in a fragmented manner, while low-quality WAs are mainly in a linear distribution along the railroads.
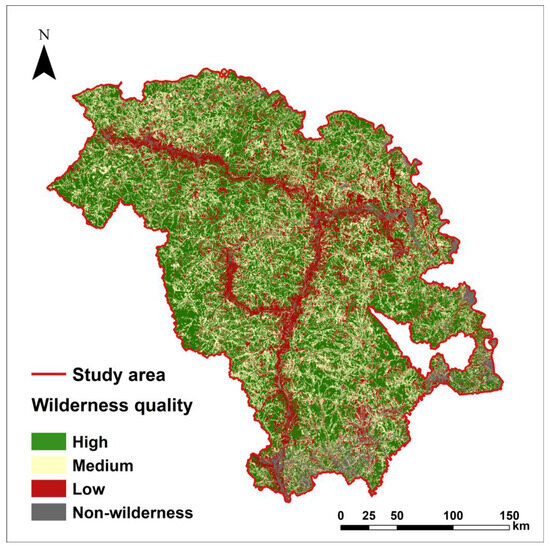
Figure 2.
The spatial distribution of wilderness quality levels.
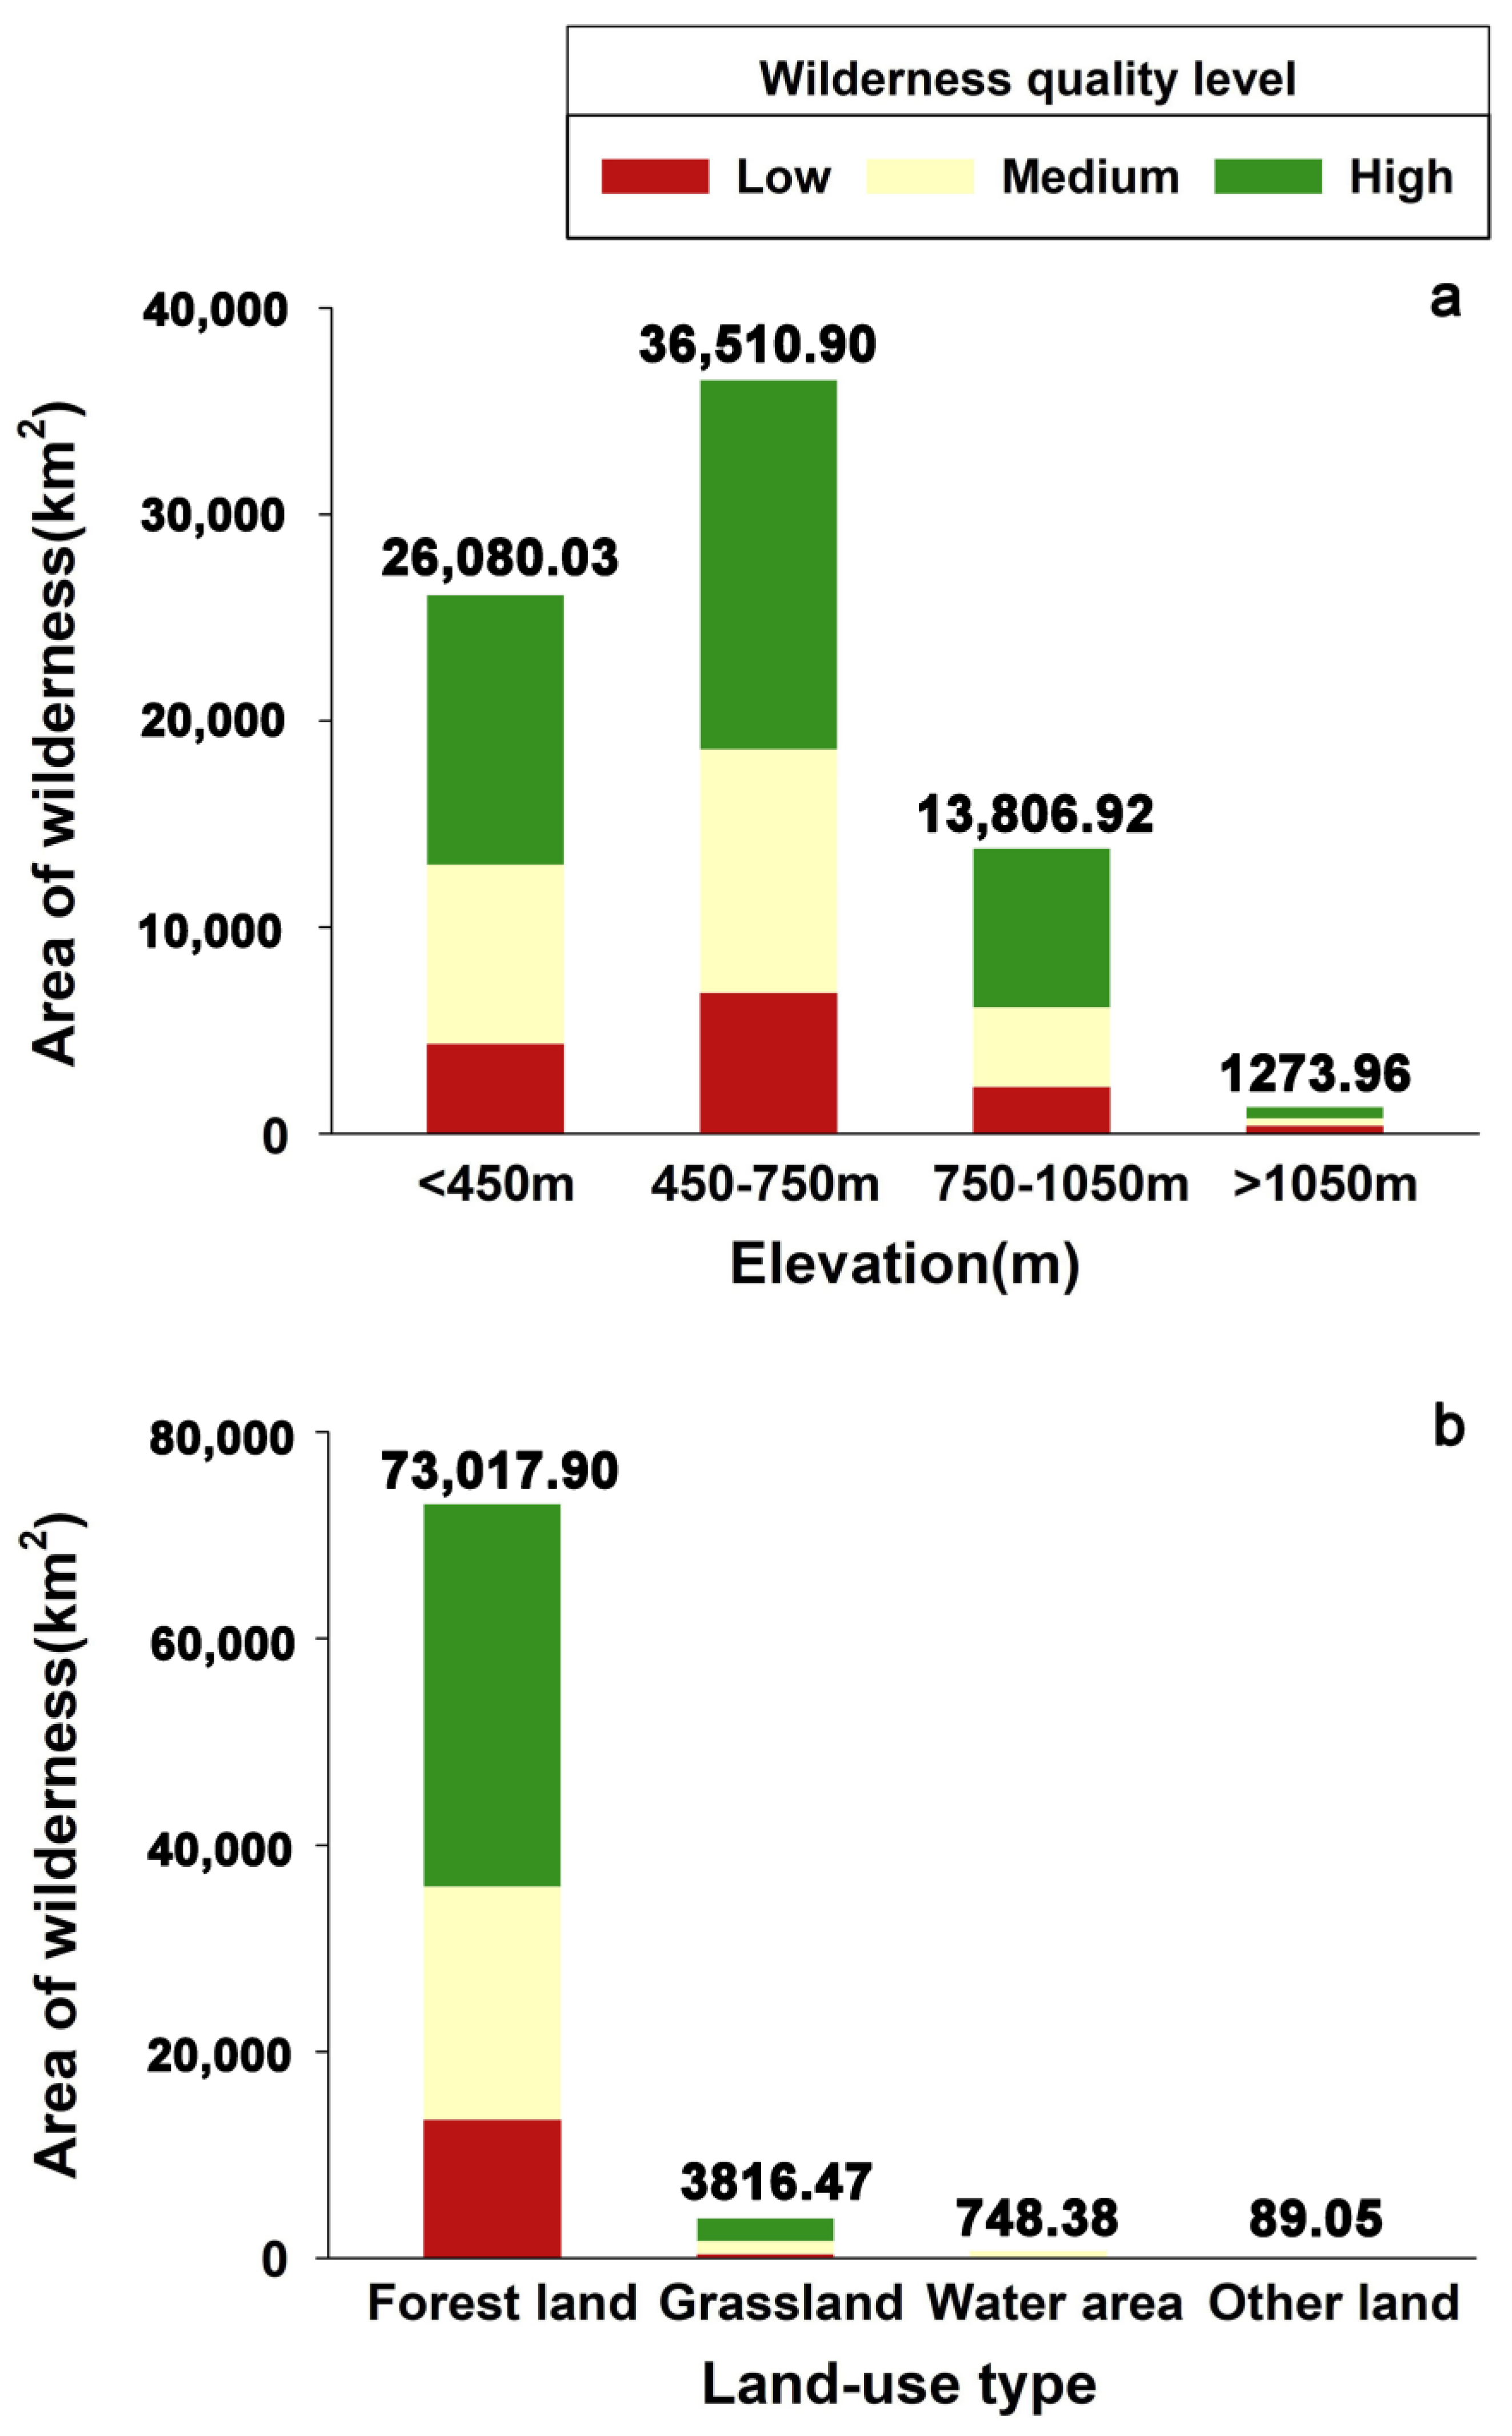
For vertical distribution (Figure 3a), most of the WAs are distributed below 750 m—i.e., in the north, east, and south of the study area, constituting 80.58% of the total area of WAs. The area of high, medium, and low-quality WAs as well as the total area of WAs increase first and then decrease rapidly with elevation, and nearly half of the WAs of each quality level are located between 450 m and 750 m. The proportion of high-quality WAs decreases slightly with increasing elevation, while the percentage of low-quality WAs increases. Nevertheless, the area of high-quality WAs still comprises about half of the WAs in each elevation range. In terms of the four major categories of land use types (Figure 3b), forest land accounts for the largest proportion of WAs reaching 94.01% of the total WAs, followed by grassland (4.91%), water area (0.96%), and other land (0.11%). Among them, 94.47% of the high-quality WAs are distributed in forest land.

Figure 3.
Characteristics of the pattern of WAs. (a) Area of wilderness areas of different quality levels at different elevations. (b) Area of wilderness areas of different quality levels for different land-use types.
3.2. ESVs of WAs
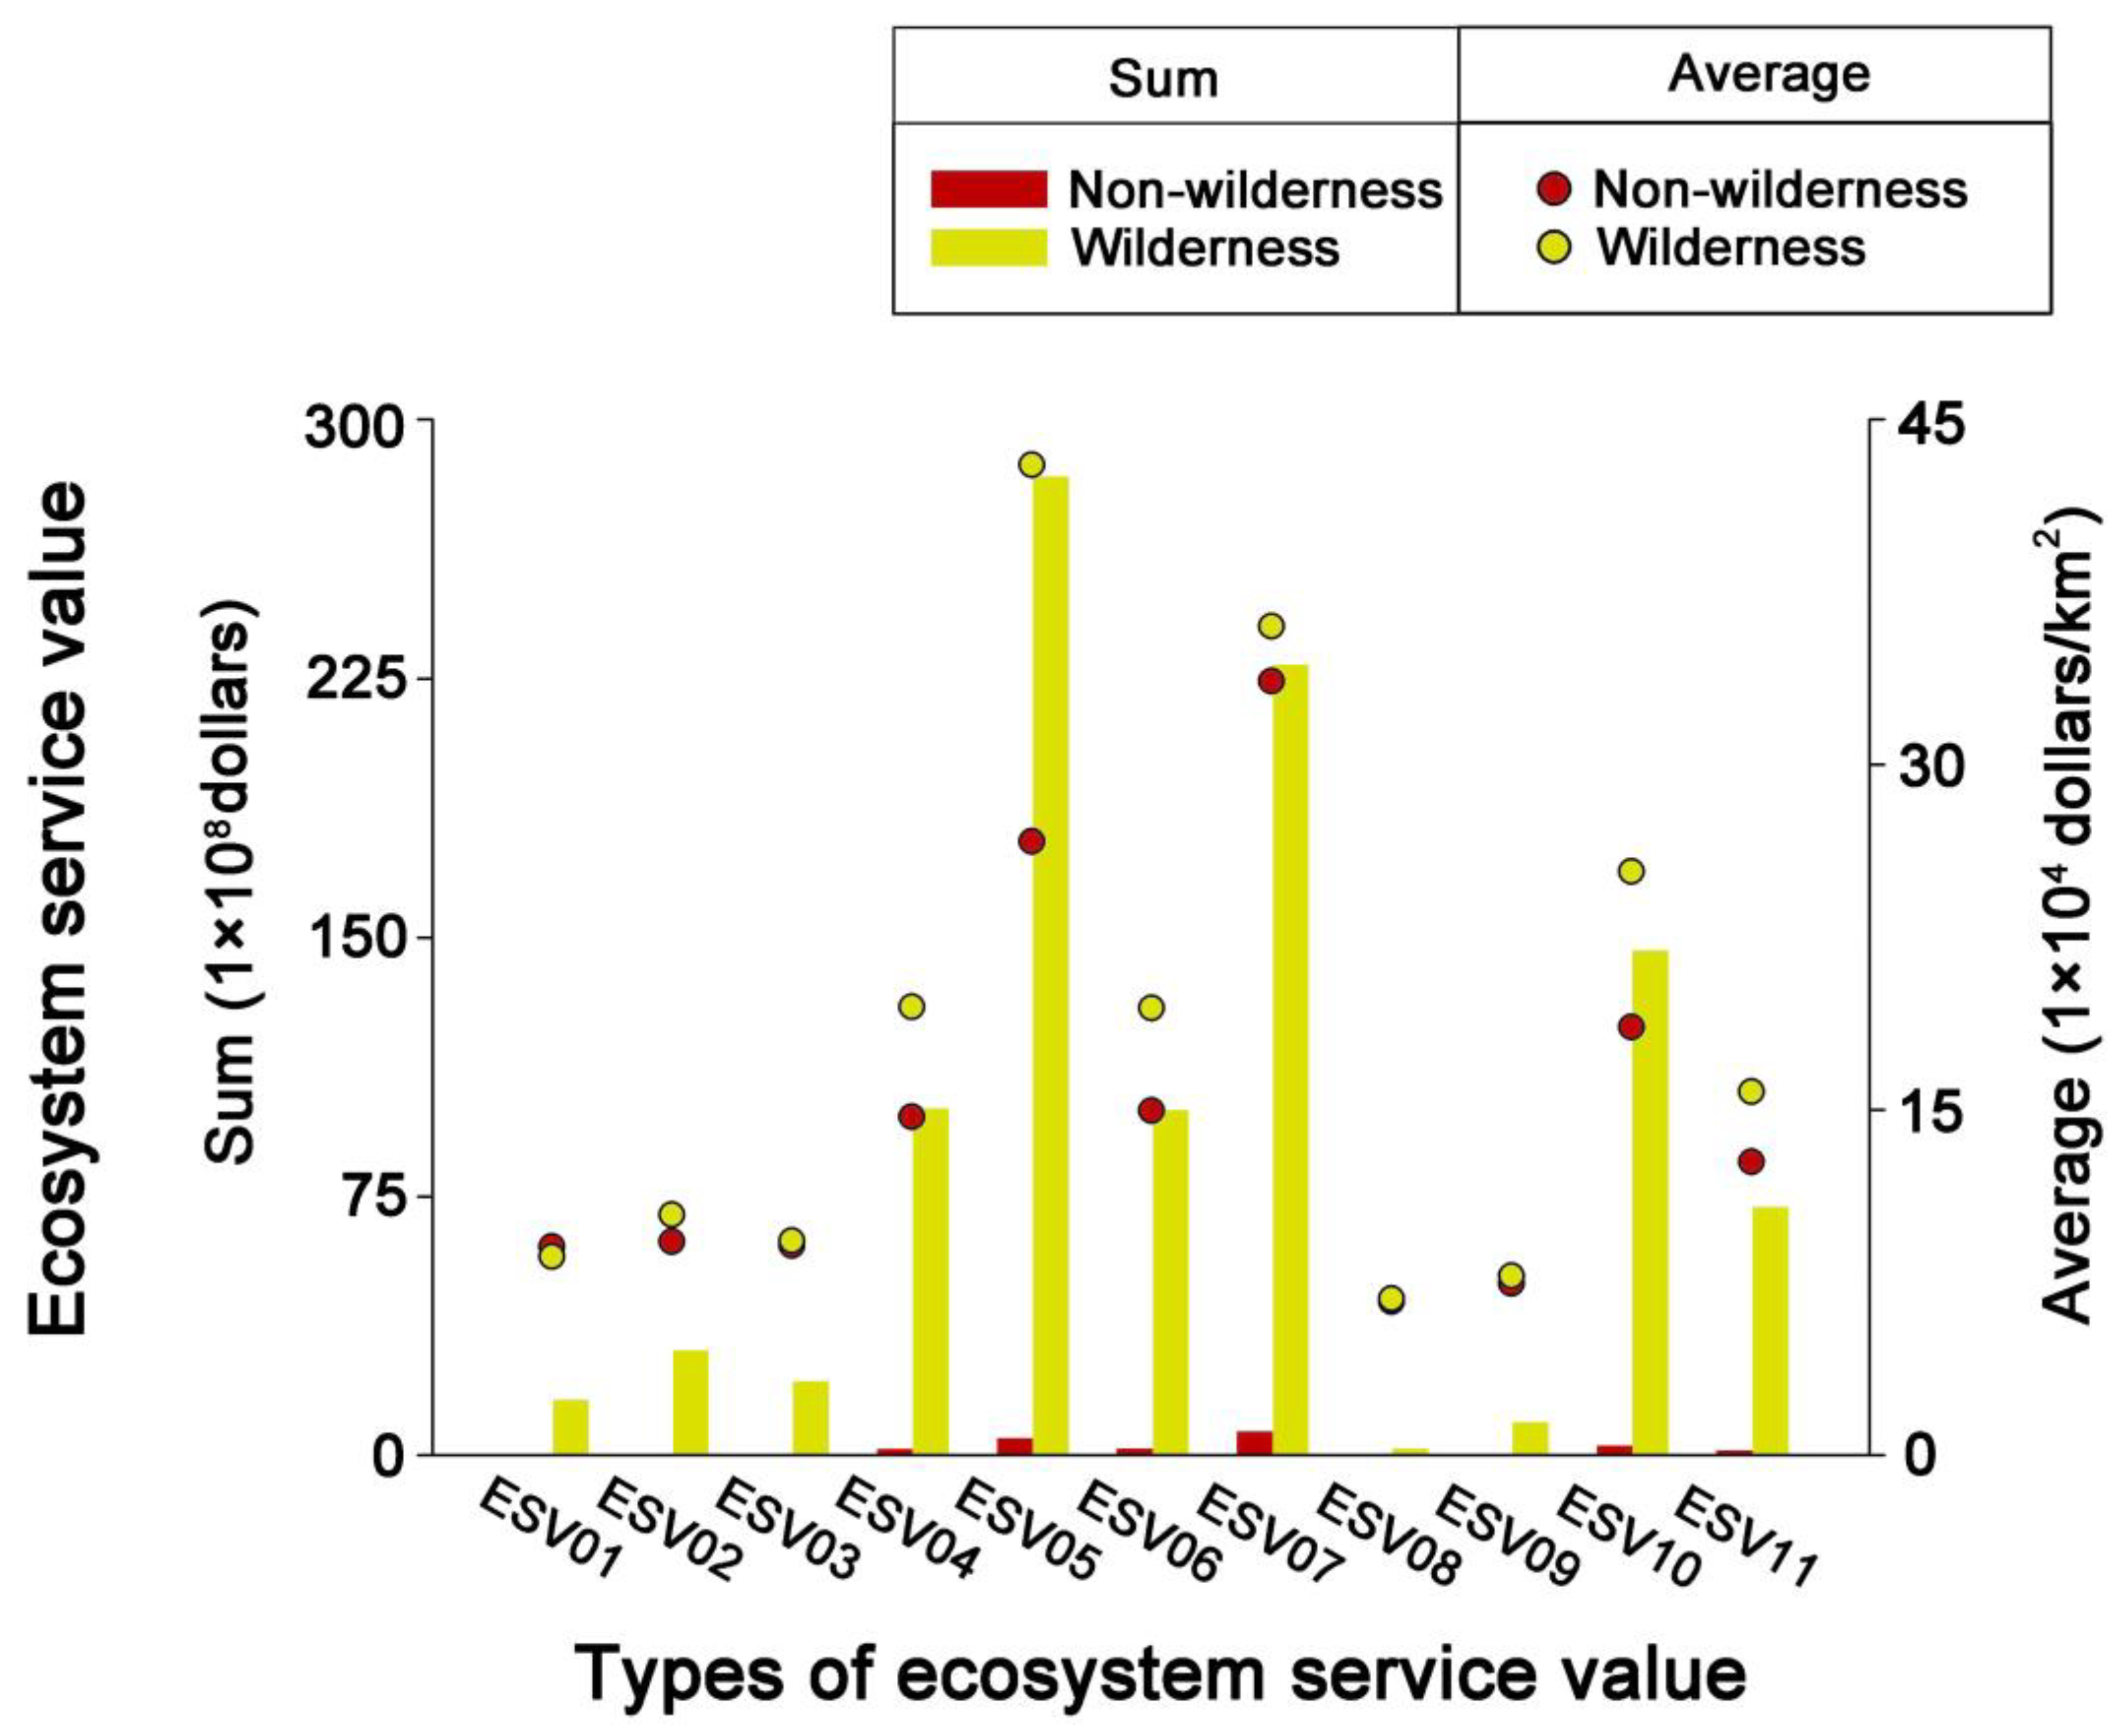
The sum of ESVs in the study area is 97.50 billion dollars, averaging 1.21 million dollars per square kilometer. Of these, the percentage of ESVs provided by WAs is 97.69%, averaging 1.23 million dollars per square kilometer. Each value of ecosystem services provided by WAs is much higher than that by non-WAs (Figure 4). For the value of each ecosystem service per square kilometer, WAs provide a higher value than non-WAs, except for food supply service. Among the different quality levels of WAs, high-quality WAs create nearly 50% of the total value of each ecosystem service (Figure 5).
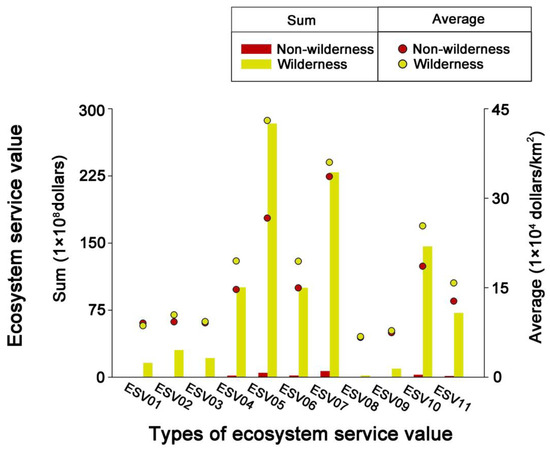
Figure 4.
ESVs of WAs and non-WAs. The dataset of ESVs includes 11 ecosystem service values subcategories including food supply (ESV01), raw material supply (ESV02), water supply (ESV03), gas regulation (ESV04), climate regulation (ESV05), environmental purification (ESV06), regulation of water flows (ESV07), soil conservation (ESV08), maintenance of nutrient cycles (ESV09), maintenance of biodiversity (ESV10), and aesthetic landscape experiences (ESV11).
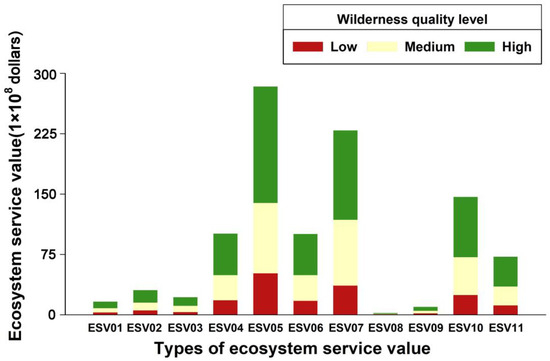
Figure 5.
ESVs of WAs of different quality levels.
3.3. Status of Wilderness Protection in PAs
The area of PAs in the state-owned forest region of Daxing’anling is 23,355.95 km2, accounting for 29.09% of the total area of the region. The proportion of WAs in the PAs is 92.26%, of which the areas of high, medium, and low-quality WAs comprises 49.56%, 28.91%, and 13.78% of the total area of the PAs, respectively. The area of WAs not protected is 56,123.94 km2, making up 72.26% of the area of WAs, of which 70.39% of high-quality WAs, 72.67% of medium-quality WAs, and 76.78% of low-quality WAs are not included in the PAs.
The percentage of area of WAs in the core, buffer, and experimental zones of nature reserves is 95.49%, 94.84%, and 86.53%, and the area of WAs in nature parks constitutes 91.91%. High-quality WAs in the core, buffer, and experimental zones of the nature reserves and in the nature parks comprise 55.54%, 55.15%, 54.96%, and 41.35% of the area of WAs in each subregion (Figure 6).
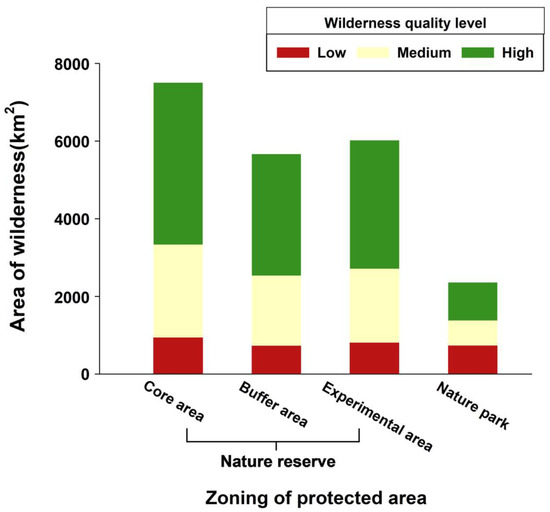
Figure 6.
Area of WAs in different zones.
More than 70% of the PAs have 90% coverage of WAs, and 20% reach more than 60% but less than 90% coverage of WAs. In contrast, NP5, NP12, NR11, and NR12 cover only 5.74%, 3.16%, 33.59%, and 1.53% of WAs (Appendix B).
3.4. Priority Conservation Areas for Wilderness Based on ESVs and PAs
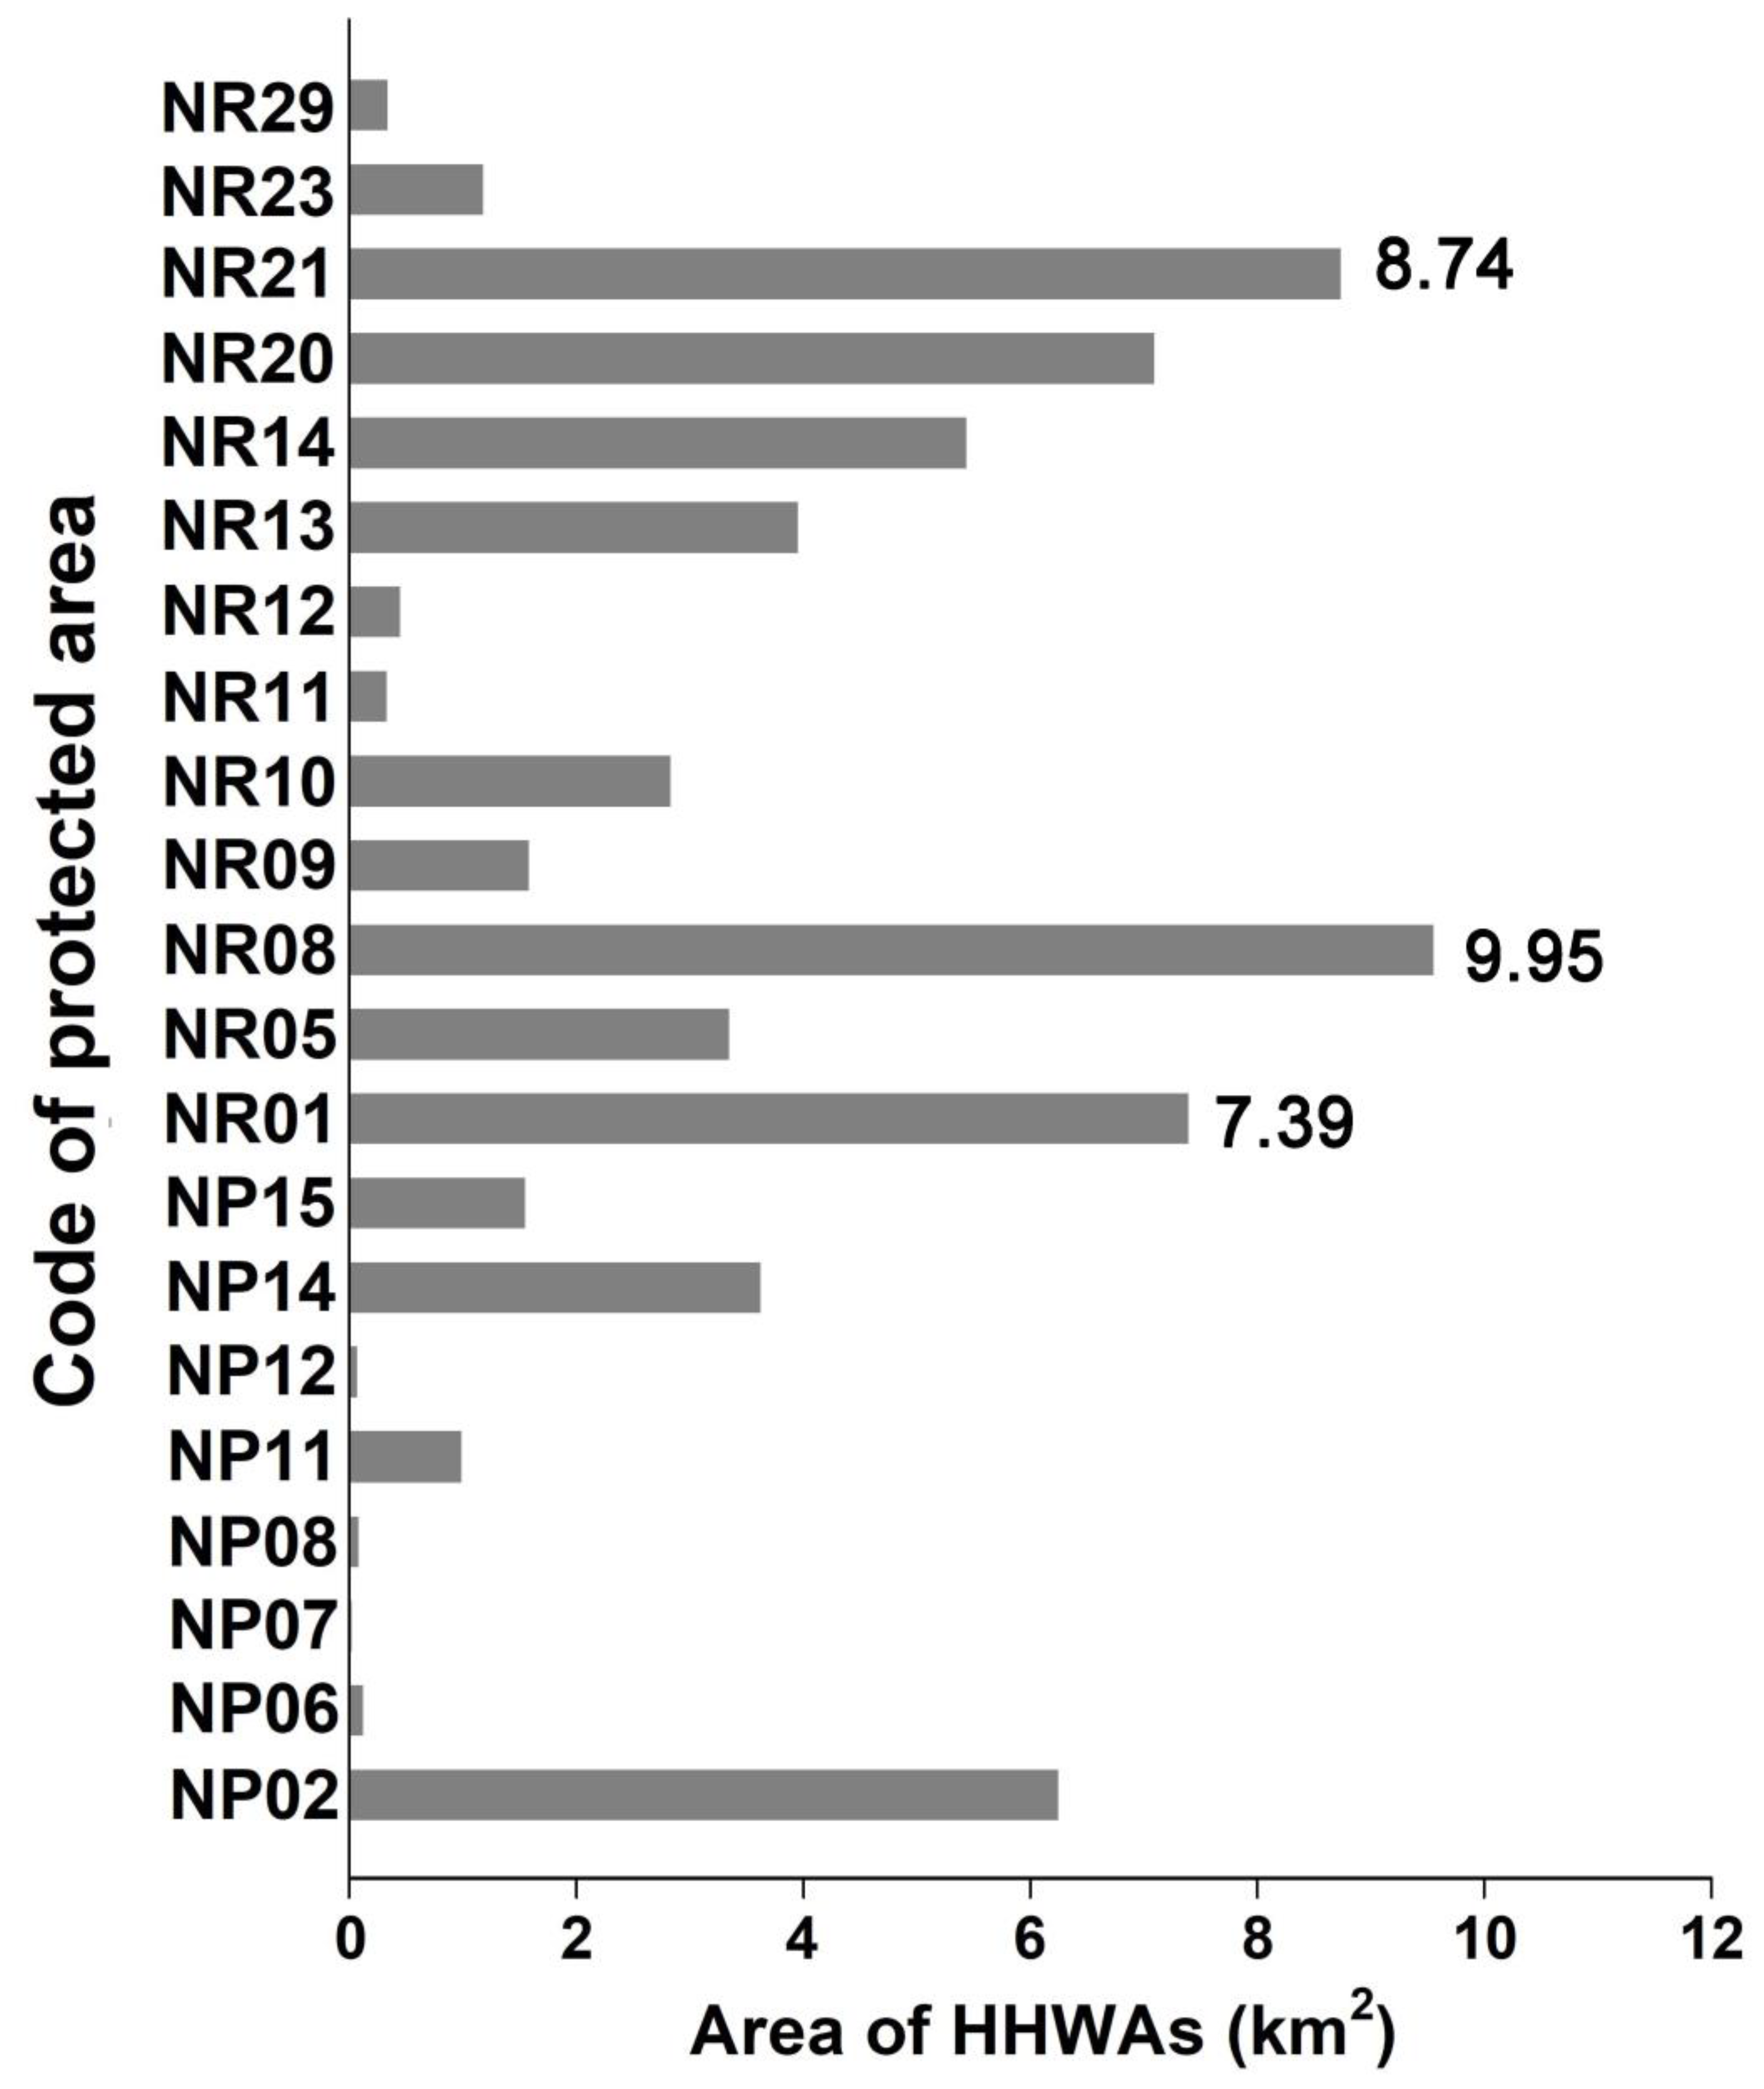
High-quality wilderness areas with high ecosystem service values (HHWAs) total 135.94 km2 or 0.18% of the study area’s WAs (Table 5).
Table 5.
Area of WAs of different wilderness quality levels with different ecosystem service value levels.
HHWAs are scattered across the study area, of which 47.74% are distributed within the boundaries of 21 PAs. NR08, NR21, and NR01 protect the largest areas of HHWAs, covering 9.55 km2, 8.74 km2, and 7.39 km2, respectively (Figure 7). Unprotected HHWAs are mainly located around NR01, NR09, and NR12 (Figure 8).

Figure 7.
Area of HHWAs in PAs.
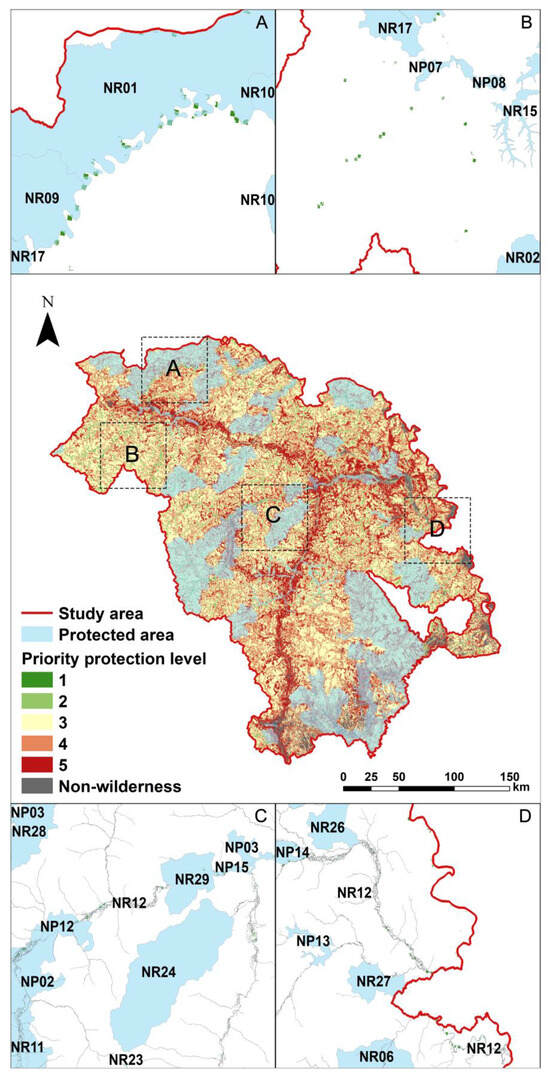
Figure 8.
The spatial distribution of HHWAs. (A) Unprotected HHWAs located around NR01 and NR09. (B) Unprotected HHWAs located in the northwest of the study area. (C) Unprotected HHWAs located around NR12. (D) Unprotected HHWAs located around NR12.
4. Discussion
4.1. The Spatial Patterns of WAs
First, this study found that high and medium-quality WAs were highly fragmented throughout the region—a result that had been presented in previous studies [34,74]. The reason for this might be that size was not a criterion for WAs identification and more accurate mapping methods were used in this study, which allowed for more precise wilderness quality for each patch. Smaller patches have a potential role in landscape connectivity and can provide important habitat and protection for some species [81]. However, some wilderness mapping studies have taken size into account and concluded that wilderness quality was directly proportional to area—i.e., the larger the wilderness area, the higher the quality and the greater the biodiversity [34]. This is consistent with the species–area relationship (SAR), in which the number of species in a community increases with habitat area [82], and there are a number of studies that demonstrate this relationship [83]. In the results of this study, the wilderness patches were fragmented, which might also be related to human activities. Due to factors such as human disturbance, habitats were gradually fragmented and habitat area was reduced, which further led to a decrease in biodiversity [84]. However, some studies have also shown that the relationship between fragmentation and biodiversity reduction is scale dependent—i.e., at small scales, fragmentation had only a moderate effect on biodiversity, independent of area, but at large scales, it had a huge effect [85]. Meanwhile, some researchers found that in fragmented landscapes containing more irregularly shaped and sized patches, fragmentation had an overcompensating effect and exceeded the effect of size, while in simple fragmented landscapes with fewer patches, the area effect was enhanced [86]. In addition, researchers have come to realize that population abundance and community structure in fragmented areas may be more influenced by edge effects and the distribution of core areas than by area [87]. Therefore, in the face of the reality of fragmented landscapes, area is one of the key factors to be considered when delineating wilderness for conservation [88], as SAR can still be used to estimate species richness as well as to predict changes in biodiversity [89]. But at the same time, the significance of small patches in biodiversity conservation should not be ignored.
Then, we once again demonstrated that remoteness from access was a valid indicator of wilderness mapping [71]. In the results of this work, the quality of wilderness was relatively influenced by railroads, and low-quality WAs were mainly distributed along railroads. Compared to roads, railroads had more significant effects on wilderness quality. In a study [34], roads were categorized as Railway, Road 1, Road 2, Road 3, and an expert-assigned scoring method was used to estimate the impact of different road levels on wilderness quality. The findings showed that Railway had a greater impact on wilderness quality, and higher-level roads carrying higher traffic volume therefore had greater impact than lower-level roads. It was also shown that different transportation road types had different impacts on landscape diversity, with the impacts of railroads being comparable to those of highways and national roads but more significant than those of provincial roads, and the spatial extent of the impacts of railroads and national roads being greater than those of highways and provincial roads [90]. Therefore, we hypothesized that despite the wider coverage of roads in the study area, railroad construction projects could destroy ecological spaces such as soil, vegetation, and water bodies along the routes, with serious ecological damage [91]. And the increased intensity of human activities brought about by the construction and operation of railroads would also exacerbate the ecological risks in the areas along the routes [92]. Currently, the number of papers on the ecological impact of roads is much higher than that of railroads, and there are also studies that treat the two as similar linear infrastructures without differentiating between them [93]. Although there are similarities between roads and railroads, they also differ in a number of ways [94], and these differences may have different impacts on the environment. Researches on the ecological impacts of railroads are still unclear and should therefore be further advanced. Nowadays, the road network expands the space for human activities and promotes cultural exchanges and economic development [95]. But, the roads divide and destroy natural ecosystems, which, in turn, lead to biodiversity reduction and ecosystem service degradation, etc. [27]. Meanwhile, the ever-developing road network improves the accessibility of human beings to remote areas [96], and human disturbances, including logging, mining, and other activities [97,98], can further cause environmental degradation. Accordingly, various projects have proposed the concept of roadless areas, which is similar to the concept of WAs, and conducted roadless area identification mainly by means of buffer zone analysis, so as to formulate protection strategies to maintain the ecological value of off-road areas [99,100]. However, in reality, it is always difficult to reconcile the two goals of ecological protection and economic development, such as the conflict between “expanding public transportation” and “preserving biodiversity” in the Sustainable Development Goals (SDGs). Therefore, it is crucial to find ways to maximize economic and ecological benefits, such as analyzing the priorities of road construction in practice [101] and building roads by using the concept and methodology of eco-roads [102].
In addition, the results of this study displayed that wilderness quality was not linearly related to elevation and that areas of relatively low elevation were instead the dominant distribution of high-quality WAs, which is a result that differed from other studies [103]. We hypothesized that although the population density of the study area decreased with increasing elevation, generally the region was sparsely populated and anthropogenic disturbances were not strong. So, population density was not a major factor influencing wilderness quality. We further analyzed that land use types might be one of the constraints on wilderness quality. The results manifested that forest land was the main land use type in this area, the proportion of forest land area in the total area of WAs and the percentage of high-quality WAs were both the largest, and the proportion of the area of forest land decreased slightly with increasing elevation, which was consistent with the trend that the percentage of high-quality WAs decreased slightly with increasing elevation. In addition, more than half of the protected areas in the region were located in the middle and low elevation zones, and greater protection might be one of the factors for the higher quality of the wilderness. In addition, apparent naturalness might also have a major influence on wilderness quality due to the better visibility of man-made facilities at higher elevation.
4.2. How Can High-Quality WAs with High ESVs Be Protected?
This study revealed that the ESVs provided by WAs were much higher than those of non-WAs, and the value of food supply service per square kilometer provided by non-WAs was higher than that of WAs. The above results were consistent with those of another paper [41]. We speculated that cultivated land accounted for 74.45% of the total area of non-WAs, so non-WAs could provide a higher value of food supply service per square kilometer. Furthermore, forest land, as the main component of WAs and the dominant ecosystem type in the region, provided huge ESVs [104]. And since the implementation of the Tianbao project, forests in the state-owned forest region of Daxing’anling, which had suffered a decline in ecosystem service functions due to timber harvesting, have been further restored [105,106,107].
PAs serve as an effective means of protecting biodiversity and maintaining the value of ecosystem services [108], while preventing the disappearance of more WAs [44]. PAs in China have developed over the years, and as of May 2017, there were more than 12,000 PAs of various types, with a total area covering nearly 18% of China’s land area [109]. China’s conservation actions have made great achievements and contributed to global biodiversity conservation. In this study, the coverage rate of PAs was 29.09%, which is higher than the national level, but it was less than the 50% protection ratio proposed by Harvey Locke [110] and E.O. Wilson [111]. In addition, it points out that the proportion of forest vegetation type areas in China covered by PAs is low compared to other vegetation types [112]. And forest land, as the main land use type in the region, is also the main distribution area of high-quality WAs. The results of this study showed that more than half of the high-quality WAs with high ESVs were not included in the scope of PAs. At the same time, these wilderness patches are extremely susceptible to degradation and even disappearance due to their small size and fragmentation [41]. Therefore, effective conservation actions are urgent.
In recent years, China has gradually developed a system of PAs, with national parks as the mainstay, which has also provided a framework for wilderness protection. For WAs that are already under protection, wilderness threat factors should continue to be assessed and monitored [113], and protection actions should be maintained and strengthened. For high-quality WAs with conservation value but excluded in the scope of protection, they can be included in the scope of the nearby PAs [2], or the connectivity between small WAs can be strengthened to form a wilderness protection network [46,54]. For areas with relatively low wilderness quality but with potential for restoration, rewilding actions can be taken to enhance ecosystem resilience and maintain biodiversity [114]. Meanwhile, considering that the study area borders Russia, cross-border wilderness protection will also help to ensure the connectivity and integrity of the wilderness [74,115]. In addition, WAs are of great value to national health and spirituality [116,117], and the realization of wilderness for all, such as appropriate recreational and educational activities in the WAs, is also an issue that needs to be taken into account in the planning of zoning.
4.3. Limitations and Future Research
Although this study explored the spatial pattern of WAs in the state-owned forest region of Daxing’anling using relatively accurate mapping methods and identified priority conservation areas based on the current status of wilderness protection in terms of the ESVs and PAs, which provided a reference for wilderness protection in northeastern China, there were some limitations. First of all, there was a lack of uniform standards for wilderness mapping methods, which may lead to an overestimation or underestimation of the size of WAs. It is necessary to utilize higher resolution datasets and more accurate threshold delineation methods in future studies [42], while a combination of subjective and objective weighting can be used in the weighting of indicators [52], as well as field validation is important for the mapping results [29]. Second, the angle of this study was relatively single, and future studies can also consider multiple perspectives from visitors, local residents, and other relevant stakeholders, which are more conducive to the conservation and planning of wilderness at the protected-area scale [53,118]. In addition, the ESVs considered in this study were only part of the value provided by WAs, and more natural, economic, and social factors need to be considered when prioritizing wilderness protection [41].
5. Conclusions
In this study, wilderness mapping was conducted with a combination of the Boolean and MCE method, and priority protection area identification was carried out based on ESVs and the current status of wilderness protection in PAs in GIS. The results showed that the WAs in the state-owned forest region of Daxing’anling were extremely rich, and wilderness quality was greatly affected by railroads. In addition, WAs had higher ESVs than non-WAs, and PAs of the study area covered nearly half of the high-quality WAs with high ESVs. However, there are protection gaps in WAs, so effective conservation actions are urgently needed. This study provided a basis for wilderness protection at the regional scale, and we hope that more wilderness mapping and conservation gap studies at different scales and in different regions using rigorous methodologies will provide insights into wilderness protection in the future.
Author Contributions
All authors made valuable contributions to this paper. Conceptualization, X.L. and Q.W.; methodology, Q.W. and A.F.; formal analysis, Q.W.; data curation, C.Y. and P.H.; writing—original draft preparation, Q.W.; writing—review and editing, Q.W., X.L. and A.F.; visualization, Q.W. and A.F.; supervision, X.L. All authors have read and agreed to the published version of the manuscript.
Funding
This research received no external funding.
Institutional Review Board Statement
Not applicable.
Data Availability Statement
The data presented in this study are available in the public domain listed in this article.
Conflicts of Interest
The authors declare no conflicts of interest.
Abbreviations
| AN | apparent naturalness |
| BN | biophysical naturalness |
| DSM | digital surface model |
| ESVs | ecosystem service values |
| GBF | Global Biodiversity Framework |
| GIS | geographic information system |
| HHWAs | high-quality wilderness areas with high ecosystem service values |
| IUCN | International Union for Conservation of Nature |
| MCE | Multi-Criteria Evaluation |
| NCSFGI | National Catalogue Service for Geographic Information |
| NPs | nature parks |
| NRs | nature reserves |
| PAs | protected areas |
| PD | population density |
| RA | remoteness from access |
| RESDC | Data Center for Resources and Environmental Sciences, Chinese Academy of Sciences |
| RS | remoteness from settlements |
| SAR | species–area relationship |
| SDGs | Sustainable Development Goals |
| TR | terrain ruggedness |
| VRM | vector ruggedness measurement |
| WAs | wilderness areas |
| WLC | weighted linear combination |
Appendix A. Results on Percent of Eigenvalues and Accumulative of Eigenvalues
| PC Layer | Percent of Eigenvalues (%) | Accumulative of Eigenvalues (%) |
| 1 | 58.9152 | 58.9152 |
| 2 | 22.5926 | 81.5078 |
| 3 | 9.8194 | 91.3273 |
| 4 | 7.7035 | 99.0307 |
| 5 | 0.7058 | 99.7365 |
| 6 | 0.2635 | 100.0000 |
Appendix B. Area of WAs in PAs
| Code of PAs | Name of PAs | Area of WAs/Area of PAs (%) |
| NP01 | Jiagedaqi National Forest Park | 95.87% |
| NP02 | Huzhong National Forest Park | 96.10% |
| NP03 | Zhalinkule National Forest Park | 97.11% |
| NP04 | Mohe National Geopark | 92.97% |
| NP05 | Huzhong Cangshan Stone Forest Geopark | 5.74% |
| NP06 | Amur National Wetland Park | 91.36% |
| NP07 | Mohe Dalin River National Wetland Park | 86.75% |
| NP08 | Mohe Jiuqushibawan National Wetland Park | 88.65% |
| NP09 | Jiagedaqi Gan River National Wetland Park | 61.25% |
| NP10 | Candu River National Wetland Park | 98.69% |
| NP11 | Guli River National Wetland Park | 96.43% |
| NP12 | Huzhong Source of Huma River National Wetland Park | 3.16% |
| NP13 | Source of Shuang River National Wetland Park | 94.05% |
| NP14 | Shibazhan Huma River National Wetland Park | 85.97% |
| NP15 | Ta River Guqigu National Wetland Park | 62.77% |
| NP16 | Xinlin Aokusakaai River Wetland Park | 93.35% |
| NR01 | Arctic Village National Nature Reserve | 96.10% |
| NR02 | Lingfeng National Nature Reserve | 99.01% |
| NR03 | Duobukuer National Nature Reserve | 88.90% |
| NR04 | Nanweng River National Nature Reserve | 99.09% |
| NR05 | Huzhong National Nature Reserve | 82.23% |
| NR06 | Chuona River National Nature Reserve | 98.98% |
| NR07 | Panzhong National Nature Reserve | 99.17% |
| NR08 | Shuanghe National Nature Reserve | 95.16% |
| NR09 | Mohe Dusiyueju Provincial Nature Reserve | 98.74% |
| NR10 | Changqing Provincial Nature Reserve | 98.20% |
| NR11 | Huyuan Salix bracteosa Provincial Nature Reserve | 33.59% |
| NR12 | Huma River Nature Reserve | 1.53% |
| NR13 | Pangu River Provincial Nature Reserve | 98.35% |
| NR14 | Emuer River Inlet Wetland Prefecture-level Nature Reserve | 91.73% |
| NR15 | Emuer River Wetland Prefecture-level Nature Reserve | 97.57% |
| NR16 | Jingou Prefecture-level Nature Reserve | 98.78% |
| NR17 | Menduli River Wetland Prefecture-level Nature Reserve | 99.32% |
| NR18 | Yixi Prefecture-level Nature Reserve | 99.23% |
| NR19 | Beiqing Wolverine Prefecture-level Nature Reserve | 98.70% |
| NR20 | Hannuo River Wetland Prefecture-level Nature Reserve | 95.60% |
| NR21 | Naduli River Wetland Prefecture-level Nature Reserve | 80.16% |
| NR22 | Nayuan Wading Bird and Migratory Bird Prefecture-level Nature Reserve | 98.74% |
| NR23 | Tahe Headwaters Wetland Prefecture-level Nature Reserve | 96.22% |
| NR24 | Xinlin Daqingshan Peat Moss Wetland Prefecture-level Nature Reserve | 99.02% |
| NR25 | Huzhong Taiga Musk Deer Prefecture-level Nature Reserve | 89.69% |
| NR26 | Halabaqi Wetland Prefecture-level Nature Reserve | 98.08% |
| NR27 | Wolegen River Wetland Prefecture-level Nature Reserve | 98.37% |
| NR28 | Pangu River Peat Moss Wetland Prefecture-level Nature Reserve | 99.12% |
| NR29 | Talin Prefecture-level Nature Reserve | 97.06% |
| NR30 | Wujiabeini River Prefecture-level Nature Reserve | 98.88% |
| NR31 | Xiufeng Prefecture-level Nature Reserve | 99.49% |
References
- Cookson, L.J. A definition for wildness. Ecopsychology 2011, 3, 187–193. [Google Scholar] [CrossRef]
- Watson, J.E.M.; Venter, O.; Lee, J.; Jones, K.R.; Robinson, J.G.; Possingham, H.P.; Allan, J.R. Protect the last of the wild. Nature 2018, 563, 27–30. [Google Scholar] [CrossRef] [PubMed]
- Di Marco, M.; Ferrier, S.; Harwood, T.D.; Hoskins, A.J.; Watson, J.E.M. Wilderness areas halve the extinction risk of terrestrial biodiversity. Nature 2019, 573, 582–585. [Google Scholar] [CrossRef] [PubMed]
- Ripple, W.J.; Estes, J.A.; Beschta, R.L.; Wilmers, C.C.; Ritchie, E.G.; Hebblewhite, M.; Berger, J.; Elmhagen, B.; Letnic, M.; Nelson, M.P.; et al. Status and ecological effects of the world’s largest carnivores. Science 2014, 343, 1241484–1241496. [Google Scholar] [CrossRef] [PubMed]
- Mittermeier, R.A.; Mittermeier, C.G.; Brooks, T.M.; Pilgrim, J.D.; Konstant, W.R.; da Fonseca, G.A.B.; Kormos, C. Wilderness and biodiversity conservation. Proc. Natl. Acad. Sci. USA 2003, 100, 10309–10313. [Google Scholar] [CrossRef]
- Martin, T.G.; Watson, J.E.M. Intact ecosystems provide best defence against climate change. Nat. Clim. Change 2016, 6, 122–124. [Google Scholar] [CrossRef]
- Cooper, N.; Brady, E.; Steen, H.; Bryce, R. Aesthetic and spiritual values of ecosystems: Recognising the ontological and axiological plurality of cultural ecosystem ‘services’. Ecosyst. Serv. 2016, 21, 218–229. [Google Scholar] [CrossRef]
- Foster, F.A. Mapping Impacts of Education for Wilderness Management Planning; University of Alaska Fairbanks: Fairbanks, AK, USA, 1998. [Google Scholar]
- Watson, J.E.M.; Shanahan, D.F.; Di Marco, M.; Allan, J.; Laurance, W.F.; Sanderson, E.W.; Mackey, B.; Venter, O. Catastrophic declines in wilderness areas undermine global environment targets. Curr. Biol. 2016, 26, 2929–2934. [Google Scholar] [CrossRef]
- Jones, K.R.; Klein, C.J.; Halpern, B.S.; Venter, O.; Grantham, H.; Kuempel, C.D.; Shumway, N.; Friedlander, A.M.; Possingham, H.P.; Watson, J.E.M. The location and protection status of Earth’s diminishing marine wilderness. Curr. Biol. 2018, 28, 2506–2512.e3. [Google Scholar] [CrossRef]
- Williams, B.A.; Venter, O.; Allan, J.R.; Atkinson, S.C.; Rehbein, J.A.; Ward, M.; Di Marco, M.; Grantham, H.S.; Ervin, J.; Goetz, S.J.; et al. Change in terrestrial human footprint drives continued loss of intact ecosystems. One Earth 2020, 3, 371–382. [Google Scholar] [CrossRef]
- Theobald, D.M.; Kennedy, C.; Chen, B.; Oakleaf, J.; Baruch-Mordo, S.; Kiesecker, J. Earth transformed: Detailed mapping of global human modification from 1990 to 2017. Earth Syst. Sci. Data 2020, 12, 1953–1972. [Google Scholar] [CrossRef]
- Venter, O.; Sanderson, E.W.; Magrach, A.; Allan, J.R.; Beher, J.; Jones, K.R.; Possingham, H.P.; Laurance, W.F.; Wood, P.; Fekete, B.M.; et al. Sixteen years of change in the global terrestrial human footprint and implications for biodiversity conservation. Nat. Commun. 2016, 7, 12558–12568. [Google Scholar] [CrossRef]
- Jones, K.R.; Venter, O.; Fuller, R.A.; Allan, J.R.; Maxwell, S.L.; Jose Negret, P.; Watson, J.E.M. One-third of global protected land is under intense human pressure. Science 2018, 360, 788–791. [Google Scholar] [CrossRef] [PubMed]
- Li, F.; Li, W.; Li, F.; Long, Y.; Guo, S.; Li, X.; Lin, C.; Li, J. Global projections of future wilderness decline under multiple IPCC Special Report on Emissions Scenarios. Resour. Conserv. Recycl. 2022, 177, 105983–105994. [Google Scholar] [CrossRef]
- Aycrigg, J.L.; Mccarley, T.R.; Belote, R.T.; Martinuzzi, S. Wilderness areas in a changing landscape: Changes in land use, land cover, and climate. Ecol. Appl. 2022, 32, e02471. [Google Scholar] [CrossRef]
- Sæþórsdóttir, A.D.; Hall, C.M.; Saarinen, J. Making wilderness: Tourism and the history of the wilderness idea in Iceland. Polar Geogr. 2011, 34, 249–273. [Google Scholar] [CrossRef]
- Wu, C.Z.; Ouyang, Y.Q.; Pan, W.Q.; Zheng, J. The significance and approaches of defining wilderness zone in Chinese national parks. Chin. Landsc. Archit. 2022, 38, 10–15. [Google Scholar]
- Cao, Y.; Yang, R. Identification of wilderness areas from global to China: Review and prospect on wilderness mapping. Environ. Prot. 2017, 45, 39–44. [Google Scholar]
- Myers, N.; Mittermeier, R.A.; Mittermeier, C.G.; da Fonseca, G.A.B.; Kent, J. Biodiversity hotspots for conservation priorities. Nature 2000, 403, 853–858. [Google Scholar] [CrossRef]
- Beier, P.; Spencer, W.; Baldwin, R.F.; Mcrae, B.H. Toward best practices for developing regional connectivity maps. Conserv. Biol. 2011, 25, 879–892. [Google Scholar] [CrossRef]
- Lesslie, R.G.; Taylor, S.G. The wilderness continuum concept and its implications for Australian wilderness preservation policy. Biol. Conserv. 1985, 32, 309–333. [Google Scholar] [CrossRef]
- Mccloskey, J.M.; Spalding, H. A reconnaissance-level inventory of the amount of wilderness remaining in the world. Ambio 1989, 18, 221–227. [Google Scholar]
- Carver, S.; Comber, A.; Mcmorran, R.; Nutter, S. A GIS model for mapping spatial patterns and distribution of wild land in Scotland. Landsc. Urban Plan. 2012, 104, 395–409. [Google Scholar] [CrossRef]
- Carruthers-Jones, J.; Eldridge, A.; Guyot, P.; Hassall, C.; Holmes, G. The call of the wild: Investigating the potential for ecoacoustic methods in mapping wilderness areas. Sci. Total Environ. 2019, 695, 133797–133807. [Google Scholar] [CrossRef]
- Sanderson, E.W.; Jaiteh, M.; Levy, M.A.; Redford, K.H.; Wannebo, A.V.; Woolmer, G. The human footprint and the last of the wild: The human footprint is a global map of human influence on the land surface, which suggests that human beings are stewards of nature, whether we like it or not. BioScience 2002, 52, 891–904. [Google Scholar] [CrossRef]
- Ibisch, P.L.; Hoffmann, M.T.; Kreft, S.; Pe’er, G.; Kati, V.; Biber-Freudenberger, L.; Dellasala, D.A.; Vale, M.M.; Hobson, P.R.; Selva, N. A global map of roadless areas and their conservation status. Science 2016, 354, 1423–1427. [Google Scholar] [CrossRef]
- Lesslie, R.G.; Mackey, B.G.; Preece, K.M. A computer-based method of wilderness evaluation. Environ. Conserv. 1988, 15, 225–232. [Google Scholar] [CrossRef]
- Müller, A.; Bøcher, P.K.; Svenning, J.C. Where are the wilder parts of anthropogenic landscapes? A mapping case study for Denmark. Landsc. Urban Plan. 2015, 144, 90–102. [Google Scholar] [CrossRef]
- Măntoiu, D.Ş.; Nistorescu, M.C.; Şandric, I.C.; Mirea, I.C.; Hăgătiş, A.; Stanciu, E. Wilderness areas in Romania: A case study on the South Western Carpathians. In Mapping Wilderness Concepts, Techniques and Applications; Springer: Dordrecht, The Netherlands, 2016; pp. 145–156. [Google Scholar]
- Barr, B.W.; Kliskey, A.D. “I know it when I see it”: Identifying ocean wilderness using a photo-based survey approach. Glob. Ecol. Conserv. 2014, 2, 72–80. [Google Scholar] [CrossRef]
- Barr, B.W.; Kliskey, A.D. Perceptions of wilderness and their application to ocean and coastal waters. Ocean Coast. Manag. 2014, 96, 1–11. [Google Scholar] [CrossRef]
- Dinerstein, E.; Olson, D.; Joshi, A.; Vynne, C.; Burgess, N.D.; Wikramanayake, E.; Hahn, N.; Palminteri, S.; Hedao, P.; Noss, R.; et al. An ecoregion-based approach to protecting half the terrestrial realm. BioScience 2017, 67, 534–545. [Google Scholar] [CrossRef] [PubMed]
- Cao, Y.; Carver, S.; Yang, R. Mapping wilderness in China: Comparing and integrating Boolean and WLC approaches. Landsc. Urban Plan. 2019, 192, 103636–103649. [Google Scholar] [CrossRef]
- Pimm, S.L.; Jenkins, C.N.; Li, B.V. How to protect half of Earth to ensure it protects sufficient biodiversity. Sci. Adv. 2018, 4, eaat2616. [Google Scholar] [CrossRef]
- Honkanen, M.; Roberge, J.M.; Rajasärkkä, A.; Mönkkönen, M. Disentangling the effects of area, energy and habitat heterogeneity on boreal forest bird species richness in protected areas. Glob. Ecol. Biogeogr. 2010, 19, 61–71. [Google Scholar] [CrossRef]
- Cho, S.H.; Thiel, K.; Armsworth, P.R.; Sharma, B.P. Effects of protected area size on conservation return on investment. Environ. Manag. 2019, 63, 777–788. [Google Scholar] [CrossRef]
- Armsworth, P.R.; Jackson, H.B.; Cho, S.H.; Clark, M.; Fargione, J.E.; Iacona, G.D.; Kim, T.; Larson, E.R.; Minney, T.; Sutton, N.A. Is conservation right to go big? Protected area size and conservation return-on-investment. Biol. Conserv. 2018, 225, 229–236. [Google Scholar] [CrossRef]
- Wu, R.; Long, Y.; Malanson, G.P.; Garber, P.A.; Zhang, S.; Li, D.; Zhao, P.; Wang, L.; Duo, H. Optimized spatial priorities for biodiversity conservation in China: A systematic conservation planning perspective. PLoS ONE 2014, 9, e103783. [Google Scholar] [CrossRef] [PubMed]
- Di Vittorio, A.V.; Narayan, K.B.; Patel, P.; Calvin, K.; Vernon, C.R. Doubling protected land area may be inefficient at preserving the extent of undeveloped land and could cause substantial regional shifts in land use. GCB Bioenergy 2023, 15, 185–207. [Google Scholar] [CrossRef]
- Cao, Y.; Wang, F.; Tseng, T.H.; Carver, S.; Chen, X.; Zhao, J.; Yu, L.; Li, F.; Zhao, Z.; Yang, R. Identifying ecosystem service value and potential loss of wilderness areas in China to support post-2020 global biodiversity conservation. Sci. Total Environ. 2022, 846, 157348–157358. [Google Scholar] [CrossRef]
- Wang, L.; Fu, J.; Ji, X.; Tan, P.; Li, Y. Spatio-temporal variation and conservation priorities of wilderness in Lhasa River Basin, Tibetan Plateau. Front. Ecol. Evol. 2023, 11, 1254540. [Google Scholar] [CrossRef]
- Tricker, J.; Landres, P. Mapping threats to wilderness character in the National Wilderness Preservation System. Biol. Conserv. 2018, 227, 243–251. [Google Scholar] [CrossRef]
- Cao, Y.; Tseng, T.H.; Wang, F.; Jacobson, A.; Yu, L.; Zhao, J.; Carver, S.; Locke, H.; Zhao, Z.; Yang, R. Potential wilderness loss could undermine the post-2020 global biodiversity framework. Biol. Conserv. 2022, 275, 109753–109763. [Google Scholar] [CrossRef]
- Xu, B.; Zhang, Y. Simulation and optimization of spatial land use of tropical forest ecological protection in southern border of Yunnan based on “wild wisdom”. J. Ecol. Rural Environ. 2022, 38, 851–859. [Google Scholar]
- Cao, Y.; Long, Y.; Yang, R. Research on the identification and spatial distribution of wilderness areas at the national scale in mainland China. Chin. Landsc. Archit. 2017, 33, 26–33. [Google Scholar]
- Ma, S.; Long, Y. Mapping potential wilderness in China with location-based services data. Appl. Spat. Anal. Policy 2020, 13, 69–89. [Google Scholar] [CrossRef]
- Lin, S.; Wu, R.; Hua, C.; Ma, J.; Wang, W.; Yang, F.; Wang, J. Identifying local-scale wilderness for on-ground conservation actions within a global biodiversity hotspot. Sci. Rep. 2016, 6, 25898–259110. [Google Scholar] [CrossRef]
- Zuo, X.; Han, X.; Chen, J.; Peng, J. The pattern analyze of wilderness in Dali City. Chin. Landsc. Archit. 2019, 35, 108–112. [Google Scholar]
- Zuo, X.; Peng, S.; Peng, J. The pattern analysis of wilderness in Malong District, Qujing City. J. Southwest For. Univ. (Nat. Sci.) 2020, 40, 124–131. [Google Scholar]
- Deng, Z.; Li, X.; Yang, H.; Gan, S. Assessing the spatial pattern of wilderness in central Yunnan: A case study from Chuxiong county, Yunnan. IOP Conf. Ser. Earth Environ. Sci. 2021, 783, 012085–012097. [Google Scholar] [CrossRef]
- Zhang, P.; Zhong, Q.; Li, M.; Wang, H.; Cui, J. Wilderness mapping in northeast China based on deep learning. In Proceedings of the IGARSS 2022–2022 IEEE International Geoscience and Remote Sensing Symposium, Kuala Lumpur, Malaysia, 17–22 July 2022; pp. 2880–2883. [Google Scholar]
- Weng, A.; Liao, L.; Cao, Y.; Carver, S.; Lin, L.; Shen, S.; Xu, Z.; Dong, J.; Lan, S.; Yang, R. Different people, different wild: Comparing and mapping wilderness representation in Wuyishan National Park, China. Geogr. Sustain. 2024, 5, 144–156. [Google Scholar] [CrossRef]
- Xu, B.; Zhang, Y.; Lin, W. A connectivity modeling and evaluating methodological framework in biodiversity hotspots based on naturalness and linking wilderness. Conserv. Sci. Pract. 2022, 4, e12750. [Google Scholar] [CrossRef]
- Cao, Y.; Yang, R.; Carver, S. Linking wilderness mapping and connectivity modelling: A methodological framework for wildland network planning. Biol. Conserv. 2020, 251, 108679–108688. [Google Scholar] [CrossRef]
- Caro, T.; Darwin, J.; Forrester, T.; Ledoux-Bloom, C.; Wells, C. Conservation in the anthropocene. In Keeping the Wild: Against the Domestication of Earth; Island Press: Washington, DC, USA, 2014; pp. 109–113. [Google Scholar]
- Cao, Y.; Yang, R. Systematic conservation strategies of China’s wilderness areas under the background of the Post-2020 Global Biodiversity Framework. Chin. Landsc. Archit. 2022, 38, 6–9. [Google Scholar]
- Zhao, H.Y.; Gong, L.J.; Qu, H.H.; Zhu, H.X.; Li, X.F.; Zhao, F. The climate change variations in the northern Greater Khingan Mountains during the past centuries. J. Geogr. Sci. 2016, 26, 585–602. [Google Scholar] [CrossRef]
- Sun, B.F.; Zhao, H.; Lu, F.; Wang, X. Spatial and temporal patterns of carbon sequestration in the northeastern forest regions and its impact factors analysis. Acta Ecol. Sin. 2018, 38, 4975–4983. [Google Scholar]
- Hu, L.; Fan, W.; Ren, H.; Liu, S.; Cui, Y.; Zhao, P. Spatiotemporal dynamics in vegetation GPP over the great khingan mountains using GLASS products from 1982 to 2015. Remote Sens. 2018, 10, 488. [Google Scholar] [CrossRef]
- Chow, C.K.W.; Tsui, W.H.K. Cross-border tourism: Case study of inbound Russian visitor arrivals to China. Int. J. Tour. Res. 2019, 21, 693–711. [Google Scholar] [CrossRef]
- Xu, T.; Chen, R.; Carver, S.; Wu, J. Mapping potential conflicts between wilderness travel and ecological values on a national scale. Landsc. Urban Plan. 2024, 246, 105029–105041. [Google Scholar] [CrossRef]
- Ma, L.; Pan, J.H. Spatial identification and temporal-spatial evolution of wilderness areas in China. J. Geo-Inf. Sci. 2023, 25, 324–339. [Google Scholar]
- Huang, L.S.; Wang, B.; Niu, X.; Song, Q.F. Evaluation of eco-production value from Natural Forest Protection Program in DaHinggan Mountains Forestry Group. Sci. Soil Water Conserv. 2018, 16, 141–148. [Google Scholar]
- Jia, W.W.; Xie, X.T.; Jiang, S.W.; Li, F.R. Spatial distribution pattern of seedlings and saplings of three forest types by natural regeneration in Daxin’an Mountains Xinlin Forestry Bureau, China. Chin. J. Appl. Ecol. 2017, 28, 2813–2822. [Google Scholar]
- Daxing‘anling Forestry Group. Available online: https://www.forestry.gov.cn/c/www/zsdw/376038.jhtml (accessed on 21 August 2024).
- Li, H.P.; Xu, Z.Q.; Long, Z.H. Conservation gap analysis of key protected and rare animals in Da Hinggan Range Region, China. Biodivers. Sci. 2022, 30, 21294–21303. [Google Scholar] [CrossRef]
- Carver, S.; Tricker, J.; Landres, P. Keeping it wild: Mapping wilderness character in the United States. J. Environ. Manag. 2013, 131, 239–255. [Google Scholar] [CrossRef] [PubMed]
- Casson, S.A.; Martin, V.G.; Watson, A.; Stringer, A.; Kormos, C.F.; Locke, H.; Ghosh, S.; Carver, S.; Mcdonald, T.; Sloan, S.S.; et al. Wilderness Protected Areas: Management Guidelines for IUCN Category 1b Protected Areas. 2016. Available online: https://portals.iucn.org/library/sites/library/files/documents/PAG-025.pdf (accessed on 21 February 2024).
- Carver, S.; Konráðsdóttir, S.; Guðmundsson, S.; Carver, B.; Kenyon, O. New approaches to modelling wilderness quality in Iceland. Land 2023, 12, 446. [Google Scholar] [CrossRef]
- Orsi, F.; Geneletti, D.; Borsdorf, A. Mapping wildness for protected area management: A methodological approach and application to the Dolomites UNESCO World Heritage Site (Italy). Landsc. Urban Plan. 2013, 120, 1–15. [Google Scholar] [CrossRef]
- Schumacher, H.; Finck, P.; Riecken, U.; Klein, M. More wilderness for Germany: Implementing an important objective of Germany’s National Strategy on Biological Diversity. J. Nat. Conserv. 2018, 42, 45–52. [Google Scholar] [CrossRef]
- Naismith, W.W. Cruach Ardran, Stobinian, and Ben More. Scott. Mt. Club J. 1892, 2, 135–136. [Google Scholar]
- Radford, S.L.; Senn, J.; Kienast, F. Indicator-based assessment of wilderness quality in mountain landscapes. Ecol. Indic. 2019, 97, 438–446. [Google Scholar] [CrossRef]
- Crist, E.; Mora, C.; Engelman, R. The interaction of human population, food production, and biodiversity protection. Science 2017, 356, 260–264. [Google Scholar] [CrossRef]
- Mckee, J.K.; Sciulli, P.W.; Fooce, C.D.; Waite, T.A. Forecasting global biodiversity threats associated with human population growth. Biol. Conserv. 2004, 115, 161–164. [Google Scholar] [CrossRef]
- Zhang, J.; Zhu, W.; Zhu, L.; Cui, Y.; He, S.; Ren, H. Topographical relief characteristics and its impact on population and economy: A case study of the mountainous area in western Henan, China. J. Geogr. Sci. 2019, 29, 598–612. [Google Scholar] [CrossRef]
- Cervellini, M.; Di Musciano, M.; Zannini, P.; Fattorini, S.; Jiménez-Alfaro, B.; Agrillo, E.; Attorre, F.; Angelini, P.; Beierkuhnlein, C.; Casella, L.; et al. Diversity of European habitat types is correlated with geography more than climate and human pressure. Ecol. Evol. 2021, 11, 18111–18124. [Google Scholar] [CrossRef] [PubMed]
- Sappington, J.M.; Longshore, K.M.; Thompson, D.B. Quantifying landscape ruggedness for animal habitat analysis: A case study using bighorn sheep in the Mojave Desert. J. Wildl. Manag. 2007, 71, 1419–1426. [Google Scholar] [CrossRef]
- Carver, S.; Comber, L.; Mcmorran, R.; Nutter, S.; Washtell, J. Wildness study in the Loch Lomond and the Trossachs National Park; Final Report; University of Leeds: Leeds, UK, 2011; pp. 77–138. [Google Scholar]
- Han, L.; Wang, Z.; Wei, M.; Wang, M.; Shi, H.; Ruckstuhl, K.; Yang, W.; Alves, J. Small patches play a critical role in the connectivity of the Western Tianshan landscape, Xinjiang, China. Ecol. Indic. 2022, 144, 109542–109550. [Google Scholar] [CrossRef]
- Hanski, I.; Zurita, G.A.; Bellocq, M.I.; Rybicki, J. Species-fragmented area relationship. Proc. Natl. Acad. Sci. USA 2013, 110, 12715–12720. [Google Scholar] [CrossRef]
- Ramesh, T.; Kalle, R.; Rosenlund, H.; Downs, C.T. Native habitat and protected area size matters: Preserving mammalian assemblages in the Maputaland Conservation Unit of South Africa. For. Ecol. Manag. 2016, 360, 20–29. [Google Scholar] [CrossRef]
- Wu, J.; Liu, Z.M. Effect of habitat fragmentation on biodiversity: A review. Chin. J. Ecol. 2014, 33, 1946–1952. [Google Scholar]
- Chisholm, R.A.; Lim, F.; Yeoh, Y.S.; Seah, W.W.; Condit, R.; Rosindell, J. Species-area relationships and biodiversity loss in fragmented landscapes. Ecol. Lett. 2018, 21, 804–813. [Google Scholar] [CrossRef]
- Hu, G.; Wu, J.; Feeley, K.J.; Xu, G.; Yu, M. The effects of landscape variables on the species-area relationship during late-stage habitat fragmentation. PLoS ONE 2012, 7, e43894. [Google Scholar] [CrossRef]
- Didham, R.K.; Ewers, R.M. Predicting the impacts of edge effects in fragmented habitats: Laurance and Yensen’s core area model revisited. Biol. Conserv. 2012, 155, 104–110. [Google Scholar] [CrossRef]
- Liu, H.Q.; Lv, G.H. Should several large or many small reserves be built in fragmented landscapes? Acta Ecol. Sin. 2018, 38, 3272–3280. [Google Scholar]
- Neigel, J.E. Species–area relationships and marine conservation. Ecol. Appl. 2003, 13 (Suppl. S1), 138–145. [Google Scholar] [CrossRef]
- Su, S.; Xiao, R.; Li, D.; Hu, Y. Impacts of transportation routes on landscape diversity: A comparison of different route types and their combined effects. Environ. Manag. 2014, 53, 636–647. [Google Scholar] [CrossRef]
- Yin, S.Q.; Zhang, W.; Zeng, X.Y.; Shi, D.M. Application of systematic governance of mountains, water, forests, fields, lakes and grasses in ecological restoration of railroad projects. Technol. Soil Water Conserv. 2023, 3, 30–33. [Google Scholar]
- Sha, Q.Q.; Huang, L.; Fan, J.W.; Zhang, L.X.; Zhu, T.; Shen, M.Q. Spatio-temporal dynamics and their driving mechanisms of the landscape ecological risk along the Golmud-Lhasa section of Qinghai-Tibet Railway. Acta Ecologica Sinica 2024, 19, 1–11. [Google Scholar] [CrossRef]
- Popp, J.N.; Boyle, S.P. Railway ecology: Underrepresented in science? Basic Appl. Ecol. 2017, 19, 84–93. [Google Scholar] [CrossRef]
- Barrientos, R.; Ascensão, F.; Beja, P.; Pereira, H.M.; Borda-de-Água, L. Railway ecology vs. road ecology: Similarities and differences. Eur. J. Wildl. Res. 2019, 65, 12. [Google Scholar] [CrossRef]
- Temjanovski, R.; Dimitrova, J.; Arsova, M. The roads as civilization symbol or brain drain booster: Culture changes in spirit of global challenges. ”J. Econ.” Fac. Econ. Univ. Goce Delcev Stip Maced. 2017, 2, 11–23. [Google Scholar]
- Barber, C.P.; Cochrane, M.A.; Souza, J.R.C.M.; Laurance, W.F. Roads, deforestation, and the mitigating effect of protected areas in the Amazon. Biol. Conserv. 2014, 177, 203–209. [Google Scholar] [CrossRef]
- Laurance, W.F.; Cochrane, M.A.; Bergen, S.; Fearnside, P.M.; Delamônica, P.; Barber, C.; D’angelo, S.; Fernandes, T. The future of the Brazilian Amazon. Science 2001, 291, 438–439. [Google Scholar] [CrossRef]
- Laporte, N.T.; Stabach, J.A.; Grosch, R.; Lin, T.S.; Goetz, S.J. Expansion of industrial logging in Central Africa. Science 2007, 316, 1451. [Google Scholar] [CrossRef] [PubMed]
- Fan, X.Y.; Zang, Z.H.; Xu, W.H. Research progress on the concepts, identification and protection value of roadless areas. Environ. Prot. Sci. 2022, 48, 7–12. [Google Scholar]
- Kati, V.; Petridou, M.; Tzortzakaki, O.; Papantonious, E.; Galani, A.; Psaralexi, M.; Gotsis, D.; Papaioannou, H.; Kassara, C. How much wilderness is left? A roadless approach under the Global and the European Biodiversity Strategy focusing on Greece. Biol. Conserv. 2023, 281, 110015–110024. [Google Scholar] [CrossRef]
- Laurance, W.F.; Clements, G.R.; Sloan, S.; O’Connell, C.S.; Mueller, N.D.; Goosem, M.; Venter, O.; Edwards, D.P.; Phalan, B.; Balmford, A.; et al. A global strategy for road building. Nature 2014, 513, 229–232. [Google Scholar] [CrossRef]
- Şakar, D.; Aydin, A.; Akay, A.E. Essential issues related to construction phases of road networks in protected areas: A review. Croat. J. For. Eng. J. Theory Appl. For. Eng. 2022, 43, 219–237. [Google Scholar] [CrossRef]
- Plutzar, C.; Enzenhofer, K.; Hoser, F.; Zika, M.; Kohler, B. Is there something wild in Austria. In Mapping Wilderness: Concepts, Techniques and Applications; Springer: Dordrecht, The Netherlands, 2016; pp. 177–189. [Google Scholar]
- Liu, H.C.; Ren, C.Y.; Wang, Z.M.; Zhang, B. Dynamics of ecosystem service functions and their tradeoff and synergetic relationships in Great Xing’an Mountains ecological function Zone. J. Ecol. Rural Environ. 2022, 38, 587–598. [Google Scholar]
- Li, Y.H.; Hu, Z.B.; Chang, Y.; Hu, Y.M. Change of forest landscape service function under timber harvest. J. Nat. Resour. 2006, 21, 100–108. [Google Scholar]
- Zheng, S.F.; Wang, L.P.; Zang, S.Y. The change of ecosystem services of Natural Forest Protection Project Regions in the Da Hinggan Mountains. Sci. Geogr. Sin. 2021, 41, 1295–1302. [Google Scholar]
- Cehn, K.Y.; Lin, T.M.; Wang, J.J.; He, Y.J.; Zhang, L.W. Effects of Natural Forest Conservation Project on forest carbon pool of Key State-Owned Forest Region of Daxing’anling, Heilongjiang Province in the past 20 Years. Ecol. Environ. Sci. 2023, 32, 1016–1025. [Google Scholar]
- Xu, W.; Xiao, Y.; Zhang, J.; Yang, W.; Zhang, L.; Hull, V.; Wang, Z.; Zheng, H.; Liu, J.; Polasky, S.; et al. Strengthening protected areas for biodiversity and ecosystem services in China. Proc. Natl. Acad. Sci. USA 2017, 114, 1601–1606. [Google Scholar] [CrossRef]
- Tang, X.P.; Luan, X.F. Developing a nature protected area system composed mainly of national parks. For. Grassl. Resour. Res. 2017, 06, 1–8. [Google Scholar] [CrossRef]
- Cao, Y.; Yang, R. Nature needs half: A new vision for global protected areas. Landsc. Archit. 2019, 26, 39–44. [Google Scholar]
- Wilson, E.O. Half-Earth: Our Planet’s Fight for Life; WW Norton & Company: New York, NY, USA, 2016. [Google Scholar]
- Wu, R.; Zhang, S.; Yu, D.W.; Zhao, P.; Li, X.; Wang, L.; Yu, Q.; Ma, J.; Chen, A.; Long, Y. Effectiveness of China’s nature reserves in representing ecological diversity. Front. Ecol. Environ. 2011, 9, 383–389. [Google Scholar] [CrossRef] [PubMed]
- Cole, D.N.; Landres, P.B. Threats to wilderness ecosystems: Impacts and research needs. Ecol. Appl. 1996, 6, 168–184. [Google Scholar] [CrossRef]
- Perino, A.; Pereira, H.M.; Navarro, L.M.; Fernández, N.; Bullock, J.M.; Ceaușu, S.; Cortes-avizanda, A.; Klink, R.V.; Kuemmerle, T.; Lomba, A.; et al. Rewilding complex ecosystems. Science 2019, 364, eaav5570. [Google Scholar]
- Kormos, C.F.; Bertzky, B.; Jaeger, T.; Shi, Y.; Badman, T.; Hilty, J.A.; Mackey, B.G.; Mittermeier, R.A.; Locke, H.; Osipova, E.; et al. A wilderness approach under the World Heritage Convention. Conserv. Lett. 2016, 9, 228–235. [Google Scholar] [CrossRef]
- Gibb, R.; Redding, D.W.; Chin, K.Q.; Donnelly, C.A.; Blackburn, T.M.; Newbold, T.; Jones, K.E. Zoonotic host diversity increases in human- dominated ecosystems. Nature 2020, 584, 398–402. [Google Scholar] [CrossRef]
- Van Den Berg, A.E.; Koole, S.L. New wilderness in the Netherlands: An investigation of visual preferences for nature development landscapes. Landsc. Urban Plan. 2006, 78, 362–372. [Google Scholar] [CrossRef]
- Zoderer, B.M.; Carver, S.; Tappeiner, U.; Tasser, E. Ordering ‘wilderness’: Variations in public representations of wilderness and their spatial distributions. Landsc. Urban Plan. 2020, 202, 103875–103887. [Google Scholar] [CrossRef]


Disclaimer/Publisher’s Note: The statements, opinions and data contained in all publications are solely those of the individual author(s) and contributor(s) and not of MDPI and/or the editor(s). MDPI and/or the editor(s) disclaim responsibility for any injury to people or property resulting from any ideas, methods, instructions or products referred to in the content. |
© 2024 by the authors. Licensee MDPI, Basel, Switzerland. This article is an open access article distributed under the terms and conditions of the Creative Commons Attribution (CC BY) license (https://creativecommons.org/licenses/by/4.0/).