Article

Congruent and Hierarchical Intra-Lake Subdivisions from Nuclear and Mitochondrial Data of a Lake Baikal Shoreline Amphipod

1
Finnish Museum of Natural History, University of Helsinki, 00014 Helsinki, Finland
2
Biological Laboratory, Teikyo University, Hachioji, Tokyo 192-0395, Japan
3
Limnological Institute SB RAS, Irkutsk 664033, Russia
*
Author to whom correspondence should be addressed.
Current address: Finnish Environment Institute, 00790 Helsinki, Finland.
deceased.
Diversity 2024, 16(11), 706; https://doi.org/10.3390/d16110706
Submission received: 30 September 2024 / Revised: 7 November 2024 / Accepted: 15 November 2024 / Published: 20 November 2024
(This article belongs to the Special Issue Diversity and Evolution within the Amphipoda)

Abstract

:
A central goal of molecular studies on ancient lake faunas is to resolve the origin and phylogeny of their strikingly diverse endemic species flocks. Another equally intriguing goal is to understand the integrity of individual morphologically diagnosed species, which should help to perceive the nature and speed of the speciation process, and the true biological species diversity. In the uniquely diverse Lake Baikal amphipod crustaceans, molecular data from shallow-water species have often disclosed their cryptic subdivision into geographically segregated genetic lineages, but the evidence so far is mainly based on mitochondrial DNA. We now present a lake-wide parallel survey of both mitochondrial and multilocus nuclear genetic structuring in the common shoreline amphipod Eulimnogammarus verrucosus, known to comprise three deep, parapatric mtDNA lineages. Allele frequencies of seven nuclear allozyme loci divide the data into three main groups whose distributions exactly match the distributions of the main mitochondrial lineages S, W, and E and involve a further division of the W cluster into two subgroups. The inter-group differences involve one to four diagnostic loci and additional group-specific alleles. The transition zones are either abrupt (1 km), occur over a long segment of uninhabitable shoreline, or may be gradual with non-coincident clinal change at different loci. Mitochondrial variation is hierarchically structured, each main lineage further subdivided into 2–4 parapatric sublineages or phylogroups, and patterns of further local segregation are seen in some of them. Despite the recurring observations of cryptic diversity in Baikalian amphipods, the geographical subdivisions and clade depths do not match in different taxa, defying a common explanation for the diversification in environmental history.

1. Introduction

Lake Baikal in Southeast Siberia is renowned as the oldest, deepest, and most voluminous freshwater body of water on Earth, and one with the richest endemic faunas, in particular with regard to crustaceans, and most notably to amphipods, which number in hundreds of described species [1,2,3]. The exploration of the diversity and diversification of species flocks in the confined spaces of long-lived lakes has lately gained impetus from molecular approaches. For Lake Baikal amphipods, these studies show that their astounding morphological and ecological diversity, which in current classifications comprises up to 10 endemic families [2,4], is indeed phylogenetically nested within the single morphologically relatively uniform Holarctic genus Gammarus (Gammaridae) [5,6,7,8]. Understanding the processes and circumstances that enable such diversification across a history of changing geology and climate through the Cenozoic, in parallel with morphological stasis elsewhere, remains a challenge.
At another level, the molecular approaches bring new light to the borderline of inter-species and intraspecies variation, effectively introducing a new set of informative characters for taxon delimitation. The species concept in Baikalian amphipods has been elusive and not always in line with mainstream systematic principles, either in the 20th or 21st centuries [9,10]. Initial molecular assessments in the 1990s revealed several patterns of cryptic diversity and an anticipation of substantially higher numbers of biological species than so far recognized [11]. For instance, diagnostic allozyme differences between “conspecific” geographical populations were repeatedly documented [11,12]. Also, abrupt, though still non-diagnostic frequency differences indicated stable subdivisions in the shoreline species Eulimnogammarus cyaneus, suggesting effective long-term population isolation over short distances, correlated with current and past geological phenomena [13,14]. Subsequently, several phylogeographic studies of mitochondrial sequence variation have revealed the subdivision of nominal Baikalian shallow-water amphipod species into parapatric (non-overlapping), strongly diverged lineages and geographical segments, notably in Gmelinoides fasciatus [15,16], Babr baikali [17], Dorogostaiskia parasitica [18], and Eulimnogammarus spp. [19,20]. The suggested systematic and taxonomic implications have varied, from oversight to subspecies or species-level distinction.
Mitochondrial DNA has specific theoretical and practical assets as a marker of phylogeographical and demographic history, and as a universal taxonomic character (molecular barcode), but it also has known pitfalls, with a risk of gross misinterpretations. Independent of the nuclear genome, it is particularly prone to transgressing species boundaries in introgression events, and instances of complete replacement of the species’ mitochondrial genome by that of a close relative are common in animals [21,22]. Also, mtDNA, as a non-recombining molecule, is liable to selective sweeps even intraspecifically and, thus, to misinterpretation of demographic signatures. Taxonomic statements based on mitochondrial data alone are imprudent; such statements should always be based on concordant information from two or several independent characters, whether molecular or morphological. Mitochondrial subdivisions should thus be corroborated by parallel screening of either morphological differences, leading to formal descriptions, such as in Dorogostaiskia [18], or of independent nuclear characters. Such parallel assessments in Baikalian fauna are still rare.
We now present a combined dataset of both mitochondrial and multilocus nuclear marker variation in populations across the intra-lake range of the littoral amphipod Eulimnogammarus verrucosus (initially reported in [23]). The mitochondrial data corroborate and supplement the patterns more recently reported in this species by Gurkov et al. [19] and Saranchina et al. [20]. The multilocus nuclear data on allozyme frequency variation are qualitatively new, while differences in a single nuclear character are known [19]. We see a striking concordance in the main subdivisions in nuclear and mitochondrial genomes, and the details of both datasets disclose additional patterns and inferred processes of diversification within those subdivisions. We discuss the systematic significance of this and corresponding subdivisions in the context of ancient lake diversity and comment on previous interpretations of related data. We also reconsider the position of the suggested Angara river taxon “E. verrucosus A” of Saranchina et al. (2024) [20], or E. (v.) oligacanthus, in relation to the E. verrucosus complex.

2. Materials and Methods

2.1. Samples

Eulimnogammarus verrucosus (Gerstfeldt, 1858) is the largest (ca. 3.5 cm) of the three abundant Eulimnogammarus species with nearly lake-wide distributions in the shallowest stony shoreline zone of Baikal, and one of the 69 endemic species currently listed in the genus [2,19,24].
Population samples of surf-zone amphipods were collected from stony habitats around the lake in 1993 and 1995 (KM and RMK). Most of the sampling localities were represented in the parallel E. cyaneus allozyme study of Mashiko et al. [14], and we use the same sample coding in Figure 1. Four additional samples, marked by *, are from an expedition in 1999 (RMK and RV). Samples were sorted by species in the field and put freshly into liquid nitrogen, and later kept deep-frozen at −80 °C, to enable use in allozyme analysis. The sampling localities covered most of the 1400 km lake circumference, except for a 250 km segment of the eastern coast, which includes the Selenga delta and is dominated by sandy shorelines not favorable to E. verrucosus. For mitochondrial sequencing, material from a number of additional sites and of outgroup taxa was also included, particularly from the outflowing Angara River (circles in Figure 1); part of them were initially stored in ethanol, and allozymes could therefore not be studied. The complete list of localities and sample sizes is given in Table S1.

2.2. Molecular Data

Nuclear genetic variation was studied in terms of allele frequencies estimated from seven polymorphic, co-dominant allozyme loci. Laboratory methods were as outlined in [25,26,27]. The technique resolves genotypic variation at multiallelic loci and is comparable to the scoring of DNA microsatellite or SNP markers but indirectly at the protein level. Allelic variants representing non-synonymous substitutions can be separated by electrophoresis of enzyme proteins, when the substitutions are associated with a difference in the electric charge of the alternative amino acids, and consequently of the whole protein. The loci scored were Gpt (encoding glutamate–pyruvate transaminase), Idh (isocitrate dehydrogenase), Tpi (triose-phosphate isomerase), Mdh (malate dehydrogenase), Gpi (glucose-phosphate isomerase), Ap (aminopeptidase, with leucyl-glycyl-glycine substrate), and Est (esterase, 4-methylumbelliferyl acetate substrate). Twenty-seven population samples were analyzed, with an average of 39 individuals (78 gene copies) genotyped per sample per locus, i.e., c 1060 individuals in all, and 7400 genotypes (Tables S1 and S2).
Sequence variation in the mitochondrial COI gene was studied from a set of 80 E. verrucosus individuals, usually 3–4 per site, with the methods in [28]. Combinations of the standard “barcoding” primers LCO1490 and HCO2198 and the custom primers Ev12d (ACTTCATTCTAGGGGCTTGAGC) and Ev1r (AAAATAAGTGTTGGTATAGAATAGG) were used for amplification and sequencing. The alignment was trimmed to 596 bp and combined with published data of the same gene segment from Gurkov et al. [19] and with relevant parts of the Saranchina et al. data from GenBank [20], picking 5 sequences per locality when available. This summed up to 199 individuals. For comparative purposes, we also used 12 sequences of additional Eulimnogammarus spp. from our sequence archive (see Section 4.3). The original sequences were deposited in GenBank as accessions PQ557398-PQ557489, and the alignments are available in Table S3.

2.3. Data Analysis

The multilocus allele frequency data (compiled in Table S2) were summarized by principal component analysis (PCA) performed on the covariance matrix of the allele frequencies. Analyses were run alternatively on (i) all alleles with an overall frequency >0.3% in the data (corresponding to c. 6 individuals), (ii) only those 19 alleles with a frequency >0.5%, or (iii) with one predominant allele from each locus, i.e., 7 alleles. The results did not essentially differ depending on the input matrix and are presented for the dataset (iii). A neighbor-joining tree from Euclidean distances from the same dataset was also constructed. These analyses were performed in PAST 4.13 [29]. The variation at individual loci was illustrated as pie diagrams on a map and by plotting frequencies of major alleles geographically against shoreline distance.
The sequence data were analyzed in MEGA 11 [30]. A neighbor-joining (NJ) tree was constructed from uncorrected sequence distances, and maximum parsimony (MP) trees were used to illustrate intra-lineage variation. Differences between lineages were characterized alternatively by average uncorrected p-distances or model-corrected composite maximum likelihood (ML) distances. Differences within and among geographically distinct sublineages (phylogroups) and of populations within phylogroups were expressed as average nucleotide diversities at each level, average interlineage distances, and average interlineage net distances (i.e., subtracting intralineage diversity), and among-population differentiation in terms of a Φ-statistic (proportion of the diversity in the phylogroup).

3. Results

3.1. Subdivision by Nuclear Characters

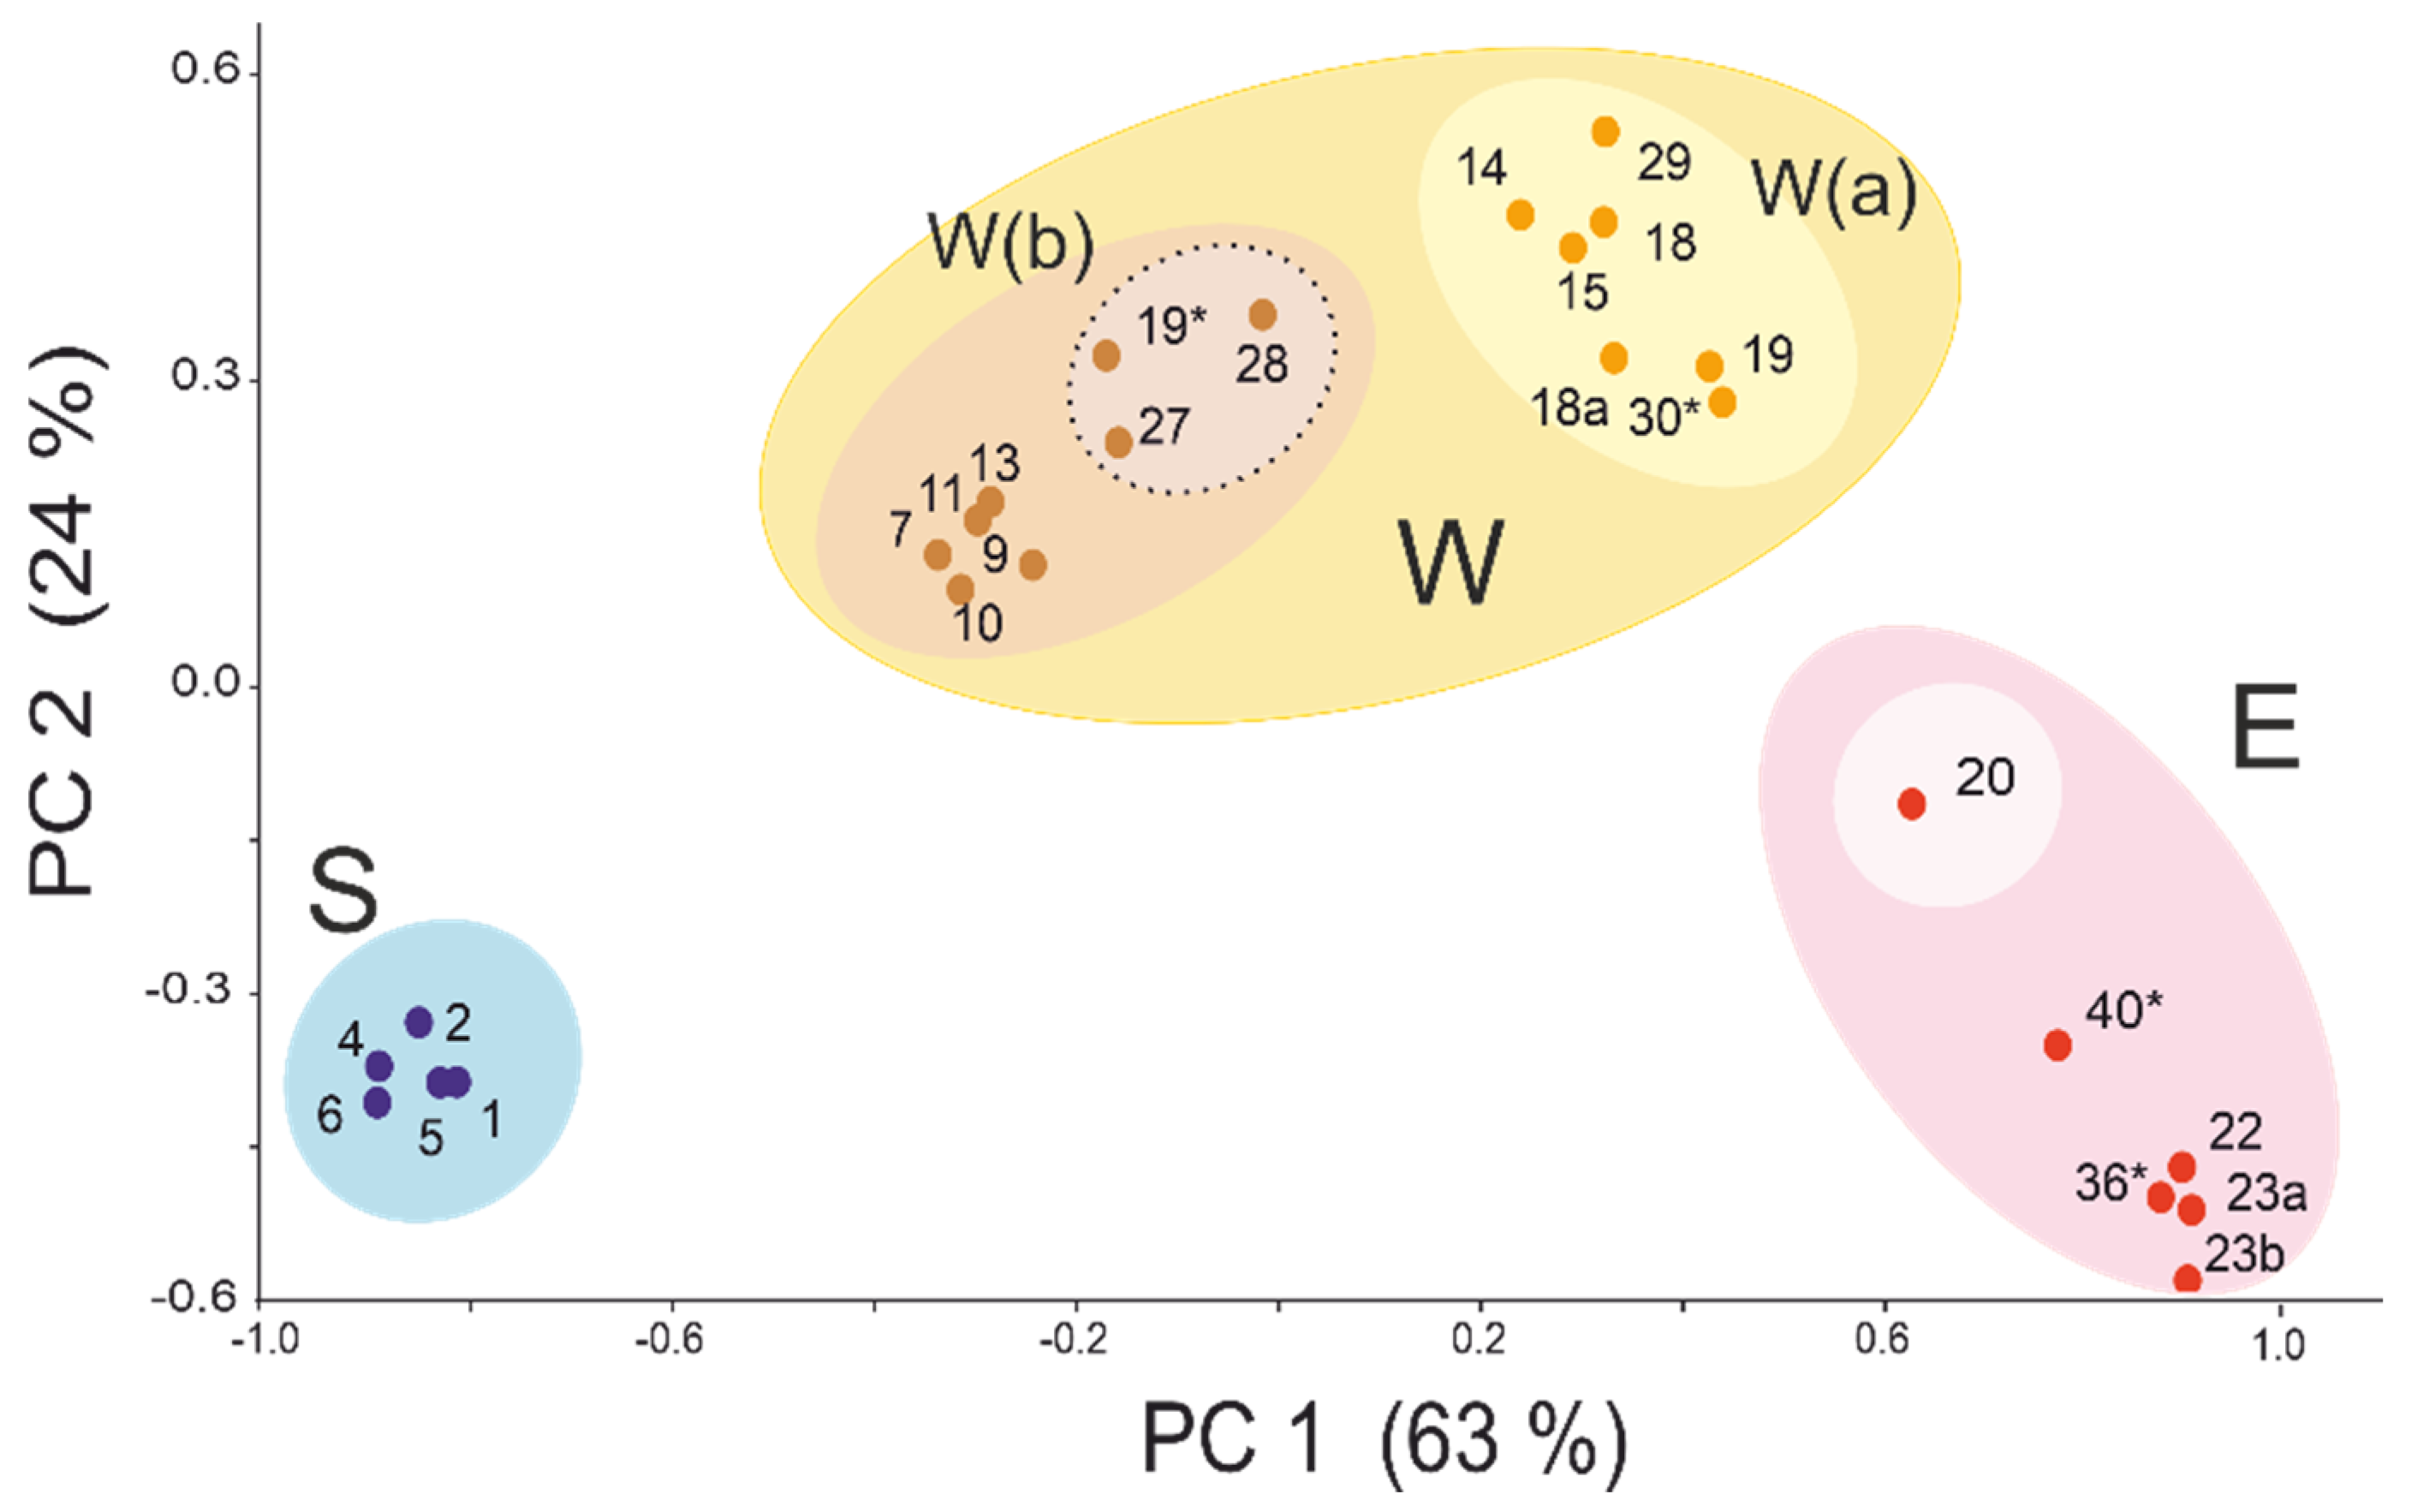
The overall pattern of allele frequency variation among populations at seven protein-coding allozyme loci is summarized in the PCA ordination, where the first components PC1 and PC2 accounted for 63% and 24% of the variance, respectively (Figure 2). This illustrates a separation of three principal groups of populations, one of which further comprises two subgroups. These groups have characteristic geographical distributions, i.e., a southern group, a western group (with two adjacent subgroups), and a northeastern group (Figure 3C). The distributions correspond with those of the three deep, parapatrically distributed intra-lake mitochondrial lineages reported in [19] and congruently in this study (see below). Accordingly, we will also refer to them as the S, W, and E genetic clusters or groups, with the W(a) and W(b) subgroups. Geographically, the three main groups are demarcated at the outlet of the Angara River in the southwest, in the northern extremity of the lake, and across the Selenga delta area in the southeast. Notably, the Ushkanii Islands archipelago (sites 29, 30*), far from the western shore but very close to the eastern Svyatoi Nos peninsula, still belongs to the W genetic cluster. The boundary between W(a) and W(b) subgroups is in the Maloe More—Olkhon Strait region, at the contact of the Central and Northern Baikal subbasins.
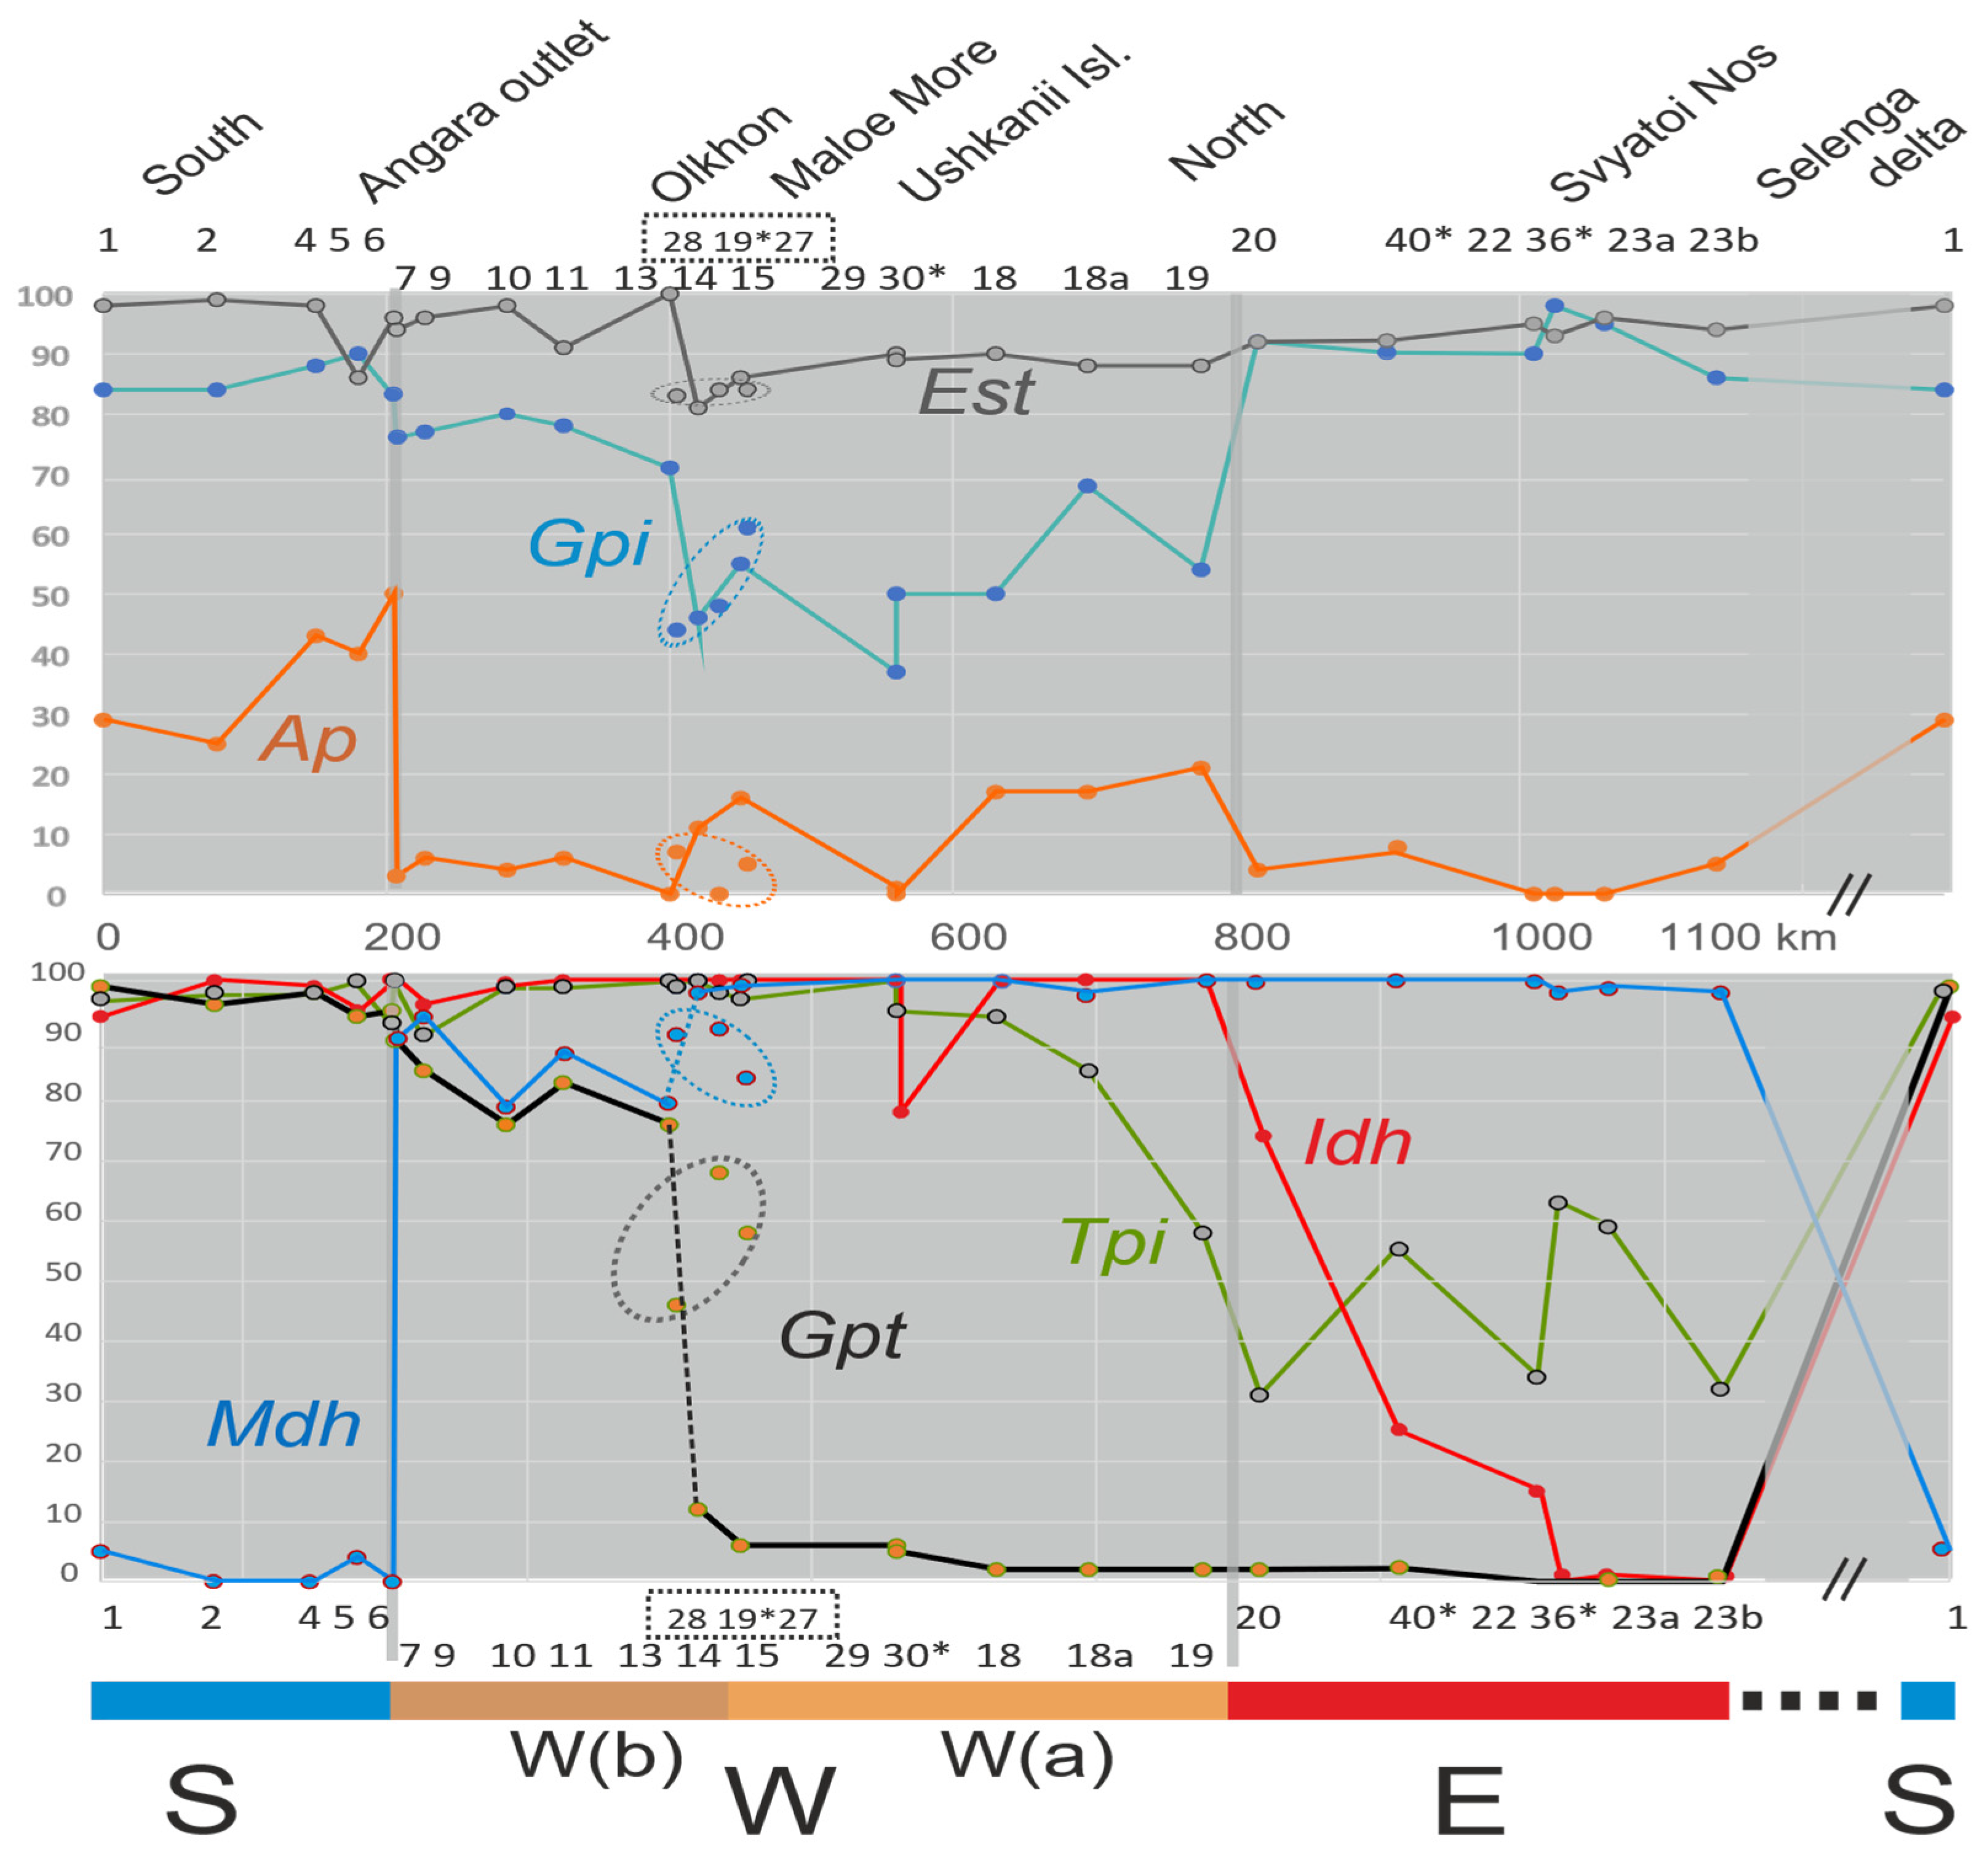
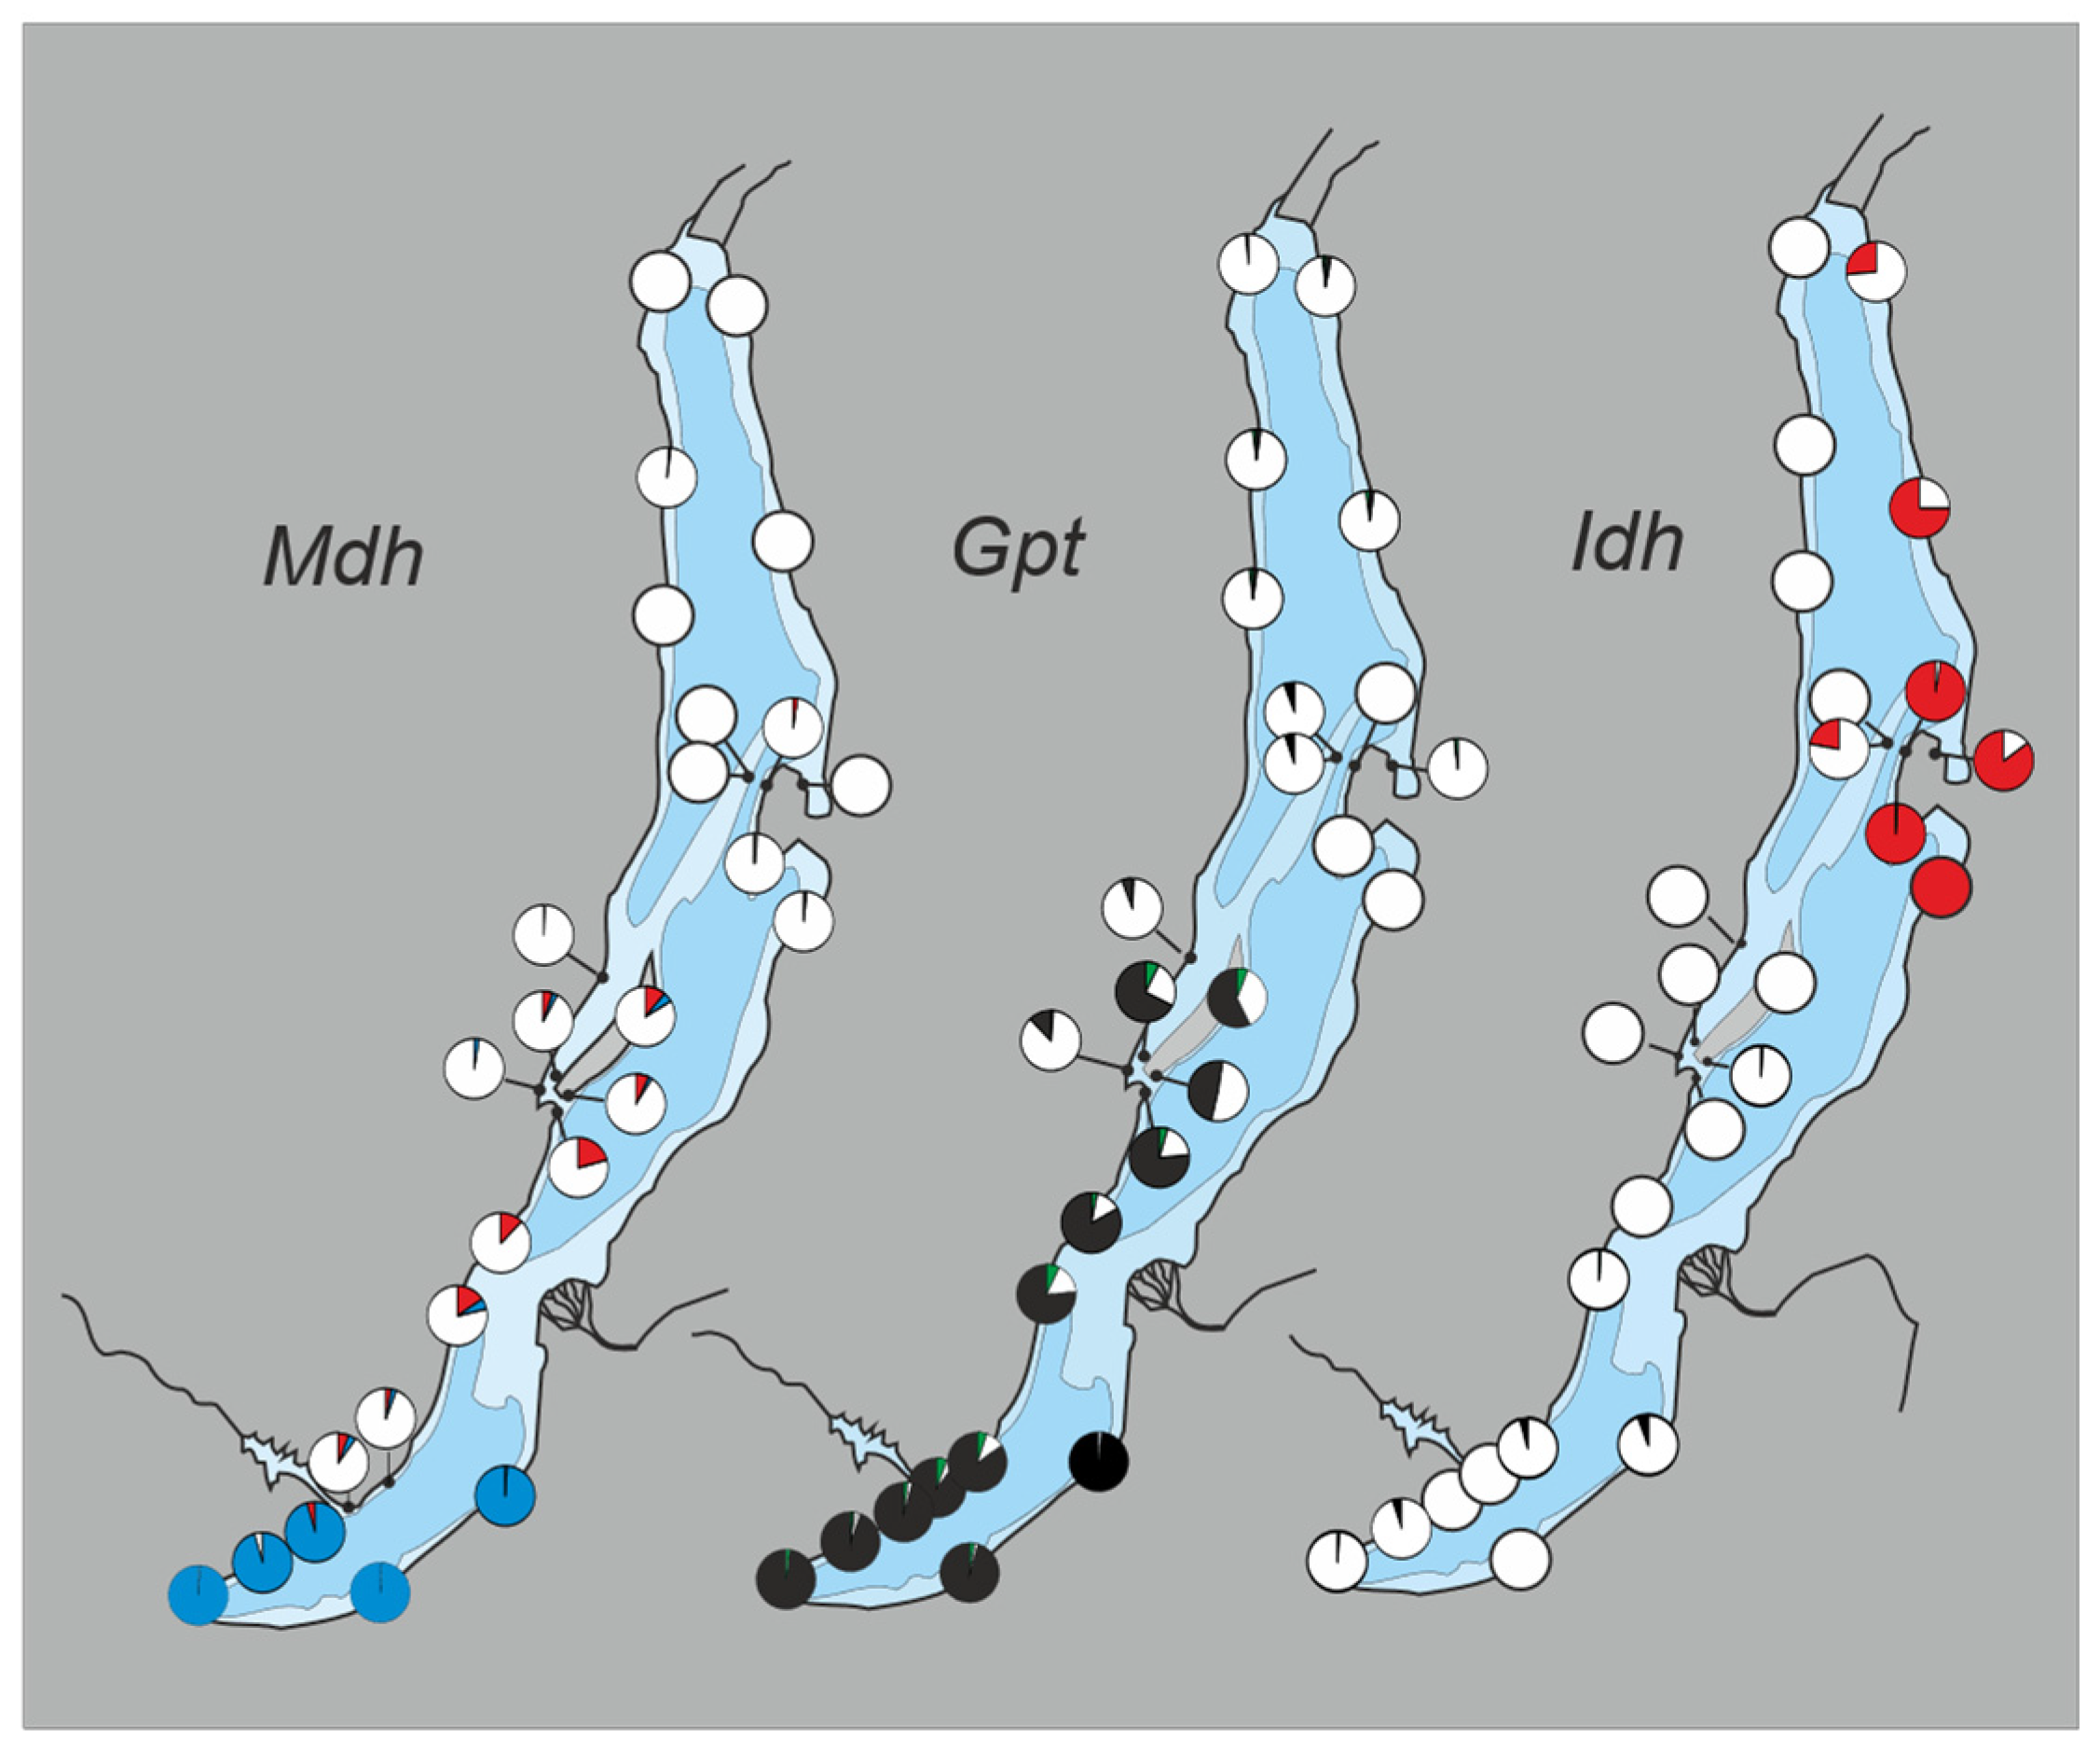
Each individual locus contributes differently to the distinction of the groups (Figure 4 and Figure 5). Five loci show major allele frequency differences between individual groups, while none of them distinguishes all groups. In several cases, the differences represent the presence of a major polymorphism in one group or subgroup in contrast to near monomorphism in another, rather than a contrast of (nearly) reciprocally fixed alleles.
Most clearly, the S group is starkly differentiated from the others in Mdh with an effective diagnostic difference, and there is a parallel pattern in Ap where the difference, however, is rather in allele frequency. The E group similarly stands apart from the two others by its predominant or high-frequency alleles in Idh and Tpi. The widespread W group in turn is characterized by relatively high frequencies (up to 50%) of a variant Gpi allele, which is rare in the other groups. The Gpt locus shows a practically diagnostic difference between the S and E groups, whereas the W group in between is not homogeneous but rather shows a gradual transition along the shoreline, connecting the two others. Finally, while there is much allelic variation in Est (at least 10 alleles scored, and up to 6 within a population), a single allele still predominates everywhere at a high frequency (0.83–0.95).
In general, while the subdivision into discrete groups is a dominant feature of the ordination, another important one is the relationship to geographical distance. Along the PC1 axis, the order of populations almost completely corresponds to their order along the shoreline, both between and within the major genetic groups, the W group situated between its immediate neighbors. PC2 relates to the independent deviation of the W group from the main geographical trend, and PC3 (displayed in Figure S1) to the distinction between W(a) and W(b).

3.2. Contact Zones

There are four contact zones between the circularly arranged four genetic groups and subgroups, and they provide another viewpoint on the intergroup differences (Figure 4). The S/W boundary is the most abrupt geographically and occurs across the outlet of the Angara River, which is about 1 km wide. There is a virtually diagnostic difference at the Mdh locus coinciding with that in mtDNA, and a similarly sharp but not completely diagnostic difference occurs at Ap.
The sharpness of the E/S boundary is difficult to evaluate as the change is observed over a 250 km gap between samples, which likely represents a true gap in the species distribution over a long stretch of stoneless habitat; almost half of that is in the scope of the Selenga River delta. Nevertheless, contrasting the marginal samples of each group, this inter-group distinction is quantitatively the strongest in the data and involves three diagnostic and one partly diagnostic nuclear character (Mdh, Gpt, Idh, Tpi) in addition to the mitochondrion.
The nuclear W/E boundary in the north in turn appears characteristically gradual. While there are strong differences between the more distant samples from the W and E clusters, the transitions are not abrupt but rather clinal. There are coincident step changes in frequency at several loci across the northern estuary, which also must present a dispersal barrier. However, all the steps between sites 19 and 20 are minor (20–30%), whereas, at two loci, this difference just makes a part of a clinal transition over a broader distance. These clines are not geographically coincident, but the Tpi cline continues along the western coast, the one at Idh along the eastern coast, so that the clines appear ca. 100 km displaced from each other. On the other hand, the W(a) and E clusters occur in proximity and remain discrete across the Ushkanii islands—Svyatoi Nos strait, which is only 10 km wide but >500 m deep.
Finally, the W(a)/W(b) boundary occurs in a complex inter-basin transition in the Maloe More inlet and the narrow Olkhon Gates strait at its SW end. With the Olkhon Island between the lake and inlet, there are three parallel shorelines, and it is not possible to project the transition in a single dimension. Nevertheless, following the continental western shore, the northern W(a) composition seems to extend to the very southern end of the Maloe More (site 14), while a pure W(b) extends from the south to the entrance of the Olkhon Gates strait (13). The populations on the Olkhon and Ogoi islands (sites 28, 27, 19*, encircled in Figure 4) group most closely with W(b) but are clearly of an intermediate character, with influence from W(a).

3.3. Hierarchical Parapatry of Mitochondrial Variation

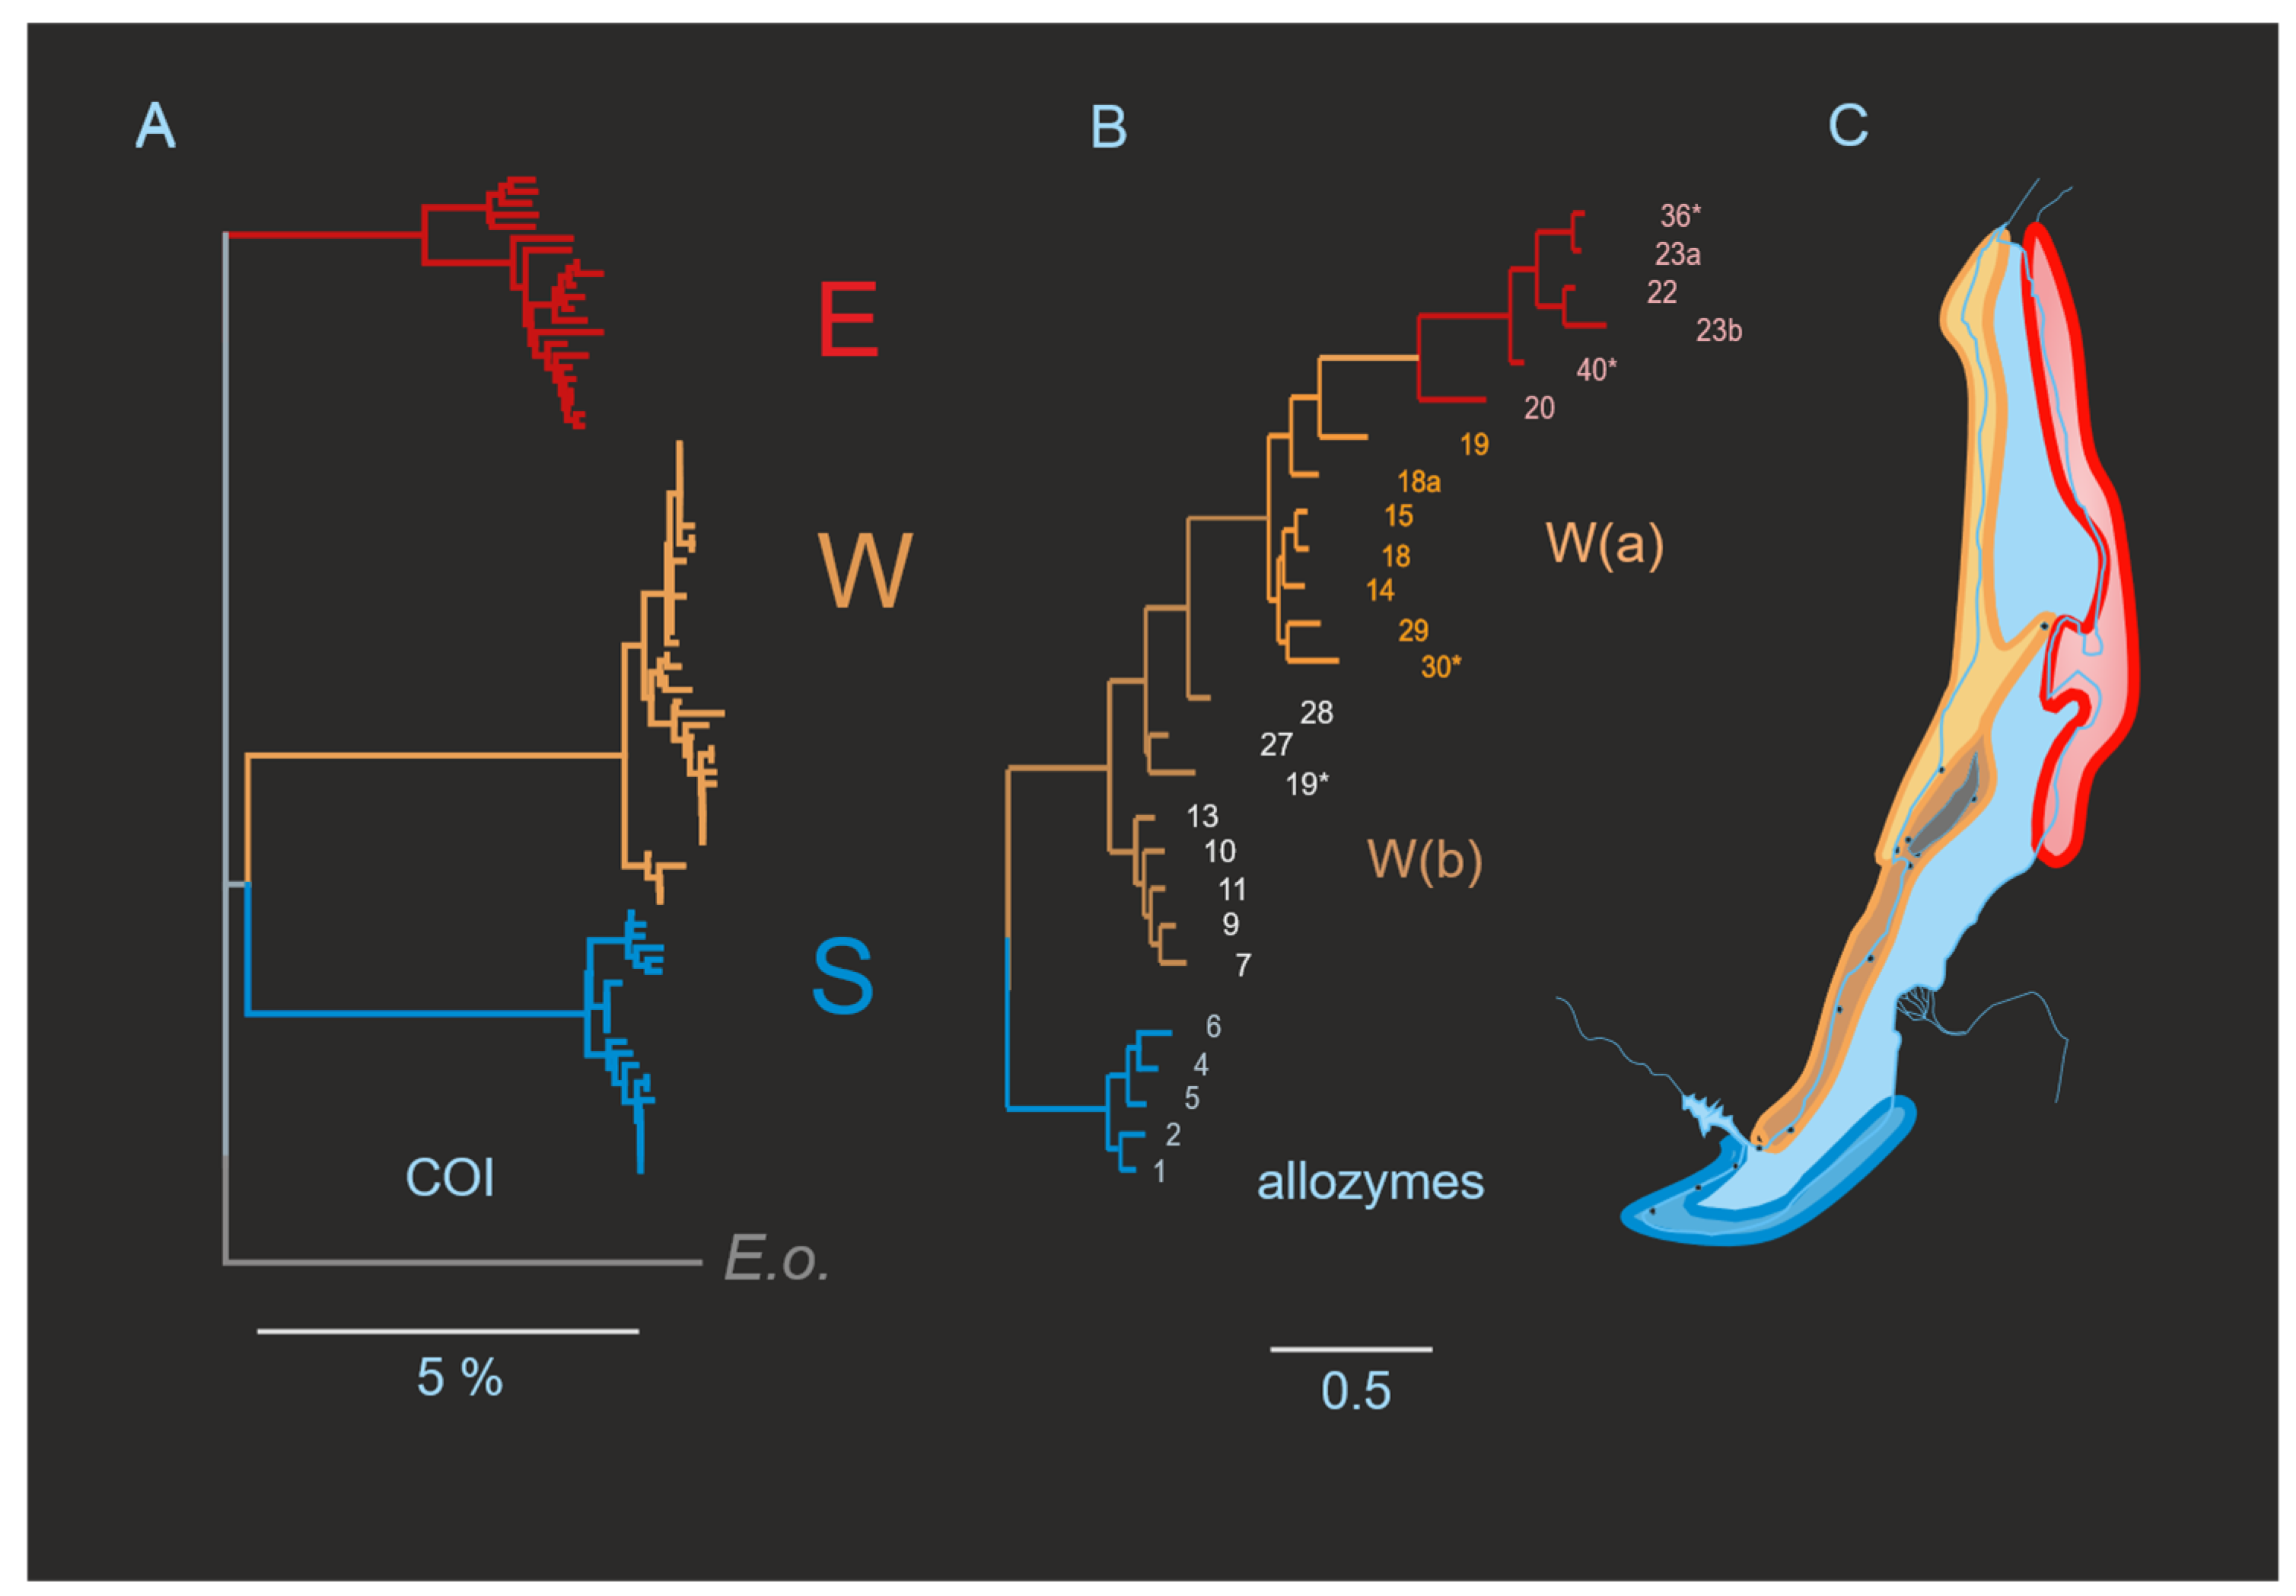
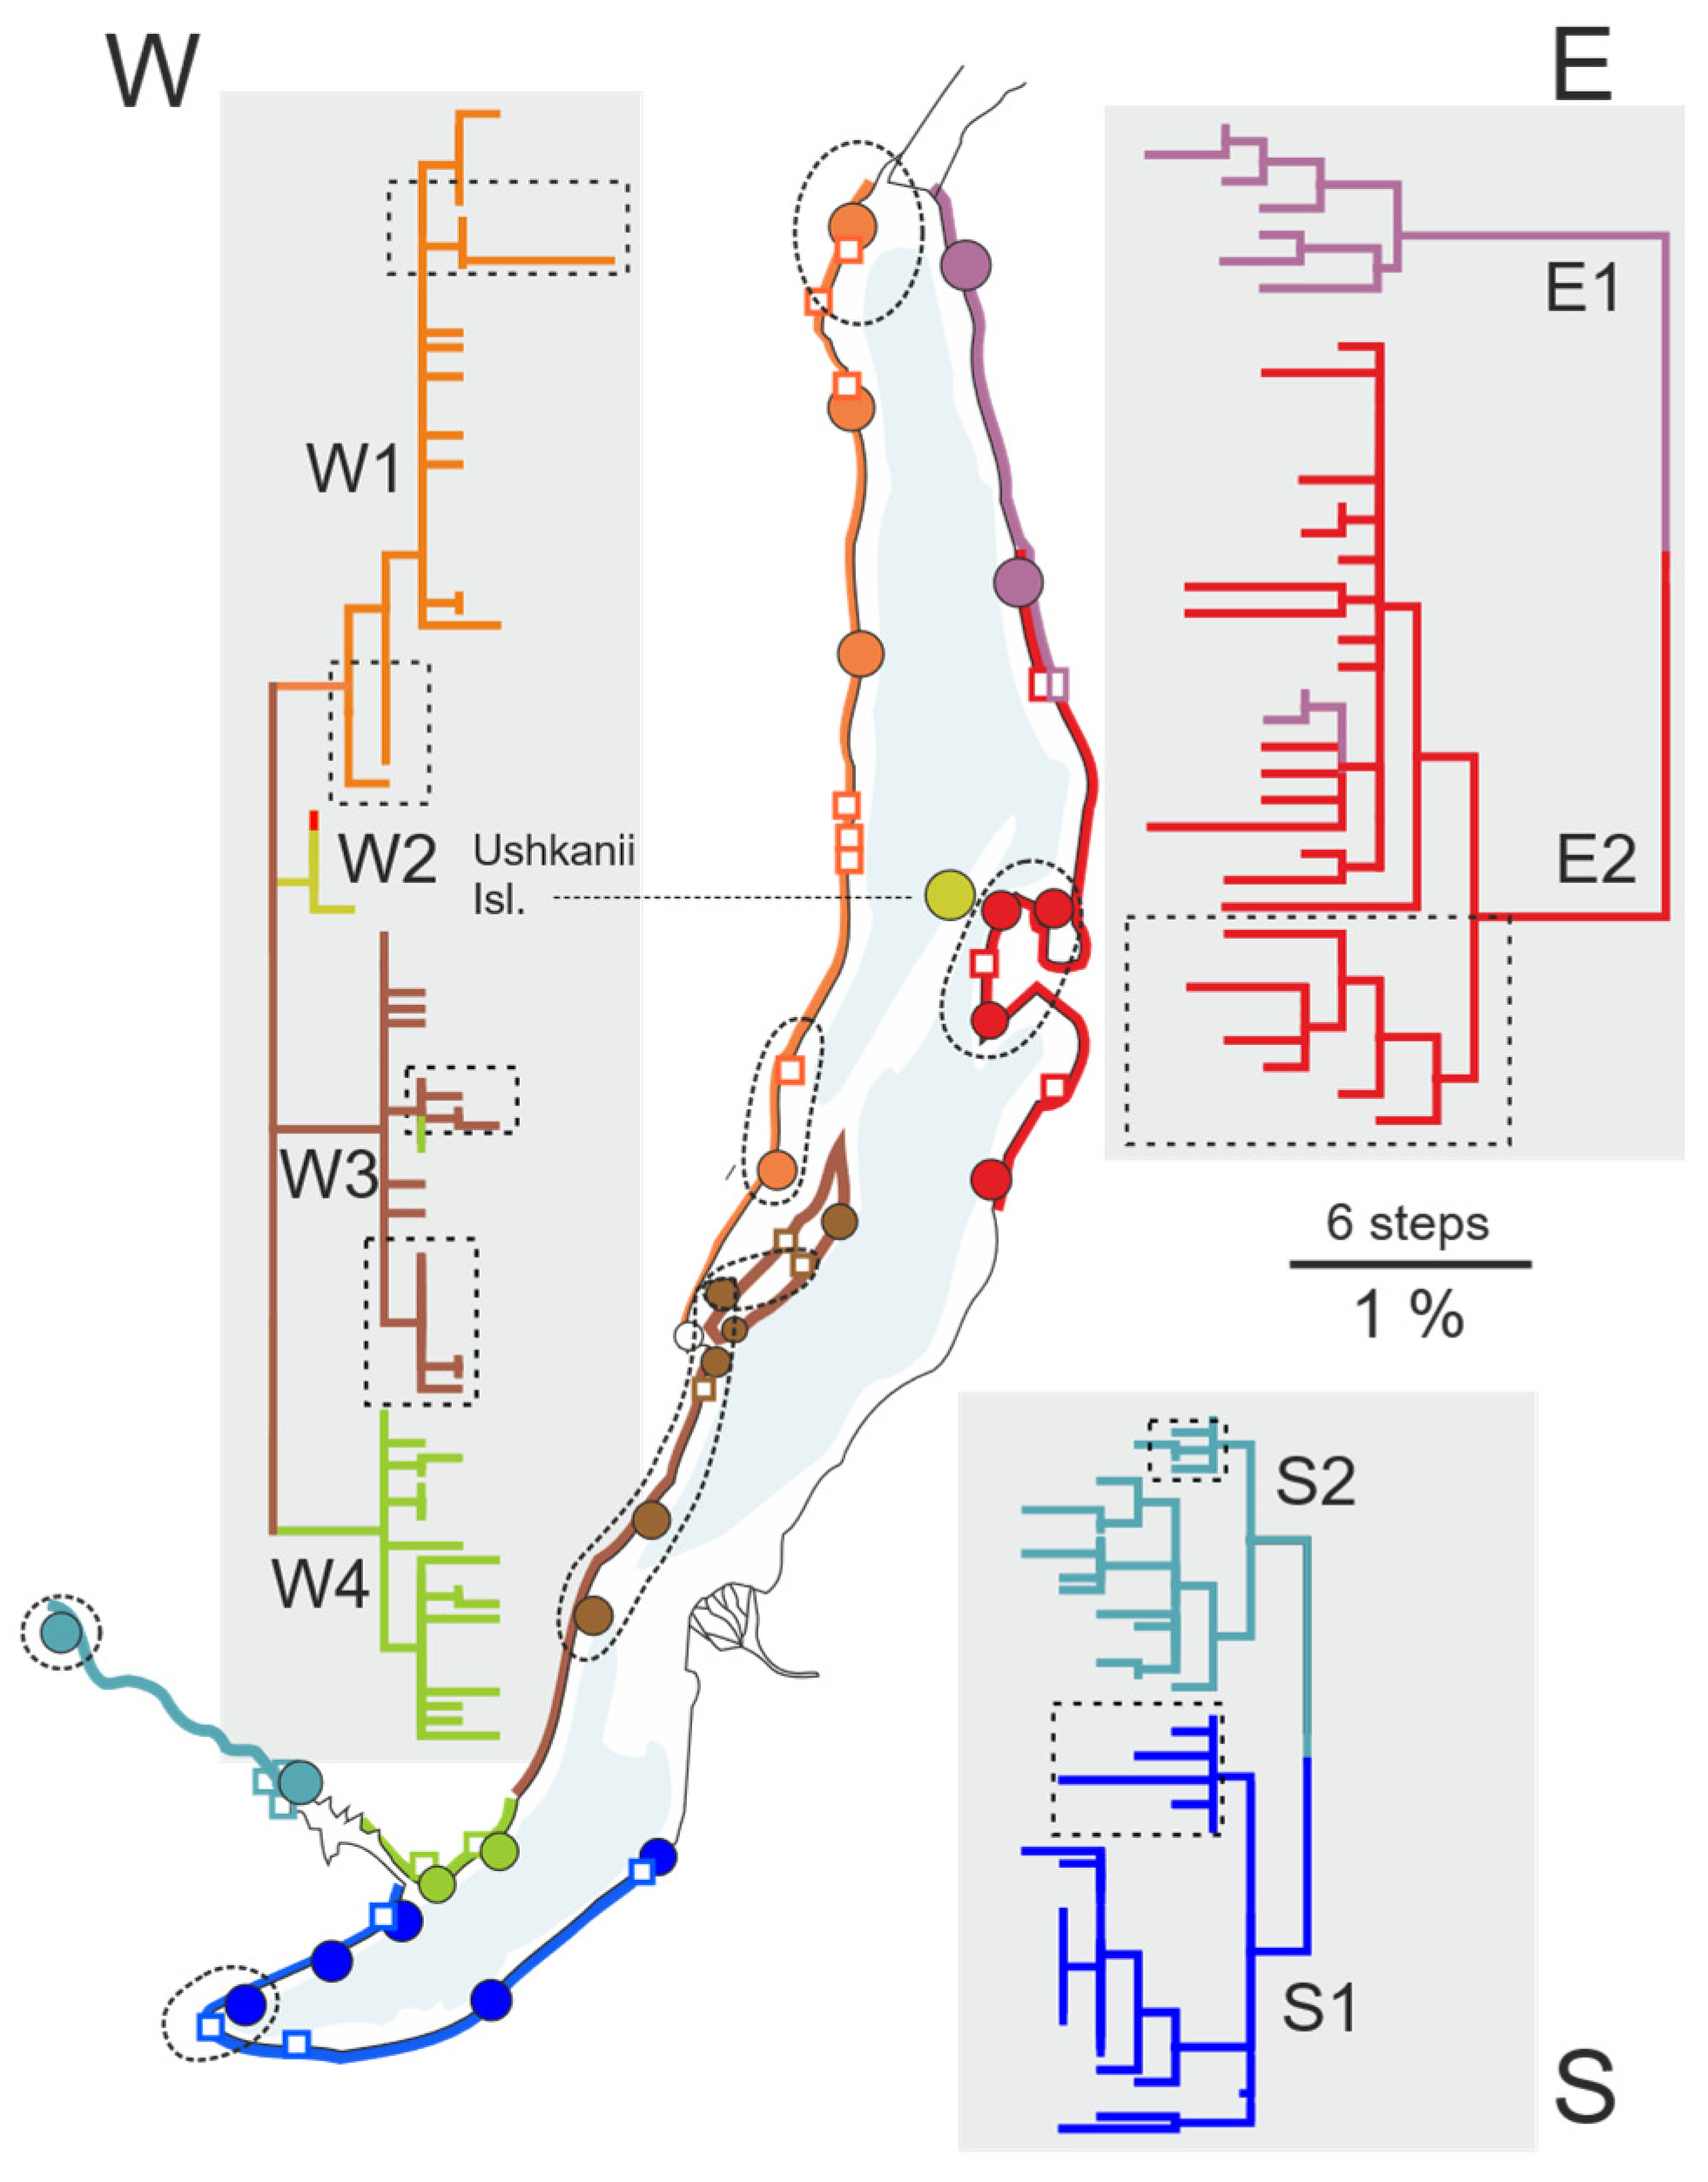
The phylogeography of the mitochondrial variation can be described on three hierarchical levels. At the top level, our data of 80 individual sequences describe a subdivision into three distinct mitochondrial lineages with practically non-overlapping distributions (Figure 3A and Figure 6), in accordance with the Gurkov et al. study [19]. Combining the data from the two studies now provides a good geographical coverage for the lineage ranges. Most notably, the distributions of the lineages match completely with the three main groups of populations identified by PCA of the nuclear data (Figure 3). The mean uncorrected sequence divergence between the three lineages is 11.1%, while a corresponding model-corrected composite ML distance is 20.9%.
At the next level, each of the lineages shows an intra-lineage subdivision, again with clear geographical segregation along the shoreline (Figure 6, displaying the combined data). The S lineage is divided into the South Baikal (S1) vs. Angara River (S2) sublineages or phylogroups, with a net distance between them of 0.9% and intra-phylogroup diversity of 0.6% (Table 1). The W lineage comprises four segments (cf. [19]): The northern W1 covers at least 300 km of the northwestern shoreline (our sites 15 to 19). Another phylogroup W2 is endemic to the Ushkanii islands. A central W3 phylogroup prevails on both sides of Olkhon Island and reaches at least 110 km south of the inter-basin Olkhon Gates Strait (site 10). The southern W4 phylogroup was only recorded in a narrow sector in the vicinity of the Angara River outflow (sites 7, 9). The average net distance between the W phylogroups is also 0.9%, but intragroup diversity is lower, 0.3%. The split within the E lineage in turn is deeper than the others, with a net distance of 2.2%, and the diversities within are also higher, on average 1.0%. E1 covers the northeastern shoreline (20, 40*), and E2 is distributed on both sides of the Svyatoi Nos peninsula, but their distributions overlap at the intervening sites (40* and Davsha). In terms of average inter-phylogroup distance, the approximate coalescence or root of the sublineage diversity in the S, W, and E lineages is at 1.6%, 1.1%, and 3.2%, respectively (Table 1).
Apart from the E1/E2 overlap, there are only rare deviations from the strict parapatry even at the phylogroup level, when individual “immigrant” haplotypes do occur in a neighboring territory (Figure 6). At the level of the main lineages, a single deviation was seen in a find of a W2 (Ushkanii islands) haplotype in the E2 range (site 39*).
A third level in the genetic organization is among populations within the phylogroups, i.e., regional population differentiation. As an observation, several lower-level haplogroups have localized distributions within their phylogroup range; these are encircled in Figure 6. The average local (intra-population) diversity varies among lineages following the pattern of phylogroup diversity and is fourfold higher in the E than the W lineage. Conversely, the relative inter-population differences are small in E (ΦSP = 0.1) where all haplotypes tend to be unique, whereas they are large in W (ΦSP = 0.3), reflecting the fact that in the W1 and W3 phylogroups (and in S1) individual samples often are monomorphic or nearly so. An individual haplotype may occur at a high frequency at a set of adjacent sites, and another one in another set or a single population, even if not being fixed or private. The haplotype frequency variation is then clearest in these low-diversity clusters.

4. Discussion

We report what is probably the so far most comprehensive parallel survey of geographical variation in multiple nuclear characters and mitochondrial DNA in the context of endemic Baikalian invertebrates. The data from Eulimnogammarus verrucosus disclose a striking overall concordance in the subdivisions in the two kinds of marker. These undoubtedly represent congruent signals of a single shared population history of the nuclear and mitochondrial genomes. Given the caveats with interpreting mtDNA (see introduction) and the evidently long-term proximity of neighboring genetic clusters, such consistency would not necessarily be expected and stresses the systematic and taxonomic significance of the variation.
There are several questions to be elucidated with such data, including the systematic and taxonomic significance (rank), the origin and history of the subdivisions in space and time, and the processes that maintain them. The representativeness of the patterns found in E. verrucosus in the broader context of the shallow-water fauna should also be considered. While definite answers to all questions might not exist, we will discuss them in turn.

4.1. Systematic Significance and Taxonomy

Confusion about species limits and ranks in Baikal amphipods is a long-lived issue, with roots in the basic compendium of Bazikalova (1945), who often described gradual and continuous patterns of morphological variation within taxa and established many subspecies [9]. Her subspecies concept was not conventionally geographical, however, but subspecies were often reported in sympatry. Initial molecular data pointed to reproductive isolation and the presence of distinct species in such instances [11]. Kamaltynov (2001) then uplifted all Bazikalova’s sympatric subspecies to the full species rank in one go [2], a decision not followed by Takhteev [3,10].
The repeated discovery of geographically distinct cryptic taxa has then introduced an additional level in the systematic hierarchy. To describe and distinguish this level, Daneliya and Väinölä (2014) proposed re-adopting the subspecies rank in the context of ancient lake faunas but now specifically to refer to genetically and systematically distinct segments with non-overlapping parapatric or allopatric distributions [11]. As with systematics in general, such distinction should be documented in congruent patterns in two or several characters (and thus not from mtDNA alone). From a demarcation of the Baikalian sponge-dwelling amphipod Doragostaiskia parasitica into five geographically non-overlapping mitochondrial lineages, comparable to those in E. verrucosus, and from parallel differences documented in morphology, five geographical subspecies were formally described [11].
For the current taxonomy, (nuclear) molecular characters should be equally valuable for diagnoses as are morphological differences, while they seldom have been used alone but rather to supplement morphology (e.g., [17,31,32]). The current multicharacter cryptic subdivision of E. verrucosus could evidently serve as a model example of a subspecies complex by the criteria of Daneliya and Väinölä [11]. A formal description using our genetic characters alone might still not be advised due to the fact that allozyme facilities for practical identification hardly exist anymore. Comparable DNA traits can be expected soon, however, and indeed have already been reported from the 18S rDNA sequence [19,33].
Using other criteria, there could be good arguments for the species rank as well, in particular when referring to the conventional biological species concept that emphasizes reproductive isolation. Even geographically, the striking and (necessarily) stable difference across the Angara River outlet is hard to decipher without reproductive isolation. Evidence of partial pre- and post-zygotic incompatibility was indeed obtained directly from crossing experiments [33], and narrow sympatric occurrence was also recently reported on the Angara shoreline [20]. Also, morphological distinction in coloration has been noted for the E lineage ([19] and RMK unpublished data; see Figure 1). At the same time, the clinal allele frequency variation across the northern W/E contact (Figure 4) suggests that gene exchange has not ceased across all boundaries.
We note that our subspecies concept primarily refers to the parapatric division of space by diagnosable taxa, to make a distinction to taxa inferred to occupy different niches—not to reproductive (in)compatibility as such. This is much in the spirit of the classical subspecies concept. In the ancient lakes context, (re)adoption of this formal rank should clarify the taxonomy of the species category, which is already overloaded by the hyperdiversity of species flocks, and perhaps reduce the urge for generic or subgeneric splitting, which so far has been excessive (cf. [2,3,24]). This rank should perfectly fit E. verrucosus.
The roles of geography vs. ecological segregation in diversification are basic issues for understanding the nature of species diversity in ancient lakes. The E. verrucosus complex is an illustrative case. E. v. oligacanthus Bazikalova, 1945 was initially described as a morphological and ecologically distinct subspecies of E. verrucosus, typical of sheltered environments with a relatively high temperature. The initial molecular studies and syntopic distributions then justified its distinction as a full species [2,11], and that distinction represents a fundamentally different phenomenon from that now seen among E. verrucosus S, W, and E. This again illustrates the utility of using different taxonomic categories for them (species vs. subspecies). The distinction is not necessarily seen in the amount of molecular divergence, however (E. oligacanthus is shown as the outgroup in Figure 3A). We will return to E. oligacanthus in the last section of the Discussion.

4.2. Divergence and Diversification

The discovery of a new level of diversity in the presence of cryptic taxa also presented a new challenge as regards assessing the time scale of divergence and its relationship to the geological and environmental history of ancient lakes, and we termed this “the paradox of diversification” [11]. The history of Lake Baikal spans tens of millions of years, but most of that time it resided in a warm climate, whereas the current “boreal” environment only arose in the Plio-Pleistocene, basically within the last 3 Myr [34]. While a leading hypothesis has been that the extraordinary morphological diversity arose as a response to the emergence of the current environment and its new niches, in amphipods that diversity now seems to be older than the modern Baikal and its ecology. At the same time, the new diversity, which more likely originated in the modern lake, is largely geographical and indistinct to the eye—not a product of adaptive radiation into new niches but of isolation or distance [11].
Mitochondrial divergence is a common yardstick in estimating the age of diversification; unfortunately, its calibration is unclear in Baikal amphipods (e.g., [7,35]). Conventionally in crustaceans, COI divergence rates of 2–4%/Myr are used as the basis of discussion (cf. [36] and references therein). In Eulimnogammarus, the corrected inter-lineage distances of 21% would then correspond to ages 5–10 Myr, which may appear unrealistic considering the retention of parapatry in the framework of the lake history. It seems more reasonable to discuss rates even five times higher (i.e., 15%/Myr), following [7,35,36], which gives lineage ages in the Early Pleistocene. Bukin et al. [16] discussed a similarly deep subdivision in another shoreline amphipod Gmelinoides fasciatus starting from an assumption that it was 2 Myr old, implicitly suggesting rates similar to those above, and tried to relate the subdivisions to lake history. Yet, while similar parapatric divisions are now known from several shallow-water amphipods (adding Babr and Dorogostaiskia), there is little concordance in the geographical boundaries (cf. [8,17]). Tracing the Eulimnogammarus split into specific events of a shared geological history would thus not seem a feasible exercise in the first place.
Another striking feature in the E verrucosus mitochondrial structure is the hierarchical parapatry or the presence of localized (still widespread) phylogroups within the component lineages or subspecies. Indications of similar structure are known from Acanthogammarus spp. [35] and from Dorogostaiskia spp. [18]. This structure could plausibly have arisen from a post-glacial spread from a number of local refugia where populations survived through the period of the last glacial maximum. The data from E. verrucosus would imply at least eight of them. Again, how would the depth of the subdivisions fit the proposed timescale? The estimates of intra-phylogroup diversities, which plausibly would be no older than the refugia, amount to 0.2–0.9%, or on average 0.6%, which corresponds to minimum 200 kyr and 40 kyr ages with the ‘standard’ and fast rates discussed above, of which the latter seems more reasonable. The mean inter-phylogroup net distance in turn was 1.3% and the average intergroup sequence distance was 2.0%, corresponding to 90 and 130 kyr, i.e., to last interglacial times with the putative fast rate, which seems acceptable. However, when relating the inter-phylogroup divergence to the initial S-W-E lineage divergence, one should also recall the general observation of “time-dependent rates”: In empirical data, recent (late-glacial) mitochondrial substitution rates regularly appear much faster than the “phylogenetic rates” estimated from older branches (such as S, W, E). For instance, seven-fold faster rates were estimated in [37], and post-glacial differences in select boreal freshwater crustaceans implied COI rates from 25% to 50%/Myr [38,39]. This further complicates the interpretation of the inter- vs. intra-lineage diversification histories.
Although these considerations are instructive, they will not provide definite dates. More interesting than the averages may actually be the differences in diversity found among the three E. verrucosus taxa (Table 1, Figure 6). Both the intra-phylogroup and inter-phylogroup diversities in the E lineage are much higher than in the others, about threefold compared to those in the W lineage. The total within-lineage diversity in W and S is similar to the within-phylogroup diversity in E (about 1%). Notably, within the E phylogroups, almost every haplotype is unique, while interpopulation structuring in haplotype frequencies was only recorded in the others. This may actually reflect quite different dynamics and timescales of population history in different parts of the lake through the last glacial cycle(s). A less likely cause would be different mutation rates (i.e., a higher rate in E) and that would also introduce a further paradox, since the relative lengths of the S, W, and E branches would rather suggest a lower rate in E (Figure 3A and Figure S2).
While the geographical subdivisions of E. verrucosus into distinct clusters in the mitochondrial and nuclear characters are strikingly coincident (Figure 2 and Figure 3), the two types of data also bear signals of different processes. Mitochondrial data represent a strict demarcation of the shoreline into segments at two hierarchical levels, with no or limited overlap (Figure 6). This provides an impression of stable structuring. The allele frequency data, while almost fully complying with the mtDNA structure, in turn also includes a clear component related to geographical distance, even across the cluster demarcation lines. At the highest level, this is seen in the ordering of the groups along PC1, and similarly in the backbone of the unrooted NJ-tree (Figure 3B), where the W group falls between the two others. The connectivity across the group boundaries is exhibited by populations near them being of intermediate composition or bearing an influence of the neighboring group. This is particularly clear in the north, with an Idh cline through most of the E group range grades smoothly to the W composition (Figure 4 and Figure 5), and a corresponding cline of Tpi on the W coast. Within W, the W(b) subgroup is often closer to the neighboring S than is W(a) (Gpt, Mdh, Gpi, Est). In the W(a)/W(b) contact, the samples from the islands show a mixed genetic composition (Figure 2 and Figure 4). All of this indicates that there has been, and probably still is, gene flow across the group boundaries, which is an important finding from this study regarding the inferences on the evolutionary independence of the taxa. The dynamics of mitochondrial and nuclear variation differ due to the different effective population sizes for the haploid and diploid genomes, and their different mutation rates, and retain information from different aspects of population history.

4.3. Eulimnogammarus oligacanthus, the Angara River “E. verrucosus A” and Associated Variation

Finally, we will comment on the identity and variation of E. verrucosus complex lineages in the Angara River, recently discussed by Saranchina et al. [20]. They described a fourth discrete lineage “E. verrucosus A”, which was only found within the river, occurring together with E. verrucosus S. The A lineage amphipods also deviated in morphology, with some resemblance to E. oligacanthus, a species that typically inhabits relatively warm embayments within Baikal (see above), but is also present in the Angara [2,4]. However, there was no sequence data of the actual E. oligacanthus available to address its relationship to “E. verrucosus A” [20].
Our COI data involve sequences of two individuals initially morphologically identified as E. oligacanthus by RMK, one from Lake Baikal, Mukhor Bay at the southern end of the Maloe More strait (current site 14), and the other from Angara (Irkutsk). Our Baikal sequence matches exactly with the main haplotype of the Angara “E. verrucosus A”, and the other clusters within 0.5–1.0% of the A haplotypes. An ML tree of the sequence affinities is shown in Figure S2. The earlier allozyme data, in turn, showed that the Mukhor Bay E. oligacanthus is genetically the same as a population from the Chivyrkui Bay on the Baikal east coast (near site 22), which we found to coexist with E. verrucosus E (which at that time was mislabeled as “E. (v.) oligacanthus, kamen form”, however) [11]. Chivyrkui Bay includes the type locality of E. oligacanthus. From this, the Angara A lineage would actually represent the E. oligacanthus of Lake Baikal itself. From these records, E. oligacanthus now seems to co-occur with each of the S, W, and E lineages of E. verrucosus in reproductive isolation. The close sequence similarity of the mid-Baikal and Angara E. oligacanthus appears unexpected in view of the ample phylogeographic structuring seen within each of the E. verrucosus lineages, but also in view of the morphological variations noted in [20].
Nevertheless, the E. oligacanthus lineage is not homogeneous either. A rare COI sub-lineage A* represented by two Angara individuals ca. 7% different from the main lineage A haplotype was reported by Saranchina et al. [20]. We recorded the same sublineage from two sites in the Angara River down from the Irkutsk dam (Irkutsk, and Ust Balei 50 km further downstream), from the Irkutsk reservoir above the dam ca. 12 km from the outlet (BR in Figure 1), and also from Kultuk, the SW corner of Lake Baikal itself, in specimens of Eulimnogammarus cf. verrucosus with no definite identification (Figure S2). Sequence diversity within this sublineage appears relatively high, suggesting that it might not be of single refugial origin.
Saranchina et al. [20] discussed a scenario where E. oligacanthus represents a basal lineage from which the E. verrucosus complex diverged 5.5 Myr ago; that represents a different concept of the ages and rates of diversification from that preferred here (Section 4.2 above). Also, while the E. oligacanthus sequences are somewhat more diverged from the three E. verrucosus lineages than the latter are from each other on average, the phylogenetically basal position of E. oligacanthus with regard to the (S, W, E) cluster actually seems to have no particular support in the COI tree analyses (Figure 3A and Figure S2).

Supplementary Materials

The following supporting information can be downloaded at https://www.mdpi.com/article/10.3390/d16110706/s1, Table S1. List of samples analyzed for the original data. Table S2. Allele frequency estimates and sample sizes for seven allozyme loci in 27 population samples of Eulimnogammarus verrucosus, from within Lake Baikal. Table S3. Aligned COI sequences (original and published) used in the study. Figure S1. A three-dimensional projection of the principal component scores of the allozyme data (PC1–PC3). Figure S2. A maximum likelihood tree of COI sequences including data from E. oligacanthus, “E. verrucosus A”, and related unidentified specimens.

Author Contributions

Conceptualization, R.V. and K.M.; resources, K.M., R.M.K. and R.V.; investigation, T.K. and R.V.; data curation, T.K. and R.V.; formal analysis, R.V. and T.K.; visualization, R.V. and T.K.; writing—original draft and final version, R.V.; funding acquisition, R.V. and K.M. All authors have read and agreed to the published version of the manuscript.

Funding

This research was funded by the Academy of Finland and by the Ministry of Culture, Education and Science of Japan.

Data Availability Statement

The allele frequency data and nucleotide sequence alignments are provided in the Supplementary Materials of this paper. New sequences are deposited in GenBank (PQ557398-PQ557489).

Acknowledgments

We are grateful to the management and crew of the Limnological Institute, Irkutsk, for their support of the collaborative studies, to Hannu Mäkinen for DNA sequencing, and to the referees for feedback.

Conflicts of Interest

The authors declare no conflicts of interest.

References

  1. Kozhova, O.M.; Izmesteva, L.R. Lake Baikal: Evolution and Biodiversity; Backhuys: Leiden, The Netherlands, 1998. [Google Scholar]
  2. Kamaltynov, R.M. Amfipody (Amphipoda: Gammaroidea). In Annotirovannyi Spisok Fauny Ozera Baikal i Ego Vodosbornogo Basseina. Tom I: Ozero Baikal. Kniga 1; Timoshkin, O.A., Ed.; Nauka: Novosibirsk, Russia, 2001; pp. 572–831. [Google Scholar]
  3. Takhteev, V.V.; Berezina, N.A.; Sidorov, D.A. Checklist of the Amphipoda (Crustacea) from continental waters of Russia, with data on alien species. Arthropoda Sel. 2015, 24, 335–370. [Google Scholar] [CrossRef]
  4. Kamaltynov, R.M. Vysshie rakoobraznye (Amphipoda: Gammaroidea) Angary i Eniseya. In Annotirovannyi Spisok Fauny Ozera Baikal i Ego Vodosbornogo Basseina. Tom II: Vodoemy i Vodotoki Yuga Vostochnoi Sibiri i Severnoi Mongolii. Kniga 1; Timoshkin, O.A., Ed.; Nauka: Novosibirsk, Russia, 2009; pp. 297–329. [Google Scholar]
  5. Macdonald, K.S., III; Yampolsky, L.; Duffy, J.E. Molecular and morphological evolution of the amphipod radiation of Lake Baikal. Mol. Phylogenet. Evol. 2005, 35, 323–343. [Google Scholar] [CrossRef] [PubMed]
  6. Hou, Z.; Sket, B.; Li, S. Phylogenetic analyses of Gammaridae crustacean reveal different diversification patterns among sister lineages in the Tethyan region. Cladistics 2014, 30, 352–365. [Google Scholar] [CrossRef] [PubMed]
  7. Naumenko, S.A.; Logacheva, M.D.; Popova, N.V.; Klepikova, A.V.; Penin, A.A.; Bazykin, G.A.; Etingova, A.E.; Mugue, N.S.; Kondrashov, A.S.; Yampolsky, L.Y. Transcriptome-based phylogeny of endemic Lake Baikal amphipod species flock: Fast speciation accompanied by frequent episodes of positive selection. Mol. Ecol. 2017, 26, 536–553. [Google Scholar] [CrossRef] [PubMed]
  8. Drozdova, P.B.; Madyarova, E.V.; Gurkov, A.N.; Saranchina, A.E.; Romanova, E.V.; Petunina, J.V.; Peretolchina, T.E.; Sherbakov, D.Y.; Timofeyev, M.A. Lake Baikal amphipods and their genomes, great and small. Vavilovskii Zhurnal Genet. Sel. 2024, 28, 317–325. [Google Scholar] [CrossRef]
  9. Bazikalova, A.Y. Amfipoda ozera Baikala. Tr. Baikalskoi Limnol. Stantsii 1945, 11, 1–440. [Google Scholar]
  10. Takhteev, V. On the current state of taxonomy of the Baikal Lake amphipods (Crustacea, Amphipoda) and the typological ways of constructing their system. Arthropoda Sel. 2019, 28, 374–402. [Google Scholar] [CrossRef]
  11. Väinölä, R.; Kamaltynov, R.M. Species diversity and speciation in the endemic amphipods of Lake Baikal: Molecular evidence. Crustaceana 1999, 72, 945–955. [Google Scholar]
  12. Yampolsky, L.Y.; Kamaltynov, R.M.; Ebert, D.; Filatov, D.A.; Chernykh, V.I. Variation of allozyme loci in endemic gammarids of Lake Baikal. Biol. J. Linn. Soc. 1994, 53, 309–323. [Google Scholar] [CrossRef]
  13. Mashiko, K.; Kamaltynov, R.; Shervakov, D.Y.; Morino, H. Genetic separation of gammarid (Eulimnogammarus cyaneus) populations by localized topographic changes in ancient Lake Baikal. Arch. Hydrobiol. 1997, 139, 379–387. [Google Scholar] [CrossRef]
  14. Mashiko, K.; Kamaltynov, R.; Morino, H.; Sherbakov, D.Y. Genetic differentiation among gammarid (Eulimnogammarus cyaneus) populations in Lake Baikal, East Siberia. Arch. Hydrobiol. 2000, 148, 249–261. [Google Scholar] [CrossRef]
  15. Gomanenko, G.V.; Kamaltynov, R.M.; Kuzmenkova, Z.V.; Berenos, K.; Sherbakov, D.Y. Population structure of the Baikalian amphipod Gmelinoides fasciatus (Stebbing). Russ. J. Genet. 2005, 41, 907–912. [Google Scholar] [CrossRef]
  16. Bukin, Y.S.; Petunina, J.V.; Sherbakov, D.Y. The mechanisms for genetic diversity of Baikal endemic amphipod Gmelinoides fasciatus: Relationships between the population processes and paleoclimatic history of the lake. Russ. J. Genet. 2018, 54, 1059–1068. [Google Scholar] [CrossRef]
  17. Daneliya, M.E.; Kamaltynov, R.M.; Kontula, T.; Väinölä, R. Systematics of the Baikalian Babr (Crustacea: Amphipoda: Pallaseidae). Zootaxa 2009, 2276, 49–68. [Google Scholar] [CrossRef]
  18. Daneliya, M.E.; Väinölä, R. Five subspecies of the Dorogostaiskia parasitica complex (Dybowsky) (Crustacea: Amphipoda: Acanthogammaridae), epibionts of sponges in Lake Baikal. Hydrobiologia 2014, 739, 95–117. [Google Scholar] [CrossRef]
  19. Gurkov, A.; Rivarola-Duarte, L.; Bedulina, D.; Fernández Casas, I.; Michael, H.; Drozdova, P.; Nazarova, A.; Govorukhina, E.; Timofeyev, M.; Stadler, P.F.; et al. Indication of ongoing amphipod speciation in Lake Baikal by genetic structures within endemic species. BMC Evol. Biol. 2019, 19, 138. [Google Scholar] [CrossRef]
  20. Saranchina, A.; Mutin, A.; Govorukhina, E.; Rzhechitskiy Ya Gurkov, D.; Timofeyev, M.; Drozdova, P. Genetic diversity in a Baikal species complex Eulimnogammarus verrucosus (Amphipoda: Gammaroidea) in the Angara River, the only outflow of Lake Baikal. Zool. Scr. 2024, 53, 867–879. [Google Scholar] [CrossRef]
  21. Ballard, J.W.O.; Whitlock, M.C. The incomplete natural history of mitochondria. Mol. Ecol. 2004, 13, 729–744. [Google Scholar] [CrossRef]
  22. Rubinoff, D.; Holland, B.S. Between Two Extremes: Mitochondrial DNA is neither the Panacea nor the Nemesis of Phylogenetic and Taxonomic Inference. Syst. Biol. 2005, 54, 952–961. [Google Scholar] [CrossRef]
  23. Väinölä, R.; Kontula, T.; Mashiko, K.; Kamaltynov, R.M. Extensive geographical structuring of ”intraspecific” molecular diversity in endemic Lake Baikal amphipods. In Abstracts of the Third International Symposium “Ancient Lakes: Speciation, Development in Time and Space, Natural History”, Irkutsk, Russia, 2–7 September 2002; Nauka: Novosibirsk, Russia, 2002; p. 198. Available online: https://www.marinespecies.org/aphia.php?p=sourcedetails&id=492598 (accessed on 25 September 2024).
  24. Horton, T.; Lowry, J.; De Broyer, C.; Bellan-Santini, D.; Copilaş-Ciocianu, D.; Daneliya, M.E.; Dauvin, J.C.; Fišer, C.; Gasca, R.; Grabowski, M.; et al. World Amphipoda Database. 2024. Available online: https://www.marinespecies.org/amphipoda (accessed on 3 November 2024). [CrossRef]
  25. Murphy, R.W.; Sites, J.W.; Buth, D.G.; Haufler, C.H. Proteins: Isozyme electrophoresis. In Molecular Systematics; Hillis, D.M., Moritz, C., Mable, B.K., Eds.; Sinauer Associates: Sunderland, MA, USA, 1996; pp. 51–120. [Google Scholar]
  26. Väinölä, R.; Varvio, S.L. Molecular divergence and evolutionary relationships in Pontoporeia (Crustacea: Amphipoda). Can. J. Fish. Aquat. Sci. 1989, 46, 1705–1713. [Google Scholar] [CrossRef]
  27. Väinölä, R.; Vainio, J.K.; Palo, J.U. Phylogeography of “glacial relict” Gammaracanthus (Crustacea, Amphipoda) from boreal lakes and the Caspian and White seas. Can. J. Fish. Aquat. Sci. 2001, 58, 2247–2257. [Google Scholar] [CrossRef]
  28. Audzijonytė, A.; Damgaard, J.; Varvio, S.L.; Vainio, J.K.; Väinölä, R. Phylogeny of Mysis (Crustacea, Mysida): History of continental invasions inferred from molecular and morphological data. Cladistics 2005, 21, 575–596. [Google Scholar] [CrossRef] [PubMed]
  29. Hammer, Ø.; Harper, D.A.T.; Ryan, P.D. PAST: Paleontological Statistics Software Package for Education and Data Analysis. Palaeontol. Electron. 2001, 4, 1–9. Available online: https://www.nhm.uio.no/english/research/resources/past/ (accessed on 1 August 2023).
  30. Tamura, K.; Stecher, G.; Kumar, S. MEGA 11: Molecular Evolutionary Genetics Analysis Version 11. Mol. Biol. Evol. 2021, 38, 3022–3027. [Google Scholar] [CrossRef] [PubMed]
  31. Delić, T.; Švara, V.; Coleman, C.O.; Trontelj, P.; Fišer, C. The giant cryptic amphipod species of the subterranean genus Niphargus (Crustacea, Amphipoda). Zool. Scr. 2017, 46, 740–752. [Google Scholar] [CrossRef]
  32. Audzijonyte, A.; Väinölä, R. Mysis nordenskioldi n. sp. (Crustacea, Mysida), a circumpolar coastal mysid separated from the NE Pacific M. litoralis (Banner, 1948). Polar Biol. 2007, 30, 1137–1157. [Google Scholar] [CrossRef]
  33. Drozdova, P.; Saranchina, A.; Madyarova, E.; Gurkov, A.; Timofeyev, M. Experimental crossing confirms reproductive isolation between cryptic species within Eulimnogammarus verrucosus (Crustacea: Amphipoda) from Lake Baikal. Int. J. Mol. Sci. 2022, 23, 10858. [Google Scholar] [CrossRef]
  34. Mats, V.D.; Shcherbakov, D.Y.; Efimova, I.M. Late Cretaceous-Cenozoic history of the Lake Baikal depression and formation of its unique biodiversity. Stratigr. Geol. Correl. 2011, 19, 404–423. [Google Scholar] [CrossRef]
  35. Daneliya, M.E.; Kamaltynov, R.M.; Väinölä, R. Phylogeography and systematics of Acanthogammarus s. str., giant amphipod crustaceans from Lake Baikal. Zool. Scr. 2011, 40, 623–637. [Google Scholar] [CrossRef]
  36. Kochanova, E.; Mayor, T.; Väinölä, R. Cryptic diversity and speciation in an endemic copepod crustacean Harpacticella inopinata within Lake Baikal. Ecol. Evol. 2024, 14, e11471. [Google Scholar] [CrossRef]
  37. Crandall, E.D.; Sbrocco, E.J.; DeBoer, T.S.; Barber, P.H.; Carpenter, K.E. Expansion dating: Calibrating molecular clocks in marine species from expansions onto the Sunda shelf following the last glacial maximum. Mol. Biol. Evol. 2012, 29, 707–719. [Google Scholar] [CrossRef] [PubMed]
  38. Audzijonyte, A.; Väinölä, R. Phylogeographic analyses of a circumarctic coastal and a boreal lacustrine mysid crustacean, and evidence of fast postglacial mtDNA rates. Mol. Ecol. 2006, 15, 3287–3301. [Google Scholar] [CrossRef] [PubMed]
  39. Loehr, J.; Sundell, J.; Immonen, M.; Väinölä, R. Patterns in antipredator armature reduction and maintenance in isolated spring populations of an amphipod crustacean. Ecol. Evol. 2023, 13, e10423. [Google Scholar] [CrossRef] [PubMed]
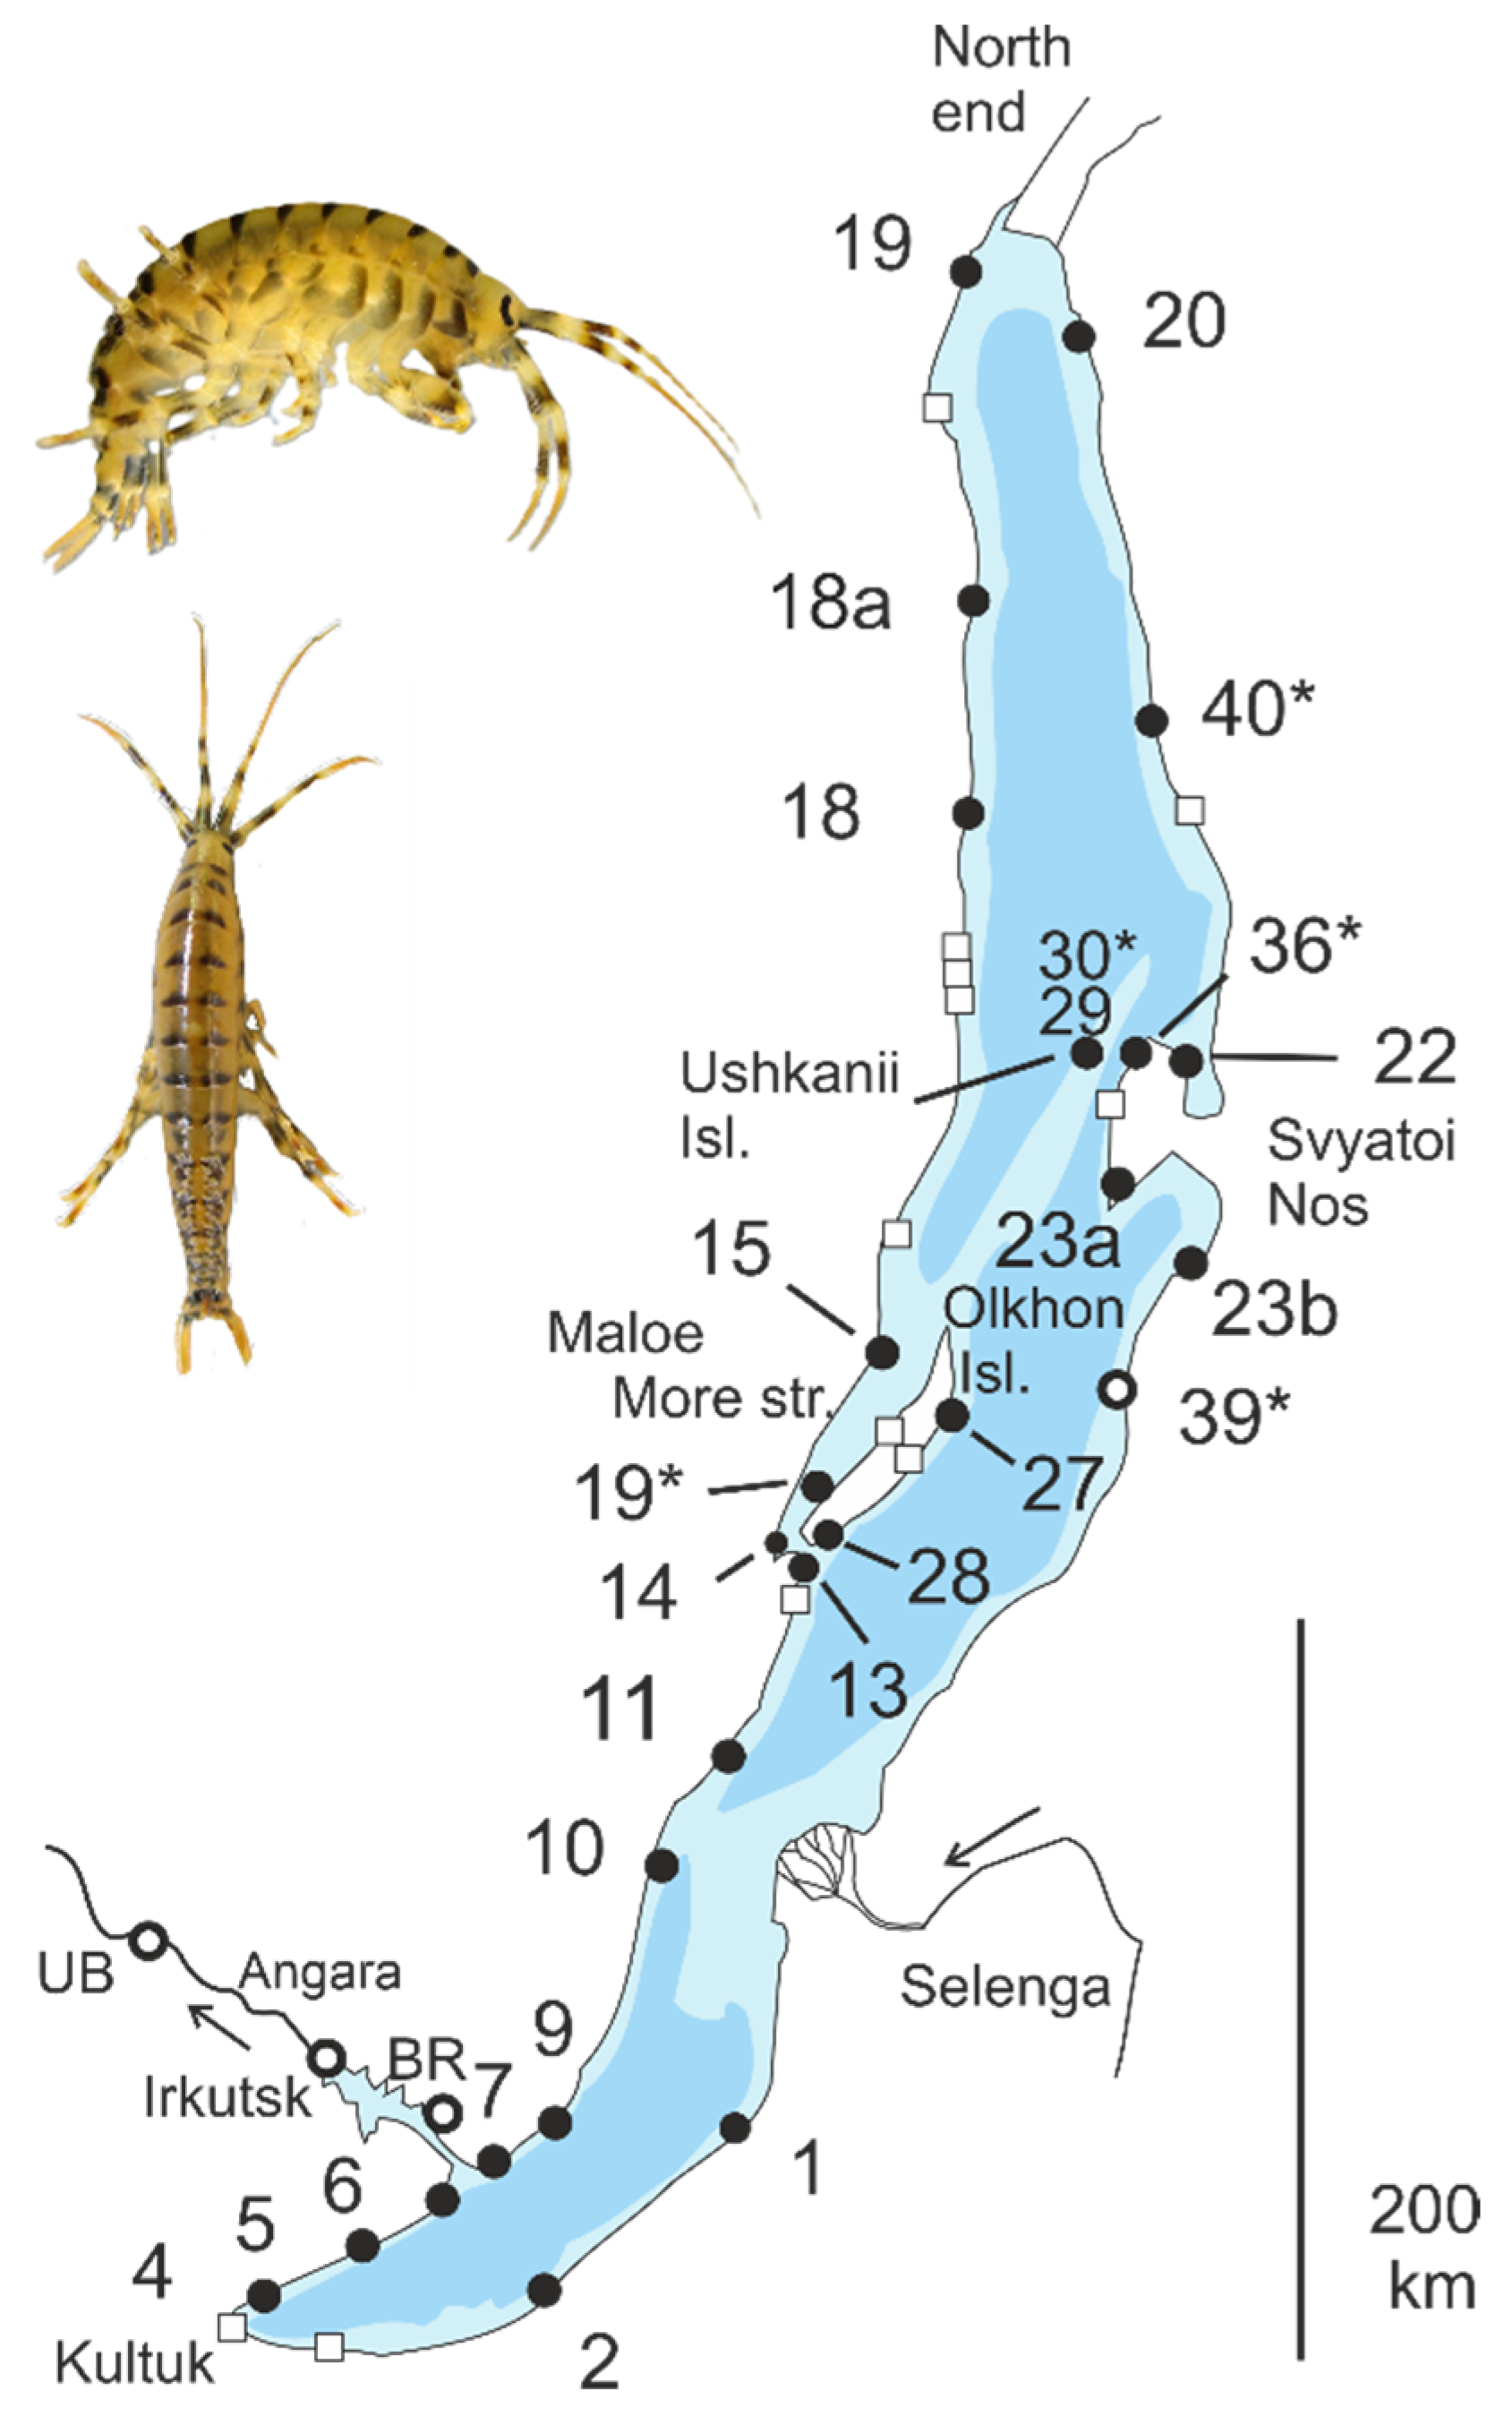
Figure 1. Index map of sampling localities. Black dots are sites for the allozyme + mtDNA data. Plain numbers represent 1993–1995 samples, with site codes from Mashiko et al. [14]; codes with a letter are adjacent sites from the same expeditions. Numbers with an asterisk are sites from 1999. Open circles are sites with mtDNA data only. A full list of the localities with sample information is presented in Table S1. Open squares are additional sites of Gurkov et al.’s mtDNA data [19]. The photographs display E. verrucosus E from the Chivyrkui Bay, near site 22.
Diversity 16 00706 g001
Figure 2. Principal components plot (PC1 vs. PC2) of the Eulimnogammarus verrucosus complex allozyme frequency data. Locality codes are those in Figure 1 and Table S1.
Diversity 16 00706 g002
Figure 3. NJ trees (A) from uncorrected p-distances from the original Eulimnogammarus verrucosus COI sequence data in this study, (B) from allozyme data (7-locus Euclidean distances among populations, data as in Figure 2). (C) Distribution of the three main genetic groups S, W, and E and the subgroups of W along the shores of Baikal, congruently in the two datasets. The grey reference sequence is of E. oligacanthus.
Diversity 16 00706 g003
Figure 4. Frequencies of major alleles at each allozyme locus plotted against geographical distance along the shoreline around Baikal, clockwise from site 1 in Figure 1. Samples 28, 19*, and 27 from the Olkhon and Ogoi islands in the W(a)/W(b) borderline are encircled, those from the continental strand are interconnected by the lines. Original data are given in Table S2.
Diversity 16 00706 g004
Figure 5. Examples of allele frequency variation at three nuclear allozyme loci. The two most common alleles and the pooled frequency of remaining minor alleles at each locus are shown in the pie diagrams; data from Table S2.
Diversity 16 00706 g005
Figure 6. COI haplotype trees for each of the three main mitochondrial lineages of Eulimnogammarus verrucosus, color-coded for geographically demarcated sublineages or phylogroups. The topologies are examples from larger sets of equally parsimonious MP trees, and detailed local relationships are not significant. Haplogroups with restricted distribution within a phylogroup range are surrounded by a dashed line, reciprocally in the tree and on the map. Individuals clustering in a clade typical of another region are marked with the color of their own region. Apart from original sequences, the trees include data from Gurkov et al. [19] and Saranchina et al. [20] from sites indicated by open squares.
Diversity 16 00706 g006
Table 1. Estimates of COI nucleotide diversity π within each lineage, within phylogroups, and within sampling sites, and of inter-phylogroup net distance and average distance. The last column describes the average among site differentiation within a phylogroup (proportion of inter-site diversity of the phylogroup diversity).
Lineage Total π Within Lineage (%)Average π Within Phylogroups (%)Average π Within Sites (%)Between Phylogroups Net Distance (%)Average Between-Phylogroup Distance (%)Differentiation Among Sites ΦSP
S1.090.640.540.921.560.20
W0.980.270.210.881.160.27
E1.640.950.872.213.160.10
Average1.230.620.541.341.960.19
Disclaimer/Publisher’s Note: The statements, opinions and data contained in all publications are solely those of the individual author(s) and contributor(s) and not of MDPI and/or the editor(s). MDPI and/or the editor(s) disclaim responsibility for any injury to people or property resulting from any ideas, methods, instructions or products referred to in the content.