Article

Change in the Ecological Stoichiometry of Carex thunbergii in Response to Seasonal Dynamics and Environmental Factors in Shengjin Lake, China

Anhui Province Key Laboratory of Wetland Ecosystem Protection and Restoration, School of Resources and Environmental Engineering, Anhui University, Hefei 230601, China
*
Author to whom correspondence should be addressed.
Diversity 2024, 16(4), 198; https://doi.org/10.3390/d16040198
Submission received: 25 February 2024 / Revised: 16 March 2024 / Accepted: 20 March 2024 / Published: 26 March 2024

Abstract

:
Exploring the effects of environmental factors and plant physiological processes on plant nutrient stoichiometry is of great significance to understanding how wetland vegetation distributes and maintains function. However, we have a limited understanding of how the combination of plant communities and seasonality with soil physicochemical properties affects nutrient stoichiometry in wetland plants. In this study, we examined these factors in Carex thunbergii and soil across four types of plant communities dominant in the riparian zone of Shengjin Lake during the non−flooding periods of December 2020 and March 2021. In winter, the total foliar C, N, and P concentrations decreased along with an increase in plant coverage, which did not differ in spring. The C, N, C: P, and N: P of foliage significantly increased over the season, while soil C, N, C: P, and N: P significantly decreased over the season. Both in winter and spring, soil C and soil N decreased along with the increase of plant coverage. Our results suggest that both plant community and soil physicochemical properties have a significant influence on plant nutrient stoichiometry. This study improves our understanding of the seasonal dynamics of plant nutrients under different communities and soil physicochemical properties.

1. Introduction

Riparian wetlands, as transition zones between aquatic and terrestrial ecosystems, host highly diverse biological communities and are considered to play a critical role in climate change, biodiversity protection, hydrology, and the biogeochemical cycles of carbon (C), nitrogen (N), and phosphorous (P), as well as maintaining ecosystem health and stability [1,2]. Meanwhile, riparian ecosystems are highly sensitive to changing natural processes and anthropogenic activities and are among the most degraded and impacted ecosystems in the world [3]. As the main producer of the system, the plant community in a riparian zone has a considerable effect on a range of wetland ecosystem functions [4]. However, wetland plant communities interact with the hydrologic regime, nutrient inputs, the biota, and the physicochemical environment of wetlands to affect the wetland ecosystem and functioning in complex and dynamic ways that are not fully understood [5,6].
Ecological stoichiometry is the study of relationships between organisms and the environment through the imbalances of chemical elements, ratios, and flux rates, which provides a comprehensive method for studying the coupling relationship between an ecosystem and biogeochemical cycles [7]. C, N, and P are not only the most basic resources of mineral and organic elements required for plant growth [8], but are also important as they reflect the speed of growth, the level of nutrient utilization efficiency, and the judgment of restrictive elements [9,10]. Thus, leaf stoichiometry plays a vital role in analyzing the composition, structure, and function of a concerned community and ecological system [11]. Soil is the basis for the survival of plants, and provides nutrients and water for plant growth and development [12]. Changes in soil properties will lead to changes in plant communities. Soil C: N: P ratios can directly reflect soil fertility and indirectly reflect the nutritional status of plants and the species composition of plant communities [13]. Work in grasslands has suggested that greater plant species richness leads to more efficient uptake of nutrients and greater productivity [14].
Under different environmental conditions, plant physiological processes [15], wetland hydrology, soil pH [16], salinity [17], and community type [18] can determine nutrient balance. In turn, the accumulation and allocation of nutrients (that is, the concentrations and ratios of C, N, and P) reflect the adaptation of plants in a changing environment [19]. The metrological comparison of soil and plant C, N, and P is of great significance to reflect the speed of plant growth, the level of nutrient utilization efficiency, the judgment of restrictive elements, and the ecosystem dynamics and functioning [11]. It is generally believed that riparian vegetation is typically dominated by a single vascular plant species due to the seasonally fluctuating water level [20]. Thus, it is critical to reveal the role of the dominant species in plant community dynamics and nutrient cycling in riparian zones.
Shengjin Lake is a typical shallow lake connected to Yangtze River, experiencing prolonged flooding in the summer and fall. During the water−falling stage, the dominant Carex thunbergii can cover almost 80% of the area of the riparian zone [21]. That is to say, the riparian plants, especially the dominant C. thunbergii, wither into dormancy under flooding and reproduce from the winter to the spring in the next year. Nonetheless, how nutrient stoichiometry changes in response to seasonal dynamics and environmental factors related to the growth rhythm of wetland plants like C. thunbergii is not well known.
In addition to environmental factors, plant nutrient stoichiometry changes with growth phases [15,22]. For example, plant C: N and C: P ratios increase significantly with increasing leaf age in the Inner Mongolian grasslands [23], whereas in the Laizhou Bay coastal wetland, the contents of C, N, and P in Tamarix chinensis exhibit significant inter−seasonal variation [22]. The seasonal dynamics of plant stoichiometry may also differ due to the unique hydrological rhythms in wetlands such as river−connected lakes and floodplains compared with other wetland types, but our current understanding of such dynamics is far from complete. To address these knowledge gaps, we investigated C. thunbergii along three plant communities in Shengjin Lake during two seasons. The objectives of this study were to examine: (1) seasonal and plant community effects on foliar stoichiometric characteristics, and (2) the relationships between foliar stoichiometric characteristics and soil physicochemical characteristics.

2. Materials and Methods

2.1. Study Site

The experiment was conducted in a riparian zone area of Shengjin Lake (30°16′–30°25′ N, 116°59′–117°12′ E). The Shengjin Lake is in the middle and lower reach of the Yangtze River’s southern bank. The mean annual temperature is 16.1℃ and the annual precipitation is 1600 mm. Due to the typical subtropical monsoon climate, the water table shows clear seasonal fluctuation. Shengjin Lake’s water level reached a high of 17 m on 2 August 2020, and a low of 8.05 m on 30 December 2020. At sampling time, the average water level of Shengjin Lake was 9.44 m in December 2020 and 9.45 m in March 2021 (water level information comes from the Anhui hydrology telemetry information network, http://yc.wswj.net/ahyc/ (accessed on 22 May 2022), in the upper reaches of the Huangpen sluice). During the water−falling stage, the riparian zone covered approximately 133 km2, and the dominant C. thunbergii covered almost 80% of the riparian zone [21]. In this area, there were randomly scattered plant communities with different kinds of vegetation made up of C. thunbergii and hygrophytes, mostly Phalaris arundinacea, Rumex dentatus, and Eleocharis dulcis. [21]

2.2. Experimental Communities and Sampling

According to the differing coverage of C. thunbergii in various vegetation cover zones, we defined four types of plant communities that dominated in the riparian zone: (1) Bs, Bare soil; (2) CR, 20% C. thunbergii + 10% E. dulcis + 40% R. dentatus cover; (3) CP, 45% C. thunbergii + 45% P. arundinacea cover; and (4) Ct, 95% C. thunbergii cover. Quadrates were randomly selected in different sections of Shengjin Lake with uniform vegetation distribution for each vegetation type. The quadrates were 4 m × 4 m in size, and 4 repeat quadrates were set up for each vegetation type, so there were 16 different quadrates in total, and 5 sampling zone plots of 1 m × 1 m were set up in each quadrate (Figure 1). Plot coordinates were recorded using GPS for repeated sampling of mature leaves similar in growth performance (e.g., length and color) in the following year. Field investigations were conducted in December 2020 and March 2021 as the sampling zones were flooded from April to October annually. In each sampling zone, the plant species and coverage were recorded in 1 m × 1 m quadrats. The whole above−ground C. thunbergii samples from each plot were collected, and their fresh weight was determined using an electronic scale with 0.01 kg precision.
Soil samples were collected after vegetation sampling. Five soil cores (0–20 cm depth) were taken with a stainless−steel corer from the four corners and the center of the same 1 m × 1 m quadrats used for plant observations, then thoroughly mixed into one composite sample. Plant and soil samples were sealed in resalable lock bags and transported to the laboratory, being kept at 4 °C until analysis.

2.3. Laboratory Analysis

All plant samples were heat−killed at 105 °C for 15 min, then dried at 75 °C for 48 h to constant weight. The soil samples were air−dried and passed through a 0.25 mm sieve to remove gravel and plant remnants. The leaf organic carbon (LC), soil organic carbon (SOC), total leaf nitrogen (LN), and total soil nitrogen (STN) concentrations were measured with an elemental analyzer (vario MICRO cube; Elementar Analysensysteme GmbH, Langenselbold, Germany). Leaf total phosphorus (LP) and soil total phosphorus (STP) were measured by UV−2450 spectrophotometer (Shimadzu Scientific Instruments, Tokyo, Japan) using the Mo−Sb colorimetric method after HClO4−H2SO4 digestion. The content of available phosphorus (AP) in soil was determined by the sodium bicarbonate leaching and molybdenum−antimony resistance colorimetric method. The available potassium in soil (AK) was determined by the ammonium acetate extraction and flame photometer method [24]. Soil pH was determined in a solution of soil and distilled water (1:2.5, w/v) using a pH meter (Sensor, Hach, Loveland, CO, USA). Soil water content (SWC) was calculated based on the weight of soil samples before and after oven−drying at 105 °C for at least 72 h [25]. Soil ammonium nitrogen (NH4+−N) and nitrate nitrogen (NO3−N) were determined through flow injection analysis after extraction with 2 M KCl at a 1:5 soil/water ratio from fresh soils. All concentrations are expressed based on the weight of the oven−dried soil.

2.4. Data Analysis

Mean and standard deviation (SD) were used to describe all data in the statistical analysis and mean values were reported at a 95% confidence interval. Statistical analyses were performed using SPSS 26.0 (SPSS, Inc., Chicago, IL, USA). One−way analysis of variance (ANOVA) was conducted to analyze the ecological stoichiometry characteristics in the leaves and soil of different communities. Significance analysis was performed using the Tukey post−hoc test. Because the samples were only from two seasons, which are winter and spring, a paired t−test was used to analyze the seasonal dynamics of ecological stoichiometry from C. thunbergii and soil. The relationship between the foliar stoichiometric characteristics of C. thunbergii and the soil physicochemical characteristics in different plant communities was determined through Spearman’s correlation coefficient analysis at p < 0.05. Redundancy analysis (RDA) was performed by Canoco 4.5 (Microcomputer Power, Ithaca, NY, USA) with a subset of environmental variables to assess the relative impact of abiotic factors on plant leaf stoichiometry, using explanatory environmental variables (SOC, STN, STP, and their corresponding ratio, pH, SWC, AP, AK, NO3−N, and NH4+−N) as regression covariates [26,27]. De−trended correspondence analyses of the datasets were undertaken before performing RDA to ensure that gradient lengths fit a linear model. The data and Monte Carlo reduced model tests with 499 unrestricted permutations were used to statistically evaluate significance [28,29]. Conditional effects (forward selection of environmental variables) were assessed to identify the contribution of environmental factors to explain vegetation data. All columnar figures were performed using Graph Pad Prism 8.0.1 (https://www.graphpad.com) software. All data were logarithmically transformed before parameter testing and passed the homogeneity of variance test.

3. Results

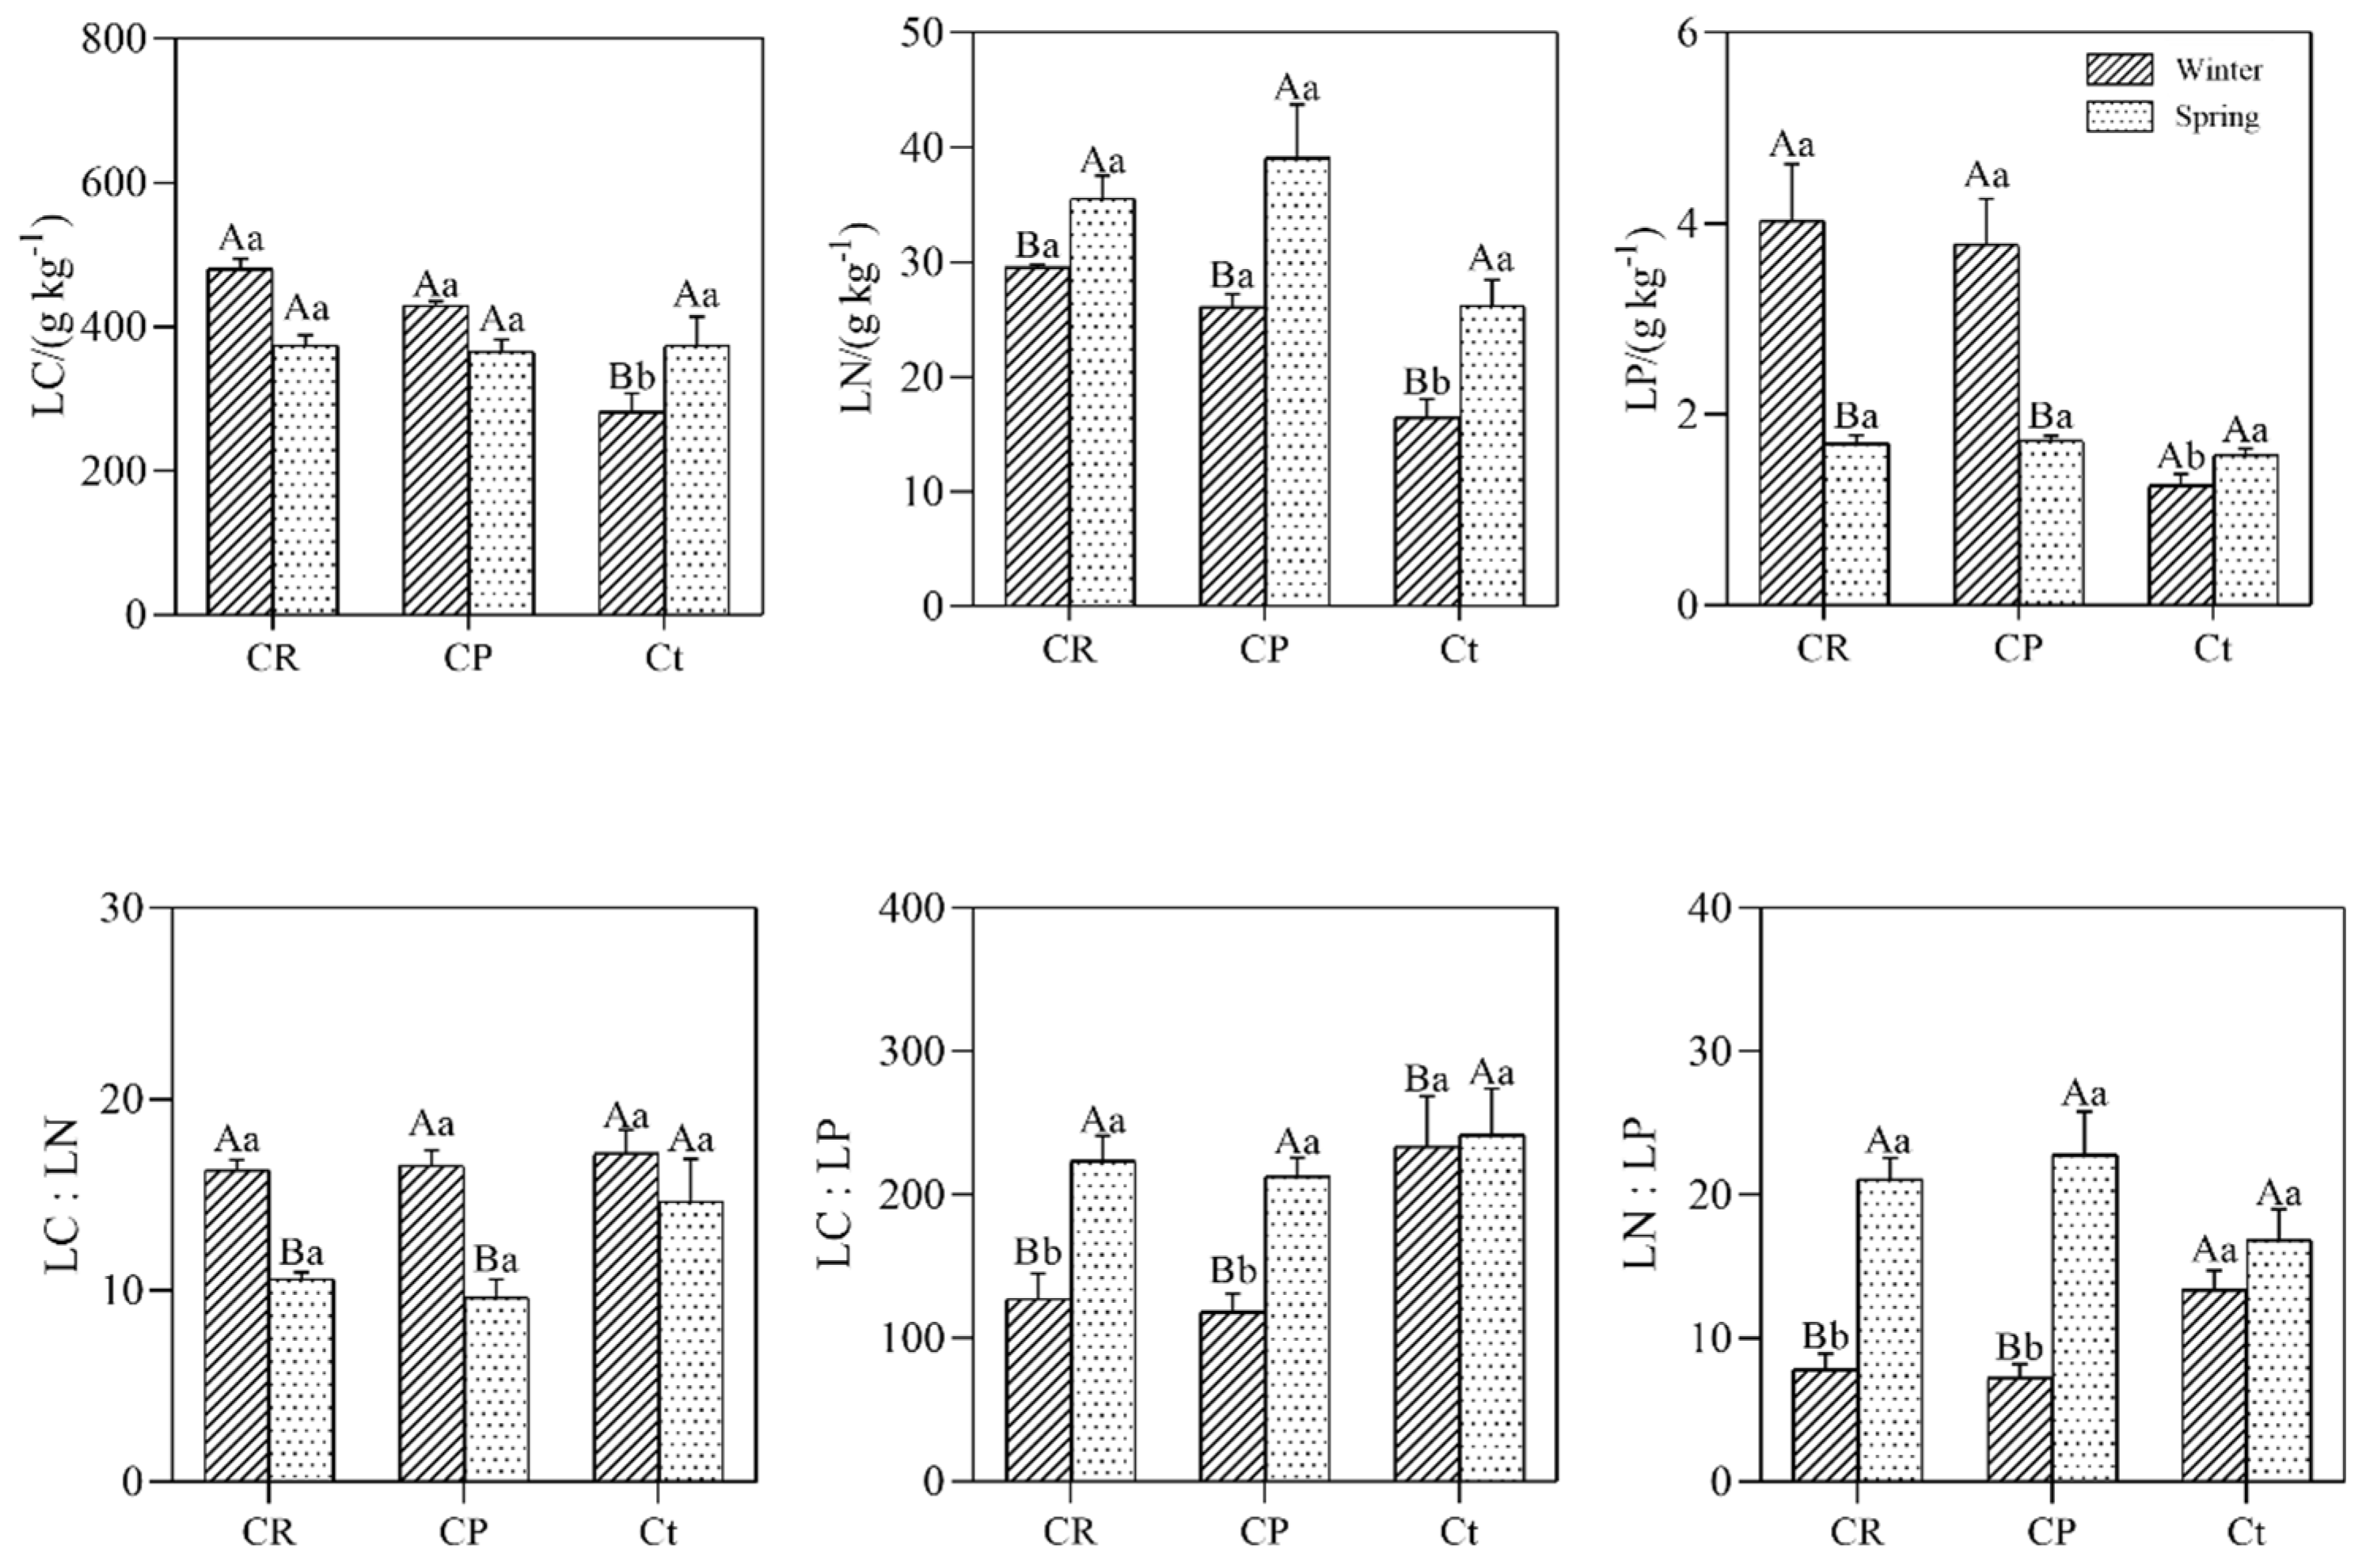
3.1. Leaf Nutrients Stoichiometry and Seasonal Variation Characteristics among Different Plant Communities

Mean values of the LC (leaf carbon), LN (leaf nitrogen), and LP (leaf phosphorus) concentrations of the C. thunbergii in the winter were 281.6 ± 26.0, 16.5 ± 1.6, and 1.25 ± 0.1 g kg−1, respectively. In the spring, the mean values of LC, LN, and LP were 374.6 ± 39.7, 26.2 ± 2.3, and 1.6 ± 0.1 g kg−1, respectively. These parameters differed significantly between the two seasons. The leaf C: N, C: P, and N: P were 17.2 ± 1.2–14.7 ± 2.2, 233.4 ± 35.6–241.8 ± 32.5, and 13.4 ± 1.4–16.9 ± 2.1, respectively. LN, C: P, and N: P both significantly increased from winter to spring, whereas LP and C: N significantly decreased from winter to spring (Figure 2). In winter, the LC, LN, and LP measured at Ct were significantly lower than those at CR and CP (p < 0.05), which were not significantly different in the spring.
Based on the data of C. thunbergii stoichiometry acquired during two seasons, Pearson correlation analysis was performed among LC, LN, LP, LC: LN, LC: LP, and LN: LP (Table 1). The analysis revealed that LN was significantly positively correlated with LN: LP and significantly negatively correlated with LC: LN (p < 0.01). LP was significantly negatively correlated to LC: LP and LN: LP, and positively correlated to LC (p < 0.01). LN: LP was negatively correlated to LC: LN and positively correlated to LC: LP (p < 0.01).

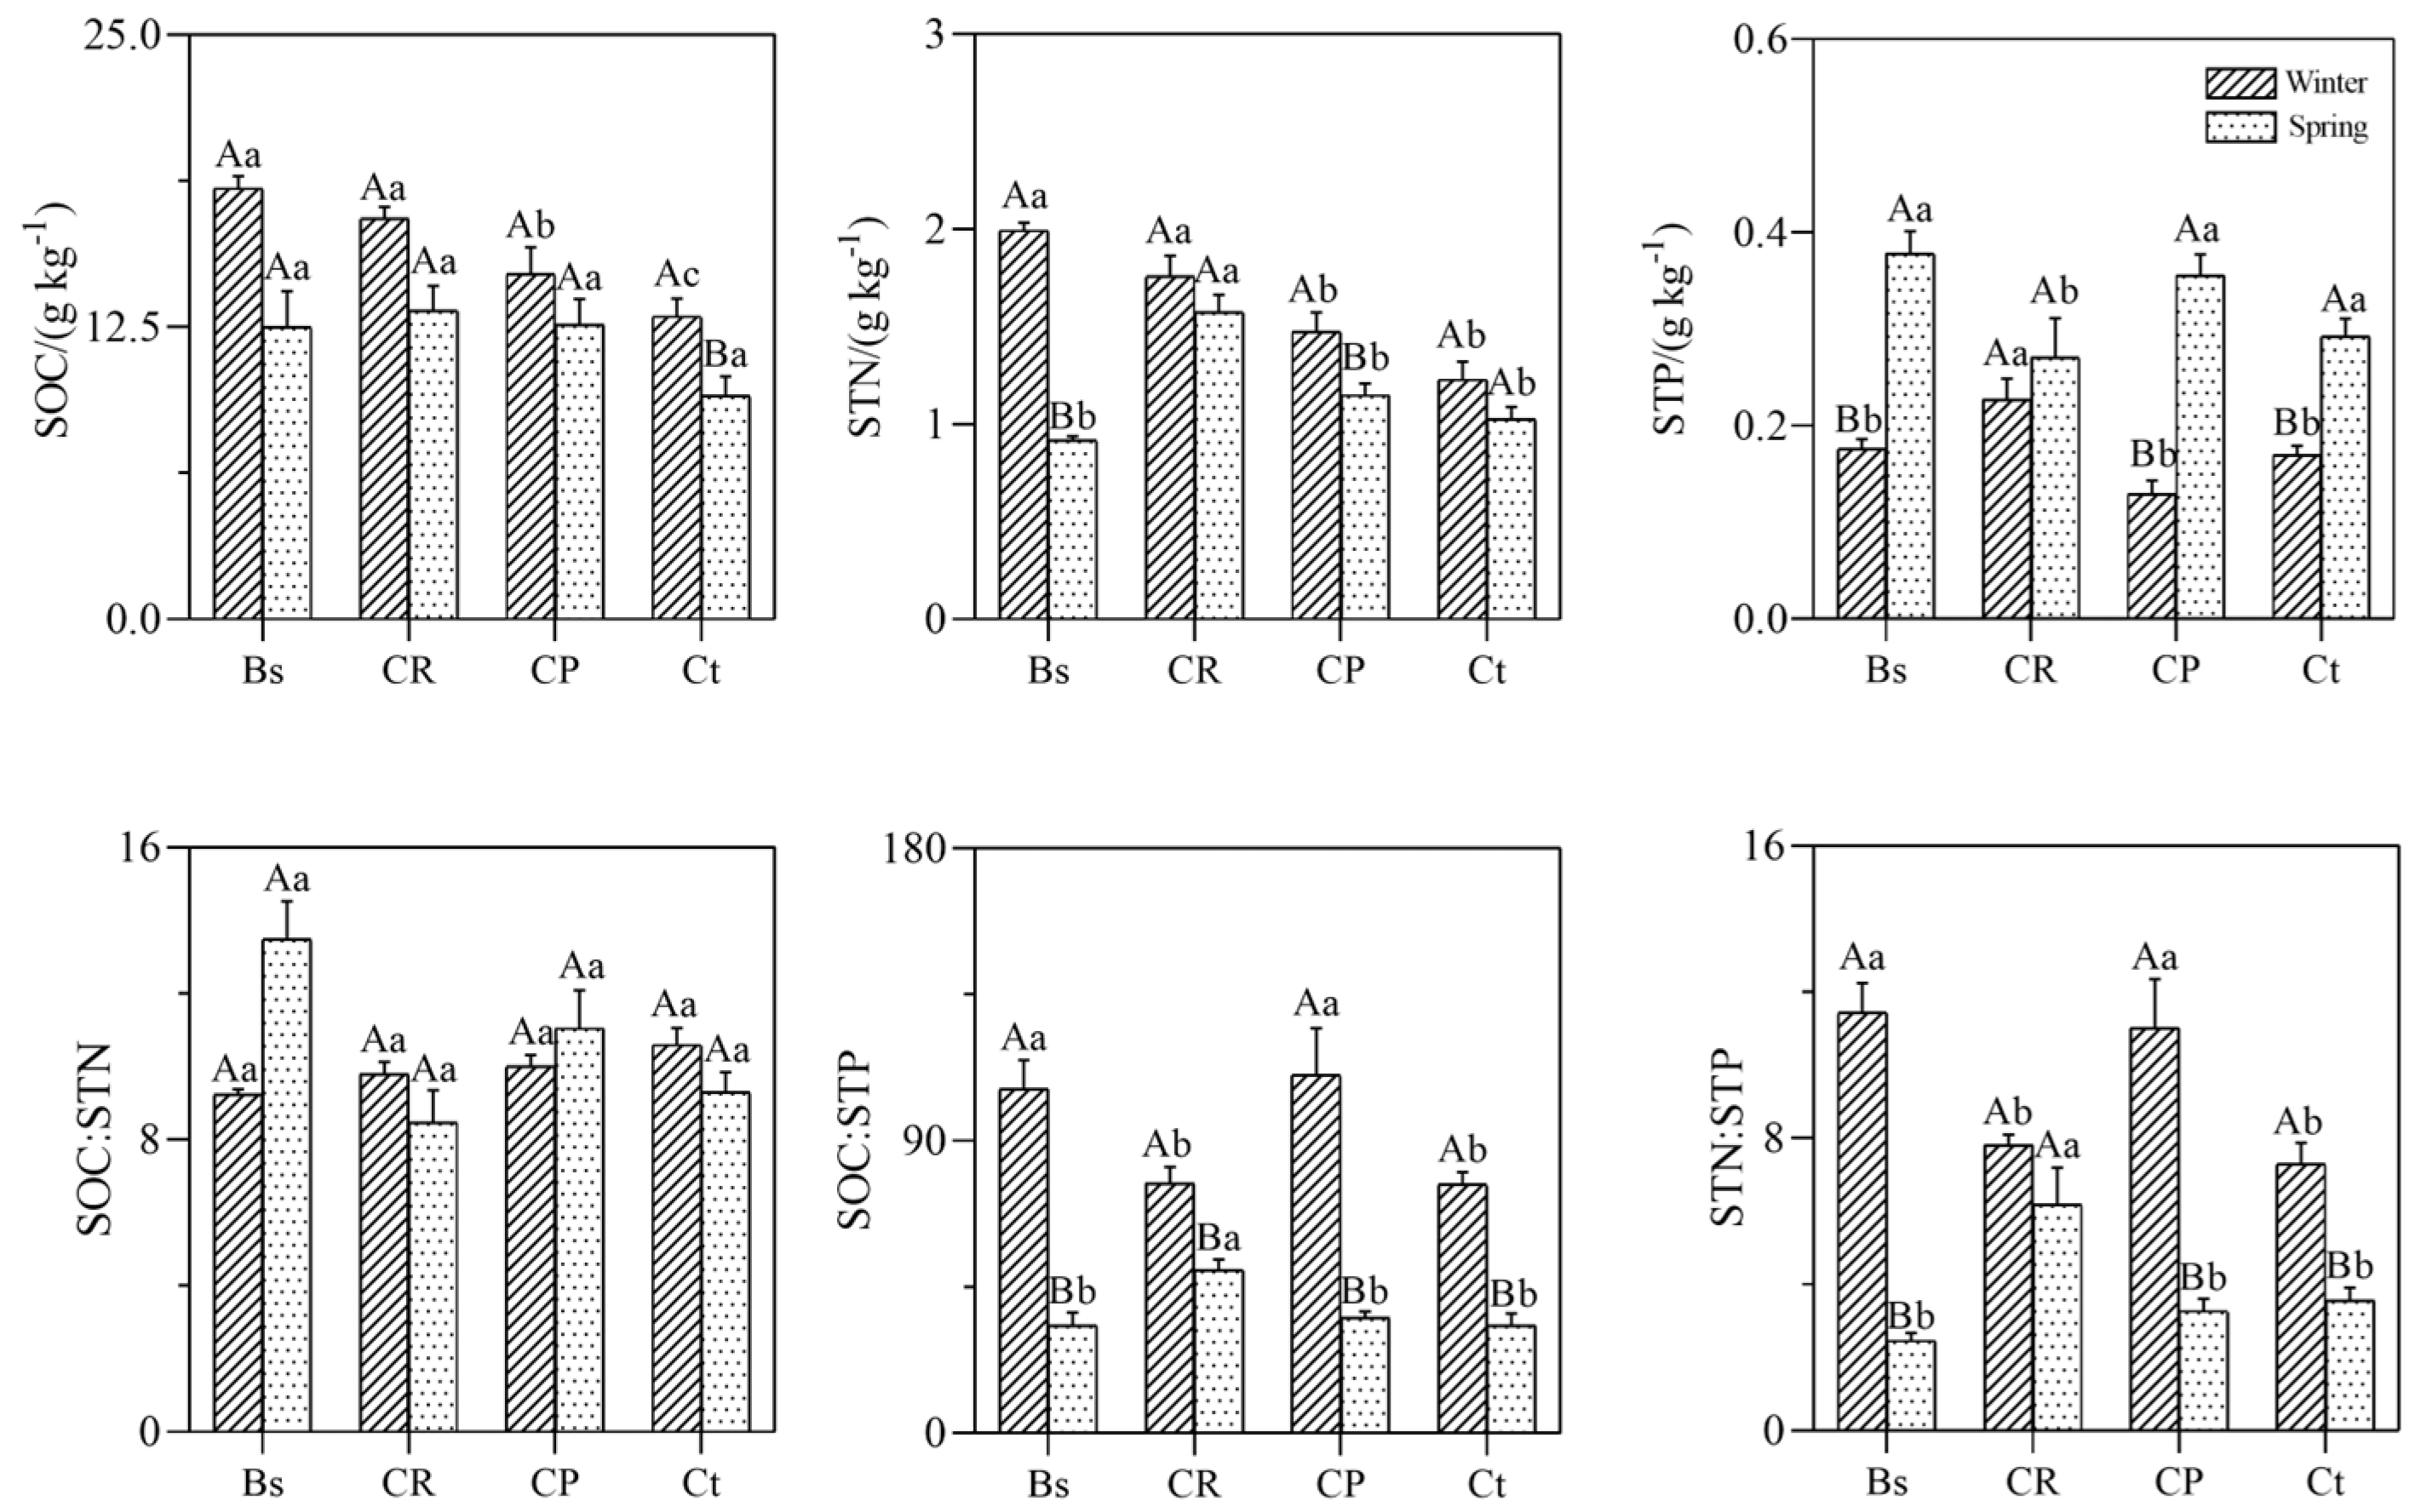
3.2. Soil Stoichiometry and Seasonal Variation Characteristics among Different Plant Communities

Different vegetation types had significantly affected SOC (soil organic carbon), STN (soil total nitrogen), and STP (soil total phosphorus) distribution and varied significantly (p < 0.05; Figure 3) along with the proportion of C. thunbergii. As illustrated in Figure 3, the concentrations of SOC, STN, and STP under different plant communities of the two seasons varied from (9.6 ± 1.7–17.1 ± 1.0 g kg−1), (1.0 ± 0.1–1.8 ± 0.2 g kg−1) and (0.1 ± 0.02–0.4 ± 0.04 g kg−1), respectively. The concentrations of SOC, STN, and STP were ranked as CR > CP > Ct in winter. Both SOC and STN decreased significantly when it turned to spring, whereas STP increased significantly under different plant communities from winter to spring and increased most in community CP.
As shown in Figure 3, the C: N, C: P, and N: P ratios of soil (SOC: STN, SOC: STP, and STN: STP) were 8.5 ± 2.8–11.1 ± 3.0, 33.2 ± 3.6–110.4 ± 7.9, and 3.3 ± 0.7–11.02 ± 3.6, respectively. In each community, the C: P and N: P ratios of soil both decreased significantly from winter to spring (p < 0.05), and their values in winter were highest in community CP (p < 0.05); in spring, the highest value was in community CR (p < 0.05). In each community, the seasonal variations the of C: N ratios of the soil were not significant (p < 0.05).

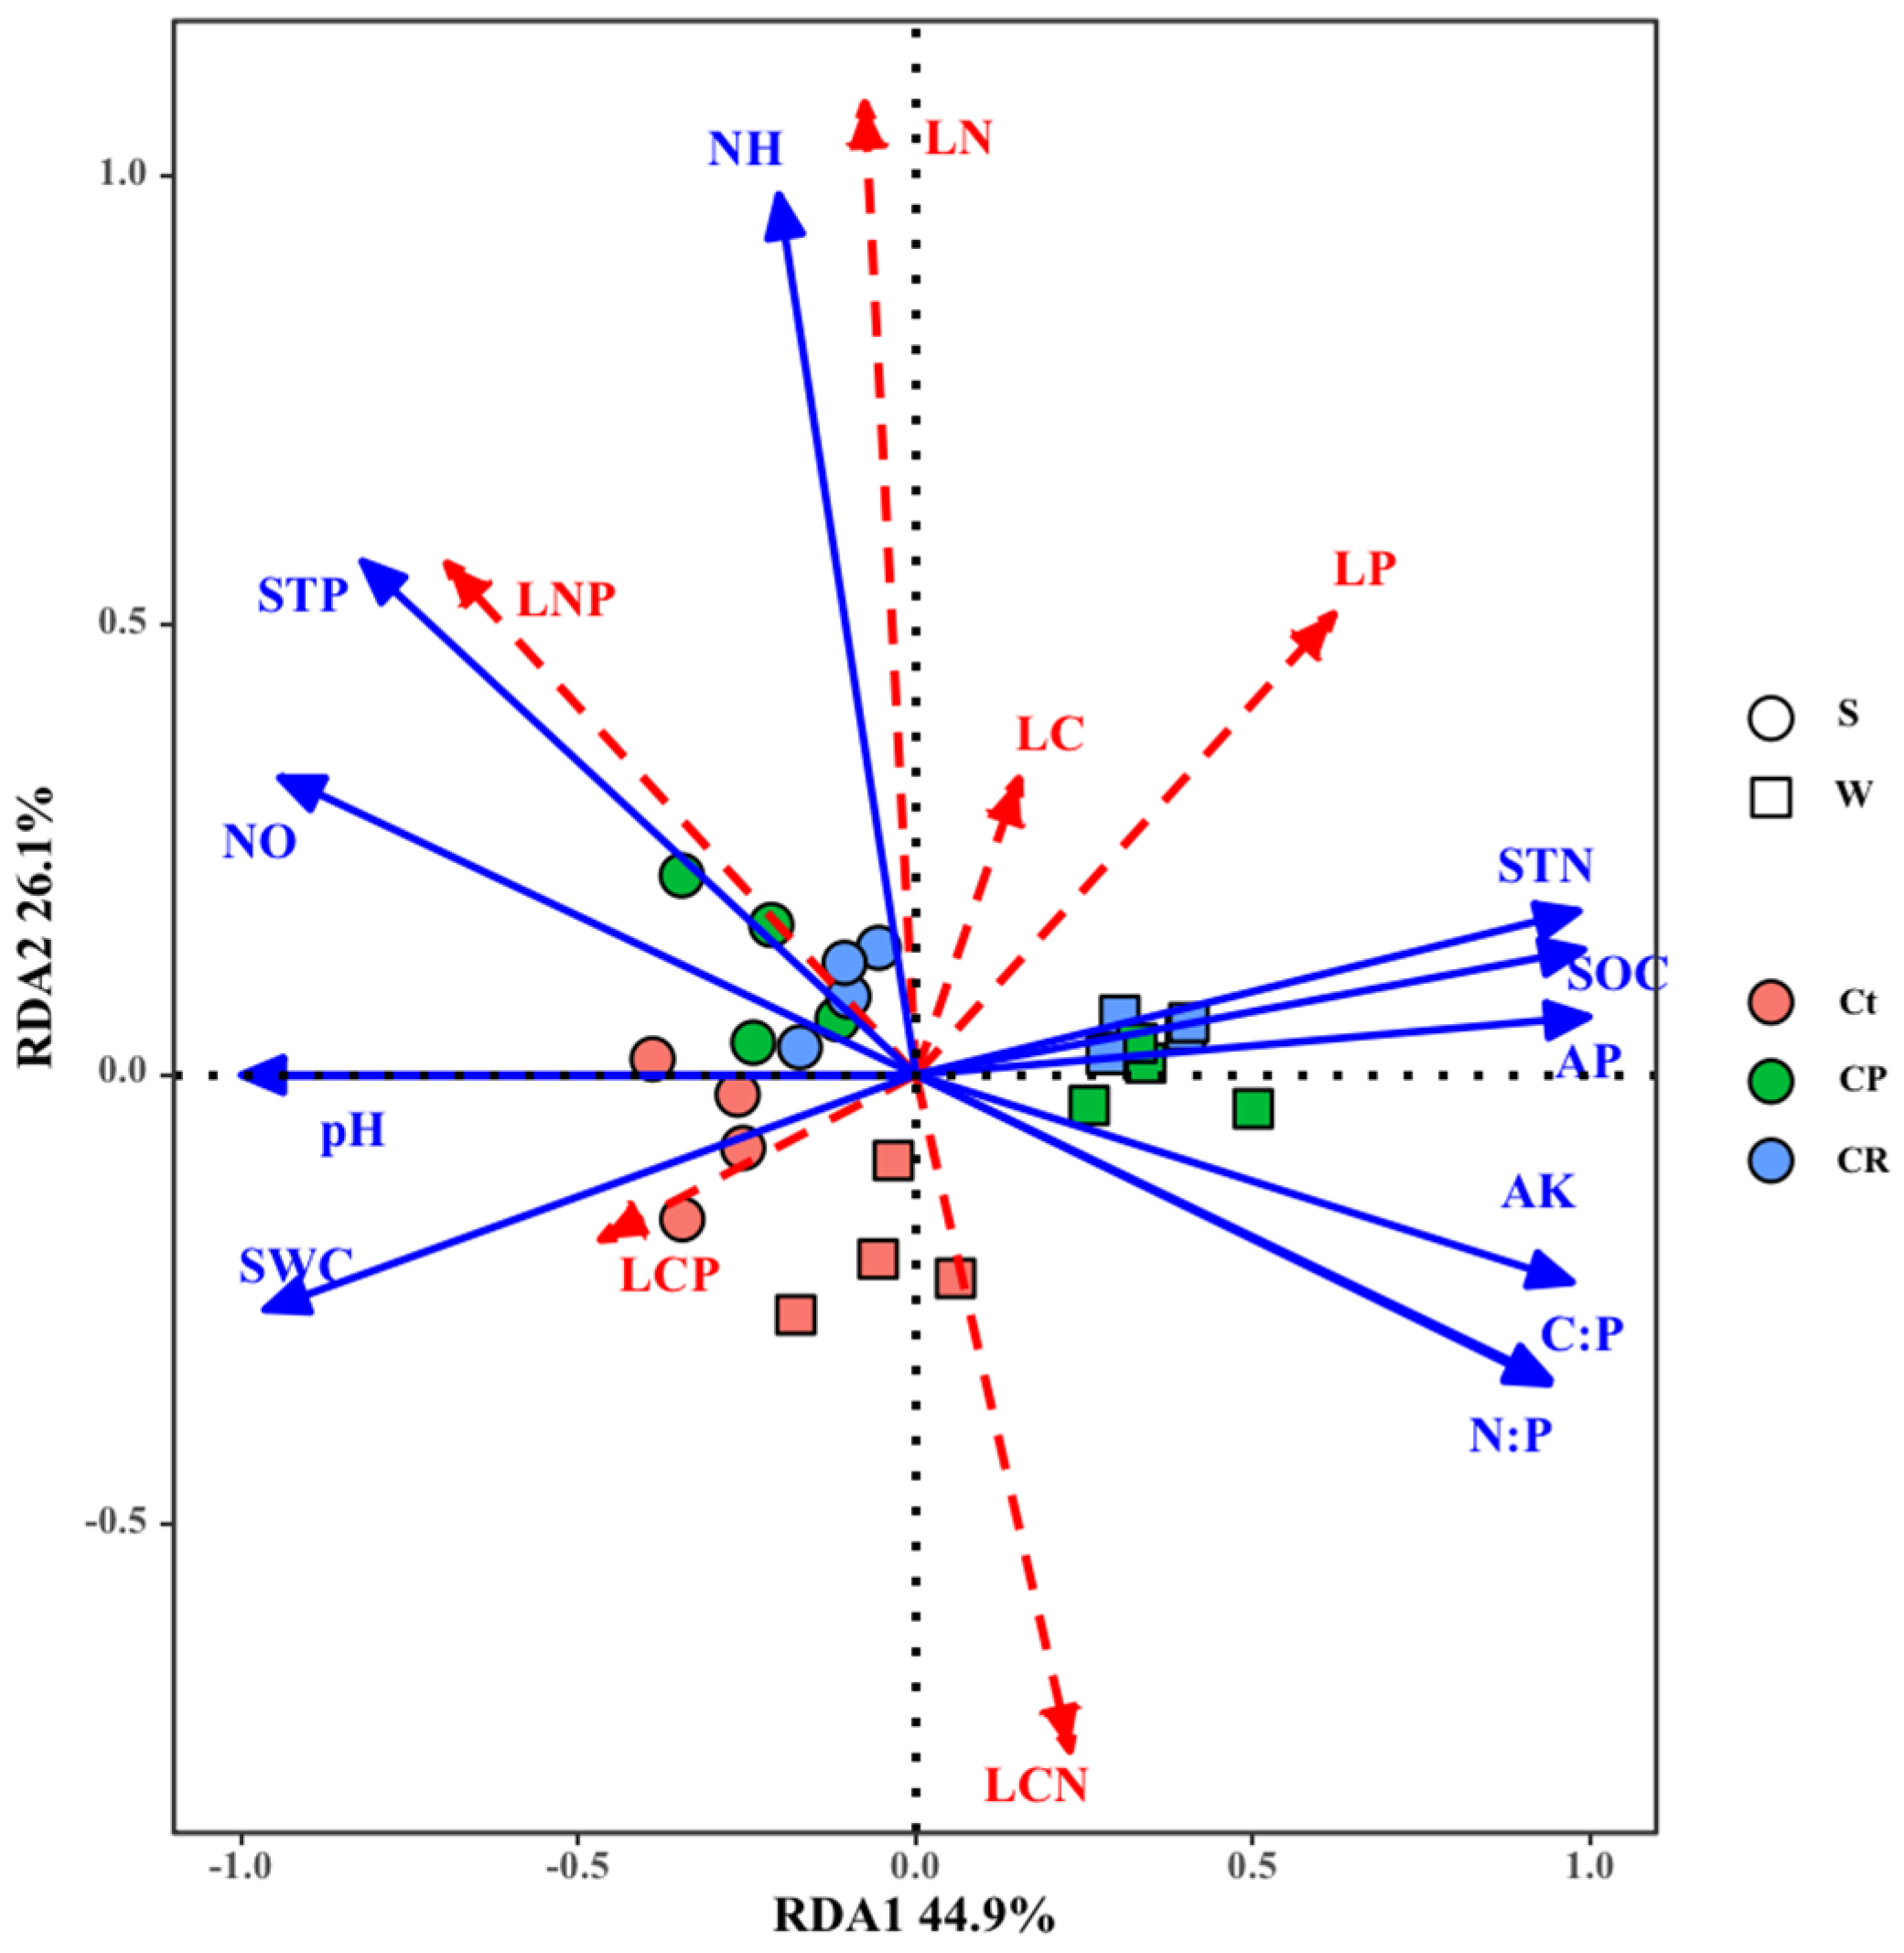
3.3. Correlations between Soil Physicochemical Properties

As shown in Table 2, there were significant correlations not only between soil ecological stoichiometry but also between soil physicochemical properties. The pH was significantly positively correlated to SWC (soil water content), NO3−N (soil nitrate nitrogen), and STP, but negatively correlated to AP (available phosphorus) and AK (available K) (p < 0.01). SWC was significantly positively correlated to pH and NO3−N, and negatively correlated to AP and SOC (p < 0.01). NO3−N was significantly positively correlated to STP, and negatively correlated to AK and SOC (p < 0.01). NH4+−N was significantly positively correlated to NO3−N and STP (p < 0.01). SOC was positively related to AP and STN (p < 0.01). SOC: STP was significantly positively correlated to AP, AK, SOC, STN, and STN: STP (p < 0.01), but negatively related to pH, SWC, NO3N, and STP (p < 0.01). STN: STP was significantly positively correlated to AK, SOC, STN, and SOC: STP, but negatively related to SWC, NO3−N, and STP (p < 0.01).

3.4. Correlations between Soil Physicochemical Properties and Leaf Stoichiometry

The redundancy analysis (RDA) showed that there were significant relationships between soil properties (pH, SWC, AK, AP, NO3−N, NH4+−N, SOC, STN, STP, SOC: STN, SOC: STP, and STN: STP) with leaf stoichiometry (LC, LN, LP, LC: LN, LC: LP, and LN: LP) (Figure 4). According to the Monte Carlo permutation test, the soil properties significantly explained the variation along the first ordination axis (p = 0.002) and the total variance (p = 0.002). The eigenvalue of the first axis was 0.449 and that of the second axis was 0.261. The first axis of RDA ordination was mainly related to NO3−N, STP, SWC, STN, SOC, AP, AK, CP, NP, and pH. The second axis was primarily related to NH4+−N. The conditional effects indicated that STP (p < 0.05), NH4+−N (p < 0.05), NO3−N (p < 0.05), AK (p < 0.05), pH (p < 0.01), and SWC (p < 0.01) were significant in the total explanatory variables during the forward selection, and the contributions of the remaining variables were not significant (Table 3). These six factors accounted for 56.95% of the total variance explained by soil properties (Table 3).
The correlations of leaf stoichiometry and soil properties in winter and spring are shown in Table 4 and Table 5. There were some similarities both in winter and spring. SWC was significantly positively correlated with LC and LN (p < 0.05); NH4+−N was significantly positively correlated with LC, LN, and LP (p < 0.01); SOC was significantly positively correlated with LC and LP (p < 0.05); and SOC: STN was significantly negatively correlated with LC (p < 0.05). There were also differences between the seasons. There was a significant positive correlation in winter (p < 0.05) but a significant negative correlation (p < 0.01) in spring between pH with LC: LP and LN: LP. There was a significant negative correlation in winter (p < 0.05) but a significant positive correlation in spring (p < 0.01) between SOC and LC: LP.

4. Discussion

4.1. Patterns and Seasonal Variation in Leaf C, N, and P Stoichiometry

The elemental nutrient concentrations in plant leaves were frequently affected by the structural characteristics and growth rate of their plant species [30,31]. The growing season of C. thunbergii in Shengjin Lake began in November and they grew slowly at low temperatures. From March to April, C. thunbergii entered their fast−growing season. Due to the changing growth rates of plants across seasons, the balance between the uptake and utilization efficiency of these elements varied significantly with seasons to meet nutrient needs under varying growth rates [32]. In this study, the C and N contents of C. thunbergii peaked in spring in different communities, while the LP contents of C. thunbergii in the Ct community decreased significantly in spring as compared to winter. LC concentrations are determined by the relatively stable photosynthetic ability of plants. C. thunbergii usually sprouts new ramets in February and accumulates nutrients rapidly through photosynthesis by fixing LC and synthesizing organic substances [33,34]. At the same time, it triggers the transport of stored functional compounds to newly developed tissues [22]; therefore, in spring, their LC and LN reach high levels to promote photosynthesis for growth recovery and to ensure that the plants can produce more storage components for survival in the flooded stage. Generally, the concentration of LP was positively related to N, because the two elements function together as basic elements in many key physiological processes, such as energy storage, transportation, mineral absorption, light capture, and photosynthesis [35]. LP is absorbed from the soil, so is easily influenced by the external environment [22,36]. RDA analysis showed that LP was related to AP, SOC, STN, and NH4+−N. Our study results showed that more LN was allocated to C. thunbergii (Figure 2), which could be for several reasons: the increased chlorophyll and enzyme content induced by warmer and lighter environments [37]; the strong root system of C. thunbergii having a stronger root nutrient−uptake capability [38]; more available nitrogen in the soil, such as NH4+−N (Table 6); enhanced photosynthetic efficiency, and so on [39]. Leaf nutrient concentration usually decreases with increasing plant biomass due to the dilution effect [40]; that is, nutrients become diluted in the plant bodies along with the rapid increase of biomass [22,38]. Thus, the dynamics of C. thunbergii foliar LP concentrations in community CR and CP may be consistent with the plant’s growth rhythm.

4.2. Soil Stoichiometry Patterns and the Relation with Soil Physicochemical Properties

The soil C, N, and P are important structural and nutrient elements in soil, and their ecological stoichiometric characteristics play an important role in the exploring material cycle, multi−element balance, and nutrient limitations of an ecosystem [41]. The SOC and STN showed a highly synergistic relationship (p < 0.01; Table 2), indicating that the C and N sources of wetland soil are consistent and mainly come from biocenosis [42]. Soil C: N is an important index used to evaluate whether soil N mineralization capacity and organic matter decomposition capacity will be limited by soil N. The results of C: N < 25 (9.24 ± 0.28–13.74 ± 3.95; Figure 3) indicate that soil organic matter has a high degree of humification, readily facilitates the mineralization of organic matter, and increases soil available nitrogen, and that the decomposition of organic matter is not limited by N. The correlation between SOC: STP and STN: STP showed a profound positive correlation (p < 0.01; Table 2), indicating that the C, N, and P metabolism of wetland soil has a very close relationship [42].
Our study indicates that soil physicochemical properties have a significant effect on the soil’s C: N: P stoichiometric characteristics among the studied plant communities. Soil pH is one of the most important factors affecting soil fertility and microbial activities. It can directly affect the existing forms and transformation modes of C, N, and P and have a certain impact on the availability of soil nutrient elements [43]. The negative correlation between STP and pH may be because pH is an important factor affecting phosphorus release [44]. A significant negative correlation between pH with SOC, STN, SOC: STP, and STN: STP (p < 0.01; Table 2) was observed. This is consistent with the work reported by Lu et al. [45] and may indicate that high pH values in the soil can restrain the decomposition of STN [39,40]. Higher soil pH generally indicates a higher availability of nutrients held in soil organic matter and lower costs of plant N acquisition when maintaining photosynthesis rate [46].
AP in soil is a part of the soil’s available phosphorus storage and can be directly absorbed and utilized by plants; it is also an important index to evaluate the phosphorus level provided by soil [47]. The highest nutrient concentrations of SOC and STN were observed in community CR both in winter and spring except for the community of bare soil; this may be related to AP (available phosphorus), which showed a positive relation with SOC, SOC: STP, and STN: STP (p < 0.05; Table 2).

4.3. Correlations between Soil Stoichiometry and Plant Stoichiometry

The relationship between soil stoichiometry and plant growth varies depending on nutrient conditions [48,49]. From winter to spring, the SOC and STN decreased in each community and the difference in the amount between the two growing seasons was measured most in community Bs (Bare soil), and least at community Ct (95% C. thunbergii cover). This may be due to the sedimentation and carbon sequestration of wetland vegetation [50]; in particular, the huge amount of prostrate underground stem vegetative reproduction of C. thunbergii and ground vegetation that has stopped growing in winter. High SOC: STP and STN: STP were both found in community CP (with 45% C. thunbergii + 45% Phalaris arundinacea cover) except for the community of bare soil (p < 0.05; Figure 3). This may be concerning their restoring duration, and the plant type or species may be the main factors affecting SOC: STP and STN: STP [51,52].
Soil physicochemical properties play an important role in plant growth and distribution as well as being the main source of determining the plant nutrient concentrations [25,53]. N is an essential macronutrient that impacts plant growth and development [54,55,56,57,58], and nitrate is one of the most abundant N sources in the soil [59,60]. All plants utilize nitrogen (N) in the form of NO3 and NH4+. It is the most imperative element for proper growth and development of plants, and significantly increases and enhances plant yield and quality by playing a vital role in biochemical and physiological plant processes [61]. Photosynthesis involves nitrogen assimilation via the reduction of NO3 and NH4 into amino acids, which are the building block of proteins [61].
The RDA results of our study confirmed the importance of soil nutrient concentrations (e.g., total N and soil nitrate N) in determining C. thunbergii foliar stoichiometry. The limitation of N was consistent with the RDA results (Table 3), in which NO3−N and NH4+−N accounted for 68.4 of the total variances related to leaf stoichiometric. However, this is far from enough to choose it as an individual index to identify the limiting elements of plant growth, due to the complexity of ecosystem structure and function [10,62]. Thus, we should take into consideration more ecological factors like temperature, illumination, and soil conditions.

5. Conclusions

In winter, the total foliar C, N, and P concentrations decreased along with an increase in plant coverage, and this did not differ obviously in spring. The C, N, C: P, and N: P of foliage significantly increased over the season. The dynamics of C. thunbergii foliar concentrations in different vegetation communities are mostly consistent with each plant’s growth rhythm. Soil C, N, C: P, and N: P significantly decreased over the season. Both in winter and spring, soil C and soil N decreased along with the increase of plant coverage. The SOC and STN showed a highly synergistic relationship and the C, N, and P metabolisms of wetland soil have a very close relationship. Our results suggest that both plant community and soil physicochemical properties have a significant influence on plant nutrient stoichiometry. The relationship between soil stoichiometry and plant growth varies depending on nutrient conditions. Soil physicochemical properties play an important role in plant growth and distribution as well as being the main source of determining plant nutrient concentrations.
Our research revealed that the interaction between soil stoichiometry and soil physicochemical properties determines plant stoichiometry, providing a better understanding of seasonal dynamics of plant nutrients in different community conditions. Since C. thunbergii comprises one of the most ecologically important plant populations in Shengjin Lake, it is important to understand how environmental factors affect its stoichiometric characteristics at different life stages.

Author Contributions

Conceived and designed the experiments, X.Y.; funding acquisition, X.Y.; contributed the materials, X.Y.; arranged the experimental area, X.Y. and W.X.; performed the experiments, W.X. and X.W.; participated in the sampling, W.X., X.W., and Y.R.; analyzed the data, W.X. and X.W.; wrote the paper, W.X. All authors have read and agreed to the published version of the manuscript.

Funding

The research was supported by the National Natural Science Foundation of China (4220071534), the Anhui Provincial Natural Science Foundation (2208085QC69), and the Natural Science Project of Anhui Provincial Department of Education−Key project (KJ2020A0045).

Data Availability Statement

The data presented in this study are available on request from the corresponding author.

Conflicts of Interest

The authors declare no conflicts of interest.

References

  1. Demars, B.O.L.; Edwards, A.C. Tissue nutrient concentrations in freshwater aquatic macrophytes: High inter-taxon differences and low phenotypic response to nutrient supply. Freshw. Biol. 2007, 52, 2073–2086. [Google Scholar] [CrossRef]
  2. Yu, M.-F.; Tao, Y.; Liu, W.; Xing, W.; Liu, G.; Wang, L.; Ma, L. C, N, and P stoichiometry and their interaction with different plant communities and soils in subtropical riparian wetlands. Environ. Sci. Pollut. Res. 2019, 27, 1024–1034. [Google Scholar] [CrossRef]
  3. Tockner, K.; Stanford, J.A. Riverine flood plains: Present state and future trends. Environ. Conserv. 2002, 29, 308–330. [Google Scholar] [CrossRef]
  4. Strayer, D.L.; Findlay, S.E.G. Ecology of freshwater shore zones. Aquat. Sci. 2010, 72, 127–163. [Google Scholar] [CrossRef]
  5. Bedford, B.L.; Walbridge, M.R.; Aldous, A. Patterns in Nutrient Availability and Plant Diversity of Temperate North American Wetlands. Ecology 1999, 80, 2151–2169. [Google Scholar] [CrossRef]
  6. Hu, Y.; Wang, L.; Tang, Y.; Li, Y.; Chen, J.; Xi, X.; Zhang, Y.; Fu, X.; Wu, J.; Sun, Y. Variability in soil microbial community and activity between coastal and riparian wetlands in the Yangtze River estuary—Potential impacts on carbon sequestration. Soil Biol. Biochem. 2014, 70, 221–228. [Google Scholar] [CrossRef]
  7. Bernot, R.J.; Poulin, R. Ecological Stoichiometry for Parasitologists. Trends Parasitol. 2018, 34, 928–933. [Google Scholar] [CrossRef]
  8. Sardans, J.; Rivas−Ubach, A.; Peñuelas, J. The elemental stoichiometry of aquatic and terrestrial ecosystems and its relationships with organismic lifestyle and ecosystem structure and function: A review and perspectives. Biogeochemistry 2011, 111, 1–39. [Google Scholar] [CrossRef]
  9. Koerselman, W.; Meuleman, A.F.M. The Vegetation N:P Ratio: A New Tool to Detect the Nature of Nutrient Limitation. J. Appl. Ecol. 1996, 33, 1441–1450. [Google Scholar] [CrossRef]
  10. Gusewell, S. N:P ratios in terrestrial plants: Variation and functional significance. New Phytol 2004, 164, 243–266. [Google Scholar] [CrossRef]
  11. Venterink, H.O.; Güsewell, S. Competitive interactions between two meadow grasses under nitrogen and phosphorus limitation. Funct. Ecol. 2010, 24, 877–886. [Google Scholar] [CrossRef]
  12. Shen, R.; Lan, Z.; Chen, Y.; Leng, F.; Jin, B.; Fang, C.; Chen, J. The effects of flooding regimes and soil nutrients on lakeshore plant diversity in a pristine lake and a human managed lake in subtropical China. J. Freshw. Ecol. 2019, 34, 757–769. [Google Scholar] [CrossRef]
  13. Mao, R.; Chen, H.M.; Zhang, X.H.; Shi, F.X.; Song, C.C. Effects of P addition on plant C:N:P stoichiometry in an N−limited temperate wetland of Northeast China. Sci. Total Environ. 2016, 559, 1–6. [Google Scholar] [CrossRef]
  14. Engelhardt, K.A.; Ritchie, M.E. Effects of macrophyte species richness on wetland ecosystem functioning and services. Nature 2001, 411, 687–689. [Google Scholar] [CrossRef]
  15. Liu, F.; Liu, Y.; Wang, G.; Song, Y.; Liu, Q.; Li, D.; Mao, P.; Zhang, H. Seasonal Variations of C: N: P Stoichiometry and Their Trade−Offs in Different Organs of Suaeda salsa in Coastal Wetland of Yellow River Delta, China. PLoS ONE 2015, 10, e0138169. [Google Scholar] [CrossRef]
  16. Sato, S.; Comerford, N.B. Influence of soil pH on inorganic phosphorus sorption and desorption in a humid brazilian Ultisol. Rev. Bras. Ciência Do Solo 2005, 29, 685–694. [Google Scholar] [CrossRef]
  17. Sun, Z.; Mou, X.; Song, H.; Jiang, H. Sulfur biological cycle of the different Suaeda salsa marshes in the intertidal zone of the Yellow River estuary, China. Ecol. Eng. 2013, 53, 153–164. [Google Scholar] [CrossRef]
  18. Shang, Z.H.; Feng, Q.S.; Wu, G.L.; Ren, G.H.; Long, R.J. Grasslandification has significant impacts on soil carbon, nitrogen and phosphorus of alpine wetlands on the Tibetan Plateau. Ecol. Eng. 2013, 58, 170–179. [Google Scholar] [CrossRef]
  19. Li, L.; Chang, Y.; Li, X.; Qiao, X.; Luo, Q.; Xu, Z.; Xu, Z.; Yang, X. Carbon sequestration potential of cropland reforestation on the northern slope of the Tianshan Mountains. Can. J. Soil Sci. 2016, 96, 461–471. [Google Scholar] [CrossRef]
  20. Fischer, J.M.; Reed−Andersen, T.; Klug, J.L.; Chalmers, A.G. Spatial Pattern of Localized Disturbance along a Southeastern Salt Marsh Tidal Creek. Estuaries 2000, 23, 565–571. [Google Scholar] [CrossRef]
  21. Liu, J.-j.; Zhou, Z.-z.; Tian, H.-x.; Wan, Y.; Zhao, L.-n. Vascular plant community types and flora in Shengjin Lake National Nature reserve. J. Biol. 2016, 33. [Google Scholar]
  22. Rong, Q.; Liu, J.; Cai, Y.; Lu, Z.; Zhao, Z.; Yue, W.; Xia, J. Leaf carbon, nitrogen and phosphorus stoichiometry of Tamarix chinensis in the Laizhou Bay coastal wetland, China. Ecol. Eng. 2015, 76, 57–65. [Google Scholar] [CrossRef]
  23. Zhang, H.; Wu, H.; Yu, Q.; Wang, Z.; Wei, C.; Long, M.; Kattge, J.; Smith, M.; Han, X. Sampling date, leaf age and root size: Implications for the study of plant C:N:P stoichiometry. PLoS ONE 2013, 8, e60360. [Google Scholar] [CrossRef]
  24. Bao, S.D. Soil and Agricultural Chemistry Analysis; China Agricultural Press: Beijing, China, 2000. [Google Scholar]
  25. Zhang, W.; Zhao, J.; Pan, F.; Li, D.; Chen, H.; Wang, K. Changes in nitrogen and phosphorus limitation during secondary succession in a karst region in southwest China. Plant Soil 2015, 391, 77–91. [Google Scholar] [CrossRef]
  26. Maccherini, S.; Marignani, M.; Gioria, M.; Renzi, M.; Rocchini, D.; Santi, E.; Torri, D.; Tundo, J.; Honnay, O. Determinants of plant community composition of remnant biancane badlands: A hierarchical approach to quantify species−environment relationships. Appl. Veg. Sci. 2011, 14, 378–387. [Google Scholar] [CrossRef]
  27. Yang, Y.; Liu, B.-R.; An, S.-S. Ecological stoichiometry in leaves, roots, litters and soil among different plant communities in a desertified region of Northern China. Catena 2018, 166, 328–338. [Google Scholar] [CrossRef]
  28. Yuan, Z.-Q. Factors affecting lucerne−rich vegetation under revegetation in a semi−arid environment. Ecol. Eng. 2017, 108, 249–254. [Google Scholar] [CrossRef]
  29. Sun, L.; Zhang, B.; Wang, B.; Zhang, G.; Zhang, W.; Zhang, B.; Chang, S.; Chen, T.; Liu, G. Leaf elemental stoichiometry of Tamarix Lour. species in relation to geographic, climatic, soil, and genetic components in China. Ecol. Eng. 2017, 106, 448–457. [Google Scholar] [CrossRef]
  30. Baldwin, D.S.; Rees, G.N.; Mitchell, A.M.; Watson, G.; Williams, J. The short−term effects of salinization on anaerobic nutrient cycling and microbial community structure in sediment from a freshwater wetland. Wetlands 2006, 26, 455–464. [Google Scholar] [CrossRef]
  31. Li, W.; Cao, T.; Ni, L.; Zhang, X.; Zhu, G.; Xie, P. Effects of water depth on carbon, nitrogen and phosphorus stoichiometry of five submersed macrophytes in an in situ experiment. Ecol. Eng. 2013, 61, 358–365. [Google Scholar] [CrossRef]
  32. Kerkhoff, A.J.; Fagan, W.F.; Elser, J.J.; Enquist, B.J. Phylogenetic and growth form variation in the scaling of nitrogen and phosphorus in the seed plants. Am. Nat. 2006, 168, E103–E122. [Google Scholar] [CrossRef]
  33. Li−ying, X.; Shou−biao, Z.; Shou−feng, L.; He−quan, Z. Ecological Characteristics and Dynamics of Above−Ground Nutritions of Carex Thunbergii Steud in Wuhu Wetland; Anhui Polytechnic University: Wuhu, China, 2015; Volume 30. [Google Scholar]
  34. Zhang, J.; Zhao, N.; Liu, C.; Yang, H.; Li, M.; Yu, G.; Wilcox, K.; Yu, Q.; He, N.; Niu, S. C:N:P stoichiometry in China’s forests: From organs to ecosystems. Funct. Ecol. 2017, 32, 50–60. [Google Scholar] [CrossRef]
  35. Reich, P.B.; Oleksyn, J.; Wright, I.J.; Niklas, K.J.; Hedin, L.; Elser, J.J. Evidence of a general 2/3−power law of scaling leaf nitrogen to phosphorus among major plant groups and biomes. Proc. Biol. Sci. 2010, 277, 877–883. [Google Scholar] [CrossRef]
  36. Berman−Frank, I.; Dubinsky, Z. Balanced Growth in Aquatic Plants: Myth or Reality? Phytoplankton use the imbalance between carbon assimilation and biomass production to their strategic advantage. BioScience 1999, 49, 29–37. [Google Scholar] [CrossRef]
  37. Feng, Y.L. Photosynthesis, nitrogen allocation and specific leaf area in invasive Eupatorium adenophorum and native Eupatorium japonicum grown at different irradiances. Physiol. Plant. 2008, 133, 318–326. [Google Scholar] [CrossRef] [PubMed]
  38. Saibo, Y.; Zhendong, Y.; Xueqin, L.; Hongzhu, W. Water level requirements of a Carex hygrophyte in Yangtze floodplain lakes. Ecol. Eng. 2019, 129, 29–37. [Google Scholar] [CrossRef]
  39. Galmes, J.; Flexas, J.; Keys, A.J.; Cifre, J.; Mitchell, R.A.C.; Madgwick, P.J.; Haslam, R.P.; Medrano, H.; Parry, M.A.J. Rubisco specificity factor tends to be larger in plant species from drier habitats and in species with persistent leaves. Plant Cell Environ. 2005, 28, 571–579. [Google Scholar] [CrossRef]
  40. Barbosa, E.R.; Tomlinson, K.W.; Carvalheiro, L.G.; Kirkman, K.; de Bie, S.; Prins, H.H.; van Langevelde, F. Short−term effect of nutrient availability and rainfall distribution on biomass production and leaf nutrient content of savanna tree species. PLoS ONE. 2014, 9, e92619. [Google Scholar] [CrossRef]
  41. Jin−Sheng, H.; Xing−Guo, H. Ecological stoichiometry: Searching for unifying principles from individuals to ecosystems. Chin. J. Plant Ecol. 2010, 34, 2–6. [Google Scholar]
  42. Rong, Y.; Na, S.; Liang, S.; Haijun, S.; Yonghong, L.; Yongsheng, G. Ecological stoichiometry characteristics of soil carbon, nitrogen and phosphorus of the Yellow River wetland in Baotou, Inner Mongolia. Acta Ecol. Sin. 2020, 40. [Google Scholar]
  43. Jian, Z.; Li, S.; Liping, W.; Yalan, B.; Jingwen, L.; Xueli, G.; Tao, C.; Jianjun, C. The effect of vegetation cover on ecological stoichiometric ratios of soil carbon, nitrogen and phosphorus: A case study of the Dunhuang Yangguan wetland. Acta Ecol. Sin. 2019, 39, 580–589. [Google Scholar] [CrossRef]
  44. Gao, Z.; Fang, H.; Bai, J.; Jia, J.; Lu, Q.; Wang, J.; Chen, B. Spatial and seasonal distributions of soil phosphorus in a short−term flooding wetland of the Yellow River Estuary, China. Ecol. Inform. 2016, 31, 83–90. [Google Scholar] [CrossRef]
  45. Lu, Q.; Bai, J.; Zhang, G.; Zhao, Q.; Wu, J. Spatial and seasonal distribution of carbon, nitrogen, phosphorus, and sulfur and their ecological stoichiometry in wetland soils along a water and salt gradient in the Yellow River Delta, China. Phys. Chem. Earth Parts A/B/C 2018, 104, 9–17. [Google Scholar] [CrossRef]
  46. Maire, V.; Wright, I.J.; Prentice, I.C.; Batjes, N.H.; Bhaskar, R.; van Bodegom, P.M.; Cornwell, W.K.; Ellsworth, D.; Niinemets, Ü.; Ordonez, A.; et al. Global effects of soil and climate on leaf photosynthetic traits and rates. Glob. Ecol. Biogeogr. 2015, 24, 706–717. [Google Scholar] [CrossRef]
  47. Xian−xiang, L.; Meng, D.; Qin, Y. Dynamic Distribution and Influence Factors of Soil Phosphorus in Yellow River Estuary Wetland. J. Soil Water Conserv. 2011, 5, 034. [Google Scholar]
  48. Matzek, V.; Vitousek, P.M. N:P stoichiometry and protein:RNA ratios in vascular plants: An evaluation of the growth−rate hypothesis. Ecol. Lett. 2009, 12, 765–771. [Google Scholar] [CrossRef]
  49. Yu, Q.; Wu, H.; He, N.; Lu, X.; Wang, Z.; Elser, J.J.; Wu, J.; Han, X. Testing the growth rate hypothesis in vascular plants with above− and below−ground biomass. PLoS ONE 2012, 7, e32162. [Google Scholar] [CrossRef]
  50. Craft, C.B. Dynamics of nitrogen and phosphorus retention during wetland ecosystem succession. Wetl. Ecol. Manag. 1997, 4, 177–187. [Google Scholar] [CrossRef]
  51. Gao, Y.; Yu, G.; He, N. Equilibration of the terrestrial water, nitrogen, and carbon cycles: Advocating a health threshold for carbon storage. Ecol. Eng. 2013, 57, 366–374. [Google Scholar] [CrossRef]
  52. Mi, Z.; Huang, Y.; Gan, H.; Zhou, W.; Flynn, D.F.; He, J.S. Leaf P increase outpaces leaf N in an Inner Mongolia grassland over 27 years. Biol. Lett. 2015, 11, 20140981. [Google Scholar] [CrossRef]
  53. Li, L.; Zerbe, S.; Han, W.; Thevs, N.; Li, W.; He, P.; Schmitt, A.O.; Liu, Y.; Ji, C. Nitrogen and phosphorus stoichiometry of common reed (Phragmites australis) and its relationship to nutrient availability in northern China. Aquat. Bot. 2014, 112, 84–90. [Google Scholar] [CrossRef]
  54. Hirel, B.; Le Gouis, J.; Ney, B.; Gallais, A. The challenge of improving nitrogen use efficiency in crop plants: Towards a more central role for genetic variability and quantitative genetics within integrated approaches. J. Exp. Bot. 2007, 58, 2369–2387. [Google Scholar] [CrossRef] [PubMed]
  55. Wang, Y.Y.; Hsu, P.K.; Tsay, Y.F. Uptake, allocation and signaling of nitrate. Trends Plant Sci. 2012, 17, 458–467. [Google Scholar] [CrossRef]
  56. Krapp, A.; David, L.C.; Chardin, C.; Girin, T.; Marmagne, A.; Leprince, A.S.; Chaillou, S.; Ferrario−Mery, S.; Meyer, C.; Daniel−Vedele, F. Nitrate transport and signalling in Arabidopsis. J. Exp. Bot. 2014, 65, 789–798. [Google Scholar] [CrossRef]
  57. Ruffel, S.; Gojon, A.; Lejay, L. Signal interactions in the regulation of root nitrate uptake. J. Exp. Bot. 2014, 65, 5509–5517. [Google Scholar] [CrossRef]
  58. Vidal, E.A.; Moyano, T.C.; Canales, J.; Gutierrez, R.A. Nitrogen control of developmental phase transitions in Arabidopsis thaliana. J. Exp. Bot. 2014, 65, 5611–5618. [Google Scholar] [CrossRef]
  59. von Wirén, N.; Gazzarrini, S.; Gojon, A.; Frommer, W.B. The molecular physiology of ammonium uptake and retrieval. Curr. Opin. Plant Biol. 2000, 3, 254–261. [Google Scholar] [CrossRef]
  60. O’Brien, J.A.; Vega, A.; Bouguyon, E.; Krouk, G.; Gojon, A.; Coruzzi, G.; Gutierrez, R.A. Nitrate Transport, Sensing, and Responses in Plants. Mol. Plant 2016, 9, 837–856. [Google Scholar] [CrossRef]
  61. Jahan, S.J.L.S.; Wahocho, N.; Laghari, G.; Laghari, A.; Bhabhan, G.; HussainTalpur, K.; Ahmed, T.; Wahocho, S.; Lashari, A. Role of Nitrogen for Plant Growth and Development: A review. Adv. Environ. Biol. 2016, 10, 209–218. [Google Scholar]
  62. Li−Xia, Z.; Yong−Fei, B.; Xing−Guo, H. Application of N:P Stoichiometry to Ecology Studies. Acta Bot. Sin. 2003, 45, 1009–1018. [Google Scholar]
Figure 1. The location of the study area. Different colors represent different plant communities. Ct, 95% C. thunbergii cover; CP, 45% C. thunbergii + 45% P. arundinacea cover; CR, 20% C. thunbergii + 10% E. dulcis + 40% R. dentatus cover; Bs, Bare soil.
Diversity 16 00198 g001
Figure 2. Ecological stoichiometry and seasonal variations of C. thunbergii in different communities. LC, leaf carbon; LN, leaf nitrogen; LP, leaf phosphorus; LC:LN, leaf C: N ratio; LC: LP leaf C: P ratio; LN: LP leaf N: P ratio. CR, 20% C. thunbergii + 10% Eleocharis dulcis + 40% Rumex dentatus cover; CP, 45% Carex thunbergii + 45% Phalaris arundinacea cover; Ct, 95% Carex thunbergia cover. The error bars show the standard deviations of the means. Different lowercase letters indicate significant differences at the 0.05 (p < 0.05) level among different communities in the same season. Different capital letters indicate significant differences at the 0.05 (p < 0.05) level among different seasons in the same communities.
Diversity 16 00198 g002
Figure 3. Soil ecological stoichiometry and seasonal variations in different communities. SOC, soil total organic carbon; STN, soil total nitrogen; STP, soil total phosphorus; SOC: STN, soil C: N ratio; SOC: STP, soil C: P ratio; STN: STP soil N: P ratio. Bs, Bare soil; CR, 20% Carex thunbergii + 10% Eleocharis dulcis + 40% Rumex dentatus cover; CP, 45% Carex thunbergii + 45% Phalaris arundinacea cover; Ct, 95% Carex thunbergia cover. The error bars show the standard deviations of the means. Different lowercase letters indicate significant differences at the 0.05 (p < 0.05) level among different communities in the same season. Different capital letters indicate significant differences at the 0.05 (p < 0.05) level among different seasons in the same communities.
Diversity 16 00198 g003
Figure 4. Ordination diagram showing the results of redundancy analysis of leaf stoichiometry and soil properties. The blue arrow shows soil properties, and the red arrow shows the plant stoichiometry. S, spring; W, winter; Ct, 95% Carex thunbergia cover; CP, 45% Carex thunbergii + 45% Phalaris arundinacea cover; CR, 20% Carex thunbergii + 10% Eleocharis dulcis + 40% Rumex dentatus cover. In the Box plot, LC, leaf carbon; LN, leaf nitrogen; LP, leaf phosphorus; LCN, leaf C: N ratio; LCP, leaf C: P ratio; LNP, leaf N: P ratio; pH, soil pH values; SWC, soil water contents; AK, soil available K; AP, available phosphorus; NO, soil nitrate nitrogen; NH, soil ammonium nitrogen; SOC, soil organic carbon; STN, soil total nitrogen; STP, soil total phosphorus; C: P, soil organic carbon: soil total phosphorus; N: P, soil total nitrogen: soil total phosphorus.
Diversity 16 00198 g004
Table 1. Pearson correlation analysis (2−tailed) results between leaf stoichiometry.
LCLNLPLC: LNLC: LPLN: LP
LC1
LN0.3361
LP0.678 **0.0181
LC: LN0.250−0.784 **0.3271
LC: LP−0.2990.037−0.834 **−0.0911
LN: LP−0.2900.639 **−0.715 **−0.731 **0.714 **1
** Correlation is significant at the 0.01 level.
Table 2. Spearman correlation analysis (2−tailed) results between soil ecological stoichiometry and soil nutrients.
PHSWCNO3−NNH4+−NAPAKSOCSTNSTPSOC: STNSOC: STPSTN: STP
PH1
SWC0.516 **1
NO3−N0.570 **0.565 **1
NH4+−N0.3090.1330.551 **1
AP−0.561 **−0.626 **−0.444 *−0.2031
AK−0.518 **−0.472 *−0.540 **−0.2770.3761
SOC−0.800 **−0.612 **−0.533 **0.0070.600 **0.460 *1
STN−0.515 *−0.501 *−0.390.1850.2330.3740.751 **1
STP0.406 *0.3960.620 **0.625 **−0.394−0.483 *−0.312−0.2771
SOC: STN−0.131−0.142−0.338−0.3040.227−0.150.17−0.117−0.2841
SOC: STP−0.625 **−0.577 **−0.745 **−0.448 *0.551 **0.558**0.654 **0.557 **−0.884 **0.3231
STN: STP−0.446 *−0.526 **−0.650 **−0.350.3780.539**0.517 **0.639 **−0.874 **0.1990.925 **1
* Correlation is significant at the 0.05 level; ** Correlation is significant at the 0.01 level.
Table 3. Conditional effects (forward selection of variables) obtained from the summary of forward selection for vegetation data explained by the soil nutrients in a redundancy analysis.
NameContribution %Pseudo−Fp
STP10.5438.890.017
NH4+−N7.178.050.01
NO3−N7.261.000.016
AK11.352.580.021
AP3.634.460.684
SOC7.015.940.363
pH10.34.910.001
SWC10.330.420.003
Bold values mean they were significant in the redundancy analysis.
Table 4. Spearman correlation analysis (2−tailed) results between soil properties and leaf stoichiometry in winter.
LCLNLPLC: LNLC: LPLN: LP
pH−0.411 −0.235 −0.569 −0.422 0.607 *0.684 *
SWC0.619 *0.717 **0.509 −0.384 −0.379 −0.288
NO3−N−0.159 −0.132 −0.104 −0.140 0.040 0.064
NH4+−N0.892 **0.910 **0.781 **−0.156 −0.608 *−0.559
AP0.356 0.350 0.220 −0.053 −0.191 −0.168
AK0.587 *0.562 0.428 −0.081 −0.310 −0.284
SOC0.627 *0.460 0.747 **0.438 −0.648 *−0.728 **
STN0.685 *0.477 0.750 **0.523 −0.612 *−0.712 **
STP−0.017 −0.038 −0.169 −0.002 0.102 0.120
SOC: STN−0.721 **−0.487 −0.528 −0.568 0.272 0.389
SOC: STP0.304 0.213 0.469 0.261 −0.390 −0.453
STN: STP0.352 0.244 0.494 0.299 −0.397 −0.467
* Correlation is significant at the 0.05 level; ** Correlation is significant at the 0.01 level.
Table 5. Spearman correlation analysis (2−tailed) results between soil properties and leaf stoichiometry in spring.
LCLNLPLC: LNLC: LPLN: LP
pH−0.707**−0.747 **−0.765 **−0.708 **−0.748 **−0.754 **
SWC0.547 *0.583 *0.671 **0.547 *0.569 *0.566 *
NO3−N−0.287−0.321−0.244−0.254−0.28−0.293
NH4+−N0.781 **0.829 **0.860 **0.762 **0.809 **0.818 **
AP0.1970.3360.1470.10.1760.231
AK−0.329−0.337−0.324−0.328−0.336−0.331
SOC−0.0610.044−0.085−0.165−0.12−0.08
STN0.516 *0.499 *0.622 *0.505 *0.505 *0.487
STP−0.425−0.483−0.399−0.462−0.510 *−0.532 *
SOC: STN−0.558 *−0.454−0.638 **−0.622 *−0.590 *−0.545 *
SOC: STP0.3320.502*0.2620.2750.3740.44
STN: STP0.2590.4020.2020.2030.2840.339
* Correlation is significant at the 0.05 level; ** Correlation is significant at the 0.01 level.
Table 6. Soil properties in different treatments in two seasons.
SeasonTypeSoil pHSWC(%)NO3−N (mg kg−1)NH4+−N (mg kg−1)AP (mg kg−1)AK (mg kg−1)
winterBs5.68 ± 0.05 Ca22.23 ± 1.00 Ac6.39 ± 0.30 Ba3.25 ± 0.43 Bd30.15 ± 7.34 Ab45.47 ± 4.90 Ba
CR5.23 ± 0.17 Bb26.17 ± 0.32 Cb4.88 ± 0.87 Ab15.83 ± 1.51 ABa34.97 ± 8.07 Aab40.79 ± 5.76 Ba
CP5.18 ± 0.39 Ab27.31 ± 0.90 ABab5.06 ± 0.67 Bb10.23 ± 1.75 Bb41.64 ± 1.94 Aa48.58 ± 7.62 Ba
Ct5.42 ± 0.16 Bab28.60 ± 1.10 Aa5.20 ± 0.63 Bb5.86 ± 0.95 Cc32.67 ± 2.52 Aab23.07 ± 7.28 Bb
springBs7.07 ± 0.46 Aa23.38 ± 0.91 Ac6.49 ± 0.06 Ba5.81 ± 0.73 Ac26.67 ± 2.92 Ab32.77 ± 3.12 Ca
CR5.63 ± 0.39 Bb29.31 ± 0.69 Bab6.44 ± 0.14 Aa20.55 ± 1.81 Aa27.26 ± 4.46 ABab22.90 ± 3.98 Bb
CP5.66 ± 0.18 Ab28.62 ± 0.92 Ab6.45 ± 0.08 Ba20.07 ± 2.83 Aa33.73 ± 5.51 Ba15.77 ± 4.97 Cc
Ct6.13 ± 0.34 Ab30.62 ± 1.52 Aa6.42 ± 0.08 ABa12.96 ± 2.54 Bb24.77 ± 4.00 Bb29.40 ± 4.52 Ba
Different lowercase letters indicate significant differences at the 0.05 (p < 0.05) level between different plant communities in the same season. Different capital letters indicate significant differences at the 0.05 (p < 0.05) level between different seasons in the same plant communities.
Disclaimer/Publisher’s Note: The statements, opinions and data contained in all publications are solely those of the individual author(s) and contributor(s) and not of MDPI and/or the editor(s). MDPI and/or the editor(s) disclaim responsibility for any injury to people or property resulting from any ideas, methods, instructions or products referred to in the content.

