
The Impact of Zoning Designations on Bird Communities: A Case Study of National Nature Reserves in Guangdong Province

 , ,
, ,
Abstract
1. Introduction
2. Materials and Methods
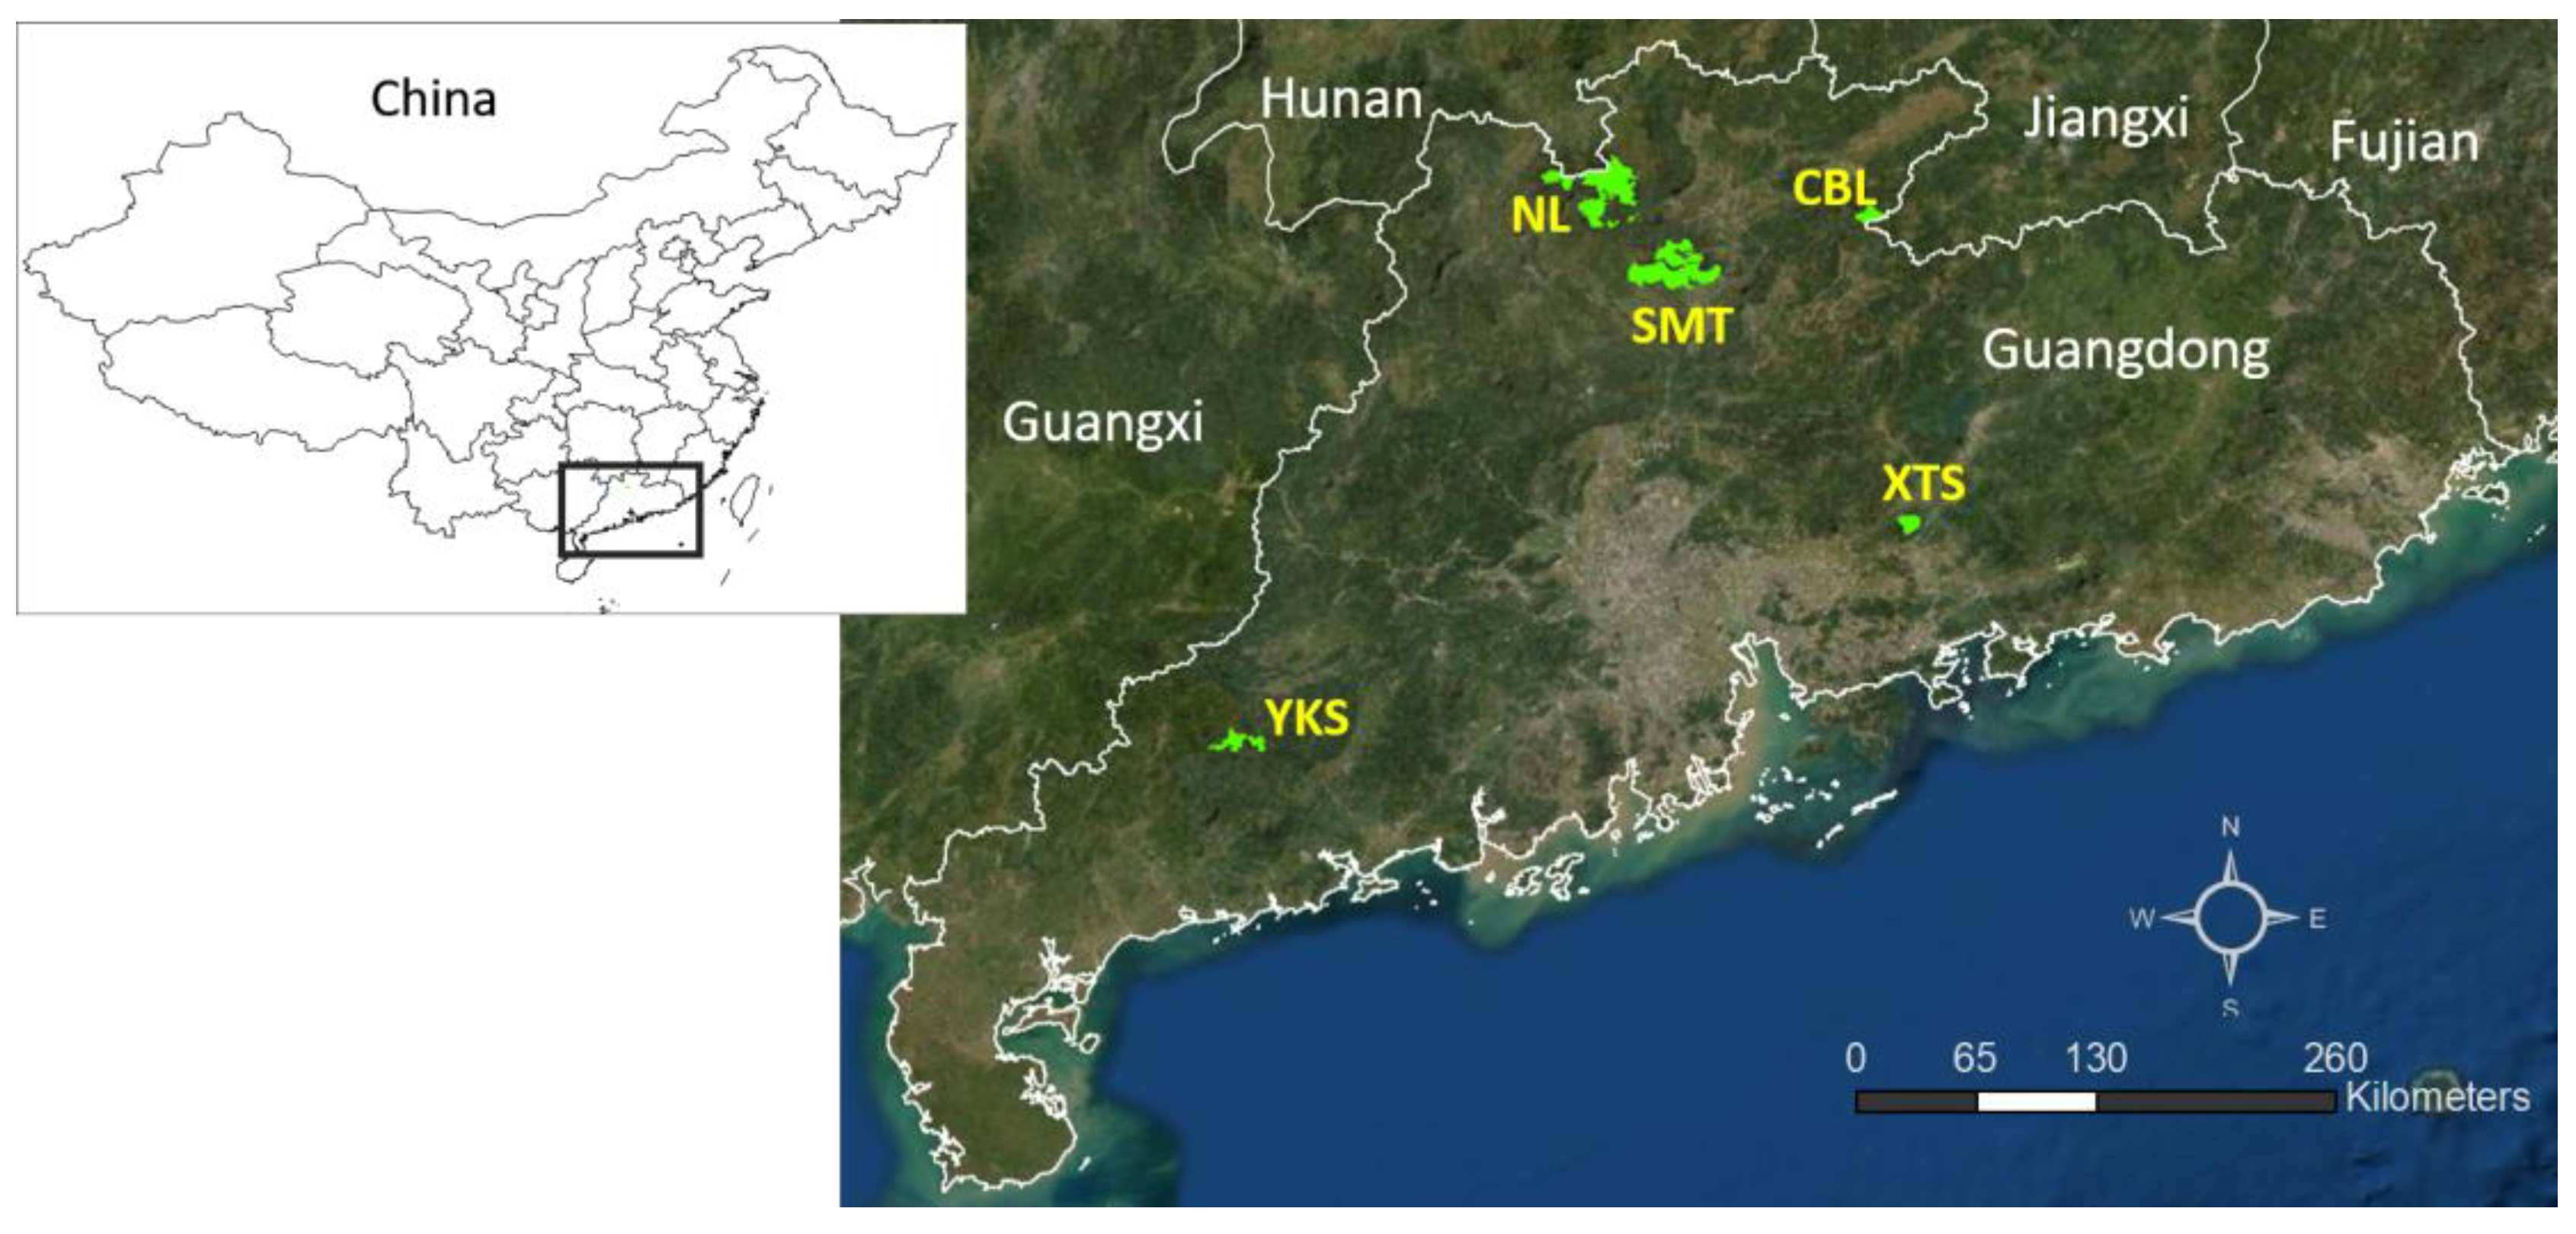
2.1. Study Sites and Bird Surveys
2.2. Analysis
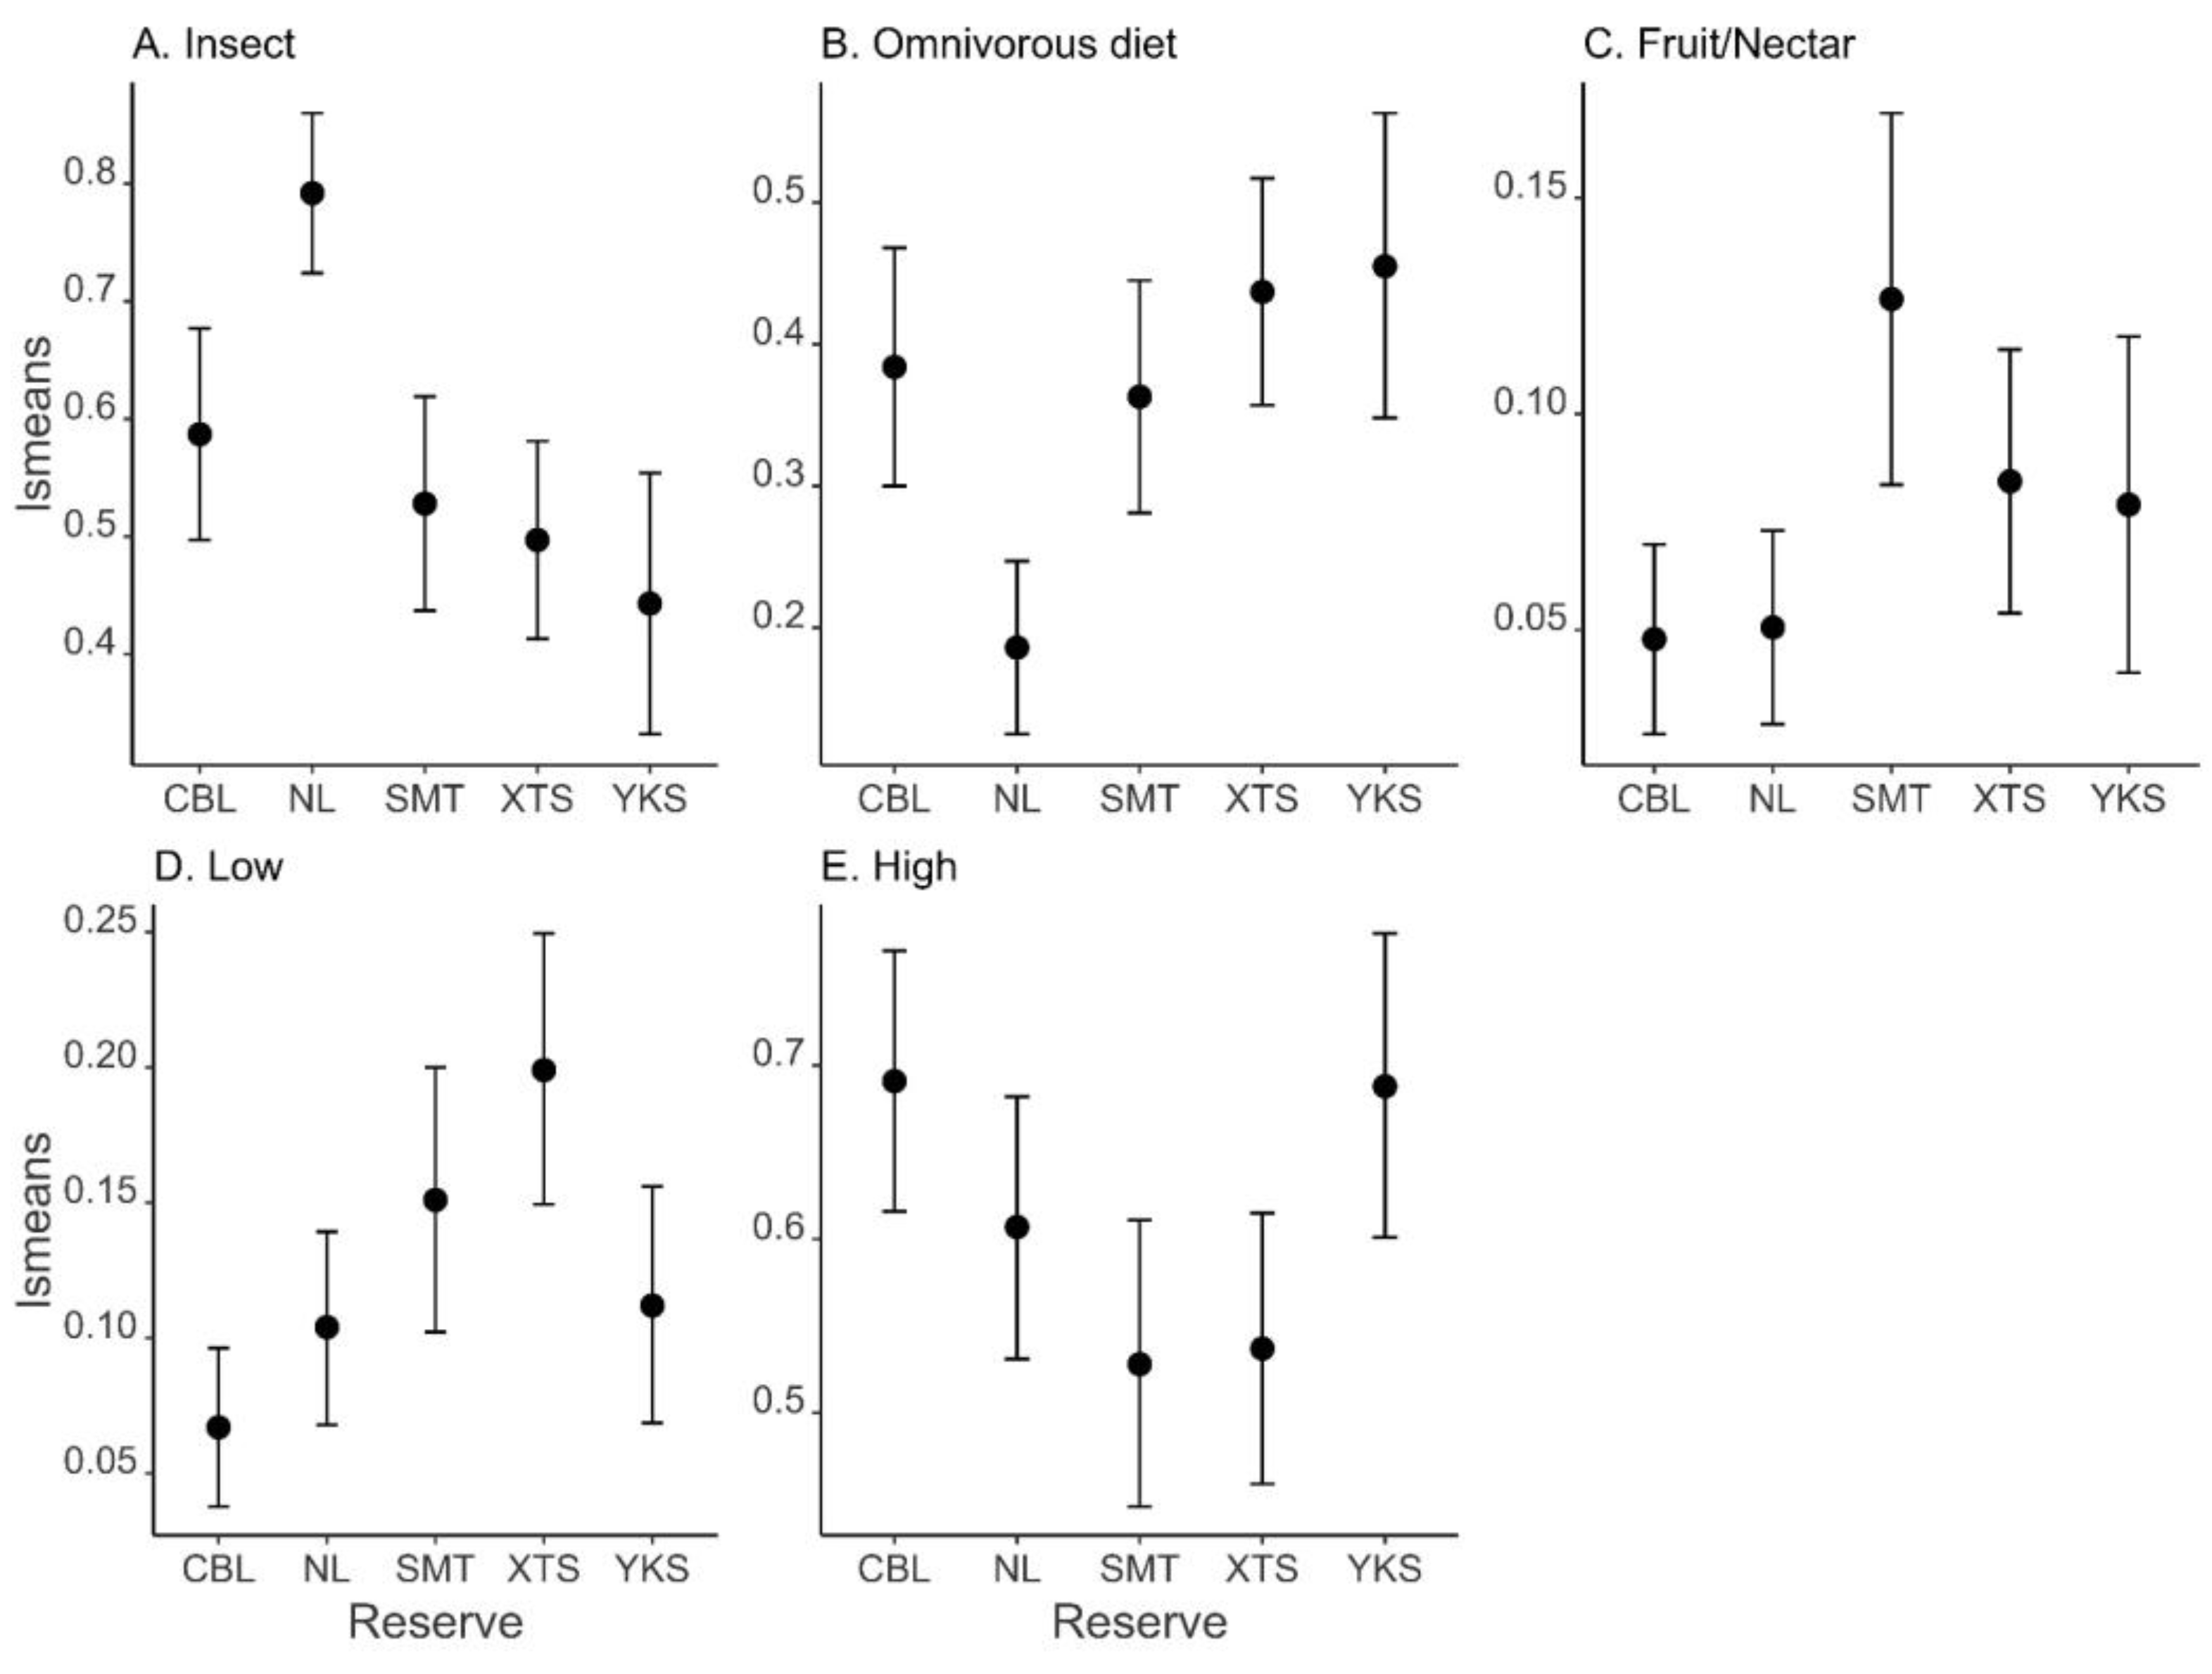
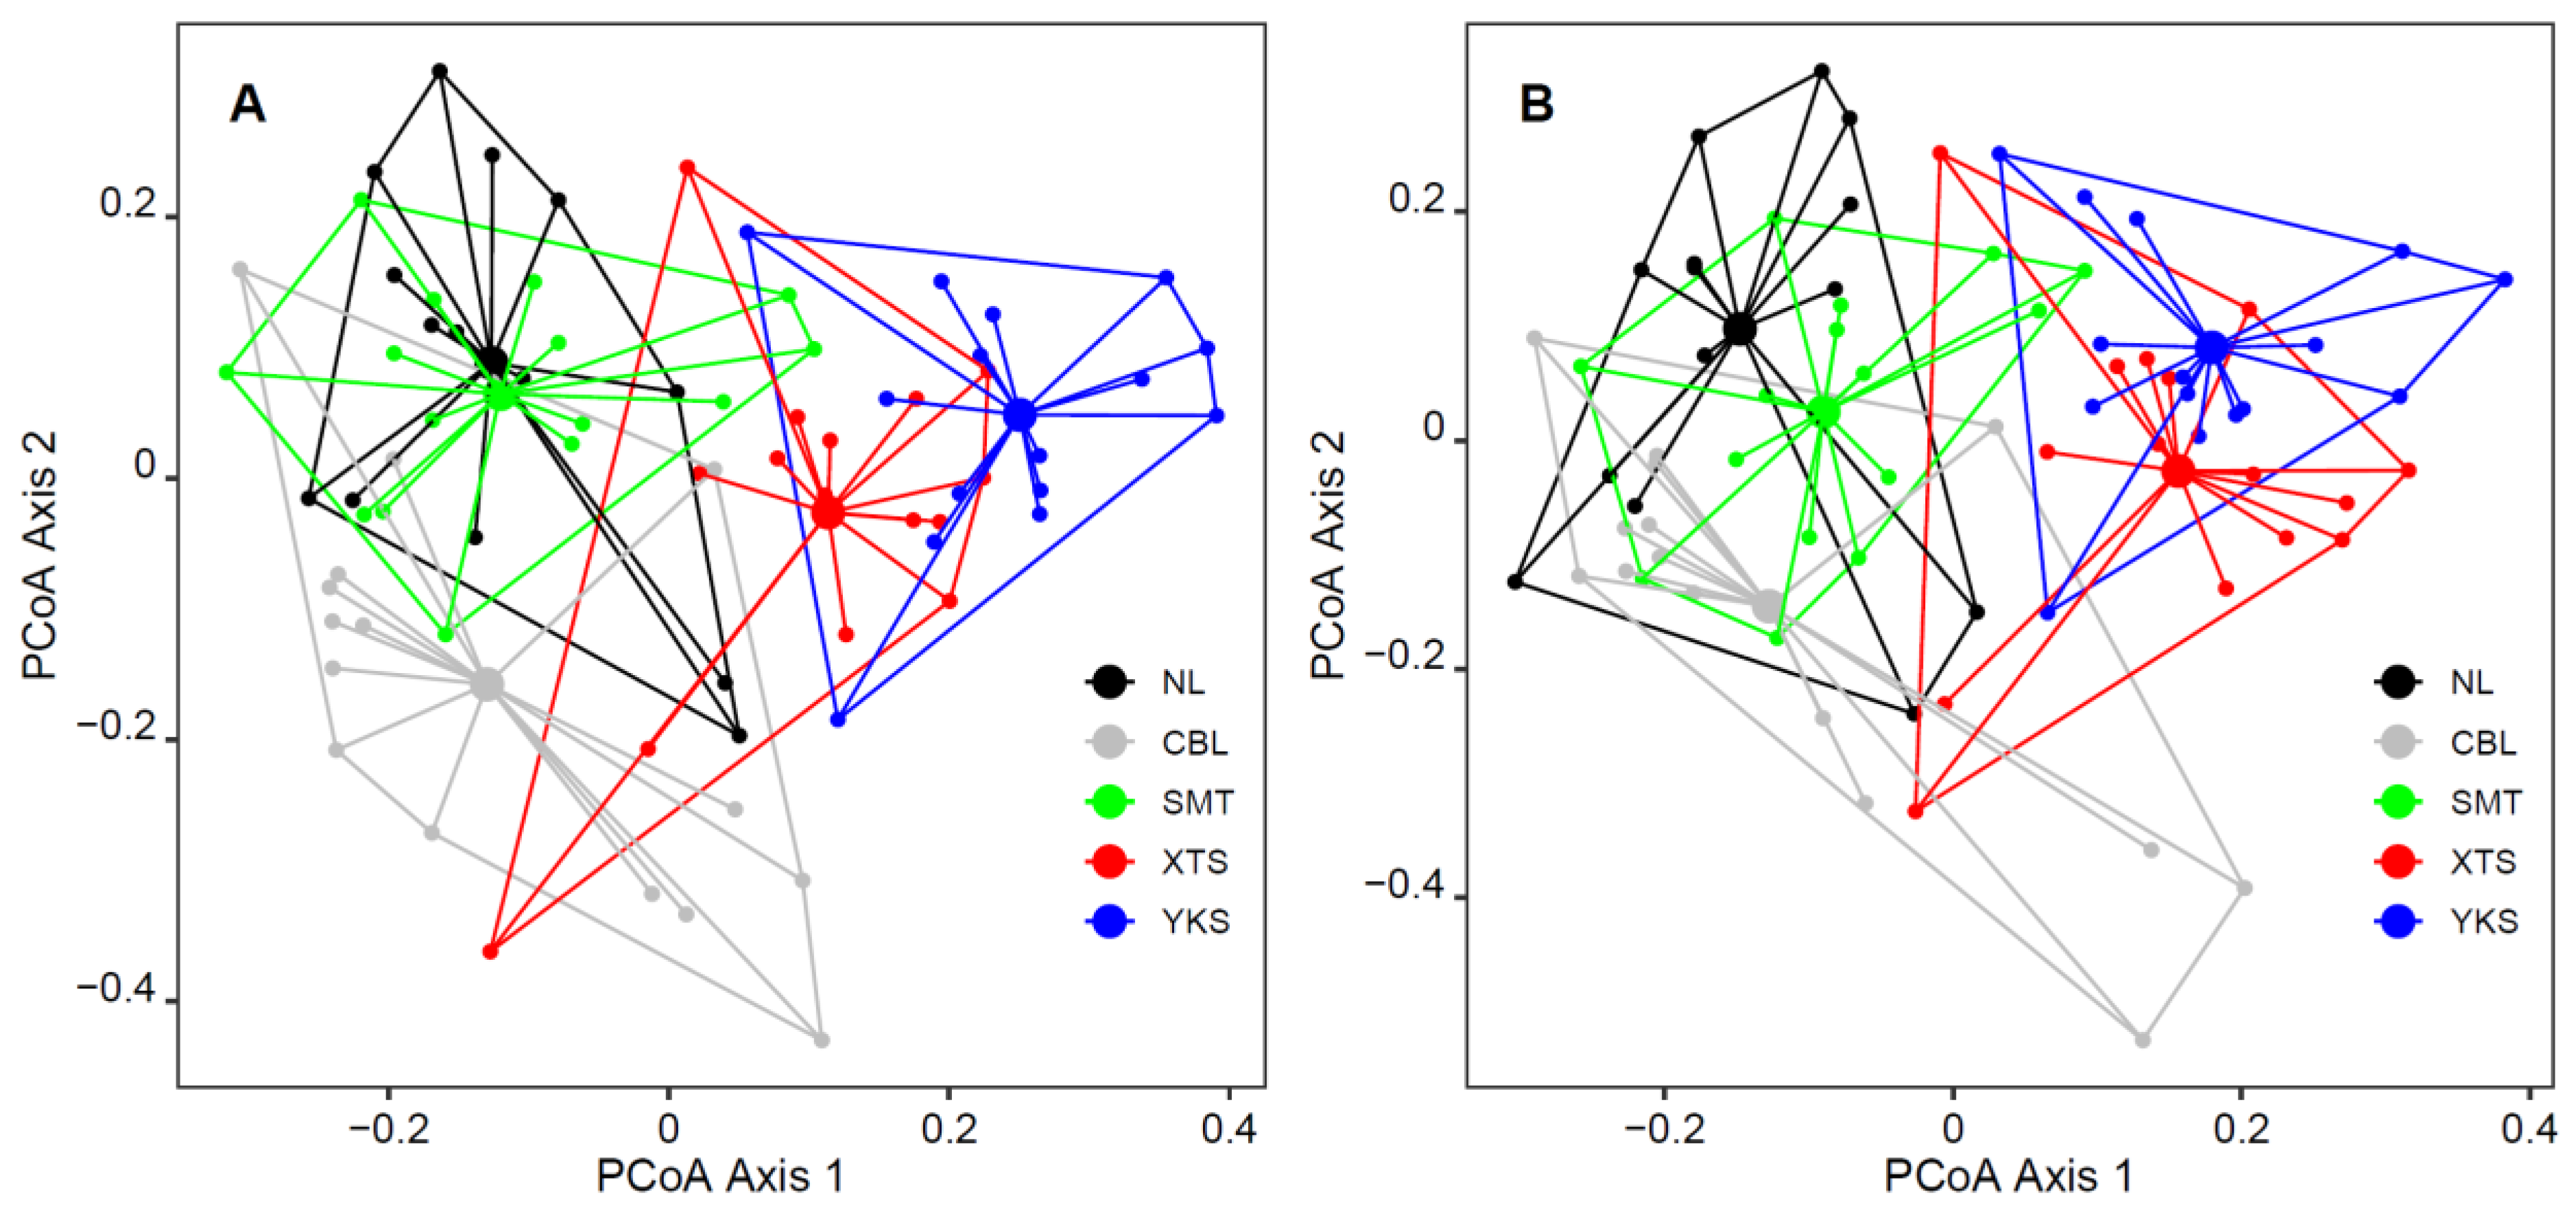
3. Results
4. Discussion
Supplementary Materials
Author Contributions
Funding
Institutional Review Board Statement
Data Availability Statement
Acknowledgments
Conflicts of Interest
References
- Bruner, A.G.; Gullison, R.E.; Rice, R.E.; Da Fonseca, G. Effectiveness of parks in protecting tropical biodiversity. Science 2001, 291, 125–128. [Google Scholar] [CrossRef]
- Dudley, N. Guidelines for Applying Protected Area Management Categories; IUCN: Gland, Switzerland, 2008; p. 143. [Google Scholar]
- Leverington, F.; Costa, K.L.; Pavese, H.; Lisle, A.; Hockings, M. A global analysis of protected area management effectiveness. Environ. Manag. 2010, 46, 685–698. [Google Scholar] [CrossRef] [PubMed]
- Geldmann, J.; Barnes, M.; Coad, L.; Craigie, I.D.; Hockings, M.; Burgess, N.D. Effectiveness of terrestrial protected areas in reducing habitat loss and population declines. Biol. Conserv. 2013, 161, 230–238. [Google Scholar] [CrossRef]
- Watson, J.E.; Dudley, N.; Segan, D.B.; Hockings, M. The performance and potential of protected areas. Nature 2014, 515, 67–73. [Google Scholar] [CrossRef]
- UNEP-WCMC; IUCN. Protected Planet Report 2020. 2021. Available online: https://www.unep.org/resources/protected-planet-report-2020 (accessed on 1 February 2023).
- Kram, M.; Bedford, C.; Durnin, M.; Luo, Y.; Rokpelnis, K.; Roth, B.; Smith, N.; Wang, Y.; Yu, G.; Yu, Q.; et al. Protecting China’s Biodiversity: A Guide to Land Use, Land Tenure, and Land Protection Tools; The Nature Conservancy: Beijing, China, 2012; pp. xxiv + 255. [Google Scholar]
- Xu, W.; Pimm, S.L.; Du, A.; Su, Y.; Fan, X.; An, L.; Liu, J.; Ouyang, Z. Transforming protected area management in China. Trends Ecol. Evol. 2019, 34, 762–766. [Google Scholar] [CrossRef] [PubMed]
- Huang, Y.; Fu, J.; Wang, W.; Li, J. Development of China’s nature reserves over the past 60 years: An overview. Land Use Policy 2019, 80, 224–232. [Google Scholar] [CrossRef]
- Peng, Q.; Yang, R.; Cao, Y.; Wang, F.; Hou, S.; Tseng, T.-H.; Wang, X.; Zhao, Z.; Yu, L.; Locke, H. One-third of lands face high conflict risk between biodiversity conservation and human activities in China. J. Environ. Manag. 2021, 299, 113449. [Google Scholar] [CrossRef]
- Zhang, L.; Luo, Z.; Mallon, D.; Li, C.; Jiang, Z. Biodiversity conservation status in China’s growing protected areas. Biol. Conserv. 2017, 210, 89–100. [Google Scholar] [CrossRef]
- Li, B.V.; Pimm, S.L. How China expanded its protected areas to conserve biodiversity. Curr. Biol. 2020, 30, R1334–R1340. [Google Scholar] [CrossRef]
- Xu, Y.; Price, M.; Yang, B.; Zhang, K.; Yang, N.; Tang, X.; Ran, J.; Yi, Y.; Wang, B. Have China’s national forest reserves designated since 1990 conserved forests effectively. J. Environ. Manag. 2022, 306, 114485. [Google Scholar] [CrossRef]
- He, S.; Su, Y.; Wang, L.; Gallagher, L.; Cheng, H. Taking an ecosystem services approach for a new national park system in China. Resour. Conserv. Recycl. 2018, 137, 136–144. [Google Scholar] [CrossRef]
- Sun, S.; Sang, W.; Axmacher, J.C. China’s national nature reserve network shows great imbalances in conserving the country’s mega-diverse vegetation. Sci. Total Environ. 2020, 717, 137159. [Google Scholar] [CrossRef] [PubMed]
- UNESCO. Biosphere Reserves: The Seville Strategy and the Statutory Framework of the World Network; United Nations Educational, Scientific and Cultural Organization: Paris, France, 1996; p. 18. [Google Scholar]
- Xu, W.; Li, X.; Pimm, S.L.; Hull, V.; Zhang, J.; Zhang, L.; Xiao, Y.; Zheng, H.; Ouyang, Z. The effectiveness of the zoning of China’s protected areas. Biol. Conserv. 2016, 204, 231–236. [Google Scholar] [CrossRef]
- Wang, Y.; Yang, H.; Qi, D.; Songer, M.; Bai, W.; Zhou, C.; Zhang, J.; Huang, Q. Efficacy and management challenges of the zoning designations of China’s national parks. Biol. Conserv. 2021, 254, 108962. [Google Scholar] [CrossRef]
- Chen, W.; Gu, T.; Xiang, J.; Luo, T.; Zeng, J. Assessing the conservation effectiveness of national nature reserves in China. Appl. Geogr. 2023, 161, 103125. [Google Scholar] [CrossRef]
- Ma, Z.; Chen, Y.; Melville, D.S.; Fan, J.; Liu, J.; Dong, J.; Tan, K.; Cheng, X.; Fuller, R.A.; Xiao, X.; et al. Changes in area and number of nature reserves in China. Conserv. Biol. 2019, 33, 1066–1075. [Google Scholar] [CrossRef] [PubMed]
- Wu, R.; Zhang, S.; Yu, D.W.; Zhao, P.; Li, X.; Wang, L.; Yu, Q.; Ma, J.; Chen, A.; Long, Y. Effectiveness of China’s nature reserves in representing ecological diversity. Front. Ecol. Environ. 2011, 9, 383–389. [Google Scholar] [CrossRef] [PubMed]
- Xu, W.; Xiao, Y.; Zhang, J.; Yang, W.; Zhang, L.; Hull, V.; Wang, Z.; Zheng, H.; Liu, J.; Polasky, S.; et al. Strengthening protected areas for biodiversity and ecosystem services in China. Proc. Natl. Acad. Sci. USA 2017, 114, 1601–1606. [Google Scholar] [CrossRef]
- Liu, X.; Li, J. Scientific solutions for the functional zoning of nature reserves in China. Ecol. Model. 2008, 215, 237–246. [Google Scholar] [CrossRef]
- Xiao, J.; Xu, W.; Kang, D.; Li, J. Nature reserve group planning for conservation of giant pandas in North Minshan, China. J. Nat. Conserv. 2011, 19, 209–214. [Google Scholar] [CrossRef]
- Tang, J.; Lu, H.; Xue, Y.; Li, J.; Li, G.; Mao, Y.; Deng, C.; Li, D. Data-driven planning adjustments of the functional zoning of Houhe National Nature Reserve. Glob. Ecol. Conserv. 2021, 29, e01708. [Google Scholar] [CrossRef]
- Weihua, X.U.; Viña, A.; Zengxiang, Q.I.; Zhiyun, O.; Jianguo, L.; Wei, L.; Hui, W. Evaluating conservation effectiveness of nature reserves established for surrogate species: Case of a Giant Panda Nature Reserve in Qinling Mountains, China. Chin. Geogr. Sci. 2014, 24, 60–70. [Google Scholar]
- Shen, X.; Li, S.; McShea, W.J.; Wang, D.; Yu, J.; Shi, X.; Dong, W.; Mi, X.; Ma, K. Evaluating the effectiveness of using flagship species as umbrellas for zone designations in China’s nature reserves. Conserv. Biol. 2019, 34, 158–167. [Google Scholar] [CrossRef] [PubMed]
- Choi, C.-Y.; Peng, H.-B.; He, P.; Ren, X.-T.; Zhang, S.; Jackson, M.V.; Gan, X.; Chen, Y.; Jia, Y.; Christie, M.; et al. Where to draw the line? Using movement data to inform protected area design and conserve mobile species. Biol. Conserv. 2019, 234, 64–71. [Google Scholar] [CrossRef]
- Jiang, B.; Li, S.; Li, J.; Zhang, Y.; Zheng, Z. Spatio-temporal dynamics and sensitive distance identification of light pollution in protected areas based on muti-source data: A case study of Guangdong province, China. Int. J. Environ. Res. Public Health 2022, 19, 12662. [Google Scholar] [CrossRef] [PubMed]
- Lu, Y.; Yang, Y.; Sun, B.; Yuan, J.; Yu, M.; Stenseth, N.C.; Bullock, J.M.; Obersteiner, M. Spatial variation in biodiversity loss across China under multiple environmental stressors. Sci. Adv. 2020, 6, eabd0952. [Google Scholar] [CrossRef] [PubMed]
- O’Connell, T.J.; Jackson, L.E.; Brooks, R.P. Birds guilds as indicators of ecological condition in the central Appalachians. Ecol. Appl. 2000, 10, 1706–1721. [Google Scholar] [CrossRef]
- Chace, J.F.; Walsh, J.J. Urban effects on native avifauna: A review. Landsc. Urban. Plan. 2006, 74, 46–69. [Google Scholar] [CrossRef]
- Borghesio, L. Effects of human subsistence activities on forest birds in Northern Kenya. Conserv. Biol. 2008, 22, 384–394. [Google Scholar] [CrossRef]
- Kale, M.; Dudhe, N.; Ferrante, M.; Ivanova, T.; Kasambe, R.; Trukhanova, I.S.; Bhattacharya, P.; Lövei, G.L. The effect of urbanization on the functional and scale-sensitive diversity of bird assemblages in Central India. J. Trop. Ecol. 2018, 34, 341–350. [Google Scholar] [CrossRef]
- Zhang, Q.; Han, J.; Xia, C.; Møller, A.P. A dataset of bird distributions in zoogeographical regions of China. Biodivers. Data J. 2022, 10, e93606. [Google Scholar] [CrossRef] [PubMed]
- Tang, Z.; Wang, Z.; Zheng, C.; Fang, J. Biodiversity in China’s mountains. Front. Ecol. Environ. 2006, 4, 347–352. [Google Scholar] [CrossRef]
- Wilman, H.; Belmaker, J.; Simpson, J.; de la Rosa, C.; Rivadeneira, M.M.; Jetz, W. EltonTraits 1.0: Species-level foraging attributes of the world’s birds and mammals. Ecology 2014, 95, 2027. [Google Scholar] [CrossRef]
- Zou, F.S.; Ye, G.F. The Checklist of Distribution of Terrestrial Vertebrates in Guangdong; Guangdong Science and Technology Press: Guangzhou, China, 2016; pp. vi + 411. [Google Scholar]
- Laliberté, E.; Legendre, P.; Shipley, B. FD: Measuring Functional Diversity from Multiple Traits, and Other Tools for Functional Ecology. R Package Version 1.0-12.1. Available online: https://cran.r-project.org/web/packages/FD/index.html (accessed on 1 October 2022).
- R Core Team. R: A Language and Environment for Statistical Computing; R Foundation for Statistical Computing: Vienna, Austria, 2022; Available online: https://www.R-project.org/ (accessed on 1 August 2022).
- Garnier, E.; Cortez, J.; Billès, G.; Navas, M.-L.; Roumet, C.; Debussche, M.; Laurent, G.; Blanchard, A.; Aubry, D.; Bellmann, A.; et al. Plant functional markers capture ecosystem properties during secondary succession. Ecology 2004, 85, 2630–2637. [Google Scholar] [CrossRef]
- Lavorel, S.; Grigulis, K.; McIntyre, S.; Garden, D.; Williams, N.; Dorrough, J.; Berman, S.; Quétier, F.; Thébault, A.; Bonis, A. Assessing functional diversity in the field-methodology matters! Funct. Ecol. 2008, 22, 134–147. [Google Scholar] [CrossRef]
- Ricotta, C.; Moretti, M. CWM and Rao’s quadratic diversity: A unified framework for functional ecology. Oecologia 2011, 167, 181–188. [Google Scholar] [CrossRef] [PubMed]
- Denelle, P.; Violle, C.; Munoz, F. Distinguishing the signatures of local environmental filtering and regional trait range limits in the study of trait-environment relationships. Oikos 2019, 128, 960–971. [Google Scholar] [CrossRef]
- Funk, J.L.; Larson, J.E.; Ames, G.M.; Butterfield, B.J.; Cavender-Bares, J.; Firn, J.; Laughlin, D.C.; Sutton-Grier, A.E.; Williams, L.; Wright, J. Revisiting the Holy Grail: Using plant functional traits to understand ecological processes. Biol. Rev. Camb. Philos. Soc. 2017, 92, 1156–1173. [Google Scholar] [CrossRef]
- Lee, M.-B. Small urban farmlands can increase diversity of open habitat birds in subtropical cities of southern China. Ecol. Res. 2022, 37, 658–669. [Google Scholar] [CrossRef]
- Miller, J.E.D.; Damschen, E.I.; Ives, A.R. Functional traits and community composition: A comparison among community-weighted means, weighted correlations, and multilevel models. Methods Ecol. Evol. 2018, 10, 415–425. [Google Scholar] [CrossRef]
- Cribari-Neto, F.; Zeileis, A. Beta regression in R. J. Stat. Softw. 2010, 34, 1–24. [Google Scholar] [CrossRef]
- Bartoń, K. MuMIn: Multi-Model Inference. R Package Version 1.46.0. 2022. Available online: https://CRAN.R-project.org/package=MuMIn (accessed on 1 August 2022).
- Burnham, K.P.; Anderson, D.R. Model Selection and Multimodel Inference: A Practical Information-Theoretic Approach; Springer: New York, NY, USA, 2002; pp. xxvi + 488. [Google Scholar]
- Lenth, R. emmeans: Estimated Marginal Means, aka Least-Squares Means. R Package Version 1.7.4-1. 2022. Available online: https://CRAN.R-project.org/package=emmeans (accessed on 1 November 2022).
- Paradis, E.; Schliep, K. ape 5.0: An environment for modern phylogenetics and evolutionary analyses in R. Bioinformatics 2019, 35, 526–528. [Google Scholar] [CrossRef]
- Baselga, A.; Orme, C.D.L.; Villeger, S.; De Bortoli, J.; Leprieur, F.; Logez, M. betapart: Partitioning Beta Diversity into Turnover and Nestedness Components. R Package Version 1.5.6. Available online: https://CRAN.R-project.org/package=betapart (accessed on 15 October 2022).
- Baselga, A.; Orme, C.D.L. betapart: An R package for the study of beta diversity. Methods Ecol. Evol. 2012, 3, 808–812. [Google Scholar] [CrossRef]
- Whittaker, R.H. Evolution and measurement of species diversity. Taxon 1972, 21, 213. [Google Scholar] [CrossRef]
- Angeler, D.G. Revealing a conservation challenge through partitioned long-term beta diversity: Increasing turnover and decreasing nestedness of boreal lake metacommunities. Divers. Distrib. 2013, 19, 772–781. [Google Scholar] [CrossRef]
- Socolar, J.B.; Gilroy, J.J.; Kunin, W.E.; Edwards, D.P. How should beta-diversity inform biodiversity conservation? Trends Ecol. Evol. 2016, 31, 67–80. [Google Scholar] [CrossRef]
- Oksanen, J.; Simpson, G.; Blanchet, F.; Kindt, R.; Legendre, P.; Minchin, P. vegan: Community Ecology Package. R Package Version 2.6-2. Available online: https://CRAN.R-project.org/package=vegan (accessed on 15 October 2022).
- Coetzee, B.W.; Gaston, K.J.; Chown, S.L. Local scale comparisons of biodiversity as a test for global protected area ecological performance: A meta-analysis. PLoS ONE 2014, 9, e105824. [Google Scholar] [CrossRef] [PubMed]
- Gray, C.L.; Hill, S.L.L.; Newbold, T.; Hudson, L.N.; Börger, L.; Contu, S.; Hoskins, A.J.; Ferrier, S.; Purvis, A. Local biodiversity is higher inside than outside terrestrial protected areas worldwide. Nat. Commun. 2016, 7, 12306. [Google Scholar] [CrossRef]
- Geldmann, J.; Coad, L.; Barnes, M.; Craigie, I.D.; Hockings, M.; Knights, K.; Leverington, F.; Cuadros, I.C.; Zamora, C.; Woodley, S.; et al. Changes in protected area management effectiveness over time: A global analysis. Biol. Conserv. 2015, 191, 692–699. [Google Scholar] [CrossRef]
- Zhao, T.; Miao, C.; Wang, J.; Su, P.; Chu, K.; Luo, Y.; Sun, Q.; Yao, Y.; Song, Y.; Bu, N. Relative contributions of natural and anthropogenic factors to the distribution patterns of nature reserves in mainland China. Sci. Total. Environ. 2022, 847, 157449. [Google Scholar] [CrossRef]
- Liu, F.; Feng, C.; Zhou, Y.; Zhang, L.; Du, J.; Huang, W.; Luo, J.; Wang, W. Effectiveness of functional zones in national nature reserves for the protection of forest ecosystems in China. J. Environ. Manag. 2022, 308, 114593. [Google Scholar] [CrossRef] [PubMed]
- Hull, V.; Xu, W.; Liu, W.; Zhou, S.; Viña, A.; Zhang, J.; Tuanmu, M.-N.; Huang, J.; Linderman, M.; Chen, X.; et al. Evaluating the efficacy of zoning designations for protected area management. Biol. Conserv. 2011, 144, 3028–3037. [Google Scholar] [CrossRef]
- Song, K.; Mi, C.-R.; Yang, N.; Sun, L.; Sun, Y.-H.; Xu, J.-L. Improve the roles of nature reserves in conservation of endangered pheasant in a highly urbanized region. Sci. Rep. 2020, 10, 17673. [Google Scholar] [CrossRef]
- Dao, T.H.H.; Saborowski, J.; Hölscher, D. Patterns of tree community differences in the core and buffer zones of a nature reserve in north-western Vietnam. Glob. Ecol. Conserv. 2016, 8, 220–229. [Google Scholar] [CrossRef]
- Zhao, H.; Wu, R.; Long, Y.; Hu, J.; Yang, F.; Jin, T.; Wang, J.; Hu, P.; Wu, W.; Diao, Y.; et al. Individual-level performance of nature reserves in forest protection and the effects of management level and establishment age. Biol. Conserv. 2019, 233, 23–30. [Google Scholar] [CrossRef]
- Martin, T.E.; Blackburn, G.A. The effectiveness of a Mesoamerican ‘paper park’ in conserving cloud forest avifauna. Biodivers. Conserv. 2009, 18, 3841–3859. [Google Scholar] [CrossRef]
- Meng, Z.; Dong, J.; Zhai, J.; Huang, L.; Liu, M.; Ellis, E.G. Effectiveness in protected areas at resisting development pressures in China. Appl. Geogr. 2022, 141, 102682. [Google Scholar] [CrossRef]
- Wright, D.H.; Reeves, J.H. On the meaning and measurement of nestedness of species assemblages. Oecologia 1992, 92, 416–428. [Google Scholar] [CrossRef] [PubMed]
- Schulze, K.; Knights, K.; Coad, L.; Geldmann, J.; Leverington, F.; Eassom, A.; Marr, M.; Butchart, S.H.M.; Hockings, M.; Burgess, N.D. An assessment of threats to terrestrial protected areas. Conserv. Lett. 2018, 11, e12435. [Google Scholar] [CrossRef]
- Xu, J.; Zhang, Z.; Liu, W.; McGowan, P. A review and assessment of nature reserve policy in China: Advances, challenges and opportunities. Oryx 2012, 46, 554–562. [Google Scholar] [CrossRef]
- Zhang, Y.; Hu, Y.; Zhang, B.; Li, Y.; Zhang, X.; Xie, Y. Conflict between nature reserves and surrounding communities in China: An empirical study based on a social and ecological system framework. Glob. Ecol. Conserv. 2020, 21, e00804. [Google Scholar] [CrossRef]
- Yang, J.; Yang, J.; Luo, X.; Huang, C. Impacts by expansion of human settlements on nature reserves in China. J. Environ. Manag. 2019, 248, 109233. [Google Scholar] [CrossRef] [PubMed]


| Response Variable | Model | df | logLik | AICc | ΔAICc | AICc Weights |
|---|---|---|---|---|---|---|
| Species richness | Null | 1 | −196.287 | 394.6 | 0.00 | 0.832 |
| Full | 9 | −188.508 | 397.8 | 3.20 | 0.168 | |
| Body mass | Null | 2 | −25.137 | 54.4 | 0.00 | 0.997 |
| Full | 10 | −21.387 | 66.3 | 11.82 | 0.003 | |
| Insect | Full | 10 | 37.913 | −52.3 | 0.00 | 1.000 |
| Null | 2 | 16.988 | −29.8 | 22.47 | 0.000 | |
| Fruit/nectar | Full | 10 | 125.009 | −226.4 | 0 | 0.999 |
| Null | 2 | 107.923 | −211.7 | 14.74 | 0.001 | |
| Omnivorous diet | Full | 10 | 42.806 | −62.1 | 0 | 0.999 |
| Null | 2 | 26.602 | −49 | 13.03 | 0.001 | |
| Plant/seed | Null | 2 | 245.795 | −487.4 | 0 | 0.999 |
| Full | 10 | 248.847 | −474.2 | 13.22 | 0.001 | |
| Ground | Null | 2 | 91.904 | −179.6 | 0.00 | 0.999 |
| Full | 10 | 94.654 | −165.8 | 13.82 | 0.001 | |
| Low | Full | 10 | 99.517 | −175.5 | 0.00 | 1.000 |
| Null | 2 | 80.254 | −156.3 | 19.15 | 0.000 | |
| Low to high | Null | 2 | 53.051 | −101.9 | 0.00 | 0.681 |
| Full | 10 | 62.009 | −100.4 | 1.52 | 0.319 | |
| High * | Null | 2 | 31.614 | −59.1 | 0.00 | 0.584 |
| Full | 10 | 40.938 | −58.4 | 0.67 | 0.416 | |
| Migrant | Null | 2 | 49.638 | −95.1 | 0 | 0.735 |
| Full | 10 | 58.336 | −93.1 | 2.04 | 0.265 |
| Response Variable | Explanatory Variable | Chi-Square (Chisq) | p (>Chisq) |
|---|---|---|---|
| Insect | Elevation | 1.131 | 0.288 |
| Zone | 2.945 | 0.400 | |
| Reserve | 40.601 | <0.001 | |
| Fruit/nectar | Elevation | 5.479 | 0.019 |
| Zone | 1.917 | 0.56 | |
| Reserve | 19.491 | <0.001 | |
| Omnivorous diet | Elevation | 0.228 | 0.633 |
| Zone | 2.945 | 0.400 | |
| Reserve | 40.601 | <0.001 | |
| Low | Elevation | 10.795 | 0.001 |
| Zone | 5.066 | 0.167 | |
| Reserve | 23.878 | <0.001 | |
| High | Elevation | 1.760 | 0.185 |
| Zone | 3.457 | 0.326 | |
| Reserve | 18.217 | 0.001 |
Disclaimer/Publisher’s Note: The statements, opinions and data contained in all publications are solely those of the individual author(s) and contributor(s) and not of MDPI and/or the editor(s). MDPI and/or the editor(s) disclaim responsibility for any injury to people or property resulting from any ideas, methods, instructions or products referred to in the content. |
© 2024 by the authors. Licensee MDPI, Basel, Switzerland. This article is an open access article distributed under the terms and conditions of the Creative Commons Attribution (CC BY) license (https://creativecommons.org/licenses/by/4.0/).
Share and Cite
Lee, M.-B.; Zhao, X.; Che, X.; Zhao, Y.; Zhang, Q.; Liu, Z.; Chen, D.; Zhang, M.; Zou, F. The Impact of Zoning Designations on Bird Communities: A Case Study of National Nature Reserves in Guangdong Province. Diversity 2024, 16, 222. https://doi.org/10.3390/d16040222
Lee M-B, Zhao X, Che X, Zhao Y, Zhang Q, Liu Z, Chen D, Zhang M, Zou F. The Impact of Zoning Designations on Bird Communities: A Case Study of National Nature Reserves in Guangdong Province. Diversity. 2024; 16(4):222. https://doi.org/10.3390/d16040222
Chicago/Turabian StyleLee, Myung-Bok, Xuebing Zhao, Xianli Che, Yanyan Zhao, Qiang Zhang, Zhifa Liu, Daojian Chen, Min Zhang, and Fasheng Zou. 2024. "The Impact of Zoning Designations on Bird Communities: A Case Study of National Nature Reserves in Guangdong Province" Diversity 16, no. 4: 222. https://doi.org/10.3390/d16040222
APA StyleLee, M.-B., Zhao, X., Che, X., Zhao, Y., Zhang, Q., Liu, Z., Chen, D., Zhang, M., & Zou, F. (2024). The Impact of Zoning Designations on Bird Communities: A Case Study of National Nature Reserves in Guangdong Province. Diversity, 16(4), 222. https://doi.org/10.3390/d16040222