Abstract
Biodiversity is under threat due to human-induced changes in land use. While various aspects of biodiversity are increasingly studied in response to these changes, there is limited understanding of their effects on the structure and composition of bird communities in dryland regions. We examined the impacts of land use change on birds in the semi-arid area of the Longxi Loess Plateau by considering taxonomic diversity, functional diversity, and phylogenetic diversity. We analyzed both the α- and β-diversity of avian communities across different dimensions of diversity and calculated functional and phylogenetic structures using the net relatedness index. Our findings revealed that species richness was highest in farmland and abandoned farmland, while artificial mixed forests exhibited the highest number of unique species. Functional and phylogenetic α-diversity was greater in farmland and abandoned farmland when compared to the other four land use types. Moreover, the taxonomic diversity in artificial mixed forests, artificial Caragana korshinskii forests, and artificial Platycladus orientalis forests surpassed that in typical grasslands, but no differences were observed in functional and phylogenetic diversity. Regarding β-diversity, turnover patterns dominated multidimensional dissimilarity, with taxonomic turnover and total dissimilarity lower than their functional counterparts but higher than phylogenetic counterparts. Based on the present findings, we emphasize the long-term cessation of ongoing silvicultural initiatives to safeguard bird diversity in the semi-arid region of the Longxi Loess Plateau. This is crucial for narrowly distributed species such as Alectoris magna, as they face heightened vulnerability to losses.
1. Introduction
Biodiversity plays a crucial role in maintaining the balance of both human and natural environments, providing essential ecosystem services [1]. However, escalating human activities are causing severe biodiversity crises [1,2], with land use change being a primary driver of global biodiversity loss [3]. This change involves altering the physical environment and vegetation structure at the habitat level [3,4], leading to unpredictable fluctuations in biodiversity [4] and continuous changes in biological structure and ecological community composition [1], with implications for different dimensions of biodiversity, such as taxonomic diversity, functional diversity, and phylogenetic diversity.
Land use change significantly impacts taxonomic diversity, resulting in an average reduction of 13.6% in local species richness, 10.7% in total abundance, and 8.1% in rarefaction-based richness [2]. Moreover, it has led to the loss of about 15% of global terrestrial vertebrate species richness, putting 556 individual species at risk of global extinction [5]. These findings highlight the vulnerability of sensitive species that face population decline or even extinction when their suitable habitats are destroyed due to land use change, ultimately causing a significant loss of species diversity.
Land use change also has profound effects on available resources, subsequently impacting functional diversity [6], which is decomposed into the following components: (1) functional richness (FRic), representing the combined functional traits of individual species persisting in a niche or ecosystem; (2) functional evenness (FEve), which is related to the distribution of functional abundance within an ecosystem; and (3) functional divergence (FDiv), which is involved the differentiation and distribution of functionally distinct species [7,8,9,10]. These functional attributes depend on a diverse range of resources [7,10]. Studies have shown that land use change disturbances lead to a decline in global vertebrate functional diversity and alter local functional structure, with partial compensation through functional gains in certain areas [11]. Furthermore, while taxonomic diversity may remain unchanged or even increase in newly transformed environments resulting from land use change, there is a shift in community composition. As a result, replacing native and specialized species by widespread species in response to new resources and niches can lead to a decline in functional diversity, resulting in a loss of ecosystem services [12]. Evidence has shown that increased habitat disturbance associated with land use change can contribute to functional diversity decline by eliminating species with distinct ecological characteristics [13].
Furthermore, phylogenetic diversity (PD) denotes the cumulative phylogenetic dissimilarity among various species within a community. It elucidates the evolutionary distinctions among species, rather than their sheer numbers or traits [14]. Additionally, it provides insights into a range of concealed ecological or behavioral characteristics [15]. In comparison to species richness, heightened levels of phylogenetic diversity and functional diversity are correlated with enhanced ecological processes and services [16] as well as greater ecosystem stability [17]. Therefore, when assessing the effects of land use change on biodiversity, an increasing number of studies have recognized the importance of considering all three components—TD, FD, and PD—to comprehensively understand community responses to environmental disturbances.
Drylands cover approximately 41.5% of the Earth’s terrestrial area and serve as essential habitats for a myriad of species. Notably, 55% of mammalian and 64% of avian species rely on these regions for their survival [18]. The Loess Plateau in China is located in a dryland region, but it is ecologically vulnerable due to unsustainable land use practices, resulting in significant soil erosion. For soil erosion prevention and ecological restoration, two initiatives, namely the Natural Forest Protection and the Grain-for-Green Program, have been implemented to control soil erosion. As a result, vegetation cover increased to approximately 50% in 2010 [19] and reached 60.2% by the end of 2013 [20]. While previous studies have focused on a certain aspect of soil nutrient and microbial diversity, as well as soil arthropods in response to land use changes [21,22,23], the assessment of bird communities has been limited to taxonomic diversity. However, taxonomic diversity alone cannot provide sufficient information on ecosystem processes and responses to environmental disturbances [3,7]. Therefore, to fill this research gap, this study aimed to explore the combined effects of changing land use patterns on bird communities in the semi-arid region of the Longxi Loess Plateau. By considering three diversity aspects, namely taxonomic diversity, functional diversity, and phylogenetic diversity, we seek to address the following scientific inquiries: (A) To ascertain the composition of bird communities across various land use types. (B) To investigate the impact of different land use types on bird functional and phylogenetic alpha and beta diversity and assess whether this variability aligns with alterations observed in taxonomic metrics. Given that artificial forests, particularly monoculture forests, potentially present simplified habitats characterized by diminished vegetation structure and resource variety, our hypothesis posits that the replacement of natural habitats by artificial forests will lead to a reduction in bird species richness and a decrease in avian functional and phylogenetic diversity.
2. Materials and Methods
2.1. Study Area
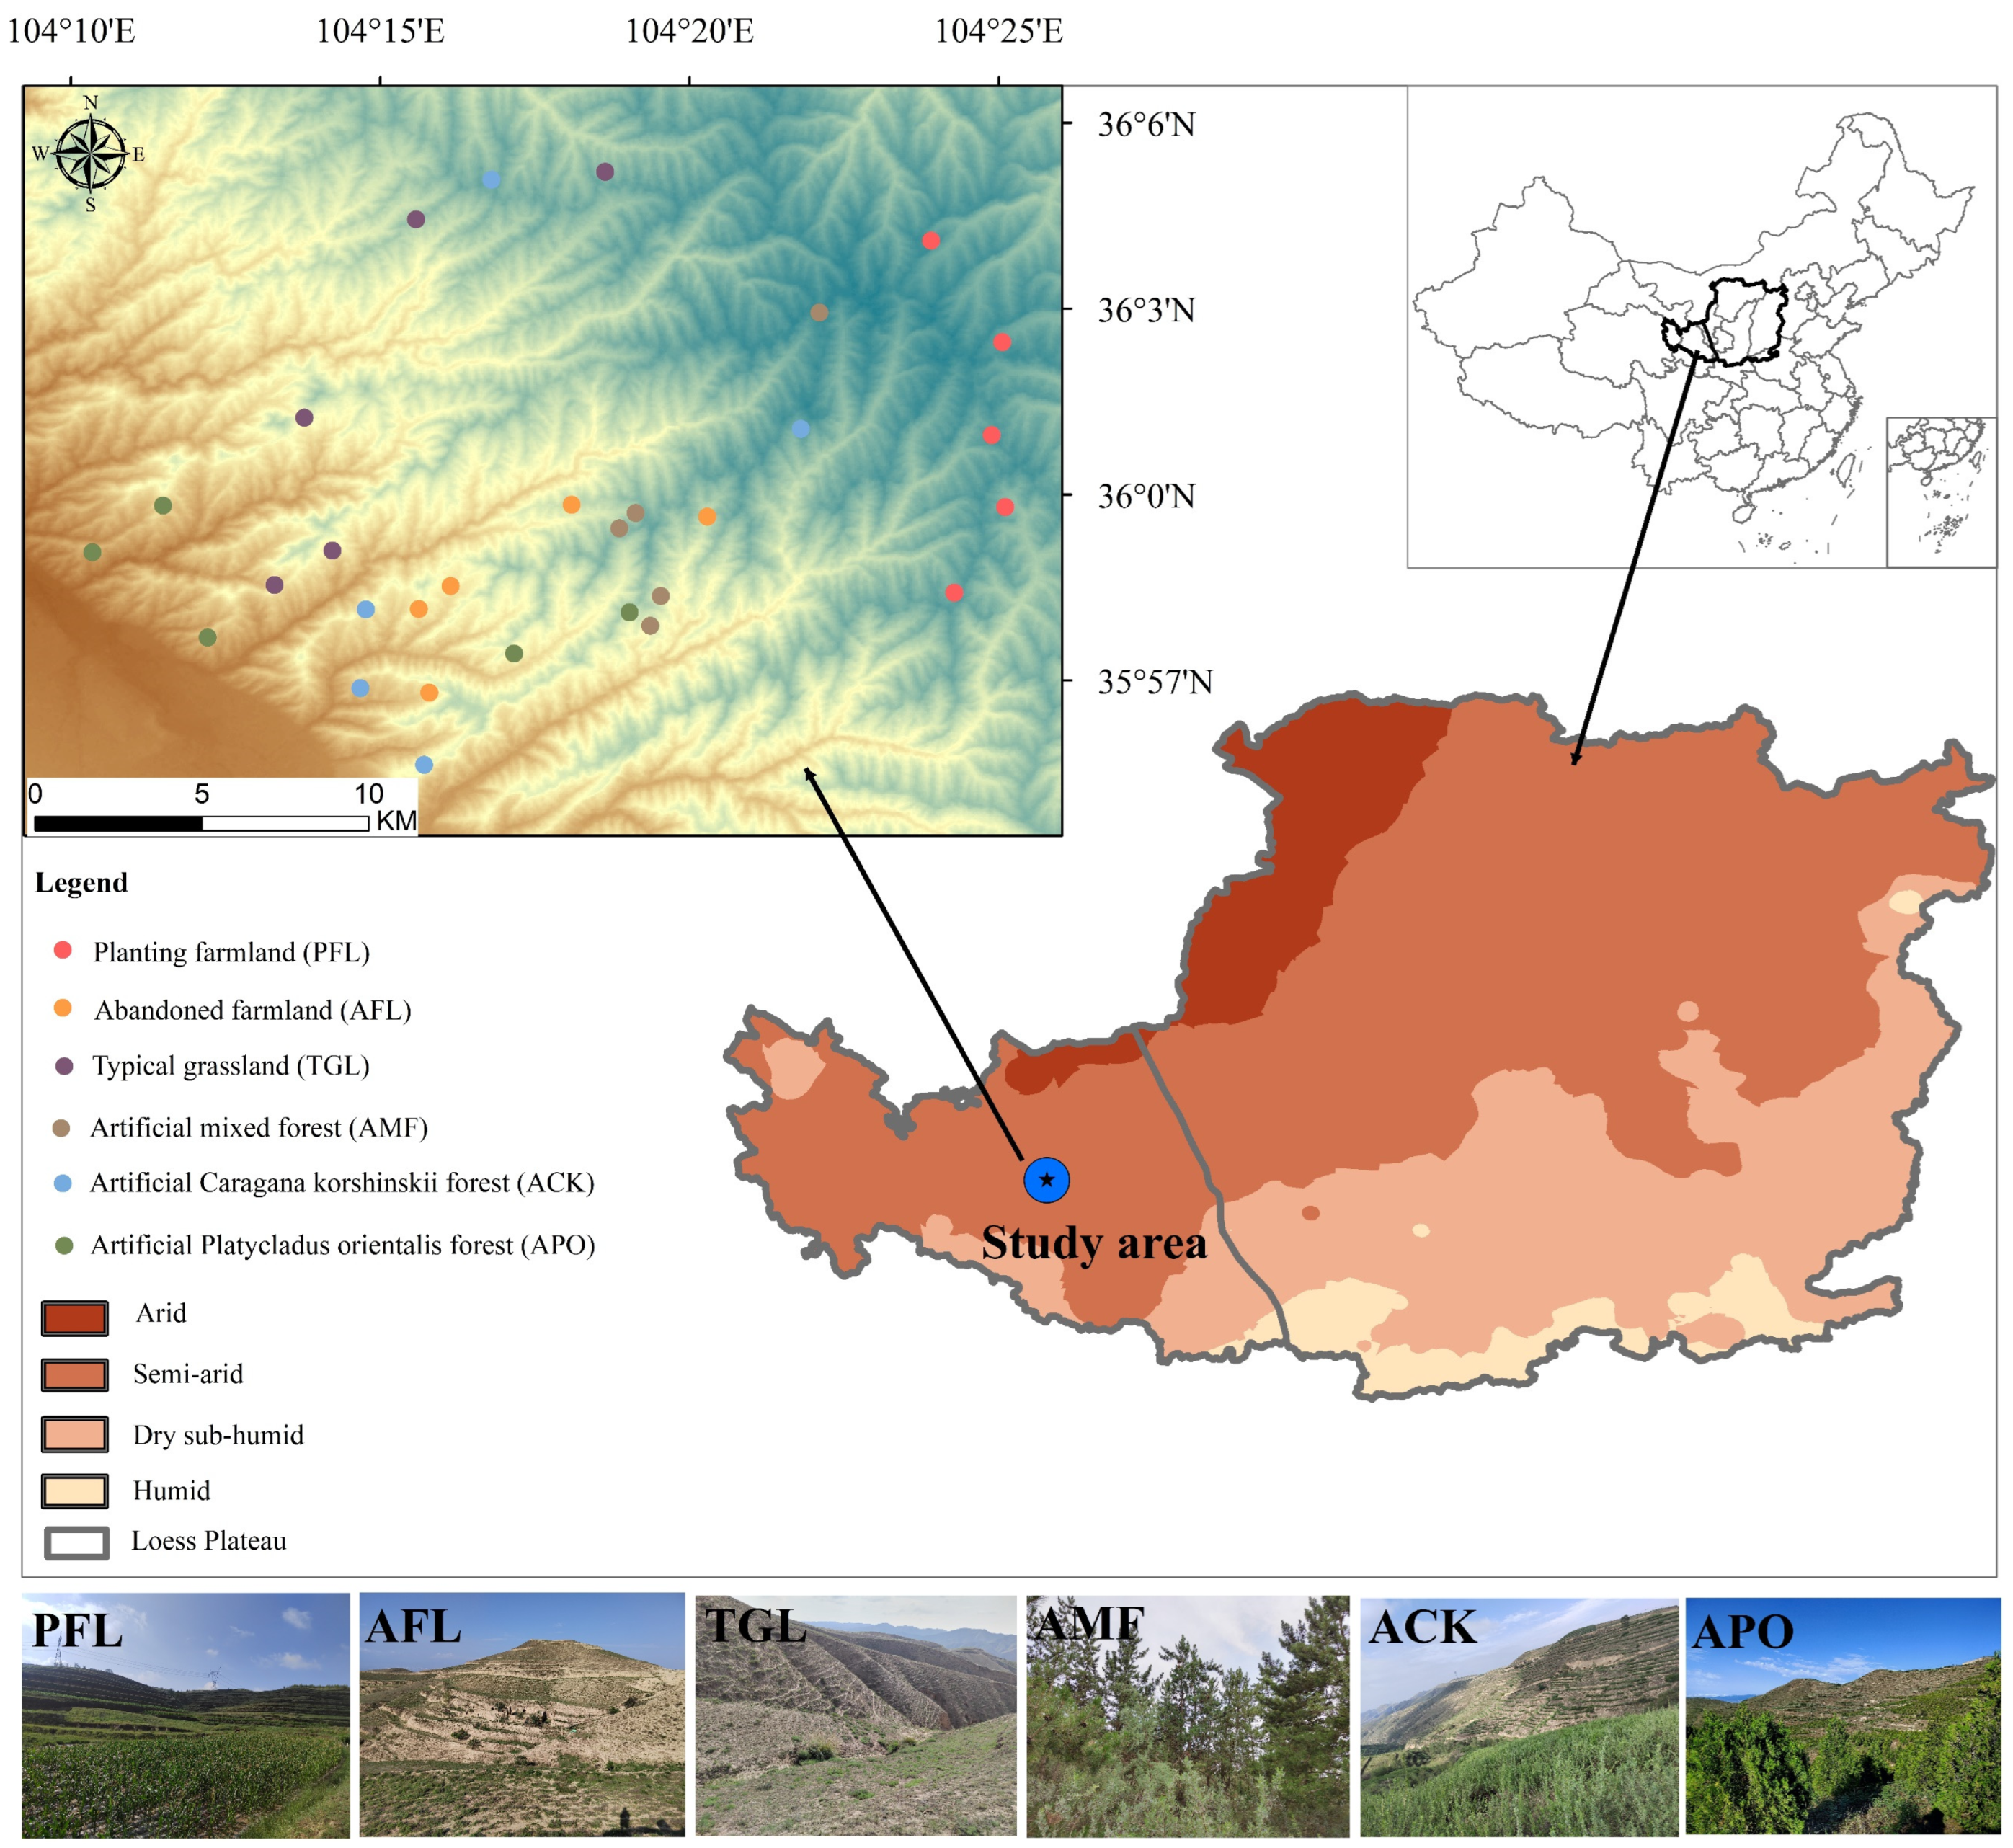
This study was conducted in Gongjing forestry, Yuzhong County, Gansu Province, which is located in the western part of the Loess Plateau, China. The protected area, established in 1959, covers 8573 ha, with approximately 3907 ha designated for afforestation. This area has 700 ha of forestland, 1609 ha of Caragana korshinskii shrub forestland, and 1598 ha of undeveloped forestland [23]. The forestry area within the semi-arid zone experiences a temperate continental monsoon climate. The annual average temperature is 6.5 °C, and the total annual precipitation is 381 mm [24], 80% of which occurs during the growing season from April to October. Additionally, the annual potential evaporation is approximately 1300 mm [23,24].
2.2. Study Design
In the study area, before the establishment of the forest, the predominant land types were typical grassland and farmland. Later, as residents moved out, some farmland and grassland were converted into planted forests, resulting in five main land use types. To comprehensively represent the various land types in the region, these five land use types were combined with the surrounding farmland habitat, resulting in a total of six identified land use types, including the following: (A) Planting farmland (PFL): located adjacent to the forest, mainly used for crop cultivation. The ridges of the field and surrounding areas are planted with artificial deciduous trees and are accompanied by various types of weeds. (B) Abandoned farmland (AFL): agricultural land abandoned after residents’ relocation within the forestry area. (C) Typical grassland (TGL): undisturbed habitat with natural vegetation structure and composition. (D) Artificial mixed forest (AMF): man-made forest predominantly composed of tree species such as Armeniaca sibirica, Pinus tabuliformis, Populus hopeiensis, and Tamarix chinensis. (E) Artificial Caragana korshinskii forest (ACK): man-made forest comprising a monoculture forest of shrubs. (F) Artificial Platycladus orientalis forest (APO): man-made forest consisting of a monoculture of Platycladus orientalis. These six land use types represent the full range of land types in the study region. To ensure comprehensive sampling, five different sites were selected for each land use type (Figure 1) during field visits. These sites were chosen with a minimum distance of at least 200 m between them to avoid duplication and maintain statistical independence [25,26].
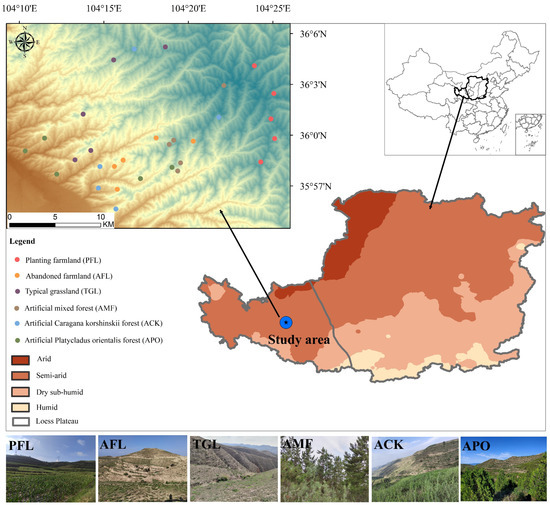
Figure 1.
Sampling sites of birds in different land use types.
2.3. Avifaunal Sampling
For data collection, we adopted a systematic approach. Random central points were selected within predefined sample plots, and surveys were conducted within a 50 m radius of observation to record the richness and abundance of bird species in each land use type. In accordance with this sampling design, we first conducted 1 survey per sample site of each land use type in 2021 to ensure the operationalization of the experiment. Then, the comprehensive survey period was extended from June to August 2022. To enhance the likelihood of detecting rare bird species, each sample site was surveyed four times. We conducted surveys under favorable weather conditions, avoiding high winds and fog to minimize potential biases. The surveys were primarily carried out during periods of peak bird activity, typically in the morning (6:00–10:00) and afternoon (16:30–19:30). Binoculars (ZEISS Terra ED 8 × 42, Oberkochen, Germany) and a telephoto camera (Canon EDS5D Mark III, Canon Inc., Tokyo, Japan) were used for observation. Bird species were identified based on visual confirmation as well as bird songs and calls. Each survey session lasted for half an hour. When counting the number of birds, those flying in the sky or those that could not be identified were excluded, and the abundance of each bird species during each survey session was represented by the highest record observed.
2.4. Functional Traits
We collected eight morphological data for all observed bird species during the survey. These measurements included four beak dimensions: wing length, tail length, tarsus length, and Kipp’s distance (Table S1). These morphological indicators were chosen based on the following criteria: Beak size and shape are well-known indicators of food selection in birds [27,28], providing valuable insights into their trophic niche, which has been extensively studied in relation to foraging ecology [28,29]. Wing length, tail length, and tarsus length are related to substrate use and foraging strategies [27,29]. Kipp’s distance, a measure of wing morphology, provides information about birds’ ability to disperse and cross gaps in the landscape [30,31]. It reflects potential constraints on movement and the ability to access different habitats. Based on the literature, we categorized the bird species’ diets into six distinct categories. These dietary guilds serve as indicators of resource requirements and sensitivity to habitat change, making them widely used in studies focusing on functional traits in birds (Table S1).
2.5. Phylogenetic Data
In this study, we constructed phylogenetic trees for the 38 surveyed bird species using “A Global Phylogeny of Birds” (http://www.birdtree.org) (accessed on 5 October 2022), as made available for analysis [32]. The taxonomic list was first downloaded from the phylogenetic subset for Latin name matching. Subsequently, the phylogenetic tree was obtained from the “Hackett All Species: a set of 10,000 trees with 9993 OTUS each” database, including 5000 pseudo-posterior distributions. Finally, the Maximum Clade Credibility tree was constructed using the average node height by TreeAnnonator software (v 1.10.4) of the BEAST package [4]. The resulting phylogenetic tree served as the basis for all subsequent phylogenetic correlation analyses in this study.
2.6. Statistical Analysis
To gain a clearer understanding of potential differences in bird community composition among land use types, we employed the “UpSetR” package [33] for the analysis. Additionally, we tested variation in bird community composition using Analysis of Similarities (ANOSIM). ANOSIM is a nonparametric test for similarity between high-dimensional data sets, and the calculated relationship ranking was judged based on the permutation test.
The taxonomic α-diversity was measured using observed species richness. For functional α-diversity, the raw functional diversity of communities was assessed in relation to land use (functional diversity was calculated based on presence–absence data for all communities, with each site classified as a community) [34]. To account for the presence of both categorical and continuous variables, Gower distances were used to normalize the characteristics of the birds. Additionally, functional richness [8,9], functional evenness [8,9], and functional divergence [8,9] were quantified using the “FD” package [35]. These measures allowed us to assess the differences in bird community functions among land use types and to examine the niche differentiation of communities and the extent to which they utilize environmental resources. To evaluate phylogenetic α-diversity, we computed Faith’s PD using the “Picante” package [36], as it reflects the sum of the total phylogenetic branch length of all species within the community [14]. In addition, functional and phylogenetic structure, as a complement to functional and phylogenetic diversity, can reflect the ecological processes of community construction (e.g., habitat filtering, competitive exclusion). This is characterized by the net relatedness index (NRI), which is the standardized form of the mean pairwise phylogenetic distance (MPD) [37]. The calculation formula is as follows:
where MPDobs is the observed MPD of bird communities in each land use type, meanMPDrand is the mean of 999 times of the null distribution, and sdMPDrand is the standard deviation of the null distribution.
For the calculation of pairwise indices of taxonomic, functional, and phylogenetic β-diversity decomposition, the Sørensen dissimilarity index was used [38,39] based on species, functional traits, and phylogenetic data, respectively, using the “betapart” package [40]. This method divides overall β-diversity into two components: turnover, which indicates how often species replace each other at different sites, and nestedness, which indicates how often the same few species occupy different sites. These components represent different processes in the community assemblage [38]. Functional β-diversity decomposition was based on the volume of convex hull intersections in a multidimensional functional space [39]. Specifically, a Gower’s pairwise distance matrix was constructed for the functional trait matrix, and the first four principal coordinate analysis (PCoA) axes, explaining 94.35% of trait variation, were used to calculate FDsor, FDsim, and FDsne.
Before statistical analysis, all data were tested for normal distribution and variance chi-square. For data satisfying these criteria, ANOVA test and Tukey’s multiple comparisons were used to analyze significant differences between groups. For data not meeting the criteria, the nonparametric Kruskal–Wallis test and Dunn’s test were used. Based on this, the taxonomic, functional, and phylogenetic diversity indices and community construction of birds among different land use types were tested, and differences were considered to exist when p < 0.05, significant differences when p < 0.01, and highly significant differences when p < 0.001. All the statistical analyses were performed using R 4.0.3 software [41].
3. Results
A total of 46 breeding bird species were observed during the study. However, eight of these species were excluded from the subsequent analysis due to difficulties in accurately classifying their habitats. As a result, 38 bird species were definitively used for analysis in this study (Table S2). The sampling coverage curves showed saturation in all habitats, and the curves based on different diversity indices also leveled off in each land use type. This indicates that the point-count sampling effort was adequate (Figure S1).
3.1. Species Composition
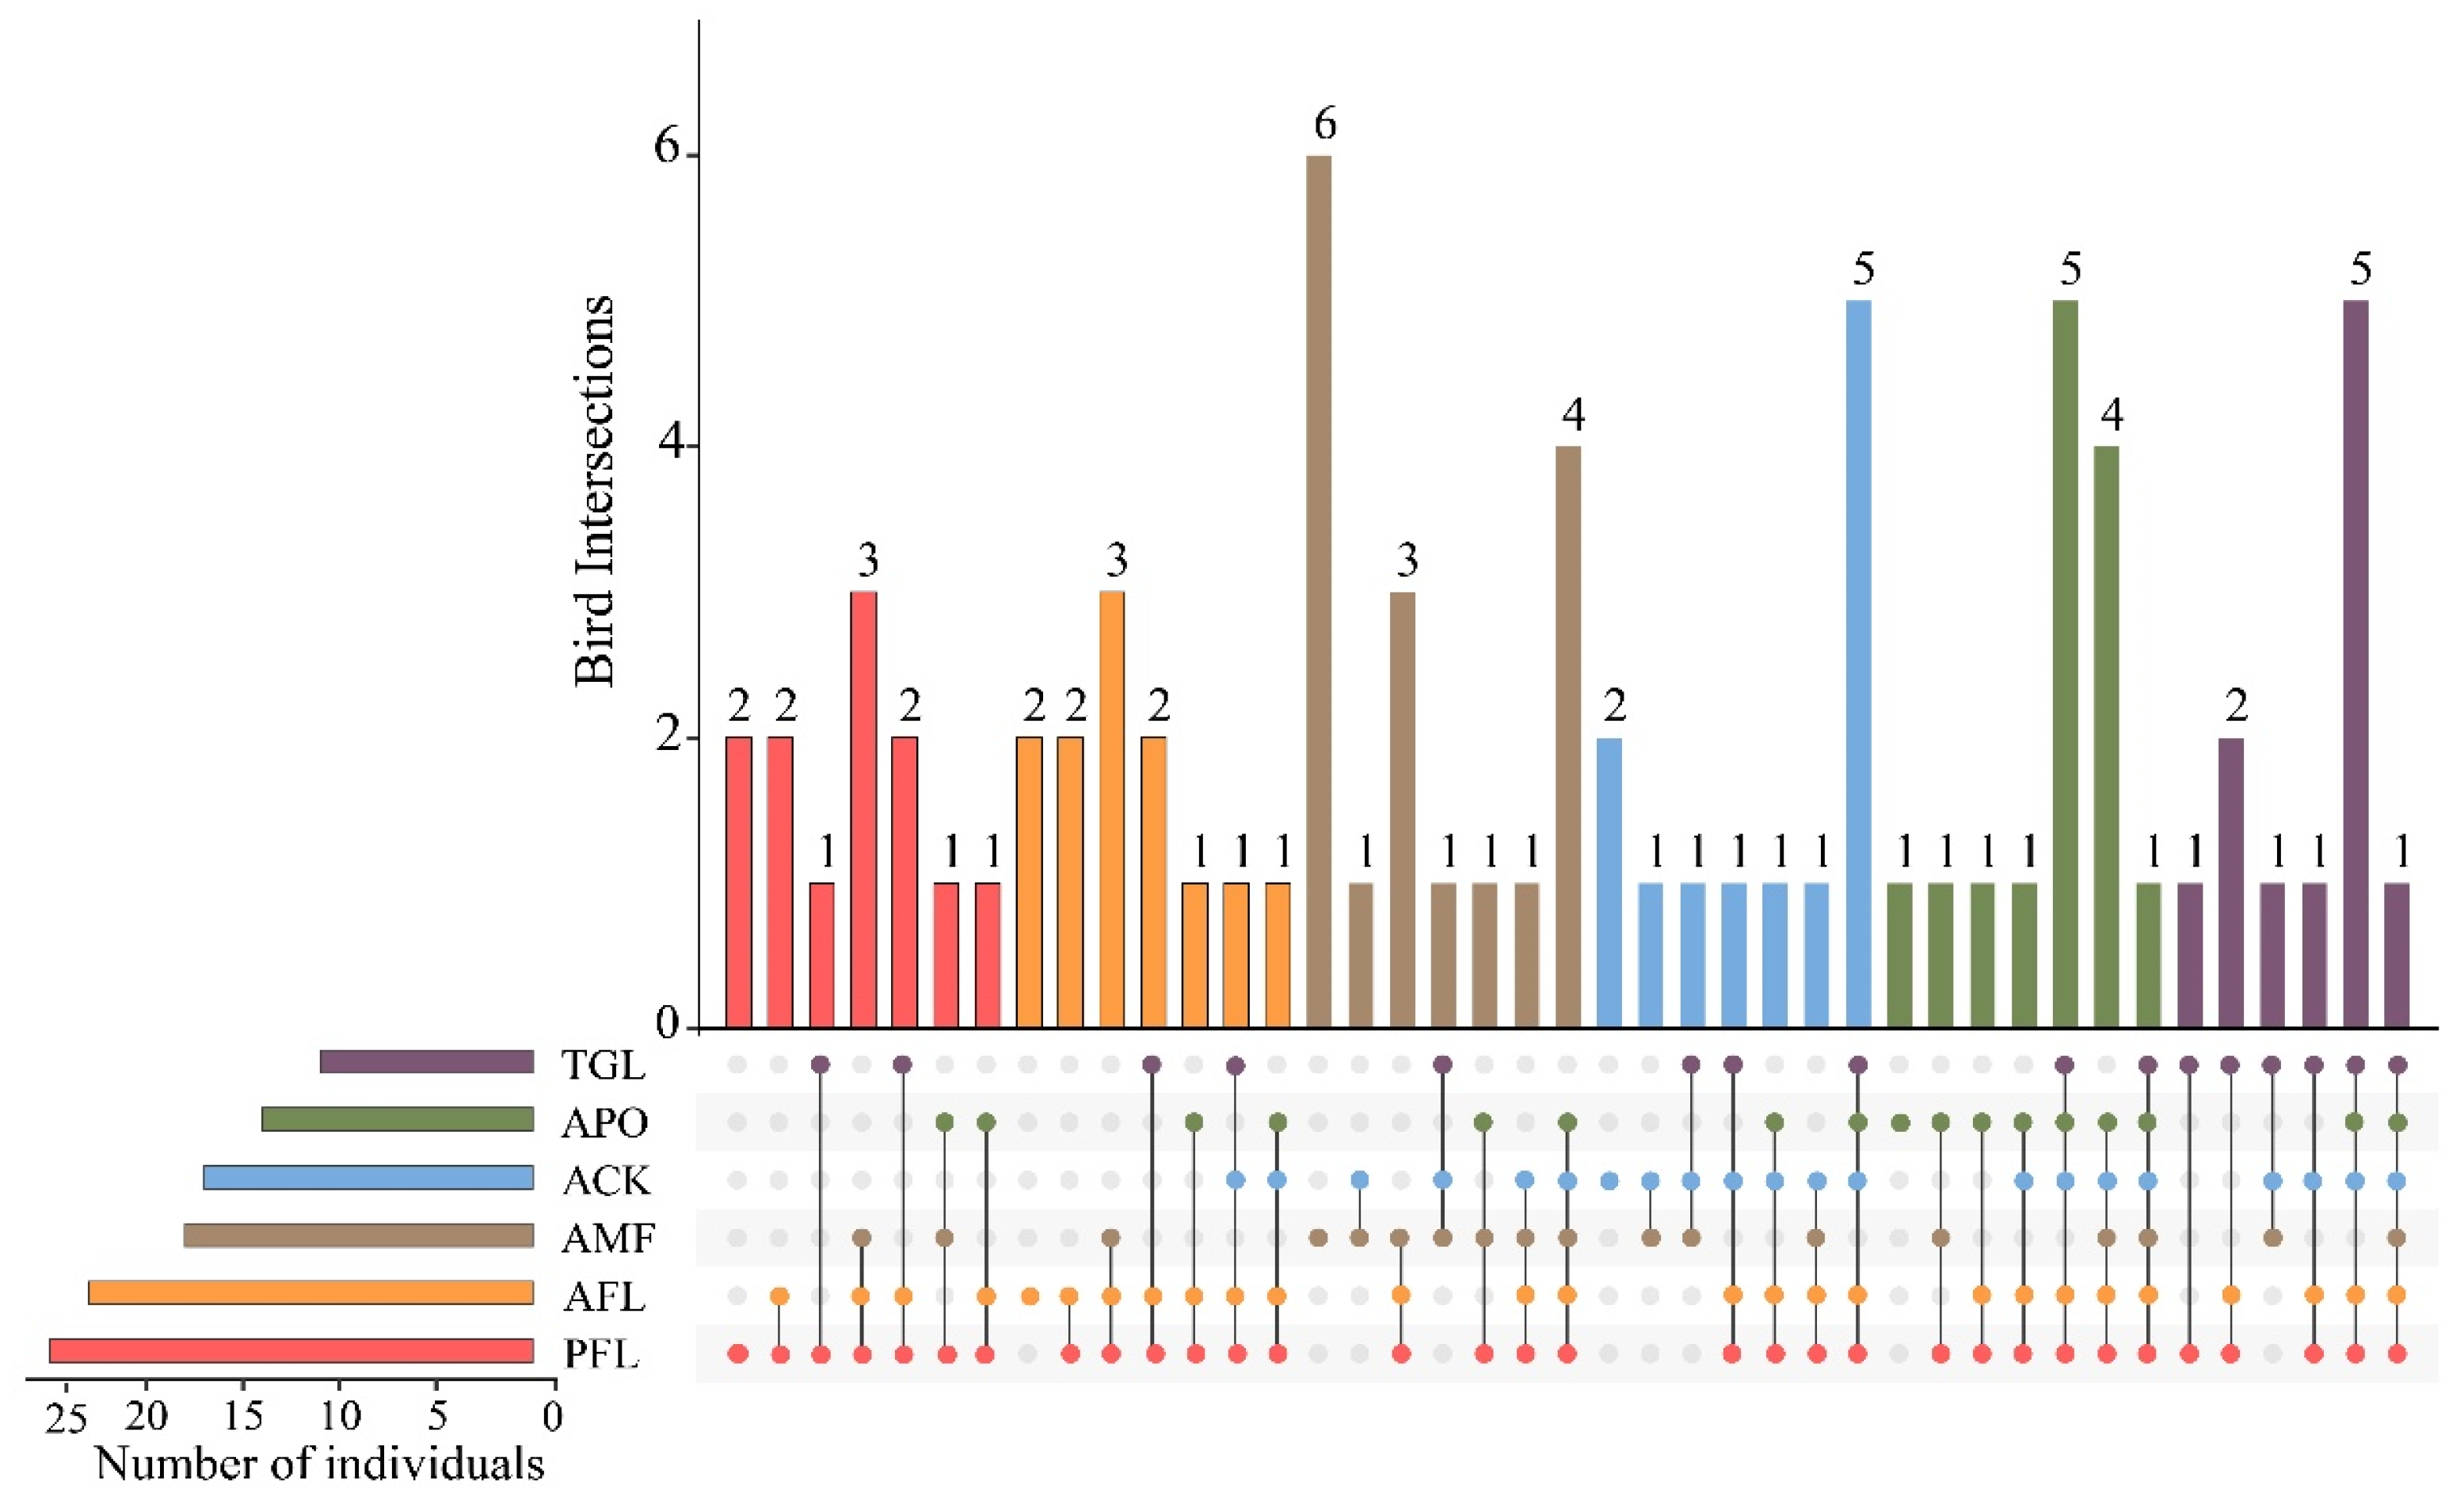
Among the six land use types, the AMF supported the highest number of “unique species” (six species recorded in this type only), accounting for 15.79% of the total number of bird species. The PFL, AFL, and ACK had a consistent richness of two unique species. The APO had one unique species, while TGL had none (Figure 2). Phasianus colchius was a common species found in all land use types. Apart from the AMF, the remaining five types shared five species, namely Columba rupestris, Pyrrhocorax pyrrhocorax, Phoenicurus auroreus, Oenanthe pleschanka, and Emberiza cioides (Table S2). Furthermore, the top 10 most abundant species accounted for 74.63% of the records. Among them, Garrulax davidi was the dominant species in the AMF, the most common species was Passer montanus in PFL and AFL, and Pyrrhocorax pyrrhocorax was mostly recorded in TGL (Figure S2).
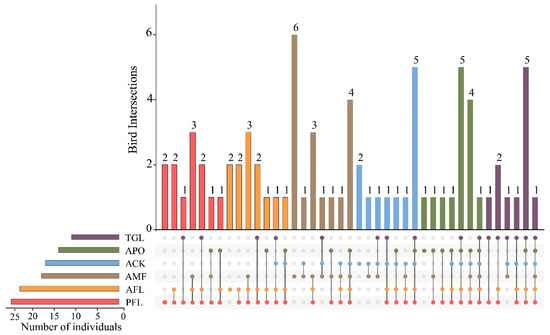
Figure 2.
UpSetR intersection diagram displaying the unique and shared bird species among the different land use types. Land use type codes were as follows: PFL—planting farmland; AFL—abandoned farmland; TGL—typical grassland; AMF—artificial mixed forest; ACK—artificial Caragana korshinskii forest; APO—artificial Platycladus orientalis forest.
The ANOSIM analysis indicated significant differences between the land use types (R = 0.783, p = 0.001). Pairwise comparisons between land use types revealed varying degrees of separation. PFL and AFL were strongly correlated (R = 0.124, p = 0.178) with 21 shared species, and they harbored species that were not recorded in the three planted forests. Next, the ACK and the APO showed a correlation (R = 0.440, p = 0.030), sharing 11 species (Figure 3).
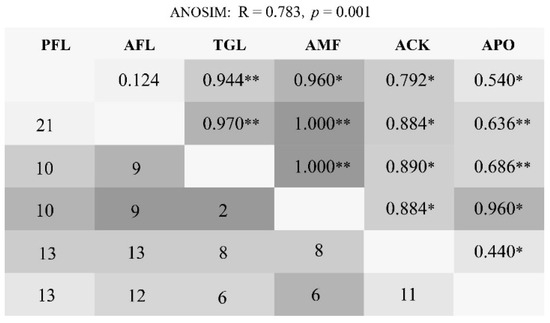
Figure 3.
Pairwise comparisons of bird community similarity showing the original shared species numbers below the diagonal. The ANOSIM sample R and significance marker are shown above the diagonal separation, where the depth of gray indicates a larger R-value. Land use type codes were as follows: PFL—planting farmland; AFL—abandoned farmland; TGL—typical grassland; AMF—artificial mixed forest; ACK—artificial Caragana korshinskii forest; APO—artificial Platycladus orientalis forest. Asterisks indicate statistically significant in different land use types: “*” 0.05, “**” 0.01.
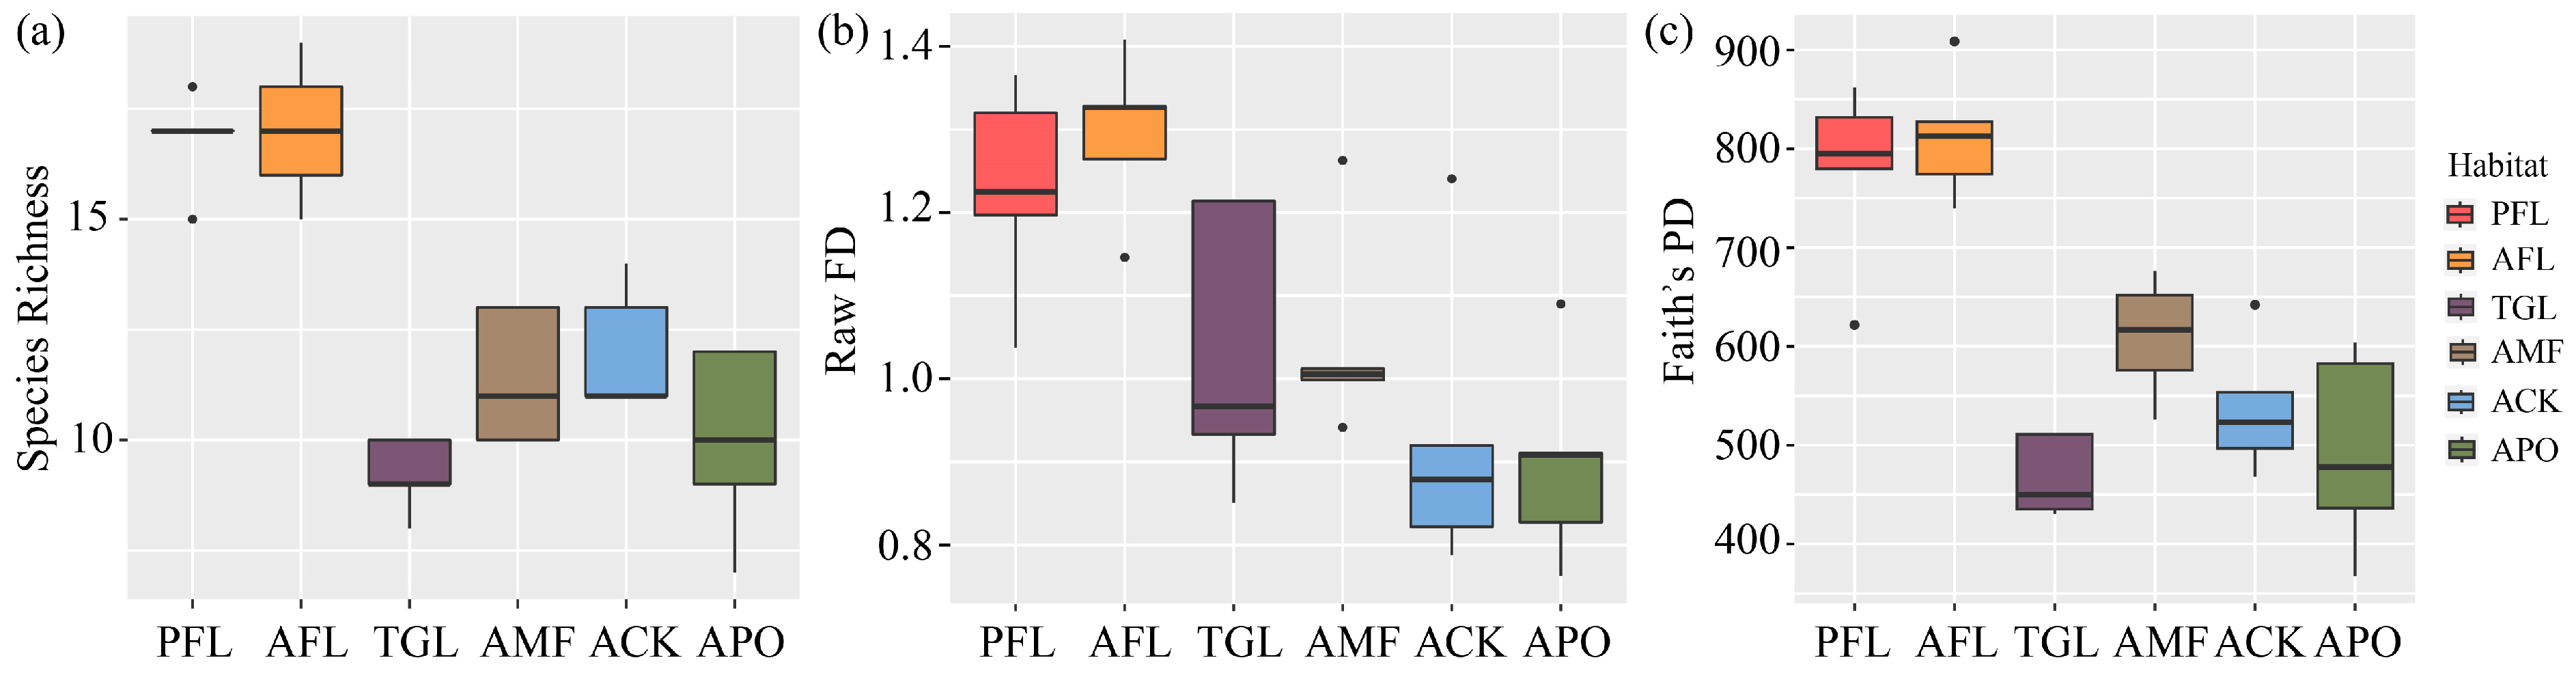
Taxonomic diversity, measured by species richness, was found to be highest in PFL, followed by AFL (Figure 4a). ANOVA revealed highly significant differences among the habitats (F = 25.91, p < 0.001). Tukey’s post hoc test further indicated that PFL and AFL were extremely significantly different from each of the other four types (p < 0.001), while no significant difference was detected between the other four types.
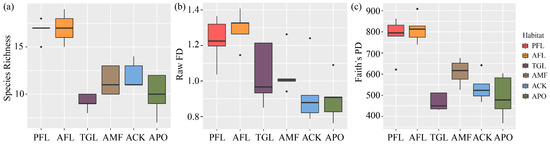
Figure 4.
The taxonomic diversity (a), functional diversity (b), and phylogenetic diversity (c) of bird communities in six different land use types. Land use type codes are as follows: PFL—planting farmland; AFL—abandoned farmland; TGL—typical grassland; AMF—artificial mixed forest; ACK—artificial Caragana korshinskii forest; APO—artificial Platycladus orientalis forest.
3.2. Functional Diversity
The results concerning functional diversity indicated highly significant differences among the land use types (ANOVA: F = 6.438, p < 0.001). Specifically, AFL showed significant differences when compared to the ACK and the APO (p < 0.01), while PFL exhibited differences compared to the ACK and the APO (p < 0.05) (Figure 4b).
In terms of the functional diversity indices, multiple comparisons revealed that the FRic of bird communities was significantly higher in PFL and AFL compared to in the ACK and the APO. Differences in FEve were observed among TGL, the ACK, and the APO, but they were not significant (Table 1). Highly significant differences in FDiv were found between AFL and the AMF, the ACK, and the APO but were significantly higher in PFL and TGL than in the AMF and the ACK, and differences were observed with the APO (Table 1), indicating the lowest FDiv in the three plantations.

Table 1.
Multiple comparisons of functional diversity indices were performed for birds among the different land use types.
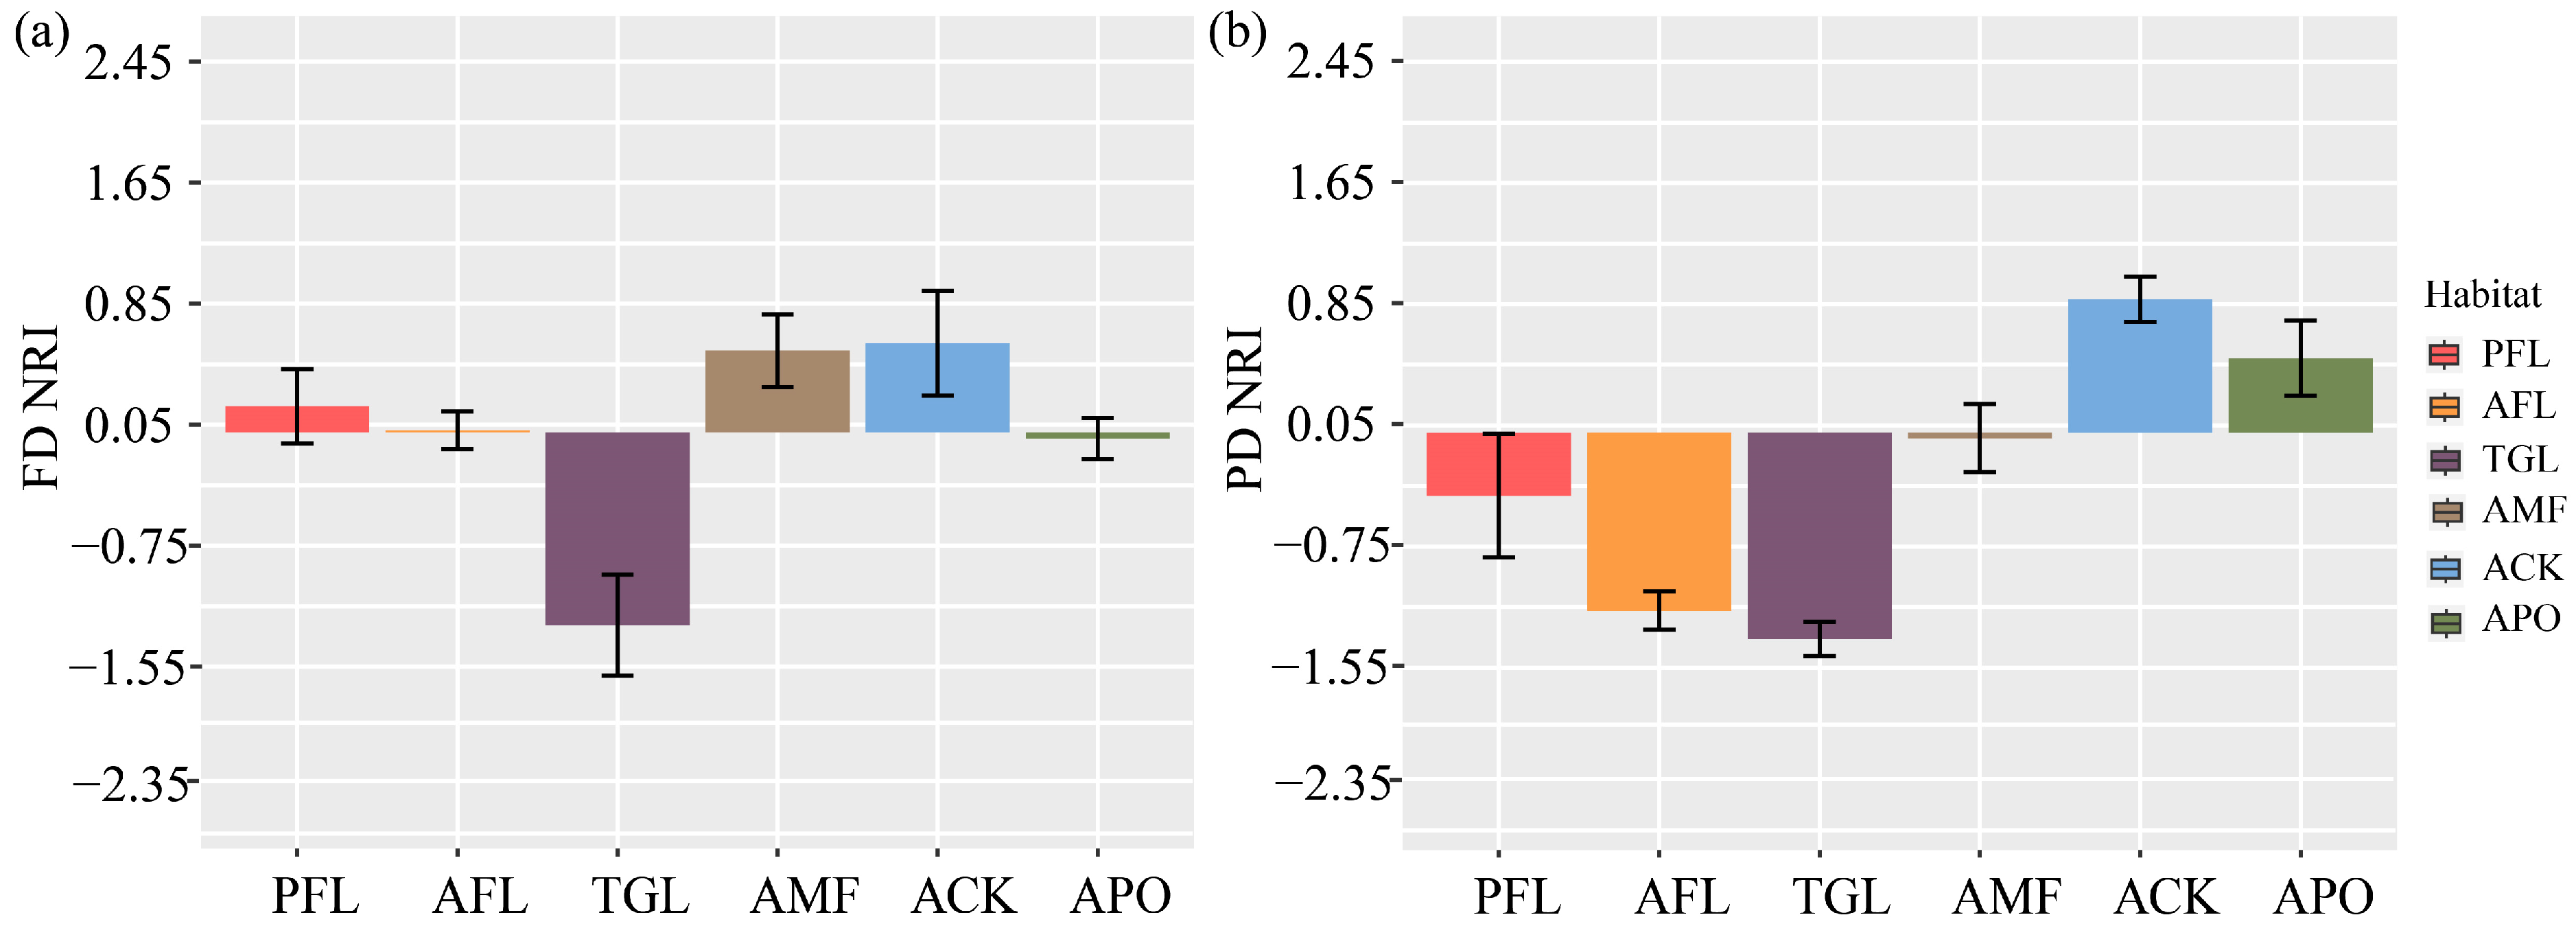
Multiple comparisons of functional structure showed highly significant differences among land use types (ANOVA: F = 7.175, p < 0.001) (Figure 5a). With the exception of TGL, which had a discrete functional structure, all other land use types showed aggregation. Among them, TGL was extremely significantly different from the ACK and the AMF (p < 0.001), significantly different from PFL (p < 0.01), and different from AFL and the APO (p < 0.05).

Figure 5.
(a,b) represent multiple comparisons of the functional and phylogenetic structure of bird communities were conducted across various land use types. FD—functional diversity; PD—phylogenetic diversity; NRI—net relatedness index. Land use type codes are as follows: PFL—planting farmland; AFL—abandoned farmland; TGL–typical grassland; AMF—artificial mixed forest; ACK—artificial Caragana korshinskii forest; APO—artificial Platycladus orientalis forest.
3.3. Phylogenetic Diversity
ANOVA revealed highly significant differences in PD among the different land use types (F = 20.1, p <0.001) (Figure 4c). Post hoc tests indicated extremely significant differences between AFL and the ACK, PFL and the ACK, AFL and the APO, AFL and TGL, PFL and the APO, and PFL and TGL (p < 0.001), as well as significant differences between AFL and the AMF (p < 0.01), and differences between PFL and the AMF (p < 0.05).
Multiple comparisons of bird phylogenetic structures showed highly significant differences among the land use types (ANOVA: F = 14.47, p < 0.001). The two land use types with aggregated structures were the ACK and the APO, while the remaining four land use types had structurally discrete patterns (Figure 5b). Among them, the post hoc test indicated extremely significant differences between AFL and the ACK, AFL and the APO, TGL and the APO (p < 0.001), and significant differences between PFL and the ACK, the AMF and TGL (p < 0.01), as well as differences between AFL and the AMF (p < 0.05).
3.4. β–Diversity
Bird communities displayed a consistent pattern of taxonomic, functional, and phylogenetic β-diversity, with turnover being higher than nestedness (Figure 6a–c, Table S3). When comparing the different components of β-diversity across the three dimensions, taxonomic total dissimilarity and turnover were lower than their functional counterparts but higher than their phylogenetic counterparts. However, functional and phylogenetic nestedness were higher than their taxonomic counterparts. Phylogenetic turnover was lower than functional turnover, while nestedness showed a consistent pattern (Table S3). Regression analysis further revealed a significant positive relationship between taxonomic total dissimilarity, and both functional and phylogenetic total dissimilarity also demonstrated a significant increase (Figure S3).
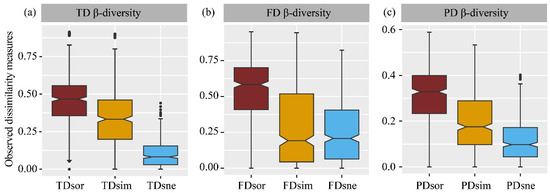
Figure 6.
Comparison among different components of taxonomic (a), functional (b) and phylogenetic β-diversity (c) in birds. TD—taxonomic diversity; FD—functional diversity; PD—phylogenetic diversity; sor—Sørensen dissimilarity; sim—turnover; sne—nestedness.
4. Discussion
4.1. Different Responses of Taxonomic Diversity to Land Use Change
Our analyses indicate that there is a resemblance in bird species composition between farmland and abandoned farmland, which aligns with previous studies examining the response of planting farmland birds to cropland abandonment. Particularly, the composition of birds in abandoned farmland was predominantly composed of farmland birds [42]. Moreover, species richness in both farmland and abandoned farmland was higher compared to in the other four land use types, suggesting that these habitats support more species than they lose. Several factors contribute to this phenomenon. First, both farmland and abandoned farmland exhibit more intricate vegetation compositions (Table S4) and are accompanied by artificially planted trees at an appropriate age for nesting and breeding. This condition may draw and provide support for specific bird species. Additionally, the presence of human habitation in farmland areas may indirectly provide food and water resources, contributing to the higher species richness observed in these habitats. Furthermore, the planting of forests has increased the habitat for some forest-dependent bird species, such as Phylloscopus armandii and Phylloscopus trochiloides. However, it is important to note that these planted forests may have caused the loss of habitat for species originally found in the area. For example, even though the species diversity of the three planted forests was higher than that of typical grassland, species such as Alectoris magna, Perdix dauurica, and Carpodacus synoicus, which prefer typical grassland habitat, were not found in the planted forests. This suggests that the planted forests have caused suitable habitats for these species to decrease, and for the protection of the Chinese endemic species Alectoris magna, it is crucial to conserve its original habitat.
The results of this study further showed that the species richness of birds in artificial mixed forests was significantly higher compared to in two types of planted monocultures, which is consistent with findings from previous studies investigating bird diversity in different forest types [43]. This could be attributed to the fact that artificial mixed forests have more complex vertical stratification and can provide habitats for a greater variety of forest species, making them the most unique among the six land use types with six species. Conversely, monoculture forests are characterized by uniformity in terms of tree species, age, structure, and spacing, along with a straightforward composition of the vegetation (Table S4). They lack the natural heterogeneity typical of ecosystems, which can pose challenges in preserving a diverse range of biodiversity.
4.2. Different Responses of Functional Diversity to Land Use Change
In comparison to farmland and abandoned farmland, artificial planted forests do not host larger-sized bird species like the Alectoris magna, Perdix dauurica, Columba rupestris, and Pica pica. Moreover, artificial plantations tend to be predominantly occupied by smaller insectivorous birds, with less representation from other dietary guilds (Table S2, Figure S4). This leads to noticeable distinctions in the raw functional diversity among land use types, with the highest functional diversity observed in farmland and abandoned farmland. This pattern aligns with the results for functional richness, suggesting that birds in farmland and abandoned farmland effectively utilize available spatial resources and occupy a wider range of ecological niches [8]. These habitats play a crucial role in maintaining functional diversity at the landscape scale. However, despite the significant increase in species richness in planted forests compared to in typical grassland, there was no difference between raw functional diversity and functional richness. This suggests that although land use change led to an increase in species, it did not compensate for the loss of many functional trait combinations [44].
Planted forests can lead to a simplification of the understory vegetation structure, especially monoculture forests (Table S4), resulting in the loss or alteration of the microenvironment. This can have consequences for the availability of resources, such as fruits and herbs, and the reduction of resources may favor some species while excluding others. As a result, a niche filter structure emerges, where environmental constraints, such as food shortages and habitat loss, act as “filters” for species with suitable characteristics [45]. To put it differently, the simplified vegetation in these land types has, to some extent, diminished the need for enhanced locomotor capabilities [3]. This measure of niche differentiation can be explained by functional divergence [8]. Our study found that the functional divergence of birds was lower and significantly different in plantations than in the other three land use types. This further suggests that deficit of resources even when previous land use types are converted to plantations, a conclusion that is generally consistent with studies examining the impact of arthropod functional traits on land use type conversion [46]. It also provides insight into the threat that land use type change can pose to specific traits [46].
Functional structure, as a complement to functional diversity, offers valuable insights into the ecological processes shaping community composition [37]. Our examination of functional structure has unveiled that typical grasslands display a distinct structure, signifying that the functional traits of bird species in typical grasslands exhibit more dissimilarity than what would be predicted randomly, as indicated by a negative net relatedness index value. Consequently, we speculate that competition exclusion likely plays a significant role in the community assembly process. This can be observed through the higher prevalence of dominant species, such as Pyrrhocorax pyrrhocorax, Columba rupestris, Alectoris magna, and Phoenicurus ochruros, which are distantly related and exhibit significant differences in functional traits. Conversely, other land types showcase a clustered functional structure, implying that the functional traits of bird species are more alike than what would be randomly anticipated. This phenomenon may be attributed to environmental factors such as the provision of concealed spaces (e.g., shrubs and trees) and food resources.
4.3. Different Responses of Phylogenetic Diversity to Land Use Change
Phylogenetic diversity mirrors the evolutionary history of a community [14] and carries inherent significance in conserving biodiversity [47,48]. In general, studies indicate that alterations in land use tend to adversely affect the phylogenetic diversity of bird communities [3,49,50]. Our study detected significant differences in bird phylogenetic diversity between agricultural and abandoned lands and planted forests, indicating that changes in land use types led to a loss of phylogenetic diversity, further confirming the findings of the aforementioned study. Furthermore, the phylogenetic structure exhibited non-random arrangements across different land use types. In planted forests, this structure tended to exhibit a clustered pattern. Consequently, we anticipated that in environments with limited resources due to human activities, only species with close genetic relationships and similar functional traits could coexist. Among other discrete land types, species exhibited relatively distant phylogenetic relationships but shared a consistent intrinsic preference for habitat [51]. In general, these findings underscore the notion that functional and phylogenetic diversity cannot entirely replace one another in elucidating community assembly processes to some extent [51,52]. They can, however, be effectively combined in future research studies.
4.4. Different Responses of β-Diversity to Land Use Change
The concepts of turnover and nestedness arise from two opposing processes, namely species replacement and species loss, which influence changes in community composition across different environments [3,38]. Taxonomic β-diversity provides insights into species-specific responses to the environment and primarily reflects the dispersal constraints of focal taxa [53]. Our findings on the species β-diversity components of birds in various land use types suggest that species turnover, driven by environmental factors or spatial constraints, plays a critical role in shaping differences in community composition. Limited spatial availability increases the likelihood of non-shared species in different habitats, meaning that only a few species occupy each site. Therefore, the increase in β-diversity between sites is mainly determined by species turnover [54].
Regarding phylogeny, β-diversity arises from historical isolation on an evolutionary scale [55,56]. The observed phylogenetic β-diversity in bird communities aligns with the taxonomic β-diversity, which is primarily driven by turnover. This indicates significant genealogical substitution between communities, where the communities do not differ significantly in the amount of phylogenetic information they contain. Similarly to taxonomic and phylogenetic patterns, functional turnover in bird communities results in differences in functional traits, which represent adaptive strategies for species to thrive in specific environmental conditions of habitats [57]. Hence, this occurrence can be explained by dispersed environmental factors [58].
4.5. Implications for Biodiversity Conservation
In this study, we conducted a comprehensive assessment of the impacts of land use change on bird diversity in the semi-arid region of the Loess Plateau. Our findings revealed significant effects of land use changes on bird species composition, particularly affecting narrowly distributed species such as Alectoris magna and Perdix dauurica. The multidimensional diversity of birds, including taxonomic, functional, and phylogenetic diversity, showed a decrease, especially in planted forests. The conservation of faunal diversity in planted forests is highly dependent on their vertical structural stratification and the complexity of understory vegetation [59]. Previous evidence has indicated that bird species richness is significantly lower in tropical planted forests lacking understory vegetation compared to in Eucalyptus plantations with native vegetation [60]. In our study, the artificial Platycladus orientalis forest exhibited simple understory vegetation and the low multidimensional diversity of birds, indicating a low conservation value. This was followed by the artificial Caragana korshinskii forest. These findings align with a recent study on global ecosystem services, which emphasized the poor performance of structurally homogenized planted forests, particularly in arid and semi-arid zones [61]. Based on our findings, we recommend using taxonomic diversity as an early detection system in the semi-arid regions of the Loess Plateau. However, incorporating functional and phylogenetic diversity as supplementary approaches can provide more valuable insights for maintaining key ecosystem functions and services [3]. This could help prevent further changes in existing land use types and address dynamic threats to biodiversity from current and future environmental conditions.
Supplementary Materials
The following supporting information can be downloaded at https://www.mdpi.com/article/10.3390/d16040235/s1, Table S1: Functional traits used for functional characterization of the bird, Table S2: Bird composition of different land use types, Table S3: Comparisons of different components of multidimensional β diversity in birds, Table S4: Composition of common plant species in different land use types, Figure S1: Bird diversity estimates across land use types, Figure S2: Percentage proportions of raw abundances of the 10 most abundant birds, Figure S3: Relationships between total TD dissimilarity with total FD and PD dissimilarity of birds, Figure S4: Distribution of avian dietary guilds in different land use types [62,63,64,65].
Author Contributions
Conceptualization, R.M., L.Z. and D.Z.; methodology, R.M. and D.Z.; formal analysis, R.M. and L.Z.; investigation, R.M., D.Z., Q.Z. and Y.W.; data curation, R.M. and L.Z.; writing—original draft preparation, R.M.; writing—review and editing, R.M., D.Z., Q.Z., Y.W. and L.Z.; visualization, R.M. All authors have read and agreed to the published version of the manuscript.
Funding
This research was funded by Lanzhou Government Finance Project (grant no. 20221124-(22)0568), Science and Technology Project of Gansu (grant no. 18JR2RA009), Gansu Province Intellectual Property Project (grant no. 22ZSCQD01).
Institutional Review Board Statement
Not applicable.
Data Availability Statement
Data and code available on request.
Acknowledgments
We highly thank anonymous reviewers for their insightful comments and suggestions. We are deeply grateful for the assistance provided by the staff at the forestry field during the data collection process.
Conflicts of Interest
The authors have no financial or personal interests that could affect this work to declare.
References
- Hooper, D.U.; Chapin, F.S., III; Ewel, J.J.; Hector, A.; Inchausti, P.; Lavorel, S.; Lawton, J.H.; Lodge, D.M.; Loreau, M.; Naeem, S.; et al. Effects of biodiversity on ecosystem functioning: A consensus of current knowledge. Ecol. Monogr. 2005, 75, 3–35. [Google Scholar] [CrossRef]
- Newbold, T.; Hudson, L.N.; Hill, S.L.L.; Contu, S.; Lysenko, I.; Senior, R.A.; BörgeR, L.; Bennett, D.J.; Choimes, A.; Collen, B.; et al. Global effects of land use on local terrestrial biodiversity. Nature 2015, 520, 45–50. [Google Scholar] [CrossRef] [PubMed]
- Rurangwa, M.L.; Aguirre-Gutiérrez, J.; Matthews, T.J.; Niyigaba, P.; Wayman, J.P.; Tobias, J.A.; Whittaker, R.J. Effects of land-use change on avian taxonomic, functional and phylogenetic diversity in a tropical montane rainforest. Divers. Distrib. 2021, 27, 1732–1746. [Google Scholar] [CrossRef]
- Si, X.F.; Cadotte, M.W.; Zeng, D.; Baselga, A.; Zhao, Y.H.; Li, J.Q.; Wu, Y.R.; Wang, S.Y.; Ding, P. Functional and phylogenetic structure of island bird communities. J. Anim. Ecol. 2017, 86, 532–542. [Google Scholar] [CrossRef] [PubMed]
- Semenchuk, P.; Plutzar, C.; Kastner, T.; Matej, S.; Bidoglio, G.; Erb, K.-H.; Essl, F.; Haberl, H.; Wessely, J.; Krausmann, F.; et al. Relative effects of land conversion and land-use intensity on terrestrial vertebrate diversity. Nat. Commun. 2022, 13, 615. [Google Scholar] [CrossRef] [PubMed]
- Alexander, J.; Ehlers Smith, D.A.; Ehlers Smith, Y.C.; Downs, C. Drivers of fine-scale avian functional diversity with changing land use: An assessment of the effects of eco-estate housing development and management. Landsc. Ecol. 2019, 234, 537–549. [Google Scholar] [CrossRef]
- Petchey, O.L.; Gaston, K.J. Functional diversity (FD), species richness and community composition. Ecol. Lett. 2002, 5, 402–411. [Google Scholar] [CrossRef]
- Mason, N.W.H.; Mouillot, D.; Lee, W.G. Functional richness, functional evenness and functional divergence: The primary components of functional diversity. Oikos 2005, 111, 112–118. [Google Scholar] [CrossRef]
- Villéger, S.; Mason, N.W.H.; Mouillot, D. New multidimensional functional diversity indices for a multifaceted framework in functional ecology. Ecology 2008, 89, 2290–2301. [Google Scholar] [CrossRef]
- Mouchet, M.A.; Villéger, S.; Mason, N.W.H.; Mouillot, D. Functional diversity measures: An overview of their redundancy and their ability to discriminate community assembly rules. Funct. Ecol. 2010, 24, 867–876. [Google Scholar] [CrossRef]
- Etard, A.; Pigot, A.L.; Newbold, T. Intensive human land uses negatively affect vertebrate functional diversity. Ecol. Lett. 2022, 25, 330–343. [Google Scholar] [CrossRef] [PubMed]
- Allan, E.; Manning, P.; Alt, F.; Binkenstein, J.; Blaser, S.; Blüthgen, N.; Böhm, S.; Grassein, F.; Hölzel, N.; Klaus, V.H.; et al. Land use intensification alters ecosystem multifunctionality via loss of biodiversity and changes to functional composition. Ecol. Lett. 2015, 18, 834–843. [Google Scholar] [CrossRef] [PubMed]
- Flynn, D.F.B.; Gogol-Prokurat, M.; Nogeire, T.; Molinari, N.; Richers, B.T.; Lin, B.B.; Simpson, N.; Mayfield, M.M.; DeClerck, F. Loss of functional diversity under land use intensification across multiple taxa. Ecol. Lett. 2009, 12, 22–33. [Google Scholar] [CrossRef] [PubMed]
- Faith, D.P. Conservation evaluation and phylogenetic diversity. Biol. Conserv. 1992, 61, 1–10. [Google Scholar] [CrossRef]
- Mouquet, N.; Devictor, V.; Meynard, C.N.; Munoz, F.; Bersier, L.-F.; Chave, J.; Couteron, P.; Dalecky, P.; Fontaine, C.; Gravel, D.; et al. Ecophylogenetics: Advances and perspectives. Biol. Rev. 2012, 87, 769–785. [Google Scholar] [CrossRef] [PubMed]
- Cadotte, M.W.; Carscadden, K.; Mirotchnick, N. Beyond species: Functional diversity and the maintenance of ecological processes and services. J. Appl. Ecol. 2011, 48, 1079–1087. [Google Scholar] [CrossRef]
- Cadotte, M.W.; Dinnage, R.; Tilman, D. Phylogenetic diversity promotes ecosystem stability. Ecology 2012, 93, 223–233. [Google Scholar] [CrossRef]
- Davies, J.; Poulsen, L.; Schulte-Herbrüggen, B.; Mackinnon, K.; Crawhall, N.; Henwood, W.D.; Dudley, N.; Smith, J.; Gudka, M. Conserving Dryland Biodiversity; IUCN (International Union for the Conservation of Nature): Nairobi, Kenya, 2012. [Google Scholar]
- Wang, Y.Q.; Shao, M.A.; Liu, Z.P.; Warrington, D.N. Investigation of factors controlling the regional-scale distribution of dried soil layers under forestland on the Loess Plateau, China. Surv. Geophys. 2012, 33, 311–330. [Google Scholar] [CrossRef]
- Gao, H.D.; Pang, G.W.; Li, Z.B.; Cheng, S.D. Evaluating the potential of vegetation restoration in the Loess Plateau. Acta Geogr. Sin. 2017, 72, 863–874. [Google Scholar]
- Zhu, Y.; Wang, Y.F.; Chen, L.D. Responses of ground-active arthropods to black locust (Robinia pseudoacacia L.) afforestation in the Loess Plateau of China. Catena 2019, 183, 104233. [Google Scholar] [CrossRef]
- Yang, X.; Shao, M.A.; Li, T.C.; Gan, M.; Chen, M.Y. Community characteristics and distribution patterns of soil fauna after vegetation restoration in the northern Loess Plateau. Ecol. Indic. 2021, 122, 107236. [Google Scholar] [CrossRef]
- Guan, C.; Chen, N.; Dong, X.X.; Wei, X.L.; Zhao, C.M. Responses of biological soil crusts to different types of vegetation restoration on the Chinese Loess Plateau: A case study. Restor. Ecol. 2022, 31, e13805. [Google Scholar] [CrossRef]
- Zheng, Y.; Chen, N.; Yu, K.L.; Zhao, C.M. The effects of fine roots and arbuscular mycorrhizal fungi on soil macropores. Soil Tillage Res. 2023, 225, 105528. [Google Scholar] [CrossRef]
- Hutto, R.L.; Pletschet, S.M.; Hendricks, P. A fixed-radius point count method for nonbreeding and breeding season use. Auk 1986, 103, 593–602. [Google Scholar] [CrossRef]
- Ralph, C.J.; Sauer, J.R.; Droege, S. Monitoring Bird Populations by Point Counts; Pacific Southwest Research Station: Placerville, CA, USA, 1995.
- Miles, D.B.; Ricklefs, R.E.; Travis, J. Concordance of ecomorphological relationships in three assemblages of passerine birds. Am. Nat. 1987, 129, 347–364. [Google Scholar] [CrossRef]
- Freeman, B.G.; Weeks, T.; Schluter, D.; Tobias, J.A. The latitudinal gradient in rates of evolution for bird beaks, a species interaction trait. Ecol. Lett. 2022, 25, 635–646. [Google Scholar] [CrossRef] [PubMed]
- Tobias, J.A.; Cornwallis, C.K.; Derryberry, E.P.; Claramunt, S.; Brumfield, R.T.; Seddon, N. Species coexistence and the dynamics of phenotypic evolution in adaptive radiation. Nature 2014, 506, 359–363. [Google Scholar] [CrossRef] [PubMed]
- Dawideit, B.A.; Phillimore, A.B.; Laube, I.; Leisler, B.; Böhning-Gaese, K. Ecomorphological predictors of natal dispersal distances in birds. J. Anim. Ecol. 2009, 78, 388–395. [Google Scholar] [CrossRef] [PubMed]
- Claramunt, S.; Derryberry, E.P.; Remsen, J.V., Jr.; Brunfield, R.T. High dispersal ability inhibits speciation in a continental radiation of passerine birds. Proc. R. Soc. B 2012, 279, 1567–1574. [Google Scholar] [CrossRef]
- Jetz, W.; Thomas, G.H.; Joy, J.B.; Hartmann, K.; Mooers, A.O. The global diversity of birds in space and time. Nature 2012, 491, 444–448. [Google Scholar] [CrossRef]
- Conway, J.R.; Lex, A.; Gehlenborg, N. UpSetR: An R package for the visualization of intersecting sets and their properties. Bioinformatics 2017, 33, 2938–2940. [Google Scholar] [CrossRef] [PubMed]
- Bregman, T.P.; Lees, A.C.; MacGregor, H.E.A.; Darski, B.; de Moura, N.G.; Aleixo, A.; Barlow, J.; Tobias, J.A. Using avian functional traits to assess the impact of land-cover change on ecosystem processes linked to resilience in tropical forests. Proc. R. Soc. B 2016, 283, 20161289. [Google Scholar] [CrossRef] [PubMed]
- Laliberté, E.; Legendre, P.; Shipley, B.; Laliberté, M.E. Measuring Functional Diversity from Multiple Traits, and Other Tools for Functional Ecology. R Package Version 1.0-12. 2014. Available online: https://cran.r-project.org/web/packages/FD/index.html (accessed on 10 April 2024).
- Kembel, S.W.; Cowan, P.D.; Helmus, M.R.; Cornwell, W.K.; Morlon, H.; Ackerly, D.D.; Blomberg, S.P.; Webb, C.O. Picante: Rtools for integrating phylogenies and ecology. Bioinformatics 2010, 26, 1463–1464. [Google Scholar] [CrossRef]
- Webb, C.O.; Ackerly, D.D.; Kembel, S.W. Phylocom: Software for the analysis of phylogenetic community structure and trait evolution. Bioinformatics 2008, 24, 2098–2100. [Google Scholar] [CrossRef] [PubMed]
- Baselga, A. Partitioning the turnover and nestedness components of beta diversity. Glob. Ecol. Biogeogr. 2010, 19, 134–143. [Google Scholar] [CrossRef]
- Villéger, S.; Grenouillet, G.; Brosse, S. Decomposing functional β-diversity reveals that low functional β-diversity is driven by low functional turnover in European fish assemblages. Glob. Ecol. Biogeogr. 2013, 22, 671–681. [Google Scholar] [CrossRef]
- Baselga, A.; Orme, C.D.L. betapart: An R package for the study of beta diversity. Methods Ecol. Evol. 2012, 3, 808–812. [Google Scholar] [CrossRef]
- R Core Team. R: A Language and Environment for Statistical Computing; R Foundation for Statistical Computing: Vienna, Austria, 2021. [Google Scholar]
- Kamp, J.; Reinhard, A.; Frenzel, M.; Kämpfer, S.; Trappe, J.; Hölzel, N. Farmland bird responses to land abandonment in Western Siberia. Agric. Ecosyst. Environ. 2018, 268, 61–69. [Google Scholar] [CrossRef]
- Hua, F.Y.; Wang, X.Y.; Zheng, X.L.; Fisher, B.; Wang, L.; Zhu, J.G.; Tang, Y.; Yu, D.W.; Wilcove, D.S. Opportunities for biodiversity gains under the world’s largest reforestation programme. Nat. Commun. 2016, 7, 12717. [Google Scholar] [CrossRef] [PubMed]
- Potapov, A.M.; Dupérré, N.; Jochum, M.; Dreczko, K.; Klarner, B.; Barnes, A.D.; Krashevska, V.; Rembold, K.; Kreft, H.; Brose, U.; et al. Functional losses in ground spider communities due to habitat structure degradation under tropical land-use change. Ecology 2020, 101, e02957. [Google Scholar] [CrossRef]
- Rocha, J.; Laps, R.R.; Machado, C.G.; Campiolo, S. The conservation value of cacao agroforestry for bird functional diversity in tropical agricultural landscapes. Ecol. Evol. 2019, 9, 7903–7913. [Google Scholar] [CrossRef] [PubMed]
- Birkhofer, K.; Smith, H.G.; Weisser, W.W.; Wolters, V.; Gossner, M.M. Land-use effects on the functional distinctness of arthropod communities. Ecography 2015, 38, 889–900. [Google Scholar] [CrossRef]
- Mace, G.M.; Gittleman, J.L.; Purvis, A. Preserving the tree of life. Science 2003, 300, 1707–1709. [Google Scholar] [CrossRef] [PubMed]
- Winter, M.; Devictor, V.; Schweiger, O. Phylogenetic diversity and nature conservation: Where are we? Trends Ecol. Evol. 2013, 28, 199–204. [Google Scholar] [CrossRef] [PubMed]
- Frishkoff, L.O.; Karp, D.S.; M’Gonigle, L.K.; Mendenhall, C.D.; Zook, J.; Kremen, C.; Hadly, E.A.; Daily, G.C. Loss of avian phylogenetic diversity in neotropical agricultural systems. Science 2014, 345, 1343–1346. [Google Scholar] [CrossRef] [PubMed]
- Cosset, C.C.P.; Edwards, D.P. The effects of restoring logged tropical forests on avian phylogenetic and functional diversity. Ecol. Appl. 2017, 27, 1932–1945. [Google Scholar] [CrossRef] [PubMed]
- Sobral, F.L.; Cianciaruso, M.V. Functional and phylogenetic structure of forest and savanna bird assemblages across spatial scales. Ecography 2016, 39, 533–541. [Google Scholar] [CrossRef]
- Chapman, P.M.; Tobias, J.A.; Edwards, D.P.; Davies, R.G. Contrasting impacts of land-use change on phylogenetic and functional diversity of tropical forest birds. J. Appl. Ecol. 2018, 55, 1604–1614. [Google Scholar] [CrossRef]
- Bryant, J.A.; Lamanna, C.; Morlon, H.; Kerkhoff, A.J.; Enquist, B.J.; Green, J.L. Microbes on mountainsides: Contrasting elevational patterns of bacterial and plant diversity. Proc. Natl. Acad. Sci. USA 2008, 105, 11505–11511. [Google Scholar] [CrossRef]
- Chase, J.M.; Kraft, N.J.B.; Smith, K.G.; Vellend, M.; Inouye, B. Using null models to disentangle variation in community dissimilarity from variation in α-diversity. Ecosphere 2011, 2, 1–11. [Google Scholar] [CrossRef]
- Webb, C.O.; Ackerly, D.D.; McPeek, M.A.; Donoghue, M.J. Phylogenies and community ecology. Annu. Rev. Ecol. Evol. Syst. 2002, 33, 475–505. [Google Scholar] [CrossRef]
- Weinstein, B.G.; Tinoco, B.; Parra, J.L.; Brown, L.M.; McGuire, J.A.; Gary Stiles, F.; Graham, C.H. Taxonomic, phylogenetic, and trait beta diversity in South American hummingbirds. Am. Nat. 2014, 184, 211–224. [Google Scholar] [CrossRef]
- Kraft, N.J.B.; Adler, P.B.; Godoy, O.; James, E.C.; Fuller, S.; Levine, J.M. Community assembly, coexistence and the environmental filtering metaphor. Funct. Ecol. 2015, 29, 592–599. [Google Scholar] [CrossRef]
- Díaz, S.; Lavorel, S.; Chapin, F.S.; Tecco, P.A.; Gurvich, D.E.; Grigulis, K. Functional diversity—At the crossroads between ecosystem functioning and environmental filters. In Terrestrial Ecosystems in a Changing World; Springer: Berlin/Heidelberg, Germany, 2007; Chapter 7; pp. 81–91. [Google Scholar] [CrossRef]
- Mitra, S.S.; Sheldon, F.H. Use of an exotic tree plantation by Bornean lowland forest birds. Auk 1993, 110, 529–540. [Google Scholar] [CrossRef]
- Barlow, J.; Mestre, L.A.M.; Gardner, T.A.; Peres, C.A. The value of primary, secondary and plantation forests for Amazonian birds. Biol. Conserv. 2007, 136, 212–231. [Google Scholar] [CrossRef]
- Hua, F.Y.; Bruijnzeel, L.A.; Meli, P.; Martin, P.A.; Zhang, J.; Nakagawa, S.; Miao, X.R.; Wang, W.Y.; Mcevor, C.; Pena-Arancibia, J.L. The biodiversity and ecosystem service contributions and trade-offs of forest restoration approaches. Science 2022, 376, 839–844. [Google Scholar] [CrossRef] [PubMed]
- Tobias, J.A.; Sheard, C.; Pigot, A.L.; Devenish, A.J.; Yang, J.; Sayol, F.; Neate-Clegg, M.H.C.; Alioravainen, N.; Weeks, T.L.; Barber, R.A.; et al. AVONET: Morphological, ecological and geographical data for all birds. Ecol. Lett. 2022, 25, 581–597. [Google Scholar] [CrossRef] [PubMed]
- Wang, X.T. Vertebrate Fauna of Gansu Province; Gansu Science and Technology Press: Lanzhou, China, 1991. [Google Scholar]
- Wang, Y.P.; Song, Y.F.; Zhong, Y.Q.; Chen, C.W.; Zhao, Y.H.; Zeng, D.; Wu, Y.R.; Ding, P. A dataset on the life-history and ecological traits of Chinese birds. Biodivers. Sci. 2021, 29, 1149–1153. [Google Scholar] [CrossRef]
- Wilman, H.; Belmaker, J.; Simpson, J. EltonTraits 1.0: Species-level foraging attributes of the world’s birds and mammals: Ecological Archives E095-178. Ecology 2014, 95, 2027. [Google Scholar] [CrossRef]


Disclaimer/Publisher’s Note: The statements, opinions and data contained in all publications are solely those of the individual author(s) and contributor(s) and not of MDPI and/or the editor(s). MDPI and/or the editor(s) disclaim responsibility for any injury to people or property resulting from any ideas, methods, instructions or products referred to in the content. |
© 2024 by the authors. Licensee MDPI, Basel, Switzerland. This article is an open access article distributed under the terms and conditions of the Creative Commons Attribution (CC BY) license (https://creativecommons.org/licenses/by/4.0/).