Abstract
Ambrosia trifida is an invasive alien plant species, which has very high reproductive and environmental adaptability. Through strong resource acquisition ability and allelopathy, it could inhibit the growth and reproduction of surrounding plants and destroy the stability of an invasive ecosystem. It is very important to predict the change of suitable distribution area of A. trifida with climate change before implementing scientific control measures. Based on 106 A. trifida distribution data and 14 points of environmental data, the optimal parameter combination (RM = 0.1, FC = LQ) was obtained using the MaxEnt (version 3.4.1) model optimized by Kuenm package, and thus the potential suitable areas of A. trifida in Northeast China under three different climate scenarios (RCP2.6, RCP4.5, RCP8.5) with different emission intensities in the future (2050, 2070) were predicted. The changes of A. trifida suitable area in Northeast China under three climate scenarios were compared, and the relationship between the change of suitable area and emission intensity was analyzed. In general, the suitable area of A. trifida in Northeast China will expand gradually in the future, and the area of its highly suitable area will also increase with the increasing emission intensity, which is unfavorable to the control of A. trifida.
1. Introduction
Invasive alien plants (IAPs) are defined as the rapid growth, propagation and diffusion plants, which change the structure and composition of native plants, affect, threaten, or destroy local ecosystems [1]. In recent years, the continuous changes of global climate have led to the increase of global temperature and the frequent occurrence of extreme weather, which have weakened the resistance of some ecosystems and directly or indirectly promoted the invasive ability of some alien plants, having serious impacts on local life, production and ecology [2,3]. Invasive alien species have threatened many countries and regions around the world [4,5], seriously affecting the production of agriculture, forestry, animal husbandry and fisheries, as well as the stability of ecosystems, and it is one of the major drivers of current global biodiversity loss and ecosystem degradation [6].Therefore, the prevention and control of invasive species has become the key work of biodiversity protection and agricultural green development in many countries and regions [7]. In recent years, China has become one of the countries suffering the most serious biological invasion in the world, and biological invasion has caused great harm to the domestic ecological environment and agricultural production, which continuously intensify with the development of climate change and international trade [8]. Invasive weeds such as Solidago canadensis L., Alternanthera philoxeroides (Mart.) Griseb. and Ambrosia trifida L. have become well-known invasive species, which has caused great harm to people’s health, economic development and ecological environment [9].
Species distribution models (SDMs) use the distribution data of species and environment data and combine geographic map information, according to a specific algorithm to obtain species’ niche and reflect the species’ preference degree to the habitat in the form of probability, which is used to predict potential and future suitable distribution areas of species [10]. The development of species distribution models began with the development and application of BIOCLIM models, and over the next 20 years, HABITAT, DOMAIN, ecological niche factor analysis (ENFA), MaxEnt, the generalized linear model (GLM), generalized additive model (GAM), classification and regression tree (CART), boosted regression tree (BRT), artificial neural network (ANN), and other AI-based niche models have emerged [11]. In recent years, species distribution models have been widely used in conservation biology [12] and invasion biology [13]: they provides a lot of scientific basis and theoretical guidance for the protection of endangered animals and plants and the prevention and control of invasive species, biodiversity and ecosystem stability. MaxEnt is the most popular model, which has been proved to be the best model in species distribution modeling [14]. Elith et al. simulated the spatial distribution of 226 species in six different regions of the world and evaluated the prediction results of multiple species distribution models based on measured sample data: it has been concluded that the MaxEnt model has good performance [15]. It can scientifically predict the potential and future suitable distribution areas of species based on only the distribution data of species and environmental data, and even if the distribution data of species are small, the MaxEnt model can also obtain good prediction results. At present, MaxEnt is widely used to predict the potential niche of invasive alien plants, such as sorrel invasion in China [16], giant pigweed invasion in Europe [17] and composite invasive plants in China’s suitable areas.
Ambrosia trifida L. (Asteraceae) is an annual herbaceous plant native to the southwestern United States and northern Mexico. Circa the 1930s, through the import of goods and agricultural products, A. trifida spread into China’s southeastern coastal areas [18]. The results showed that A. trifida had high reproductive ability, dispersal ability and seed germination rate and could inhibit the growth and reproduction of surrounding plants through its strong resource acquisition ability and allelopathic effect, so as to form a single plant community and destroy the diversity and stability of the ecosystem in the invasion area [19]. Ambrosia trifida pollen is also a source of allergic reactions such as hay fever, allergic rhinitis and other diseases [20], and severe allergies can lead to concurrent emphysema, cor pulmonale and even death, which is a great threat to human health. Therefore, in various climate change scenarios, it is of particular importance to predict the future adaptive distribution of species on relevant spatiotemporal scales for the management of invasive alien species [21]. Based on the optimized MaxEnt niche model, the potential and future suitable distribution areas of A. trifida in Northeast China were forecasted using the distribution data of A. trifida in China, the environmental data of current and 2050, 2070 climate scenarios with different emission intensities (RCP2.6, RCP4.5, RCP8.5). It is of great significance to clarify the potential distribution and suitable rank of A. trifida in Northeast China, to formulate a control strategy, and to protect agriculture and forestry production and biodiversity.
2. Materials and Methods
2.1. Study Area
The Northeast China region covers an area of about 1.52 million km2 and is made up of China’s Liaoning, Jilin and Heilongjiang provinces, as well as five alliances in eastern Inner Mongolia. From south to north, the Northeast region spans two temperature zones, namely the mid-temperate zone and the cold temperate zone. The Northeast region has a temperate monsoon climate, with four distinct seasons, warm and rainy in summer and cold and dry in winter [22]. Due to its proximity to the Bohai Sea and the Yellow Sea, and the prevalence of monsoons in the southeast, the precipitation in the northeast gradually decreases from the southeast to the northwest, forming a humid region, semi-humid region, semi-arid region and arid region. In addition, the Northeast region is rich in forest resources, with high forest coverage extending the time of snow and ice melting, which provides sufficient water conditions for rich vegetation resources in the Northeast region [23]. At the same time, the Northeast region is closer in latitude to the origin of A. trifida (North America), and the two regions have similar hydrothermal conditions, leading to A. trifida being able to adapt quickly to local conditions after it first invaded Liaoning Province. Ambrosia trifida, with its large seed number and light weight, can be spread by wind, and Liaoning Province is located in the temperate continental monsoon area, where the southeast wind prevails in summer and the northeast wind prevails in winter: A. trifida forms a corresponding propagation path that varies according to the wind direction in each season [24].
2.2. Data Acquisition and Processing
The distribution data of A. trifida were obtained in two ways: (1) field investigation, using two-step software (outdoor assistant) and the website of natural herbarium to determine the detailed longitude and latitude coordinates of A. trifida distribution and to organize records; (2) through the Chinese Virtual Herbarium of the web resource platform (http://www.cvh.ac.cn/, accessed on 20 April 2022) and the China Nature Reserve specimen resource sharing platform (http://bhq.papc.cn/, accessed on 20 April 2022) and the Global Biodiversity Information Network GBIF (http://data.GBIF.org, accessed on 25 April 2022) for more detailed latitude and longitude information on the distribution of A. trifida. In order to reduce sampling deviation, reduce the spatial correlation and avoid over-fitting to the model results, it was necessary to screen the species distribution points. A total of 106 A. trifida distribution data points were obtained using ENMTools to screen and correct distribution points directly (Figure 1).
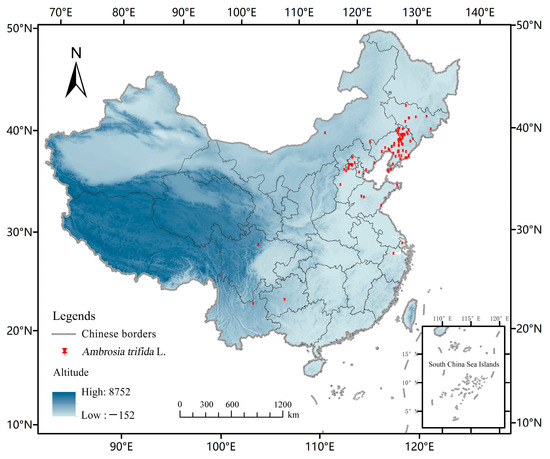
Figure 1.
Distribution Point data of Ambrosia trifida L. used in this study. The study used China-wide Ambrosia trifida L. data to predict its potential future distribution in the Northeast.
The current climate data used (1970–2000) and future climate data for different climate scenarios, CMIP5 (2050s and 2070s) were available from WorldClim Global Climate Data Version 1.4 (http://www.WorldClim.org, accessed on 23 November 2022).The spatial resolution is 2.5 arc-minutes, which consists of 19 bio-climatic factors such as annual average temperature and annual average precipitation. Ambrosia trifida in Northeast China was mainly introduced by man-made factors, and its spread and invasion were closely related to human activities. Therefore, the human impact index is considered in A. trifida modeling to increase the scientific and accurate prediction results and to assess the importance of human impact index on A. trifida invasion. The human impact index data were downloaded from the Socioeconomic Data and Applications Center, part of NASA’s National Aeronautics and Space Administration (https://sedac.ciesin.columbia.edu, accessed on 1 April 2023) [25]. The data were created from nine global data layers covering human population pressure (population density), human land use and infrastructure (built-up areas, nighttime lights, land use/land cover) and human access (coastlines, roads, railroads, navigable rivers). The downloaded human impact index data were converted into ASC data format using ArcGis (version 10.2) and 19 climatic factors to unify the coordinate system, resolution and spatial range.
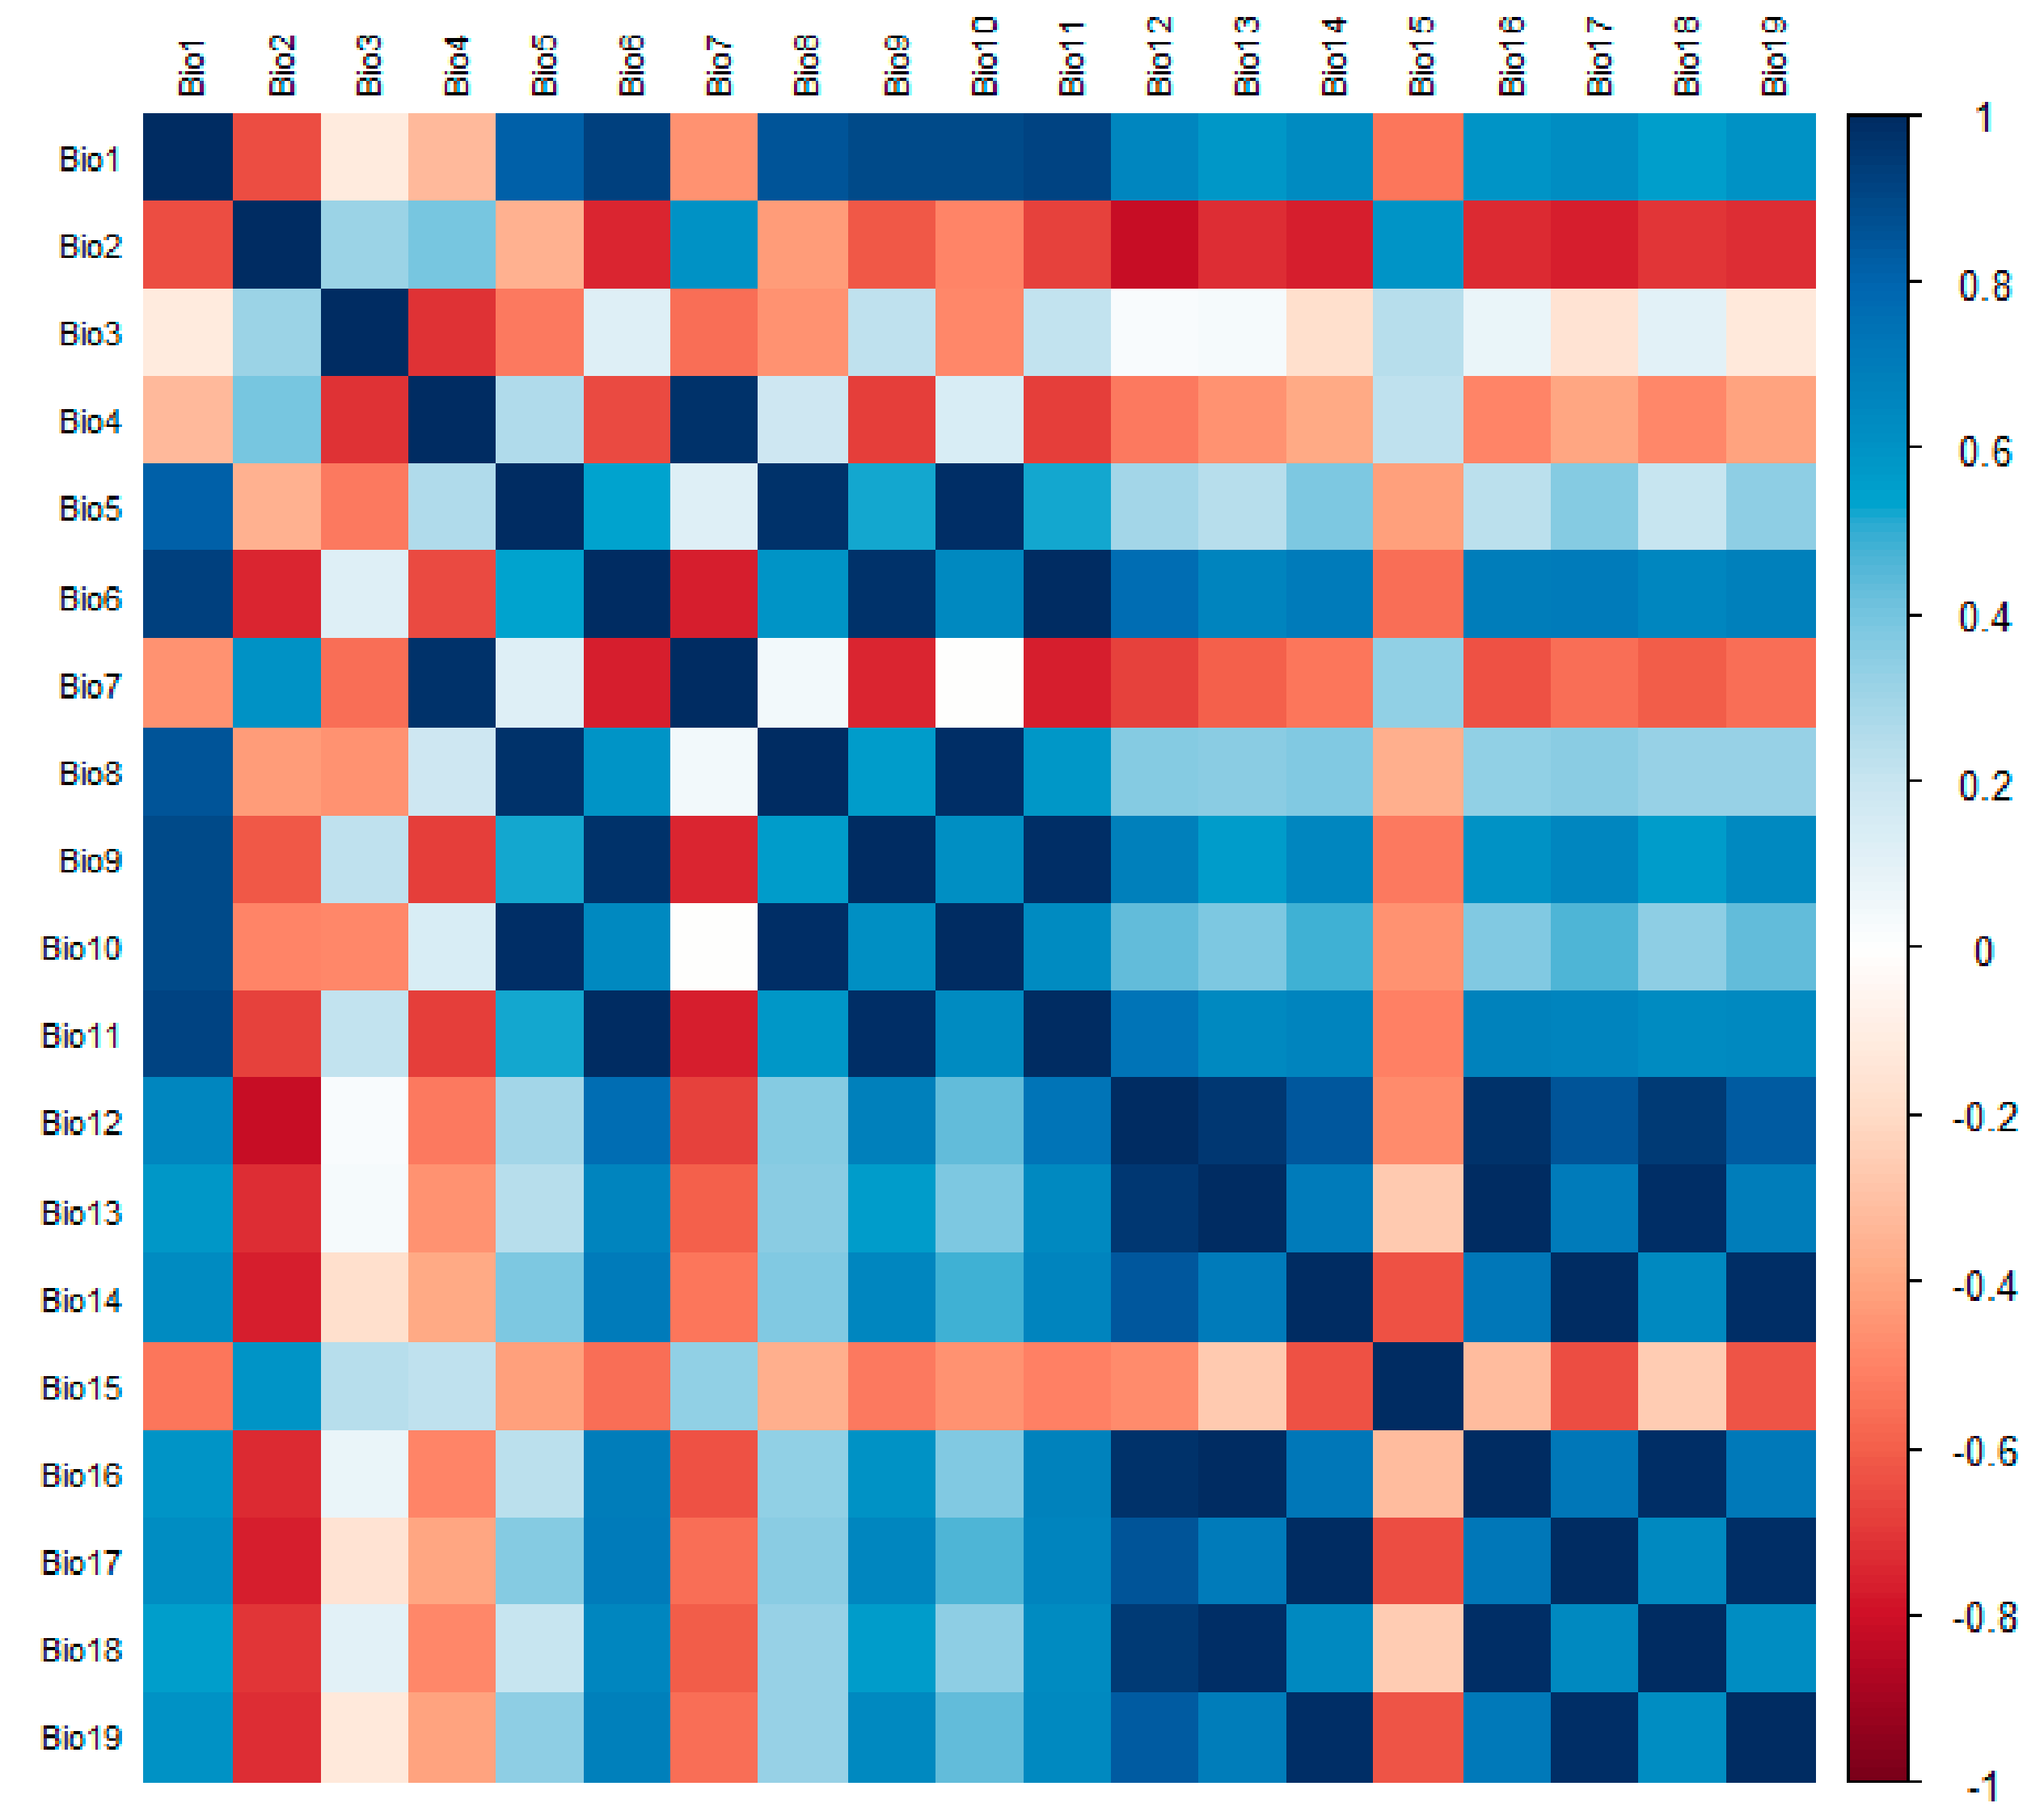
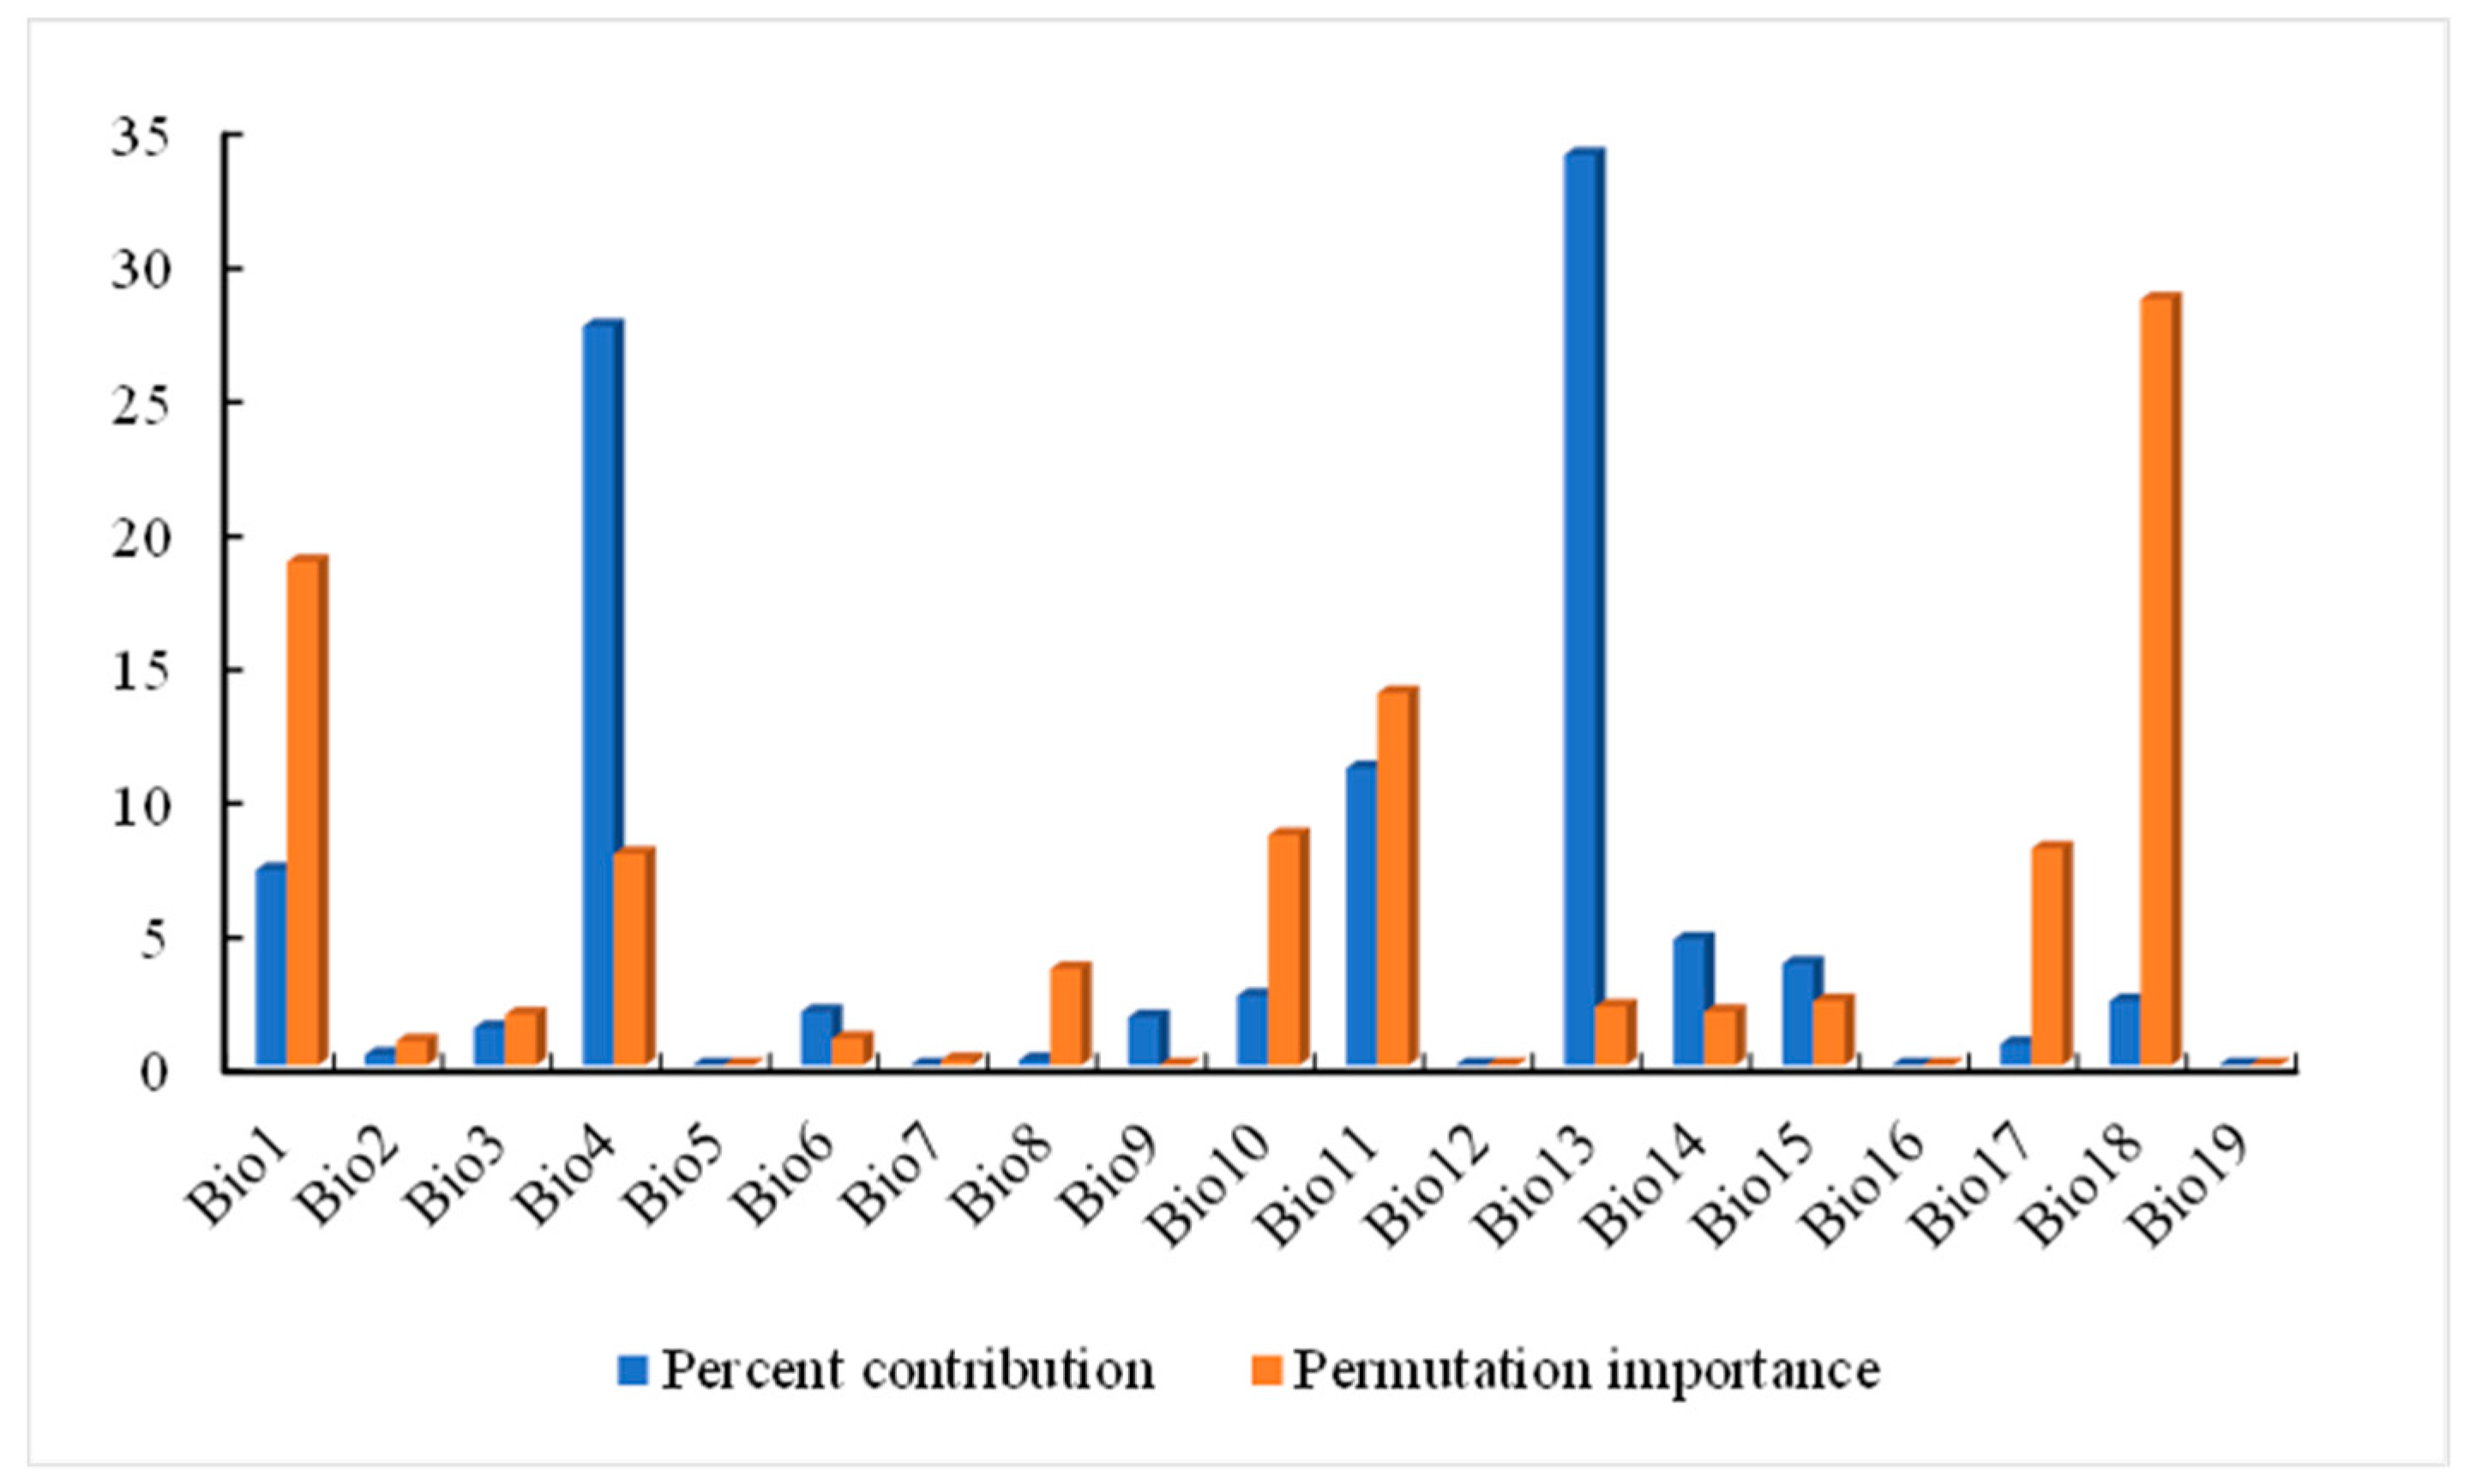
Since there is some correlation between each environmental factor, if used directly for modeling predictions, there may be overfitting that affects the accuracy of the maximum entropy model predictions [26]. If the correlation between the two environmental factors is |r| > 0.8, the one with the lower contribution rate of the environmental factor of the two is removed. Finally, the effective environmental variables were selected to predict the potential distribution of A. trifida using MaxEnt. In this study, 19 environmental factors were analyzed using ENMTools, and the correlation coefficients were obtained (Figure 2). At the same time, 13 environmental factors (Table 1) were selected to take part in the modeling of A. trifida according to the displacement importance and contribution rate of each environmental factor (Figure 3).

Figure 2.
The correlation among 19 environmental factors was analyzed using the package in R for the screening of environmental factors. (R 4.1.3: A statistical analysis software, statistical analysis and graphic display in one.).

Table 1.
Descriptions of 13 bio-environmental variables and one human impact index variable that participated in the modeling of Ambrosia trifida L.
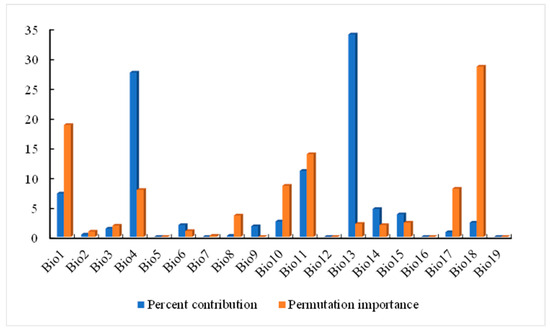
Figure 3.
The contribution rate and important values obtained from the Ambrosia trifida L. pre-experiment were used to screen for environmental factors.
2.3. MaxEnt Model Optimization and Result Evaluation
Relevant research shows that when the default parameters of MaxEnt are used to build the model, there may be serious overfitting. This can lead not only to misassessment of species niches, but also to misdirection of corresponding conservation and control policies [27]. Therefore, it is necessary to optimize feature combination (FC) and regularization multiplier (RM) in the MaxEnt model to build the optimal MaxEnt model [28]. By testing the combination of different FC and RM parameters, the AIC values of different parameter models were obtained to evaluate the complexity of the model, and the model with the lowest complexity was selected to build the optimal model [29]. In this study, the parameters of the A. trifida prediction model were optimized by using the Kuenm package in R, setting the RM parameter interval [0.1–4], each interval 0.1, and 29 FC feature function combinations. When the AIC value was the minimum, the AIC value was the lowest (delta AICc = 0), the model parameters were the best, and the distribution prediction model of A. trifida was established using the optimal parameters [30].
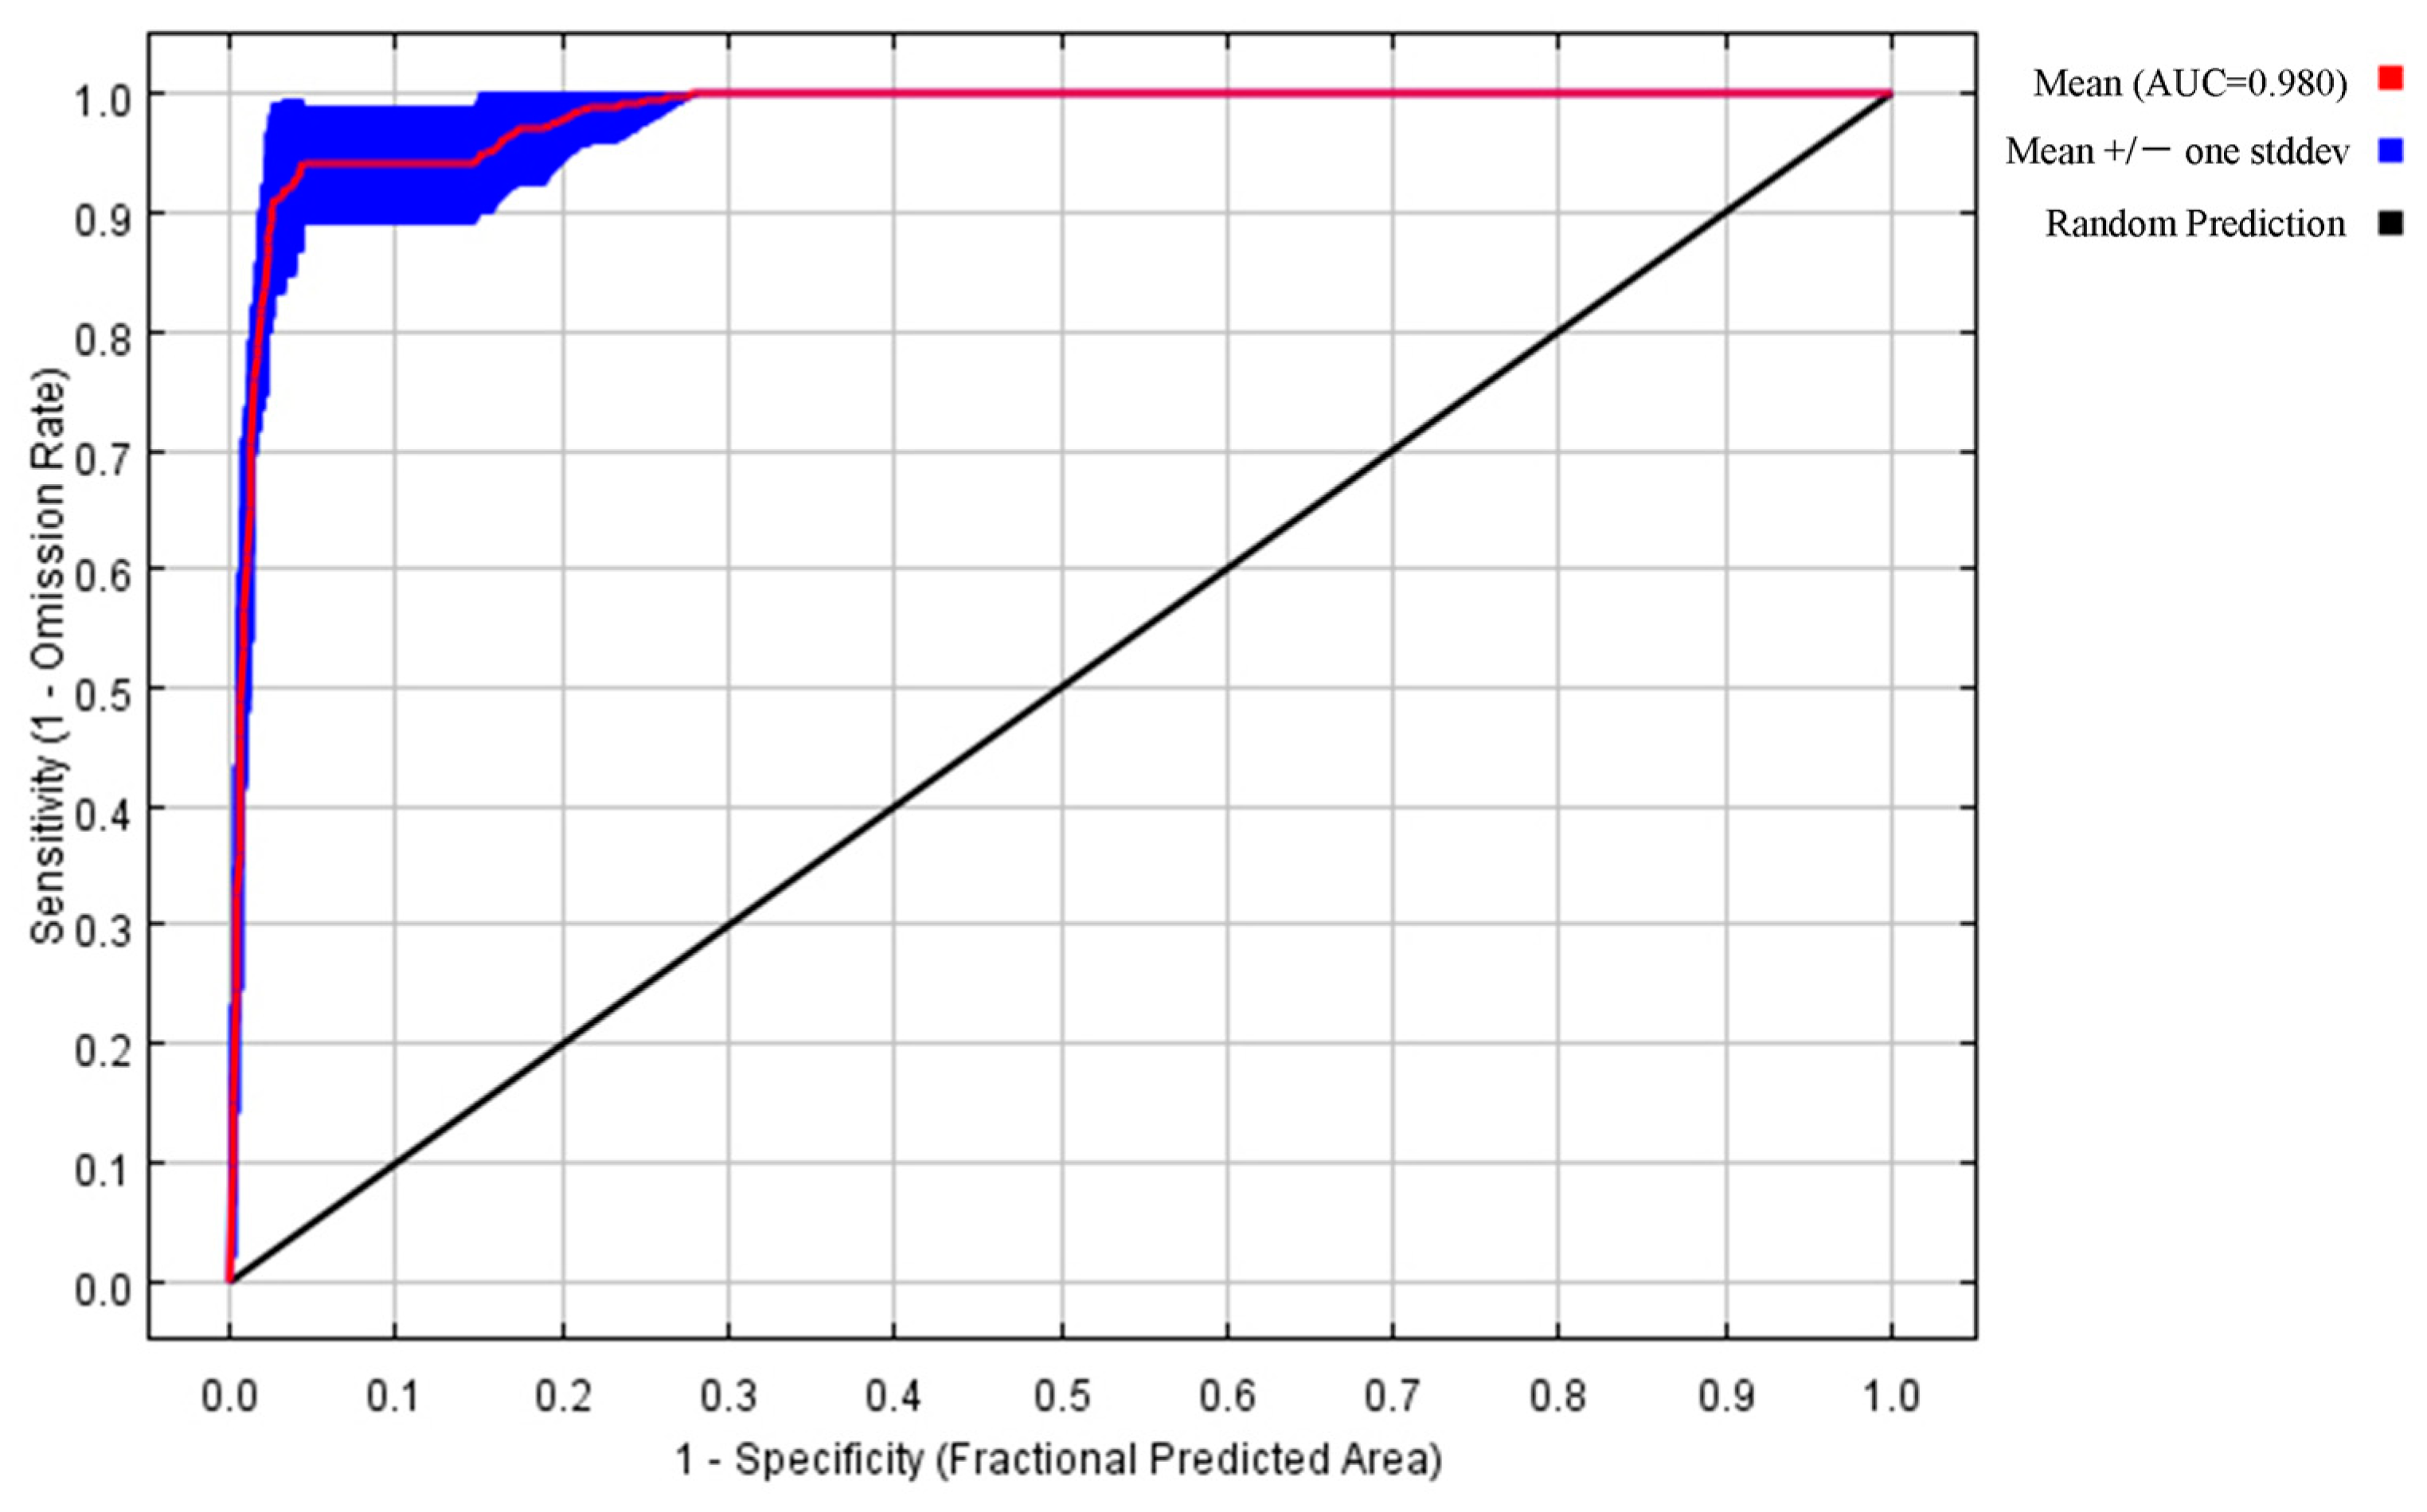
The software selected was Jackknife, the output format selected was the Logistic form, the percentage of random tests was set to 25%, the test was repeated 10 times, and the repeat mode selected was Crossvalidate [31]. The accuracy of the model was generally verified by the receiver operating characteristic curve (ROC). The area enclosed by the ROC curve and the horizontal axis was the AUC value, represented by the higher accuracy of the model’s predictions [32]. When AUC < 0.5, the predicted outcome was unavailable. When 0.5 ≤ AUC < 0.7, the model-predicted outcome was poor. When 0.7 ≤ AUC < 0.9, the model predicted outcome was good. When AUC ≥ 0.9, the model predicted outcome was very good. Only when the model had good accuracy did the prediction result have reference value and scientific value [33].
2.4. Classification and Area Statistics
The ASC format data of the distribution area was imported into ArcGis, and the raster value indicated the probability of A. trifida existence in the raster area. The larger the grid value, the greater the fitness coefficient of A. trifida in the region; the smaller the grid value, the smaller the fitness coefficient of A. trifida in the region. Then, using the reclassification tool in ArcGis and using manual classification, the habitat suitability of A. trifida was divided into four zones: high suitability zone (0.50–1.00), middle suitability zone (0.25–0.50), low suitability zone (0.12–0.25) and non-suitable zone (0–0.12). By calculating the ratio of the grid number of each suitable grade to the total grid number, the actual area of each suitable grade in the Northeast was calculated.
2.5. The Change of Spatial Pattern of Suitable Habitat
Using the SDMtoolbox in ArcGIS, the average files of the 10 run results of MaxEnt model under different climate scenarios were reclassified. The A. trifida spatial cell with a distribution probability less than 0.12 was defined as a non-adaptive area, which was assigned a value of 0; the A. trifida spatial cell with a distribution probability greater than or equal to 0.12 was defined as an adaptive area, which was assigned a value of 1. Binary A. trifida grid files which were suitable or not suitable for A. trifida growth were generated in a certain space unit under different climate scenarios in the future. Among them, 0 → 1 is the future expansion area of A. trifida, 1 → 0 is the future contraction area, and 1 → 1 is the stable invariant area.
2.6. Center-of-Mass Transfer in Suitable Habitat
By calculating the change of the centroid position of some species in different periods, we can reflect the developmental characteristics of the species on a space–time scale. The center-of-mass migration can reflect their developmental characteristics on the space-time scale. Before analyzing centroid migration, it is assumed that the species is capable of complete migration, regardless of uncontrollable factors such as interspecies interactions, human intervention and geographic barriers, and set the change of species spatial pattern as the environmental condition of complete migration. The center of mass of A. trifida was in the area where the distribution probability of A. trifida was greater than 0.12. Based on the center-of-mass transfer tool in SDMtoolbox of ArcGIS, the center-of-mass positions of A. trifida in different climate scenarios were calculated and compared, and the characteristics of temporal and spatial changes under future climate scenarios were analyzed.
3. Results
3.1. Model Optimization Results and Accuracy Evaluation
The default settings for the MaxEnt model were the regularization multiplier RM = 1 and the default feature function combination FC = LQPH. According to the optimization results of the A. trifida model and the AIC information criterion, when RM = 0.1, FC = LQ, the Delta-AICc = 0 in the A. trifida distribution model, and the model complexity was the lowest, Table 2 shows that the A. trifida optimization model was better than the distribution model with the default parameter settings, the ratio of the optimal model AUC value to the random prediction AUC value (1.9642) and the missing rate of test data (0.0385) were significantly better than the model with default parameters (1.829, 0.0769). Therefore, RM = 0.1 and FC = LQ were used to predict the distribution area of A. trifida, and the prediction results were more accurate. The optimal parameter setting was used to predict the potential distribution area of A. trifida, and the AUC value predicted by the optimization model was 0.98 (Figure 4), which was greater than 0.9. The results show that the model has good accuracy, reference value and scientific significance.
Table 2.
Comparison of Ambrosia trifida L. model parameter settings with default settings. When delta-aicc = 0, the model has the lowest complexity and the prediction result is more scientific.

Figure 4.
ROC curve of the prediction results of the MaxEnt model of Ambrosia trifida L. The area enclosed by the curve and the horizontal axis is the AUC value. An AUC value greater than 0.9 indicates that the prediction is good.
3.2. The Main Environmental Factors Affecting the Distribution of Ambrosia trifida
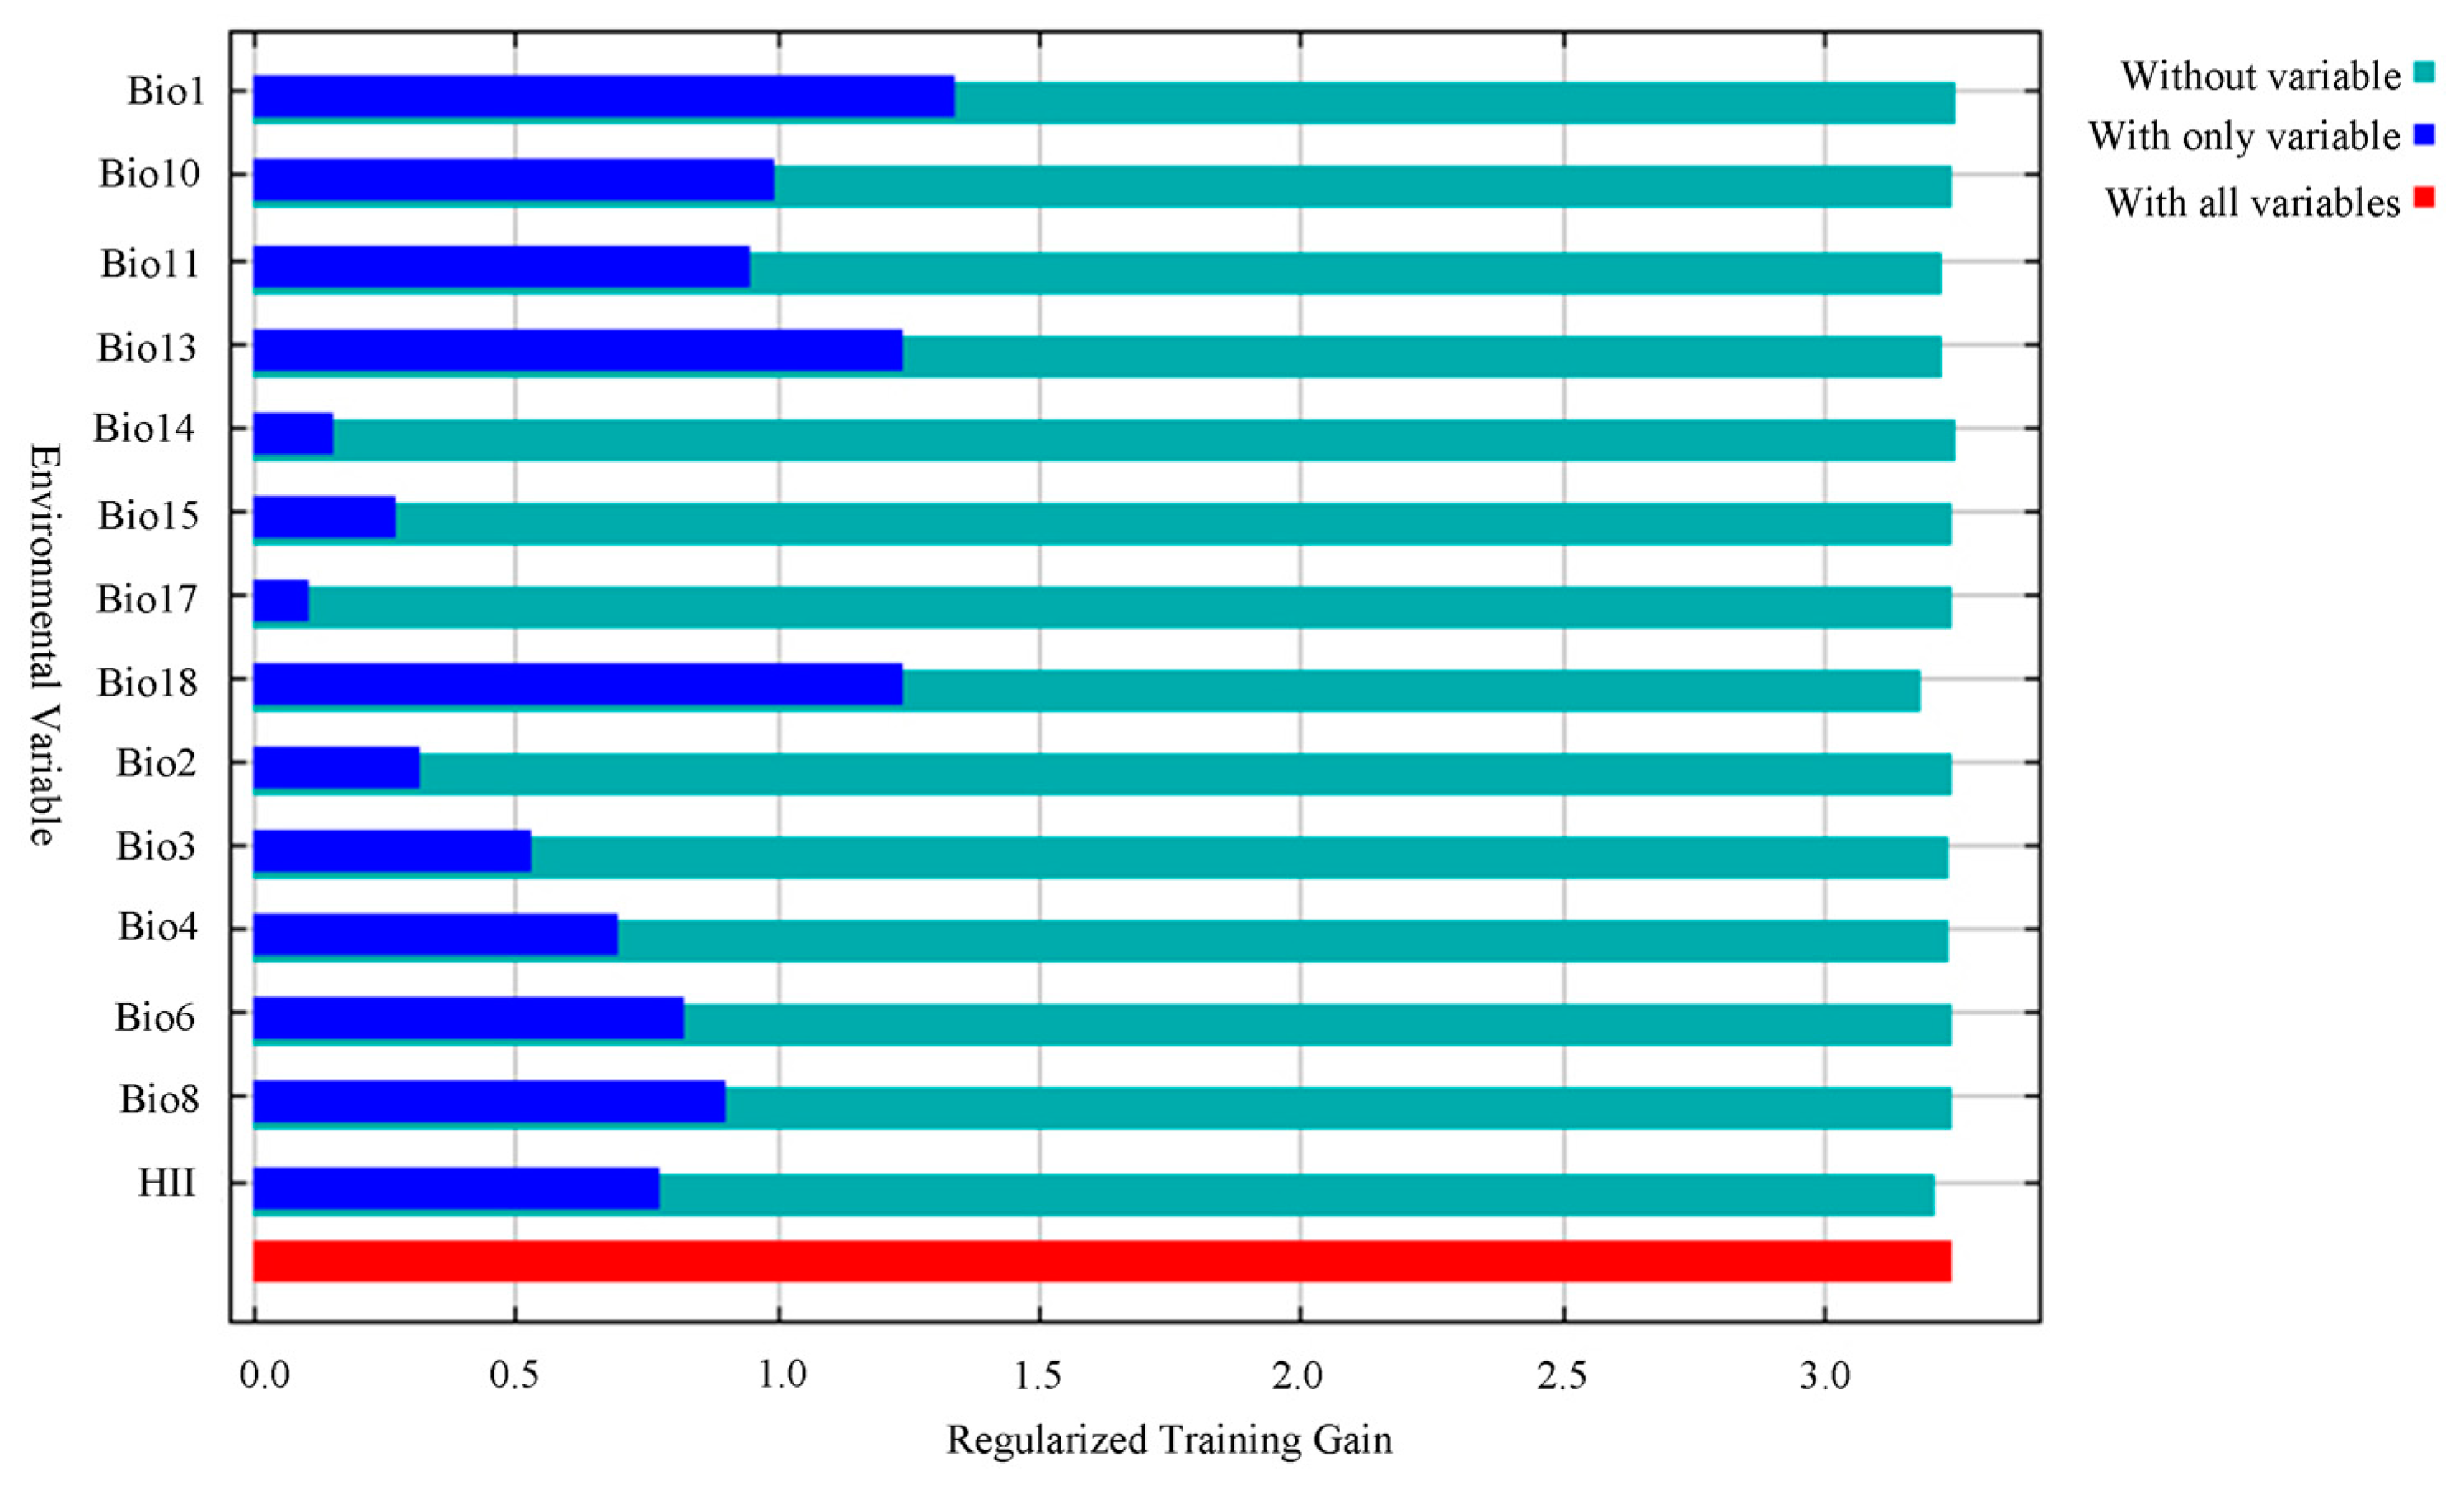
The main environmental factors affecting the geographical distribution of A. trifida were analyzed, including the contribution rate of each environmental factor, and the important value of permutation and the environmental factors were generated by the cutting function of MaxEnt software. According to the contribution rate of each environmental factor (Table 3), HII (22.8%), Bio11 (19.5%) and Bio1 (13.5%) were the three environmental factors that had the greatest contribution rate to the distribution of A. trifida. From the permutation importance values of environmental factors, it could be seen that Bio11 (35.3%), Bio18 (24.6%) and Bio4 (11.2%) had the highest permutation importance, while permuted significant values were random substitutions of values for each environmental factor present on the data trained by the background, with larger values indicating greater dependency on this particular variable [34]. It was indicated that these three environmental factors played the most important role in the modeling and prediction of A. trifida. Based on the environment variable, a Jackknife cutter graph was generated by the MaxEnt software; the red band in the graph represents the gain that was modeled using all environment factors, the blue band represents the gain that was modeled using only that environment variable, and the blue-green band represents the gain that was modeled using the remaining environment variable after removing that variable. According to Figure 5, Bio1, Bio13 and Bio18 had the largest gain when they participated in the modeling alone; this indicates that these environment factors contained information that was not included in other environment factor variables. The environmental variables that dominated the distribution of A. trifida were analyzed by generating the response curves of each environmental factor during the running of MaxEnt model (Figure 6). When the probability value of grid points was greater than 0.5, the environmental variable value was considered more suitable for the growth of A. trifida.
Table 3.
Percent contribution and permutation importance of major environmental variables of Ambrosia trifida L.

Figure 5.
Jackknife test of environmental variables in which Ambrosia trifida L. participates in modeling. The red band in the graph represents the gain that was modeled using all environment factors, the blue band represents the gain that was modeled using only that environment variable, and the blue-green band represents the gain that was modeled using the remaining environment variable after removing that variable.
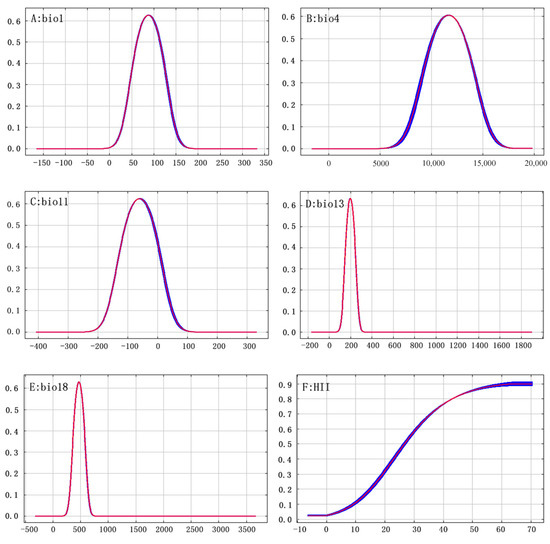
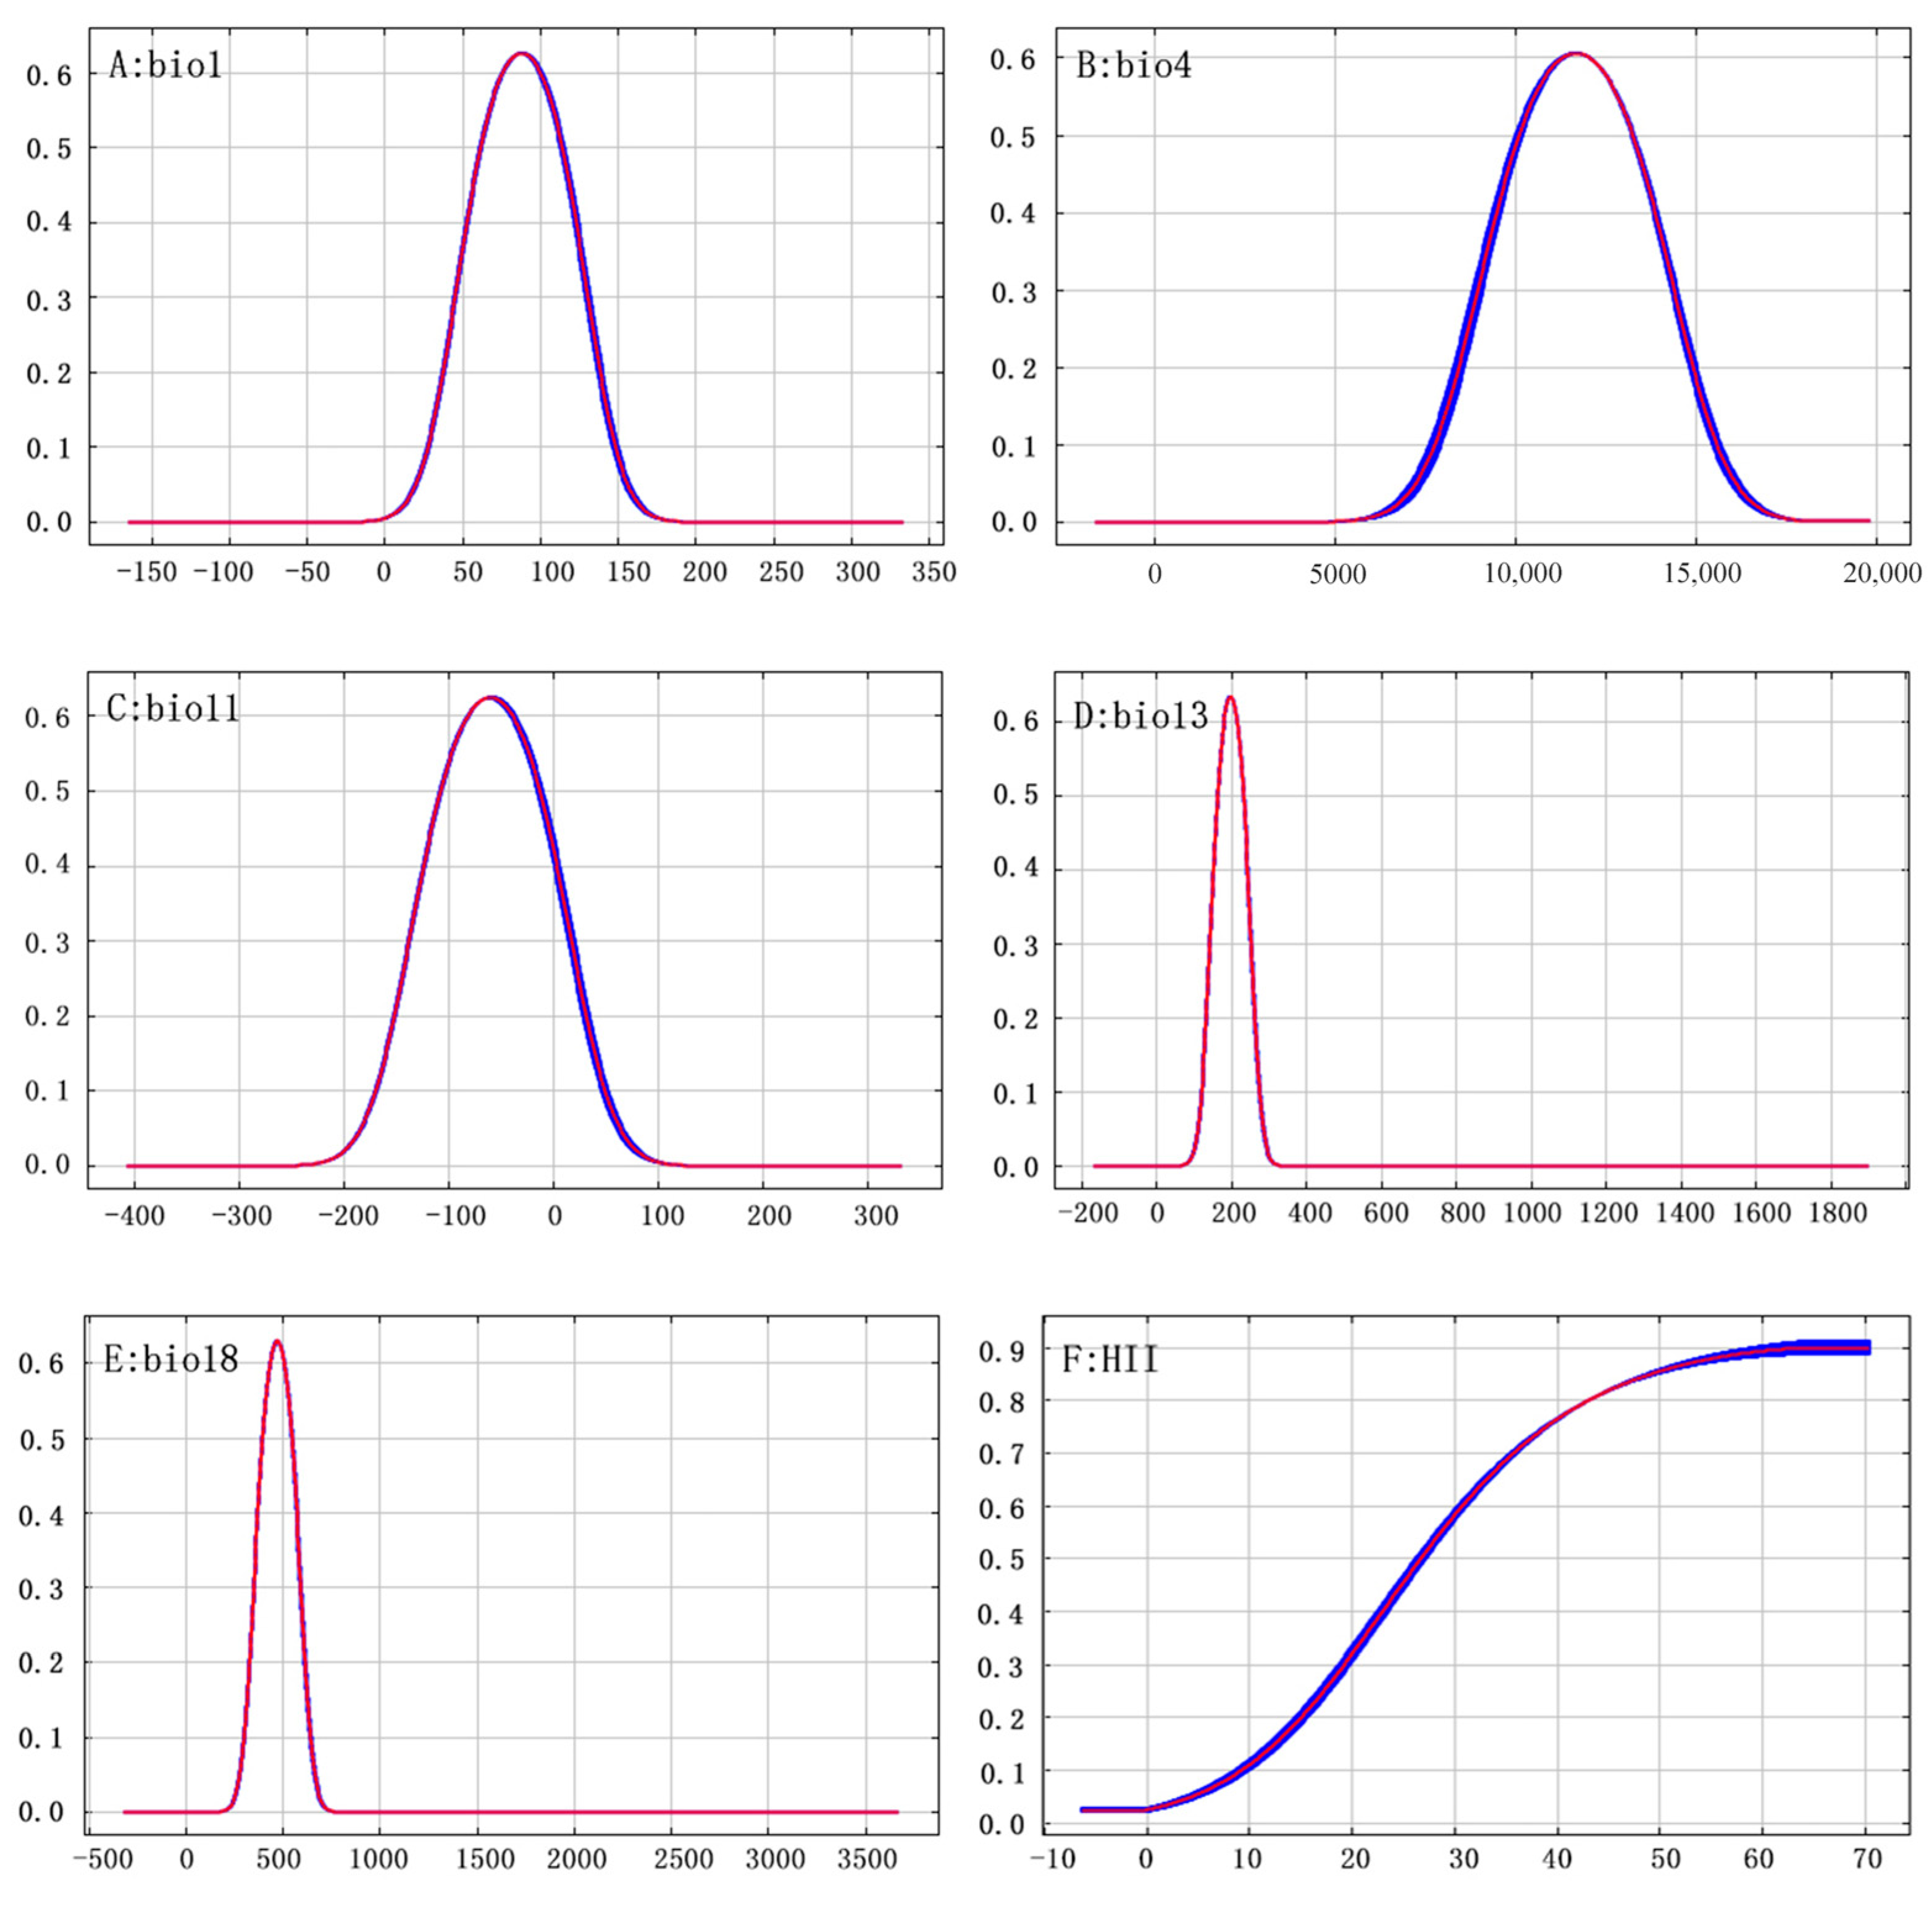
Figure 6.
Response curve of Ambrosia trifida L. presence probability to major environmental factors. The horizontal coordinates indicate the environment variables, and the vertical coordinates indicate the probability of Ambrosia trifida L.
3.3. Distribution of Ambrosia trifida Habitat under Different Climate Patterns
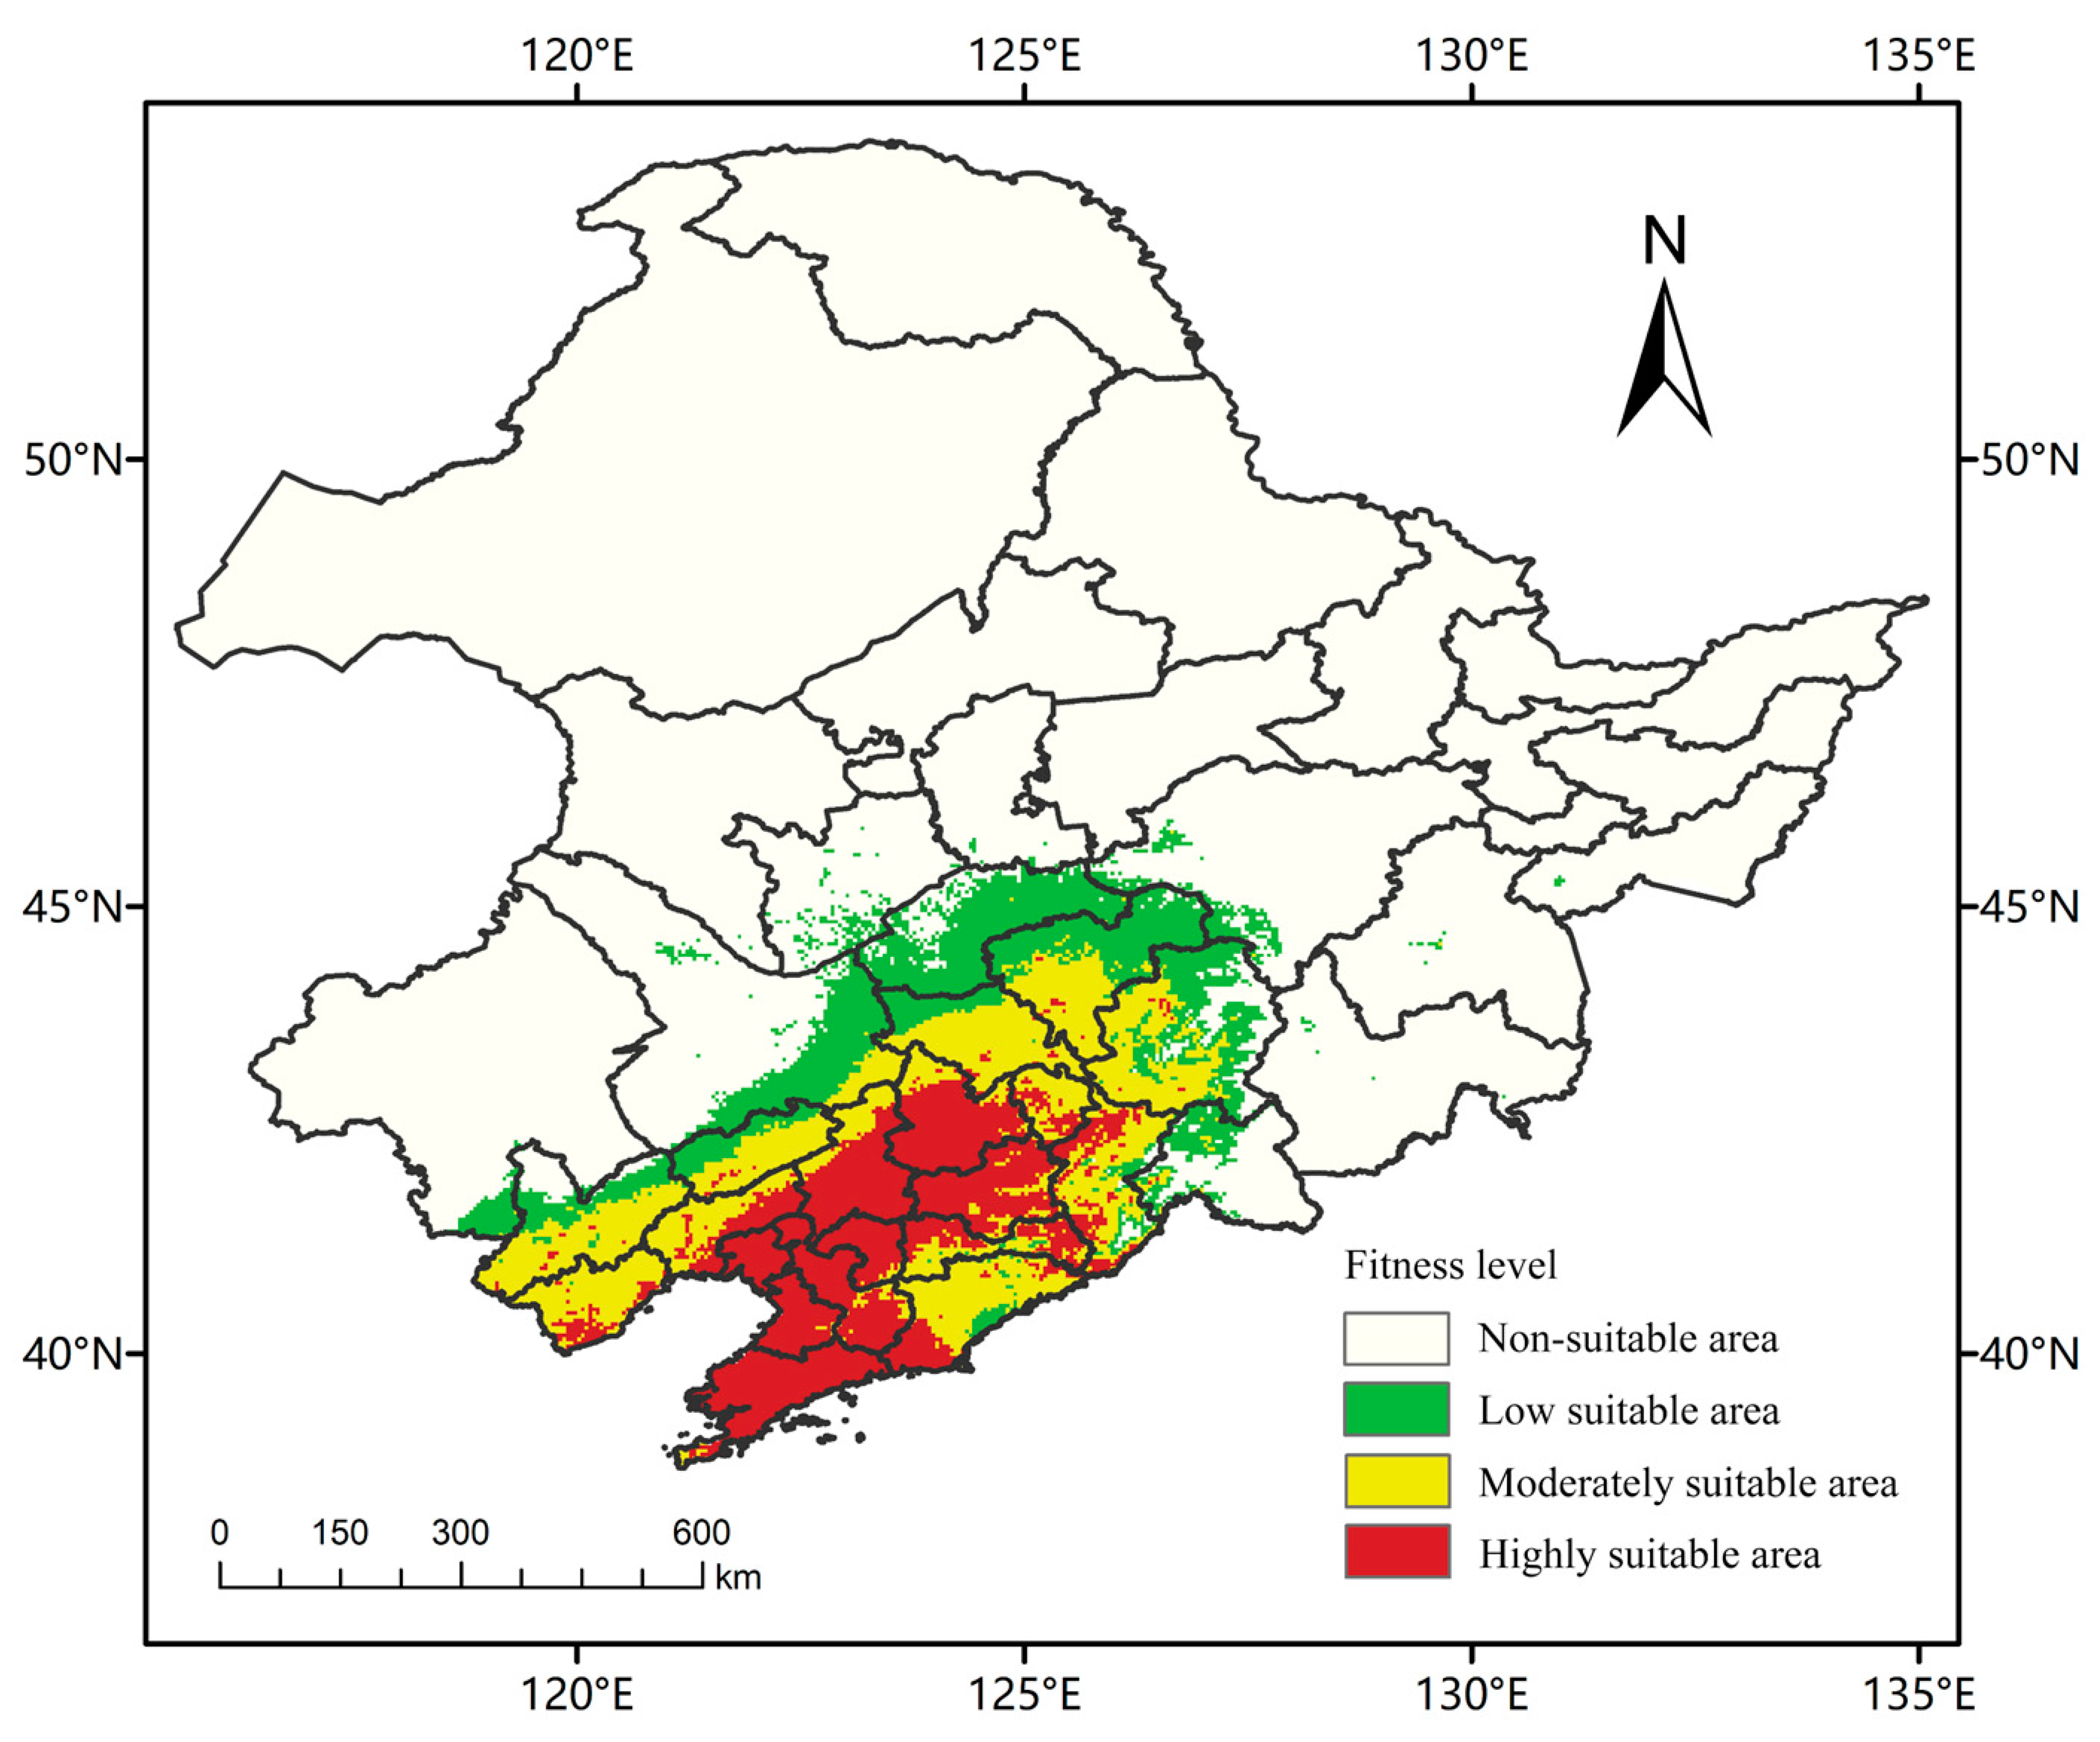
In this study, RCP2.6 (low emission scenario), RCP4.5 (medium emission scenario) and RCP8.5 (high emission scenario) were selected as three climate scenarios with significantly different impacts on future land use planning, to provide a scientific basis and reference for the control of A. trifida, an invasive plant in Northeast China, the suitable distribution area of A. trifida in 2050 and 2070 was studied [35]. A. trifida is mainly distributed in Liaoning Province (Figure 7). The suitable area was 30.61 × 10⁴ km2, accounting for 20.14% of the total area (152 × 104 km2) of Northeast China. The low suitability area was 9.85 × 10⁴ km2, the middle was 11.24 × 10⁴ km2, and the high was 9.52 × 10⁴ km2. Under the influence of the northeast monsoon and other factors in the future, the area of the low suitability area would expand northward. Table 4 shows the potential distribution of A. trifida at different climatic stages.
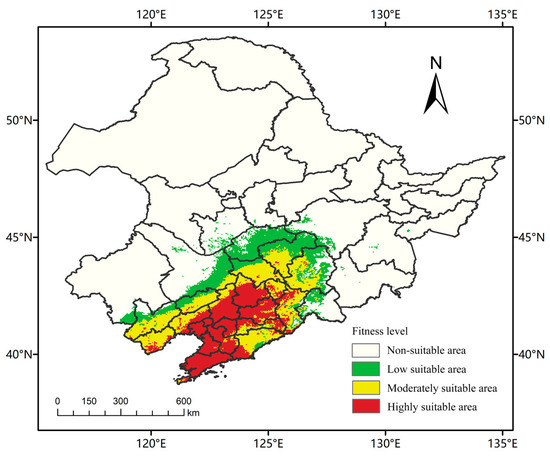
Figure 7.
MaxEnt predicts the potential suitability area for Ambrosia trifida L. in Northeast China under current climatic conditions. Green indicates a low-fitness zone, yellow indicates a moderate-fitness zone, and red indicates a high-fitness zone.
Table 4.
Ambrosia trifida L. suitable area statistics under three different climate scenarios in the future.
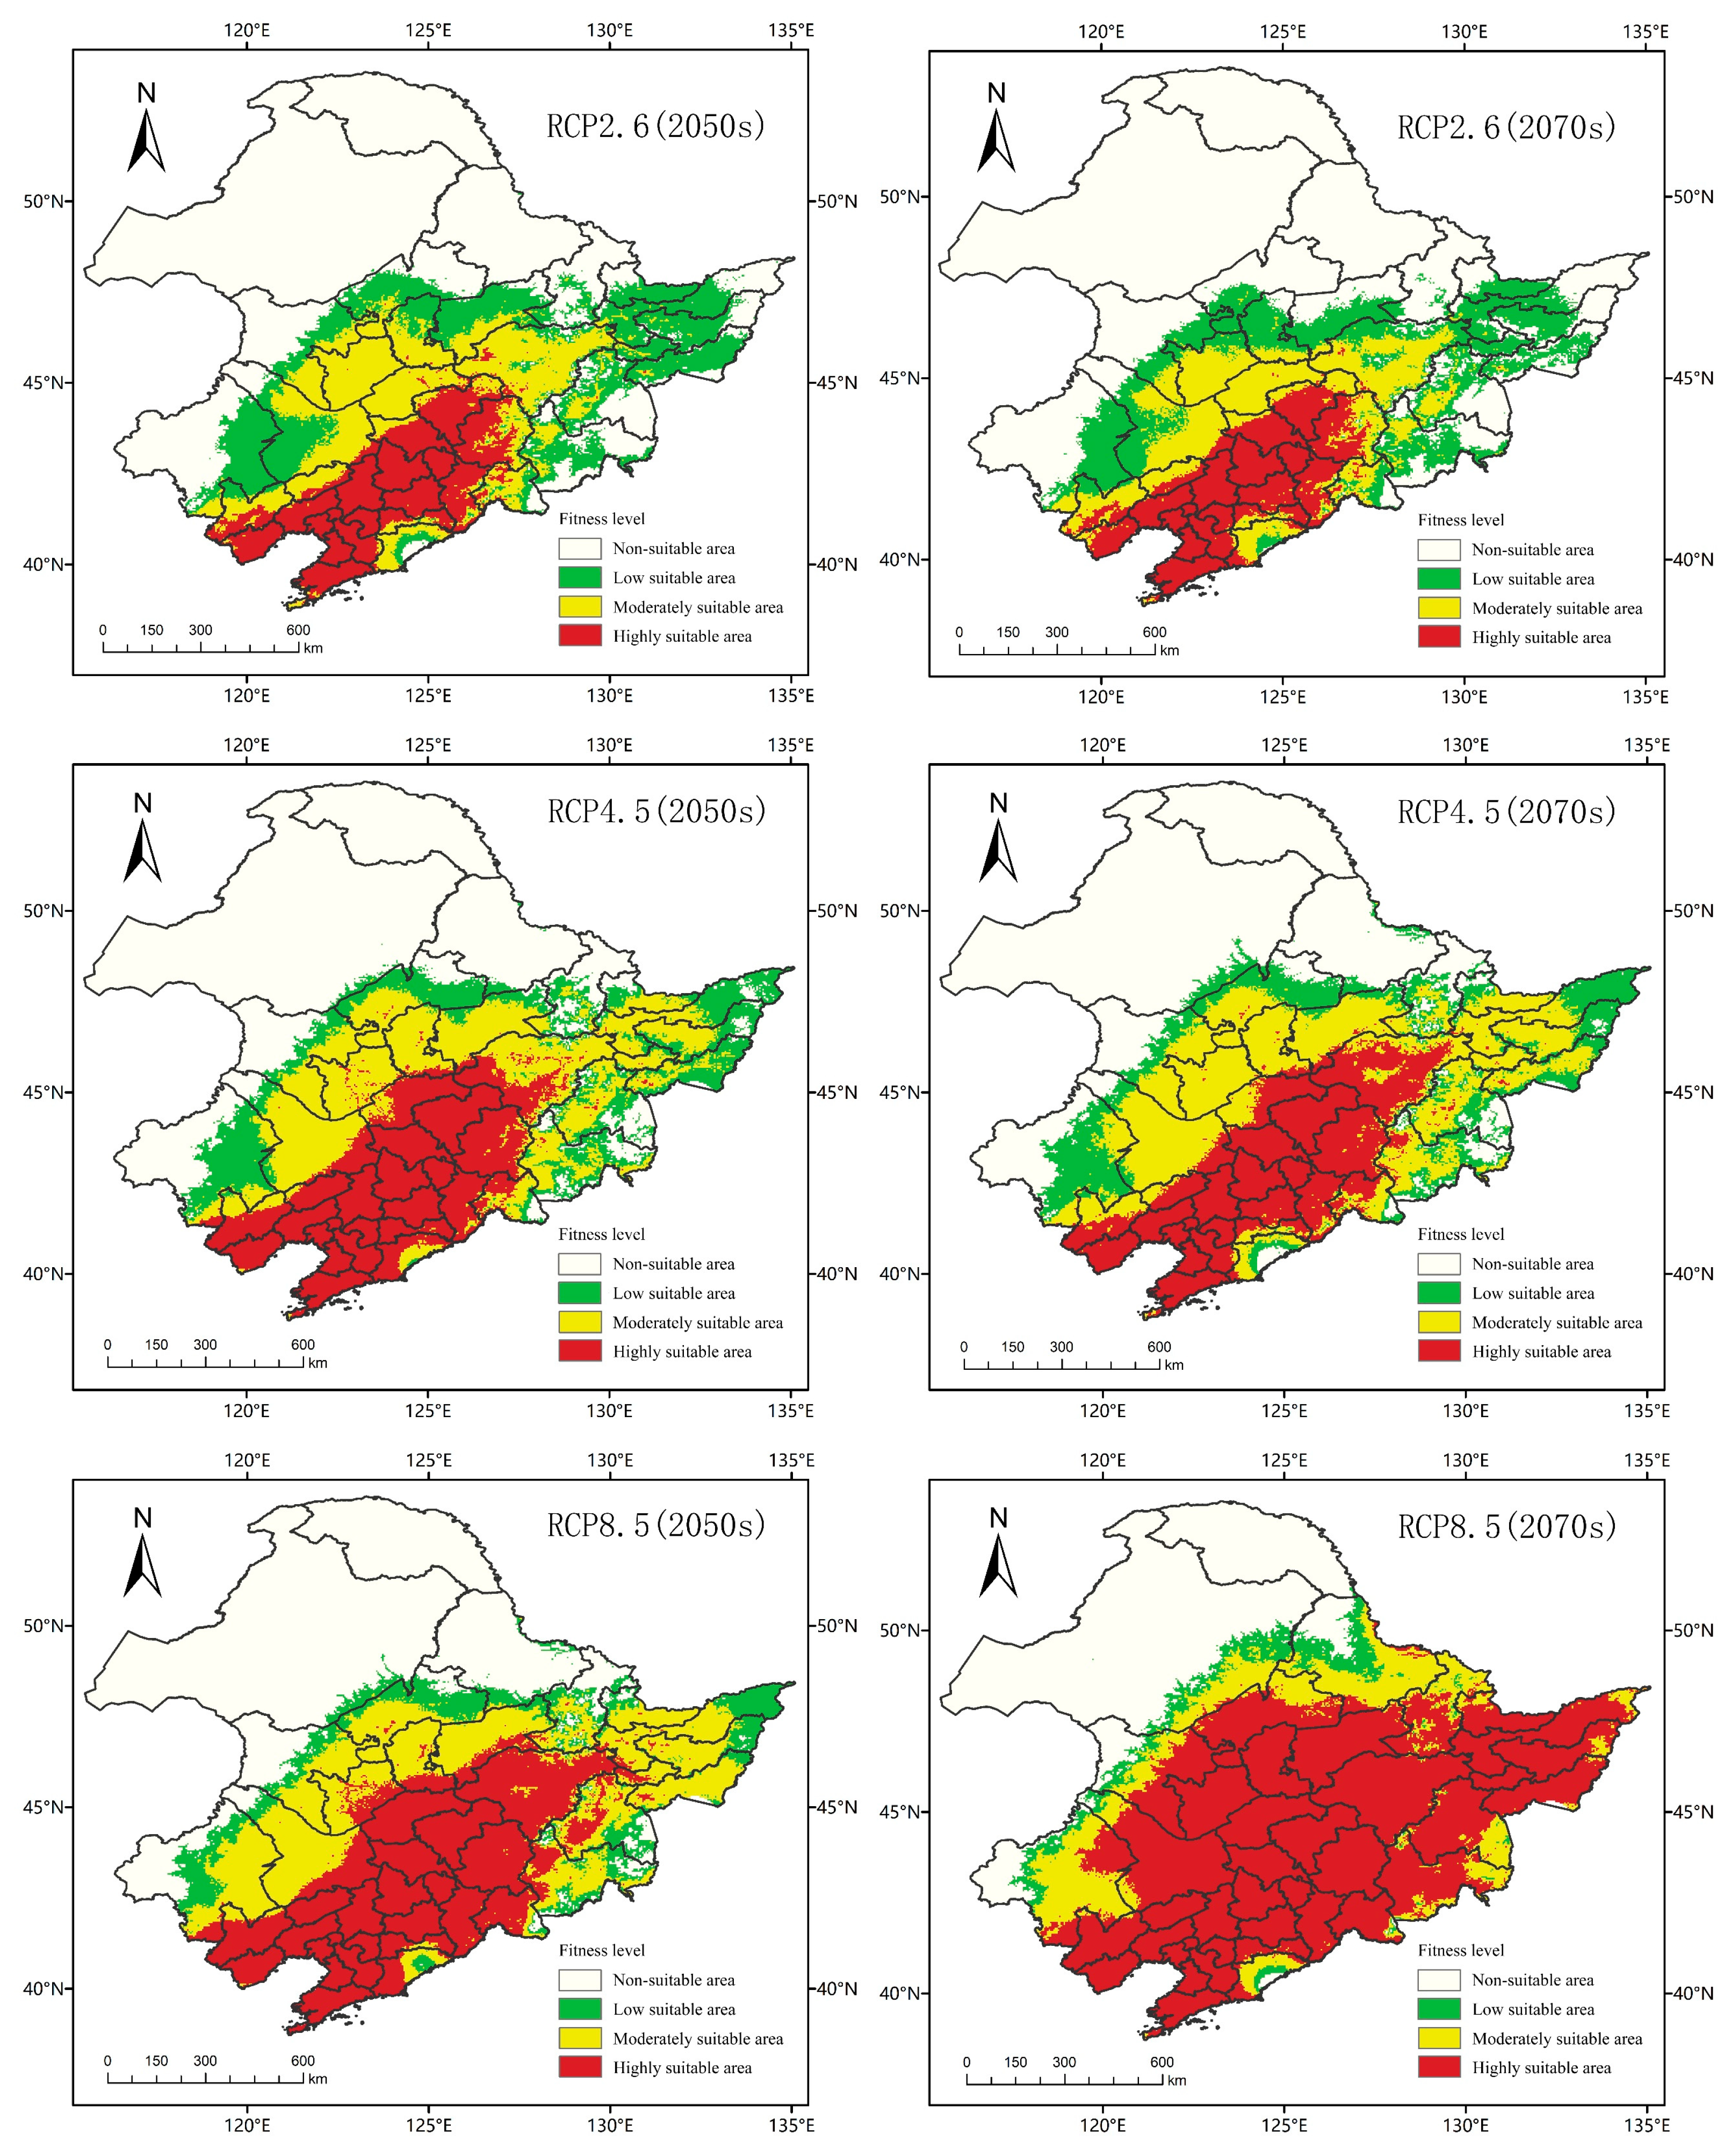
As shown in Figure 8, in 2050, there was no significant difference in the total suitable area of A. trifida in three different climate scenarios. However, with the increasing of emission intensity, the difference between medium and high suitability areas of A. trifida became significant. In the three climate scenarios RCP2.6, RCP4.5 and RCP8.5, the area of low suitability habitat of A. trifida increased by 190.58%, 109.03% and 52.33%, and the area of medium suitability habitat increased by 137.33%, 199.82% and 218.18%, respectively, and the area of high suitability area increased by 109.99%, 227.46% and 337.92%, respectively. From 2050 to 2070, under RCP2.6, the suitable area of A. trifida decreased by 6.64% in the low suitability area, 17.24% in the medium suitability area and 4.05% in the high suitability area. Under the climate scenario of RCP4.5, the areas of high and low suitability for A. trifida decreased by 2.33% and 1.06%, respectively, and the area of medium suitability increased by 13.06%, the areas of medium and low suitability decreased by 51.07% and 42.79%, but the area of high suitability increased by 94.14%.

Figure 8.
The MaxEnt model predicts the potential habitat of Ambrosia trifida L. in Northeast China under future climatic conditions. Green indicates a low-fitness zone, yellow indicates a moderate-fitness zone, and red indicates a high-fitness zone.
3.4. Spatial Pattern Changes of Ambrosia trifida Habitat under Different Climate Patterns
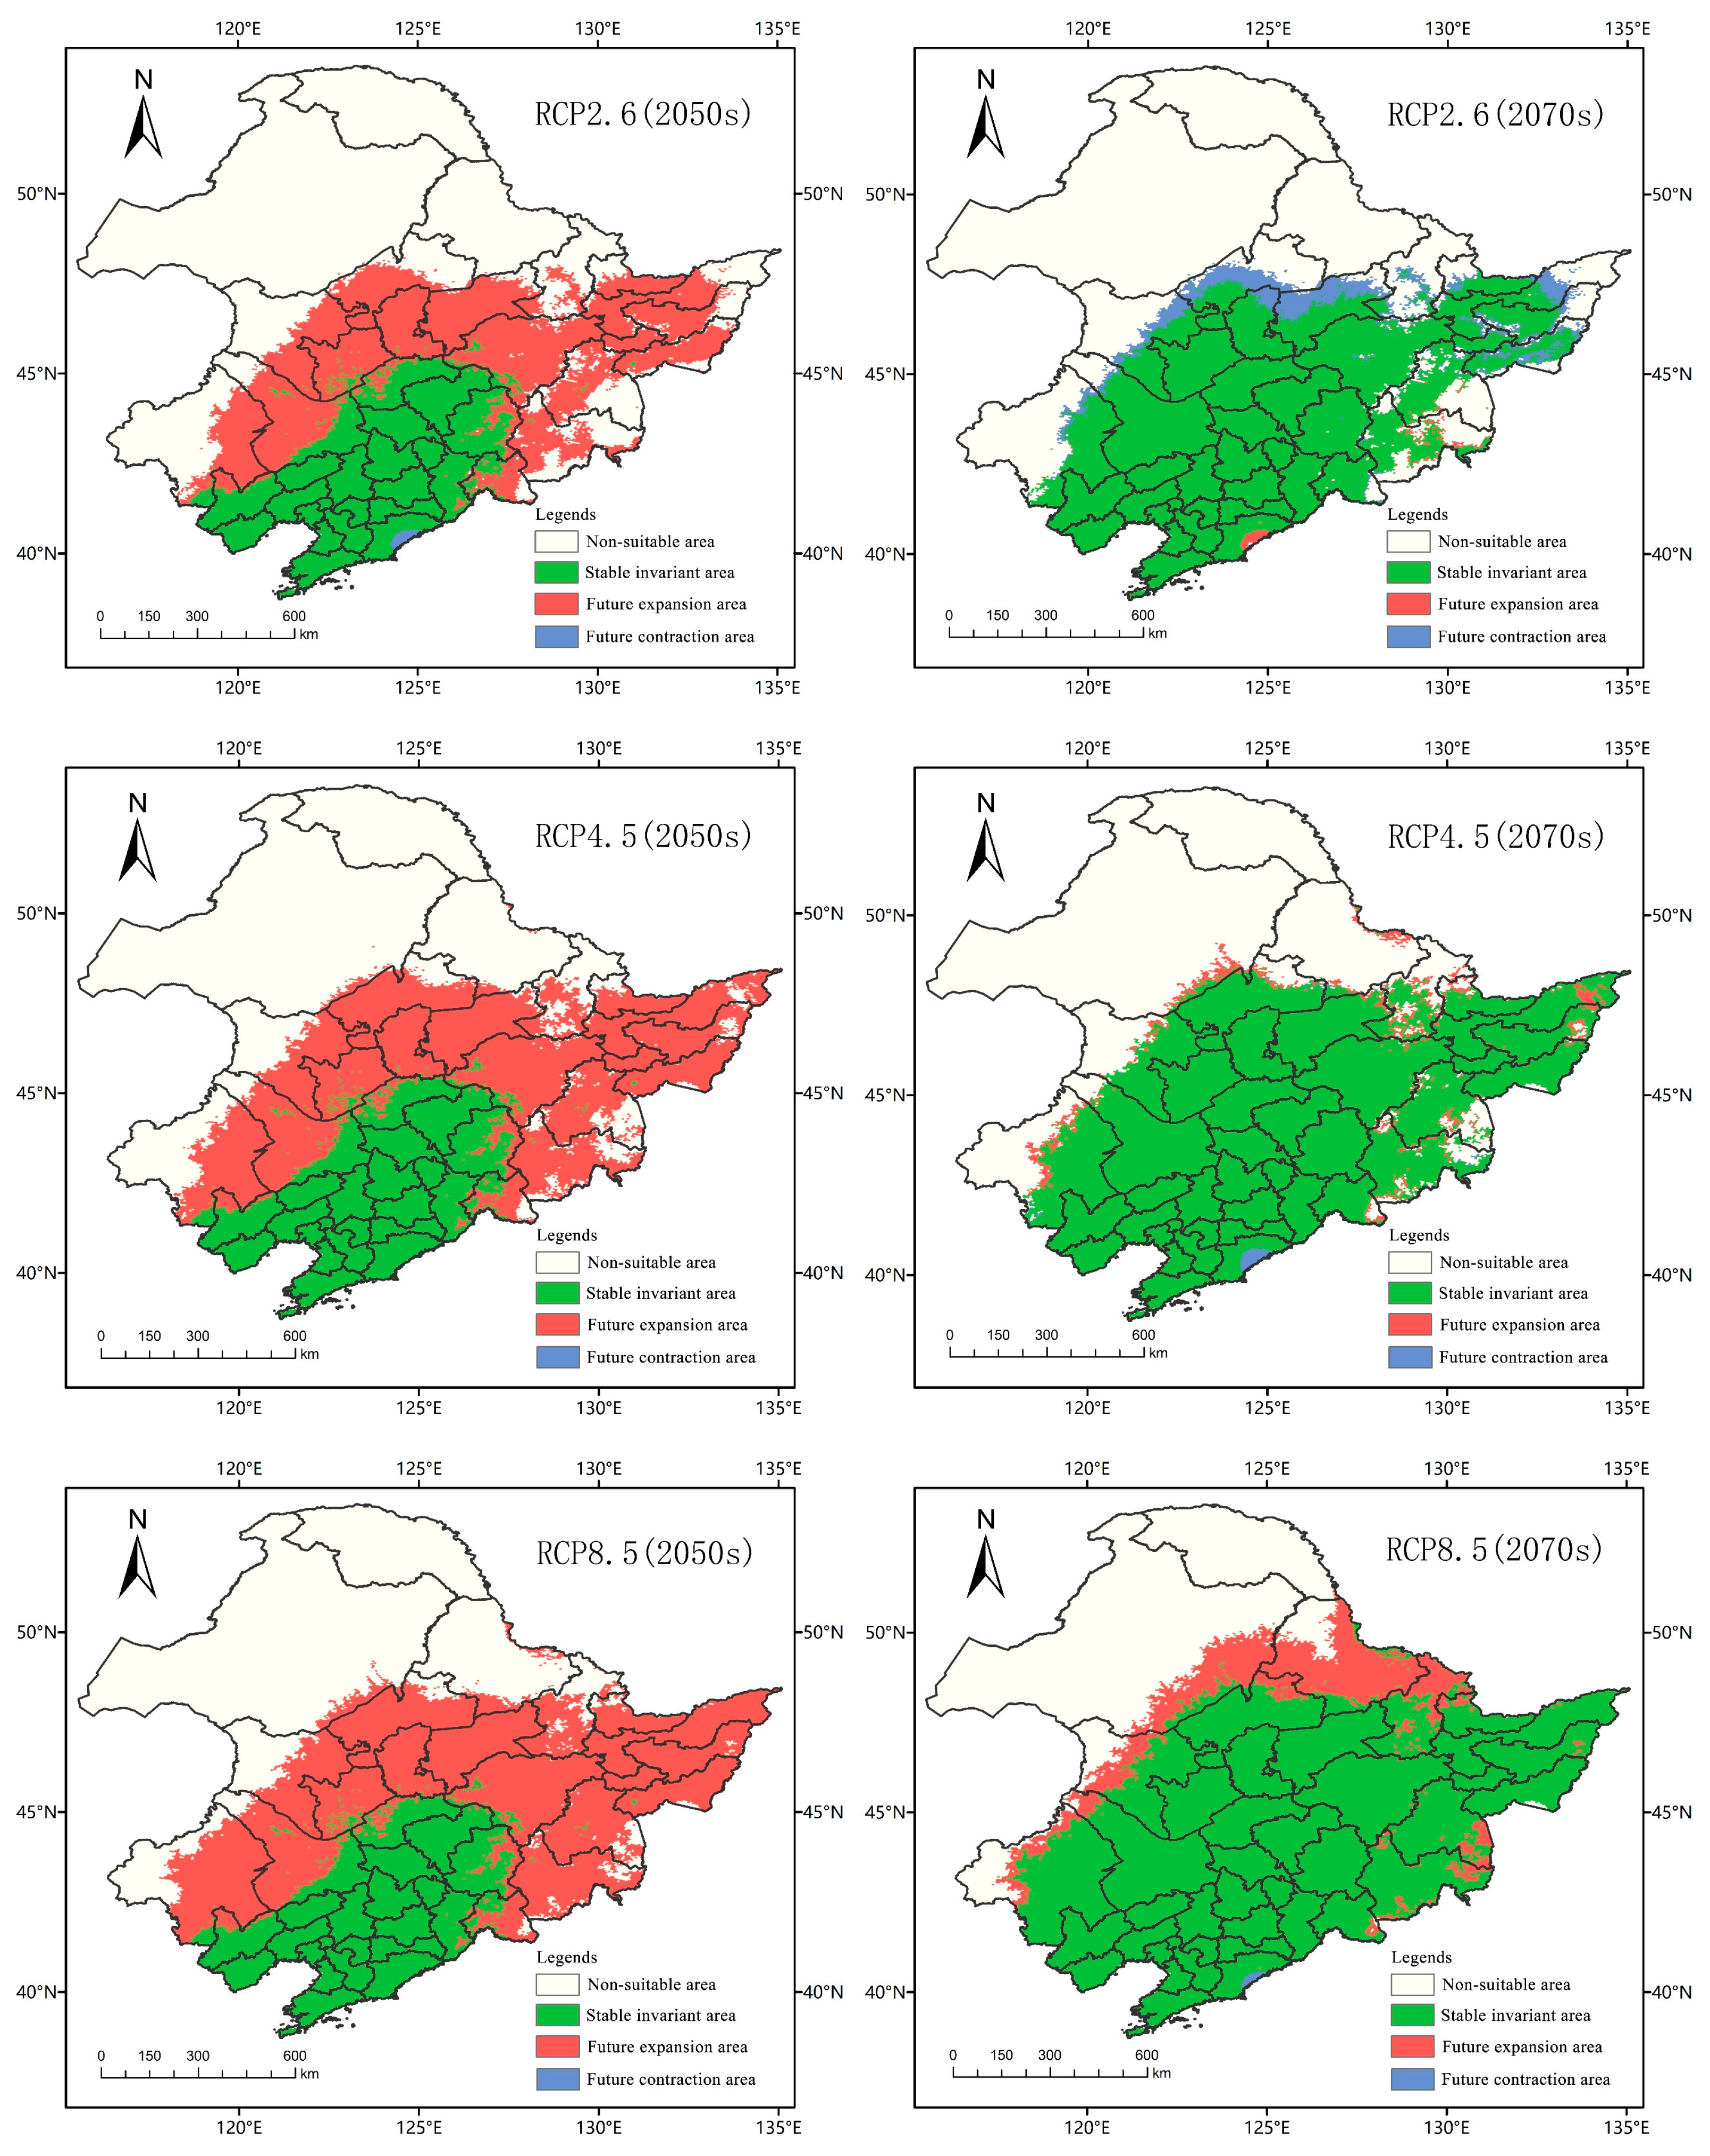
The threshold value of the suitable area and the unsuitable area was 0.12. The suitable area of A. trifida was the grid area whose suitable area coefficient was greater than 0.12, and the unsuitable area was the grid area whose suitable area coefficient was less than 0.12. The spatial patterns of A. trifida in different periods and different climate scenarios were generated by ArcGIS tools, so as to display the expansion and contraction of A. trifida suitable area. As can be seen in Figure 9, the proportion of the expansion area to the contraction area in each climate scenario was significantly larger than that in the present–2050 period. The expansion area of RCP2.6, RCP4.5 and RCP8.5 was 44.93 × 10⁴ km2, 54.87 × 10⁴ km2 and 61.88 × 10⁴ km2, respectively, which indicated that with the increase of emission intensity, the invasion and expansion of A. trifida were more advantageous. Between 2050 and 2070, the proportion of newly expanded areas in A. trifida habitat decreased significantly, indicating that the rate of A. trifida invasion slowed down. In the climate scenario of RCP2.6, the area of contraction (7.87 × 10⁴ km2) was larger than that of expansion (0.57 × 10⁴ km2), which indicated that the total area of A. trifida suitable distribution had a declining trend. In the climate scenario of RCP4.5 and RCP8.5, the total acreage and suitable acreage of A. trifida increased by 3.46 × 10⁴ km2 and 16.68 × 10⁴ km2, respectively. From the above data, it could be concluded that with the increase of emission intensity, environmental conditions were more favorable for A. trifida invasion, and RCP8.5 was the most favorable scenario for A. trifida invasion.
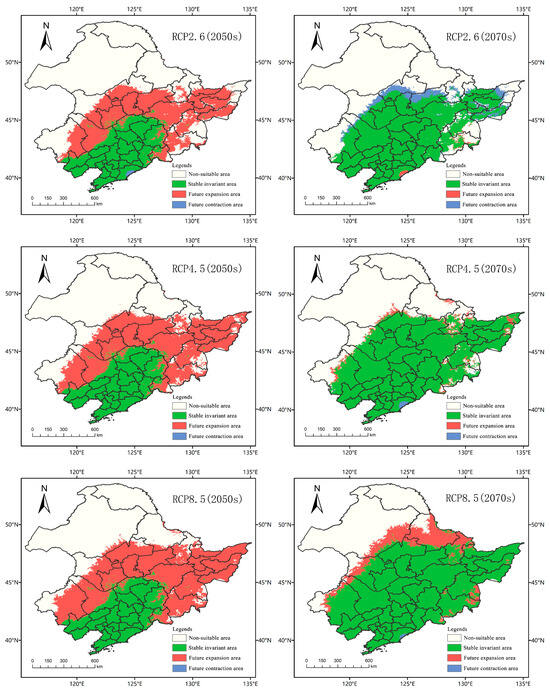
Figure 9.
Spatial variation pattern of Ambrosia trifida L. in Northeast China under different climatic conditions in the future. The future expansions shown here represent areas where Ambrosia trifida L. might invade in the future.
3.5. Centroid Migration in Ambrosia trifida Habitat under Different Climate Patterns
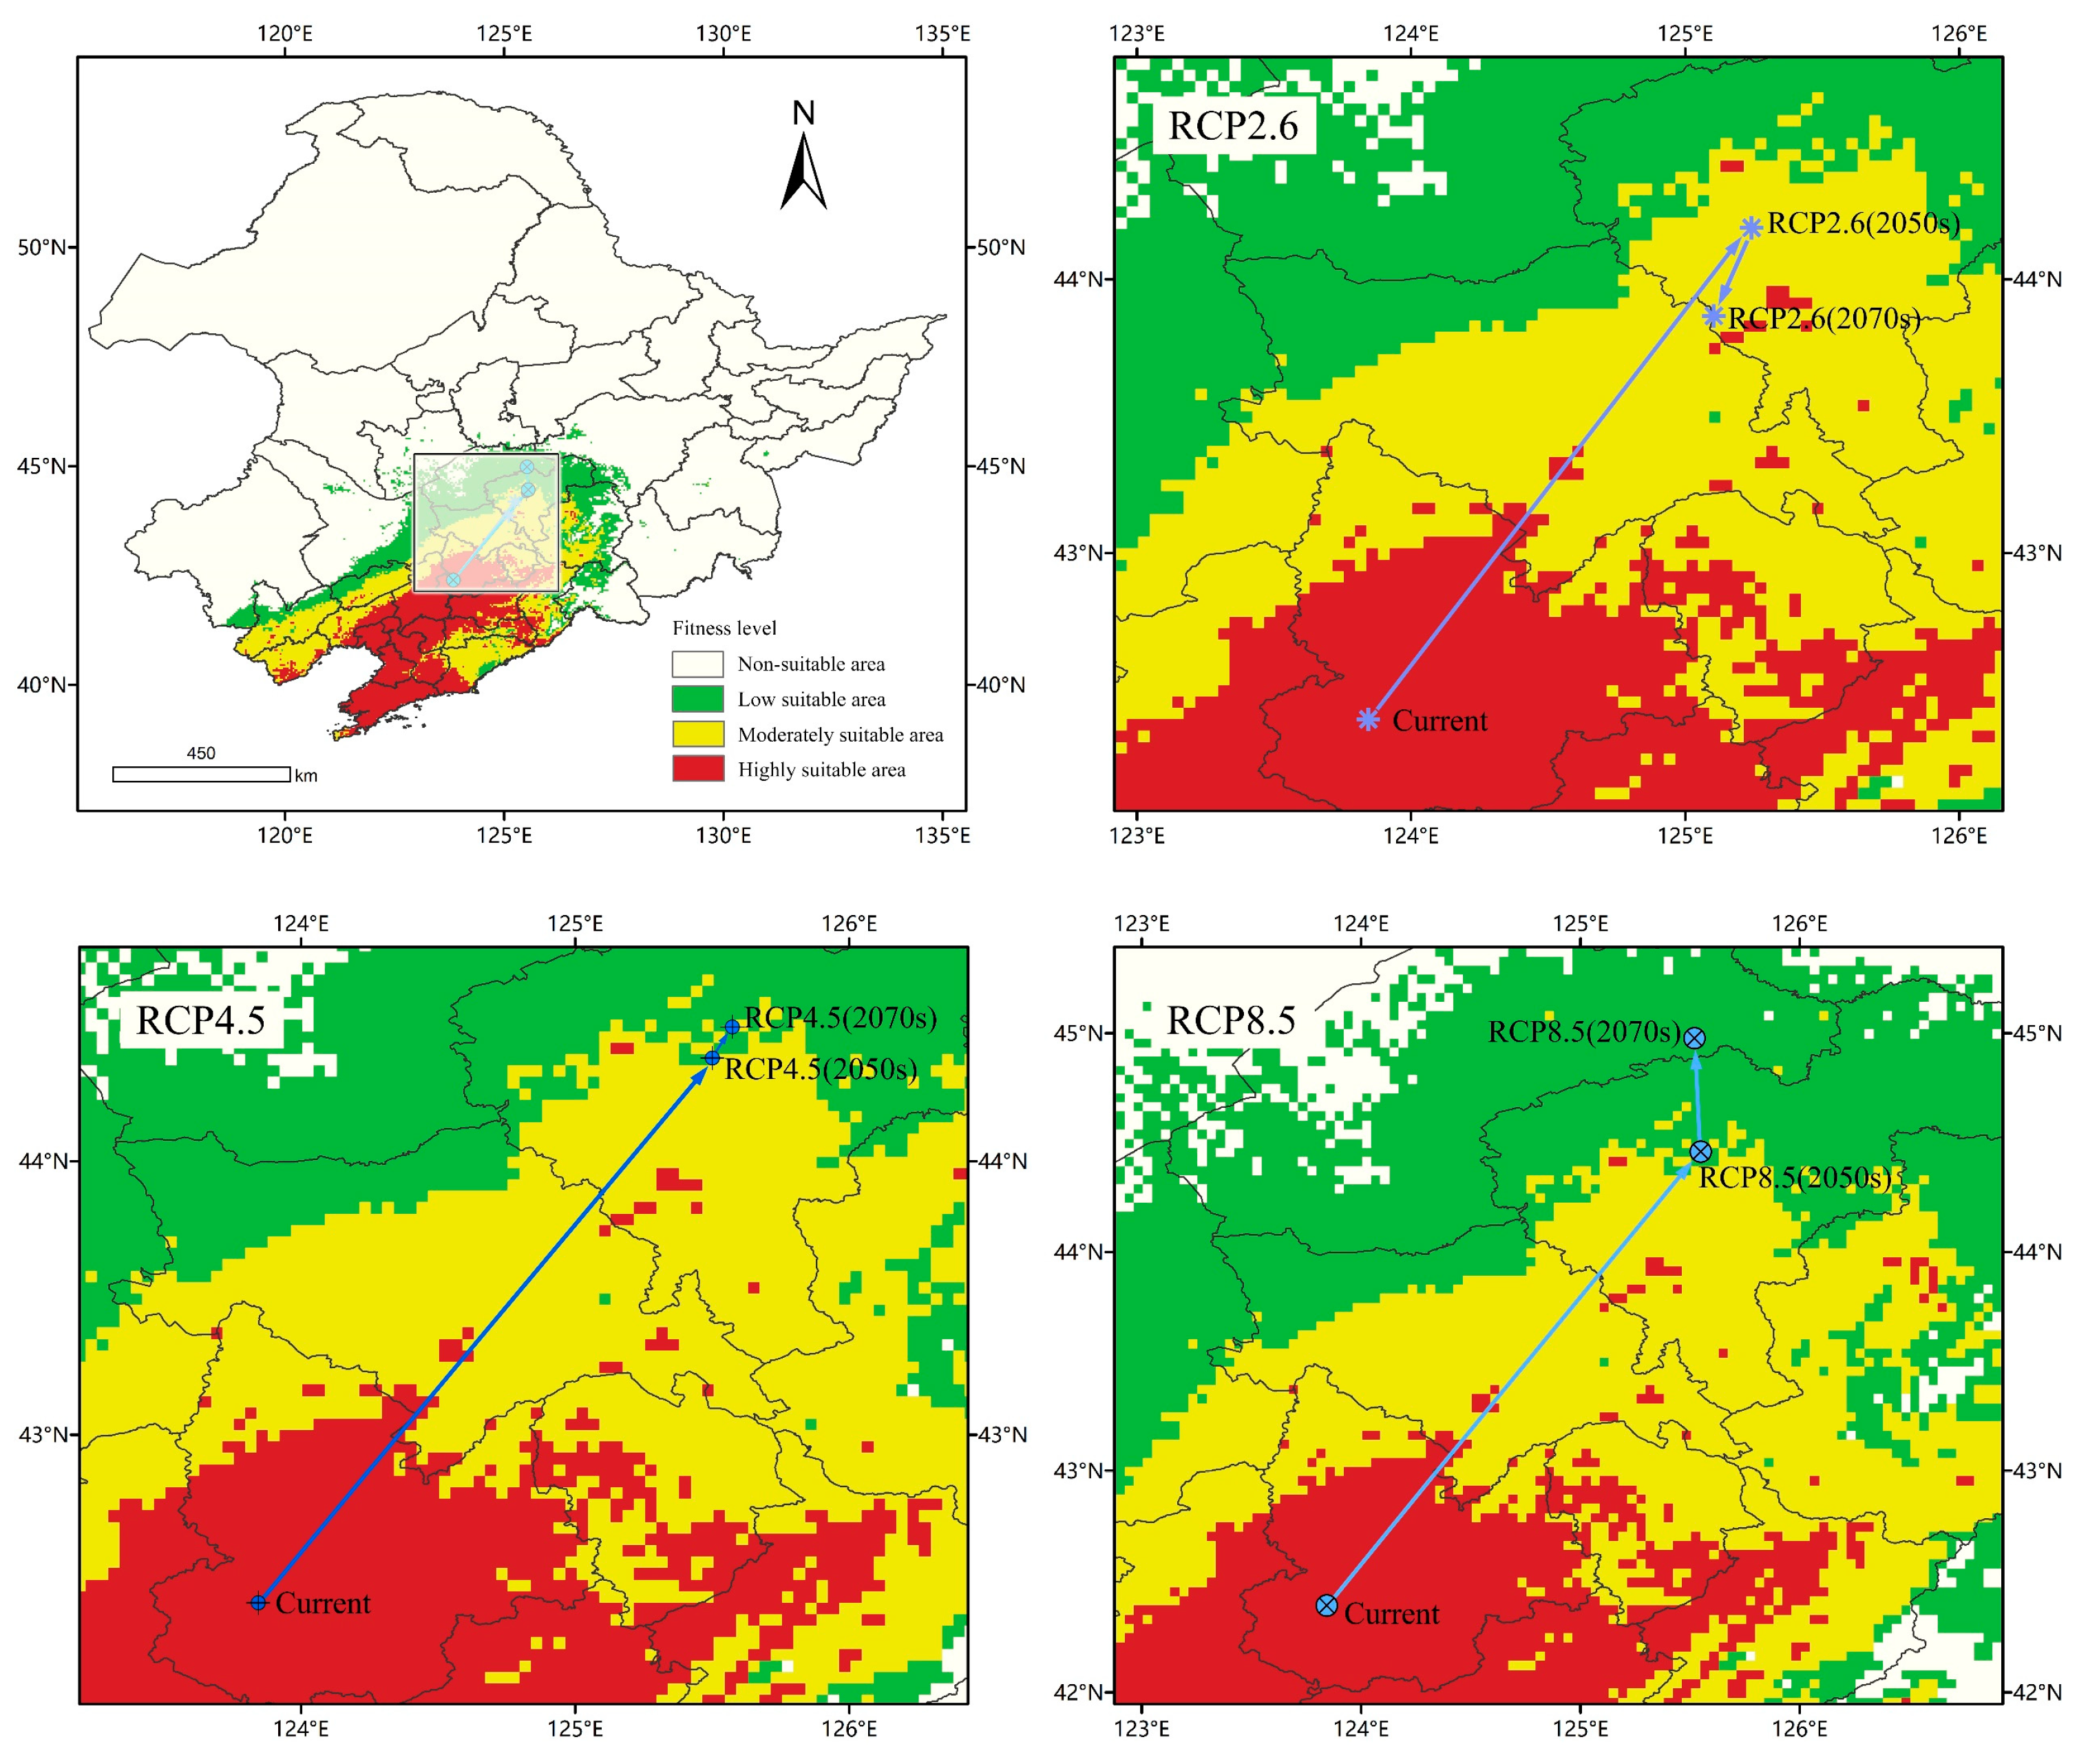
According to Figure 10, the center of mass of A. trifida suitable area was located in Tieling County, Tieling Province and Liaoning Province (123.845, 42.3912). Under the RCP2.6 climate scenario, the suitable area of A. trifida in 2050 was located in Nong’an County, Changchun Province and Jilin Province (125.242, 44.1875), and moved 229.51 km to the northeast compared with the current period. The suitable area of A. trifida in 2070 was located in Gongzhuling, Changchun Province (125.104, 43.8657); compared with that in 2050, it moved 37.44 km to the southwest, in 2050, the center of mass was located in Dehui City and Changchun City in Jilin Province (125.501, 44.3772), moving 258.2 km to the northeast compared with the current period, and in 2070, the center of mass was located in Dehui City and Changchun City, Jilin province (125.573, 44.4905); it moved 6.75 km to the northeast compared with 2050. Under the RCP8.5 climate scenario, the 2050 centroid was located in Dehui City and Changchun City, Jilin Province (125.549, 44.4575), moving 267.81 km to the northeast compared with the current period, while the 2070 centroid was located in Fuyu City, Songyuan Province (125.521, 44.9768); compared with 2050, the center of mass moved 57.79 km to the northwest. On the whole, from the current period to 2070, the suitable center of mass of A. trifida moved gradually from low latitude to high latitude in three climate scenarios, and the distance of A. trifida migration was the furthest in the RCP8.5 climate scenario; this indicated that the high-intensity emission scenario had the greatest influence on the future suitable area of A. trifida.
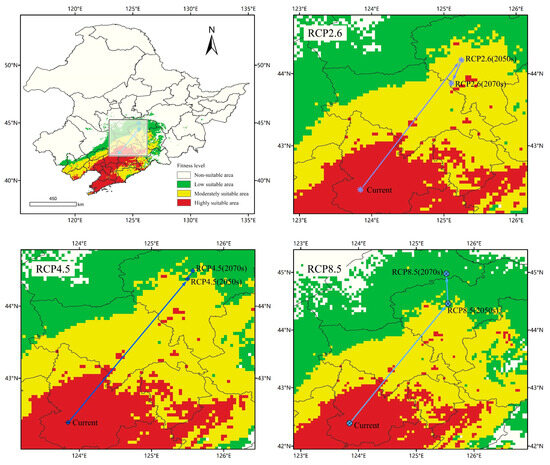
Figure 10.
Potential distribution and centroid transfer of Ambrosia trifida L. in Northeast China under current climatic conditions.
4. Discussion
4.1. Model Rationality Evaluation
The results showed that the distribution prediction with the default parameters of MaxEnt model was prone to over-fitting, which affected the accuracy of the prediction results. Cobos designed the Kuenm package for the detailed calibration and construction of the MaxEnt niche model [36], and it is widely used in optimizing the MaxEnt niche model [37]. At present, when using the MaxEnt model to predict the adaptive distribution of species in the future, there are different experimental methods. One method is to import environmental data from different periods into the MaxEnt software separately; multiple modeling was performed to predict its future adaptive distribution area, and the accuracy and scientific nature of its prediction results were indicated by multiple AUC values [38,39]. However, the rationality and scientificity of this experimental method are questionable, because the prediction model generated by MaxEnt model every time is random, so there is a slight difference between the multiple models used to predict the distribution when modeling multiple times. Even though the model predicted results with higher accuracy per modeling session (AUC ≥ 0.9), it is worth considering whether the predicted results over different periods are comparable. The other method is to use MaxEnt to predict the future adaptive distribution of species in different time and climate scenarios at one time and repeat it ten times, take the average of 10 predictions [40,41]. We can store future environmental data from different periods and different climate scenarios in different plain English paths and then copy and paste the saved paths into notebooks; the environmental data from different periods and different climate scenarios were separated by “,” in English and pasted into MaxEnt software, which was used to model and forecast the suitability distribution area of different periods. In this way, we fully follow the principle of controlled variables in the control experiment, to ensure that a group of only one variable improves the experimental results to make them more scientific and reasonable.
The potential distribution model is based on the distribution data of the native area of the invasive plant, which may undergo niche shift after the plant has spread to the invasive area; the potential range of invasive plants is often underestimated and is considered the most conservative estimate of species suitability [42]. Models based on invasion and local or invasion-only distribution data tend to over-predict plant suitability in invasion sites [43]. Therefore, the range of distribution data used have some influence on the prediction results of the model, but they are considered to be the best prediction. Based on the optimized MaxEnt model and ArcGIS software. The potential distribution of A. trifida, an invasive alien plant, and its potential distribution under different climate scenarios were predicted and repeated ten times. Taking the average of the results of ten runs, the AUC of the predicted results under the ROC curve is 0.98, greater than 0.9, which proved that the optimized MaxEnt model had higher prediction accuracy, and it could reflect the potential distribution of A. trifida in our country and the change of suitable areas in the future, and provide theoretical support and technical guidance for the control of A. trifida in Northeast China.
4.2. Change in Potential Ambrosia trifida Distribution
At present, the suitable A. trifida area is mainly concentrated in Liaoning Province, accounting for 20.14% of the total area of Northeast China. Shenyang, Dalian, Yingkou, Liaoyang, Panjin and other areas of Liaoning Province are highly suitable for A. trifida. Climate scenarios based on moderate emission intensity, the key areas of future A. trifida are Yanbian Korean Autonomous Prefecture in Jilin Province, Baicheng, Songyuan, the Qiqihar of Heilongjiang, Daqing, Harbin, Mudanjiang, Jiamusi and the surrounding areas, Eastern Hinggan League in Inner Mongolia, Tongliao and Chifeng. Based on the prediction of the potential distribution of A. trifida in the northeast of our country under different climate scenarios, the total area of A. trifida suitable for the three climate scenarios will not differ greatly in 2050s. However, with the increasing of emission intensity, the difference between the area of medium and high suitability zones in the A. trifida is gradually significant, which is consistent with the results of Wang Di et al. [24]. In 2070s, a low-emission climate reduced the size of all A. trifida zones. Under the high-emission climate scenario, the total area of the A. trifida area changed little, but the area of the high-suitability area increased by 94.14%. In three different climate scenarios, the center of mass of A. trifida moved from low latitude to high latitude, and in the RCP8.5 climate scenario, A. trifida moved the farthest. Therefore, the greater the discharge intensity, the greater the influence of environmental conditions on the change of the suitable area of A. trifida, and the more favorable the invasion of A. trifida.
4.3. The Dominant Environmental Variable Limiting the Distribution of Ambrosia trifida
Table 3 shows that human factors contribute to the distribution of A. trifida, accounting for 22.8% of the contribution of A. trifida. Therefore, the intensity of human activities in the A. trifida invasion and diffusion process plays a very important role. At the beginning of the study, field investigation of A. trifida distribution points also confirmed this conclusion. A. trifida is mostly distributed in cultivated land, the sides of roads, the sides of rivers, and so on, which is consistent with the field survey results of Ma Qianqian regarding A. trifida [44]. At the same time, Huang Qiaoqiao [45] also pointed out that human activities have a significant role in promoting the spread and distribution of alien invasive plants, whether on a large scale or a small scale; their impact is also higher than that of the natural environmental factors [46]. In addition to the human factors, the temperature and humidity factors in this study also have an important impact on the distribution and diffusion of A. trifida. Among the temperature factors, Bio11, Bio1 and Bio4 were the top contributors. A. trifida seeds have the characteristics of secondary dormancy: A. trifida seeds will enter primary dormancy after maturity, and when primary dormancy is broken or other factors are not suitable for germination, the seeds will enter secondary dormancy. This mechanism facilitates the germination of A. trifida seeds under a wide range of conditions [47]. The dormancy of seeds will break after low temperature treatment, seed germination, a higher latitude of breeding site, a higher proportion of seeds entering dormancy after maturity, or a longer cryogenic treatment time required to break dormancy [48]. In the study of dormancy and germination of A. trifida, Kang Fenfen found that the germination rate of A. trifida seeds stored at 3–5 °C increased with the increase of storage time. However, low temperatures (−20 °C) did not improve seed germination rate [49]. This conclusion is also consistent with the environmental factor response curves for Bio11 in Figure 6C. In addition, seasonal changes in temperature play an important role in A. trifida seed germination, and long-term constant temperature is not conducive to A. trifida seed germination, and appropriate temperature changes will increase seed germination rate [50]. In Figure 6, the response curves of two environmental factors, Bio18 and Bio13, the distance between the lowest point and the highest point indicates the tolerance range of A. trifida to this environmental factor. Therefore, the narrow ecological range of A. trifida to Bio18 and Bio13 indicates that A. trifida is more sensitive to humidity, which may be the main limiting factor affecting the distribution of A. trifida. This conclusion is also consistent with that of Ding Shiqiang in the study of ecological factors limiting the distribution and growth of A. trifida [51].
4.4. Control Measures and Strategies of Invasive Plants
The A. trifida expansion areas in the study indicate a high risk of future A. trifida invasion and should be monitored and controlled. The government should establish and improve the prevention and control mechanism of alien species invasion, strengthen the quarantine of forage grass and animals, reduce and avoid the invasion of alien species and cut off their transmission path. At the same time, we should strengthen propaganda to raise the public’s awareness of the seriousness of the invasive plant harm, for the public to popularize the morphological characteristics and the invasive harm of A. trifida, and mobilize the whole society to participate in the prevention and control of A. trifida. We should also encourage relevant scientific research institutions and technical personnel to explore and study the biological substitution of A. trifida in different areas and other new eradication methods and measures. Relevant departments should actively seek financial support at all levels and set up special funds for exotic invasive plants to provide financial support for the control of A. trifida and other invasive plants. Once harmful invasive plants such as A. trifida are found in the future expansion areas, physical control, chemical control, biological control or other new control measures should be considered according to the actual situation, control it in a timely manner to avoid its continued large-scale invasion caused more serious losses.
For the areas where A. trifida has invaded successfully, we should take into account the actual situation of the invaded areas and choose appropriate control measures. In the early stage of population establishment, artificial and physical removal can be used to control the population through cutting, burning, ploughing and root fragmentation [52]. When choosing artificial or physical measures to remove A. trifida, it is necessary to properly deal with its roots and other parts, so as to prevent its roots from sprouting and producing adventitious roots, and to survive and spread again, causing a new round of plant invasion [53]. When the population is large, the above methods need to invest a lot of human and material resources, not applicable, at this time we can take chemical and biological means to control. Chemical control mainly refers to the spraying of chemical pesticides, which has the advantages of quick effect, labor-saving and easy operation, but it is easy to cause environmental pollution and make invasive species produce resistance, the subsequent control effect gradually decreased [54]. When the A. trifida population is large, 75% Fenouracil Glyphosate WG 900.0 g·hm−2, 30% Glyphosate AS 5250.0 g·hm−2, 48% Clopidoacetic Acid EC 4170.0 g·hm−2, 21% Chlorampicillin Acid AS 300.0 g·hm−2 could be used alternately between mid-may and late June, avoid resistance of A. trifida to a drug [55]. Biological control mainly refers to interfering with the normal growth and reproduction process of invasive plants using their natural enemies or microorganisms, a method of reducing the population density of harmful invasive plants below the hazard level [56]. Prior to the introduction of biological control agents, it is necessary to know in advance the environmental and climatic conditions, fecundity and living habits of the native habitat, so as to enable it to establish a stable population in the invasive area, but there are constraints to control its population, will not develop into new invasive species [57]. In the prevention and control of invasive plants, there is usually no single method or measure to be used. We should adopt a comprehensive approach based on the situation of the invasive seek truth from facts.
5. Conclusions
At present, A. trifida is mainly distributed in Liaoning Province. The suitable distribution area accounts for 20.14% of the total area of the Northeast, under the three climate scenarios of RCP2.6 (low emission scenario), RCP4.5 (medium emission scenario) and RCP8.5 (high emission scenario), the potential suitable distribution of A. trifida showed a clear northward movement. The results showed that the proportion of medium and high suitability areas of A. trifida increased significantly with the increase of emission intensity. The results showed that under the climate scenario of RCP2.6, the increase rate of A. trifida suitable distribution area was the lowest, and the area of A. trifida suitable distribution area would decrease slowly after reaching a certain peak, under the climate scenario of RCP8.5, the area of A. trifida highly suitable for cultivation increased exponentially, and by 2070 most of the three northeastern provinces will be highly suitable for cultivation, is not conducive to the smooth implementation of A. trifida prevention and control work in the northeast. Based on the RCP4.5 climate scenario, which is most in line with current policy on land use planning, the key areas of future A. trifida are Yanbian Korean Autonomous Prefecture in Jilin province, Baicheng, Songyuan, the Qiqihar of Heilongjiang, Daqing, Harbin, Mudanjiang, Jiamusi and the surrounding areas, Eastern Hinggan League in Inner Mongolia, Tongliao and Chifeng. Monitoring of A. trifida population dynamics should be strengthened in these areas to ensure early detection and early clearance. In areas where A. trifida has already invaded successfully, we should take into account the actual situation of the invasion site to select appropriate control measures. Maxent model provides scientific support for the prediction of the distribution of A. trifida in Northeast China, and also provides the basis and reference for the relevant government departments to formulate A. trifida control and management policies.
Author Contributions
Conceptualization, S.C. and X.B.; methodology, J.Y.; software, S.C. and W.C.; validation, S.C. and G.X.; formal analysis, S.C.; investigation, S.C.; resources, S.C.; data curation, X.B.; writing—original draft preparation, S.C.; writing—review and editing, S.C.; visualization, X.B.; supervision, project administration and funding acquisition, X.B. and J.Y. All authors have read and agreed to the published version of the manuscript.
Funding
This research was funded by National Key R&D Program of China, grant number 2022YFF1300500.
Institutional Review Board Statement
Not applicable.
Data Availability Statement
If you need this part of the experimental data, you can send an email to 2021240796@stu.syau.edu.cn to obtain it.
Conflicts of Interest
The authors declare that they have no known competing financial interests or personal relationships that could have appeared to influence the work reported in this paper.
References
- Wake, I.A.M.S.; Soeprobowati, T.R.; Jumari. The invasive alien plants threatened the balance of ecosystem in conservative area in Ontoloe Island, Flores-Indonesia. J. Phys. Conf. Ser. 2018, 1025, 012033. [Google Scholar] [CrossRef]
- Celine, B.; Wilfried, T.; Boris, L.; Piero, G.; Michel, B.; Franck, C. Will climate change promote future invasions? Glob. Chang. Biol. 2013, 19, 3740–3748. [Google Scholar]
- Monika, W.; Jassby, A.D.; Ralph, M.N. Synergies between climate anomalies and hydrological modifications facilitate estuarine biotic invasions. Ecol. Lett. 2011, 14, 749–757. [Google Scholar]
- Musarella, C.M.; Laface, V.L.A.; Angiolini, C.; Bacchetta, G.; Bajona, E.; Banfi, E.; Barone, G.; Biscotti, N.; Bonsanto, D.; Calvia, G.; et al. New Alien Plant Taxa for Italy and Europe: An Update. Plants 2024, 13, 620. [Google Scholar] [CrossRef]
- Nan, Q.; Li, C.; Li, X.; Zheng, D.; Li, Z.; Zhao, L. Modeling the Potential Distribution Patterns of the Invasive Plant Species Phytolacca americana in China in Response to Climate Change. Plants 2024, 13, 1082. [Google Scholar] [CrossRef]
- Rai, P.K.; Singh, J.S. Invasive alien plant species: Their impact on environment, ecosystem services and human health. Ecol. Indic. 2020, 111, 106020. [Google Scholar]
- Hu, J.H.; Wang, D.K. Current issues and its countermeasures of forestry pest control in Pengyang County. South China Agric. 2021, 15, 70–73. [Google Scholar]
- Yang, W.; Sun, S.; Wang, N.; Fan, P.; You, C.; Wang, R.; Zheng, P.; Wang, H. Dynamics of the distribution of invasive alien plants (Asteraceae) in China under climate change. Sci. Total Environ. 2023, 903, 166260. [Google Scholar] [CrossRef]
- Chen, B.X.; Sun, Y.F.; Han, Z.H.; Huang, H.K.; Zhang, H.B.; Li, Y.K.; Zhang, G.L.; Liu, W.X. Challenges in preventing and controlling invasive alien species in China. J. Biosaf. 2020, 29, 157–163. [Google Scholar]
- Li, G.Q.; Liu, C.C.; Liu, Y.G.; Yang, J.; Zhang, X.S.; Guo, K. Advances in theoretical issues of species distribution models. Acta Ecol. Sin. 2013, 33, 4827–4835. [Google Scholar]
- Xu, Z.L.; Peng, H.H.; Peng, S.Z. The development and evaluation of species distribution models. Acta Ecol. Sin. 2015, 35, 557–567. [Google Scholar]
- Thakur, S.; Rai, I.D.; Singh, B.; Dutt, H.C.; Musarella, C.M. Predicting the suitable habitats of Elwendia persica (Boiss.) in the Indian Himalayan Region (IHR). Plant Biosyst. 2023, 157, 769–778. [Google Scholar] [CrossRef]
- Michalová, M.; Hrabovský, M.; Kubalová, S.; Miháliková, T. Modelling the Symphyotrichum lanceolatum invasion in Slovakia, Central Europe. Model. Earth Syst. Environ. 2024, 10, 2749–2759. [Google Scholar] [CrossRef]
- Tu, Z.Y.; Gou, X.H.; Zou, S.B. Potential distributions of Picea crassifolia on the north slope of Qilian Mountains. J. Nanjing For. Univ. (Nat. Sci. Ed.) 2022, 46, 221–226. [Google Scholar]
- Elith, J.; Phillips, S.J.; Hastie, T.; Dudík, M.; Chee, Y.E.; Yates, C.J. A statistical explanation of MaxEnt for ecologists. Divers. Distrib. 2011, 17, 43–57. [Google Scholar] [CrossRef]
- Qin, X.; Li, M. Predicting the Potential Distribution of Oxalis debilis Kunth, an Invasive Species in China with a Maximum Entropy Model. Plants 2023, 12, 3999. [Google Scholar] [CrossRef]
- Anibaba, Q.A.; Dyderski, M.K.; Jagodziński, A.M. Predicted range shifts of invasive giant hogweed (Heracleum mantegazzianum) in Europe. Sci. Total Environ. 2022, 825, 154053. [Google Scholar] [CrossRef]
- Wan, F.H.; Guo, J.Y.; Wang, D.H. Alien invasive species in China: Their damages and management strategies. Biodivers. Sci. 2002, 1, 119–125. [Google Scholar]
- Shao, Y.L.; Cao, W. Prediction of the potential distribution area of invasive alien plant Ambrosia artemisiifolia in Northeast China. J. Arid Land Resour. Environ. 2017, 31, 172–176. [Google Scholar]
- Wang, D.; Feng, Y.L.; Liu, M.C.; Qu, B. Effect of Ambrosia trifida Invasion on Vegetation Succession and Soil Nutrients in the Enclosed Riparian Ecosystems—A Case Study of Liaohe River Main Stream. J. Shenyang Agric. Univ. 2022, 53, 520–531. [Google Scholar]
- Mushtaq, S.; Reshi, Z.A.; Shah, M.A.; Charles, B. Modelled distribution of an invasive alien plant species differs at different spatiotemporal scales under changing climate: A case study of Parthenium hysterophorus L. Trop. Ecol. 2021, 62, 1–20. [Google Scholar] [CrossRef]
- He, W.; Bu, R.C.; Xiong, Z.P.; Hu, Y.M. Characteristics of temperature and precipitation in Northeastern China from 1961 to 2005. Acta Ecol. Sin. 2013, 33, 519–531. [Google Scholar] [CrossRef]
- Ni, C.D. Study on Future Climate Scenario and Their Relationships with Forest Vegetation Patterns in Northeast. Ph.D. Thesis, Northeast Forestry University, Heilongjiang, China, 2011. [Google Scholar]
- Wang, D.; Qu, B.; Zhou, B.; Zhang, Y.R.; Liu, Z. Prediction of potential invasive region for Ambrosia trifida based on SDMs-toolbox with climate warming in Liaoning Province. Ecol. Sci. 2022, 41, 66–74. [Google Scholar]
- Wildlife Conservation Society—WCS, and Center for International Earth Science Information Network—CIESIN—Columbia University. Last of the Wild Project, Version 2, 2005 (LWP-2): Global Human Influence Index (HII) Dataset (Geographic); NASA Socioeconomic Data and Applications Center (SEDAC): Palisades, NY, USA, 2005.
- Sillero, N. What does ecological modelling model? A proposed classification of ecological niche models based on their underlying methods Ecol. Model. 2011, 222, 1343–1346. [Google Scholar]
- Kong, W.Y.; Li, X.H.; Zhou, H.F. Optimizing MaxEnt model in the prediction of species distribution. Chin. J. Appl. Ecol. 2019, 30, 2116–2128. [Google Scholar]
- Morales, N.S.; Fernández, I.C.; Baca-González, V. MaxEnt’s parameter configuration and small samples: Are we paying attention to recommendations? A systematic review. PeerJ 2017, 5, e3093. [Google Scholar] [CrossRef]
- Rong, S.; Luo, P.; Yi, H.; Yang, X.; Zhang, L.; Zeng, D.; Wang, L. Predicting Habitat Suitability and Adaptation Strategies of an Endangered Endemic Species, Camellia luteoflora Li ex Chang (Ericales: Theaceae) under Future Climate Change. Forests 2023, 14, 2177. [Google Scholar] [CrossRef]
- Miao, G.; Zhao, Y.; Wang, Y.; Yu, C.; Xiong, F.; Sun, Y.; Cao, Y. Suitable Habitat Prediction and Analysis of Dendrolimus houi and Its Host Cupressus funebris in the Chinese Region. Forests 2024, 15, 162. [Google Scholar] [CrossRef]
- Qin, Z.; Xiangbao, S.; Xiaolong, J.; Tingting, F.; Xiaocui, L.; Wende, Y. MaxEnt Modeling for Predicting Suitable Habitat for Endangered Tree Keteleeria davidiana (Pinaceae) in China. Forests 2023, 14, 394. [Google Scholar] [CrossRef]
- Liu, W.; Meng, H.; Dong, B.; Fan, J.; Zhu, X.; Zhou, H. Predicting potential distribution of the Rhinoncus sibiricus under climatic in China using MaxEnt. PLoS ONE 2024, 19, e0297126. [Google Scholar] [CrossRef]
- Hamdi, A.; Hassane, M.; Issam, T.; Juan, B.; Abdelhamid, K. Observed and Predicted Geographic Distribution of Acer monspessulanum L. Using the MaxEnt Model in the Context of Climate Change. Forests 2022, 13, 2049. [Google Scholar] [CrossRef]
- He, Y.; Ma, J.; Chen, G. Potential geographical distribution and its multi-factor analysis of Pinus massoniana in China based on the maxent model. Ecol. Indic. 2023, 154. [Google Scholar] [CrossRef]
- Hurtt, G.C.; Chini, L.P.; Frolking, S.; Betts, R.A.; Feddema, J.; Fischer, G.; Fisk, J.P.; Hibbard, K.; Houghton, R.A.; Janetos, A.; et al. Harmonization of land-use scenarios for the period 1500–2100: 600 years of global gridded annual land-use transitions, wood harvest, and resulting secondary lands. Clim. Chang. 2011, 109, 117–161. [Google Scholar] [CrossRef]
- Cobos, M.E.; Townsend, P.A.; Narayani, B.; Luis, O.-O. kuenm: An R package for detailed development of ecological niche models using Maxent. PeerJ 2019, 7, e6281. [Google Scholar] [CrossRef] [PubMed]
- Zheng, Y.; Yuan, C.; Matsushita, N.; Lian, C.; Geng, Q. Analysis of the distribution pattern of the ectomycorrhizal fungus Cenococcum geophilum under climate change using the optimized MaxEnt model. Ecol. Evol. 2023, 13, e10565. [Google Scholar] [CrossRef]
- Zhang, T.; Hu, W.; Jia, T.J.; Zhao, S.Z.; Kong, D.Y.; Liu, Y. Prediction of potential distribution of Sophora flavescens in China under climate change. Guihaia 2022, 42, 349–362. [Google Scholar]
- Ma, J.J.; Li, Y.Y.; Wang, H.Z.; Fan, R.R.; Li, M.; Yan, J.P.; Zhu, Y.; Duan, Y.F. Geographical Distribution and the Prediction of the Potential Distribution of Keteleeria. J. Northwest For. Univ. 2022, 37, 158–165. [Google Scholar]
- Fu, Y.; An, H.J.; Gao, M.L.; Li, H.X.; Zhang, R. Prediction of Potential Distribution Area of Empetrum nigrum var. japonicum Based on Climate Change Background. J. Northwest For. Univ. 2023, 38, 49–56. [Google Scholar]
- Liu, W.; Zhao, R.N.; Sheng, Q.Q.; Geng, X.M.; Zhu, Z.L. Geographical distribution and potential distribution area prediction of Paeonia jishanensis in China. J. Beijing For. Univ. 2021, 43, 83–92. [Google Scholar]
- Guisan, A.; Thuiller, W. Predicting species distribution: Offering more than simple habitat models. Ecol. Lett. 2005, 8, 993–1009. [Google Scholar] [CrossRef]
- Rasmussen, K.; Thyrring, J.; Muscarella, R.; Borchsenius, F. Climate-change-induced range shifts of three allergenic Ambrosia trifidas (Ambrosia L.) in Europe and their potential impact on human health. PeerJ 2017, 5, e3104. [Google Scholar] [CrossRef]
- Ma, Q.Q.; Liu, T.; Dong, H.G.; Wang, H.Y.; Zhao, W.X.; Wang, R.L.; Liu, Y.; Chen, L. Potential geographical distribution of Ambrosia trifida in Xinjiang under climate change. Acta Prataculturae Sin. 2020, 29, 73–85. [Google Scholar]
- Huang, Q.Q.; Shen, Y.D.; Li, X.X.; Cheng, H.T.; Song, X.; Fan, Z.W. Research progress on the distribution and invasiveness of alien invasive plants in China. Ecol. Environ. Sci. 2012, 21, 977–985. [Google Scholar]
- Feng, J.M.; Xu, C.D. Spatial Distribution Pattern of Alien Plants in Yunnan Province and Its Relationship with Environmental Factors and Human Activities. J. Southwest Univ. (Nat. Sci. Ed.) 2009, 31, 78–83. [Google Scholar]
- Silvia, F.; Marco, M.; Fernando, D.P.; Francesco, V. The effect of various after-ripening temperature regimens on the germination behaviour of Ambrosia artemisiifolia. Plant Biosyst. Int. J. Deal. All Asp. Plant Biol. 2020, 154, 165–172. [Google Scholar]
- Wu, H.R.; Qiang, S.; Duan, H.; Lin, J.C. Ragweed (Ambrosia artemisiifolia L.). Weed Sci. 2004, 2, 52–54. [Google Scholar]
- Kang, F.F.; Wei, Y.D.; Yang, F.; Zhang, R.F.; Cheng, Y.; Liu, Y.; Yin, L.P. Effects of different treatments on seed dormancy and germination of Ambrosia artemisiifolia L. Plant Quar. 2010, 24, 14–16. [Google Scholar]
- Liu, X.Y.; Li, J.S.; Zhao, C.Y.; Quan, Z.J.; Zhao, X.J.; Gong, L. Prediction of potential suitable area of Ambrosia artemisiifolia L. in China based on MAXENT and ArcGIS. Acta Phytophylacica Sin. 2016, 43, 1041–1048. [Google Scholar]
- Ding, S.Q. Study on the Occurrence and Distribution of Ambrosia trifida, Growth Limiting Ecological Factors and Chemical Control Technologies. Master’s Thesis, Xinjiang Agricultural University, Xinjiang, China, 2021. [Google Scholar]
- Tang, S.C.; Li, X.Q.; Wei, C.Q.; Pan, Y.M.; Lv, H.S. Current Status and Research Progress of Alien Invasive Plants in Guangxi. J. Guangxi Acad. Sci. 2023, 39, 146–155. [Google Scholar]
- Liang, W.M.; Wang, S.W. Damage and Prevention and Control Measures of Ambrosia trifida. XianDai NongYe KeJi 2010, 24, 160–161. [Google Scholar]
- Guo, C.L.; Ma, Y.F.; Qin, J.L.; Ma, Y.L. Chemical control effects of 30 kinds of herbicides on Ambrosia artemisiifolia and Mikania micrantha. Plant Prot. 2014, 40, 179–183. [Google Scholar]
- Ding, S.Q.; Fu, K.Y.; Ding, X.H.; He, J.; Tuerxun, A.; Zhang, G.L.; Fu, W.D.; Wen, J.; Jiamaliding, W.; Guo, W.C. Screeing of herbicides for controlling Ambrosia artemisiifolia L. in Xinjiang, China. J. Biosaf. 2021, 30, 126–131. [Google Scholar]
- van Wilgen, B.W.; Raghu, S.; Sheppard, A.W.; Schaffner, U. Quantifying the social and economic benefits of the biological control of invasive alien plants in natural ecosystems. Curr. Opin. Insect Sci. 2020, 38, 1–5. [Google Scholar] [CrossRef] [PubMed]
- Morais, E.G.F.; Pican, M.C.; Seme, A.A.; Barreto, R.W.; Rosado, J.F.; Martins, J.C. Lepidopterans as Potential Agents for the Biological Control of the Invasive Plant, Miconia calvescens. J. Insect Sci. 2012, 12, 1–17. [Google Scholar] [CrossRef]

Disclaimer/Publisher’s Note: The statements, opinions and data contained in all publications are solely those of the individual author(s) and contributor(s) and not of MDPI and/or the editor(s). MDPI and/or the editor(s) disclaim responsibility for any injury to people or property resulting from any ideas, methods, instructions or products referred to in the content. |
© 2024 by the authors. Licensee MDPI, Basel, Switzerland. This article is an open access article distributed under the terms and conditions of the Creative Commons Attribution (CC BY) license (https://creativecommons.org/licenses/by/4.0/).