
The Effects of Sampling-Site Intervals on Fish Species Richness in Wadeable Rivers: A Case Study from Taizi River Basin, Northeastern China


Abstract
:1. Introduction
2. Methods
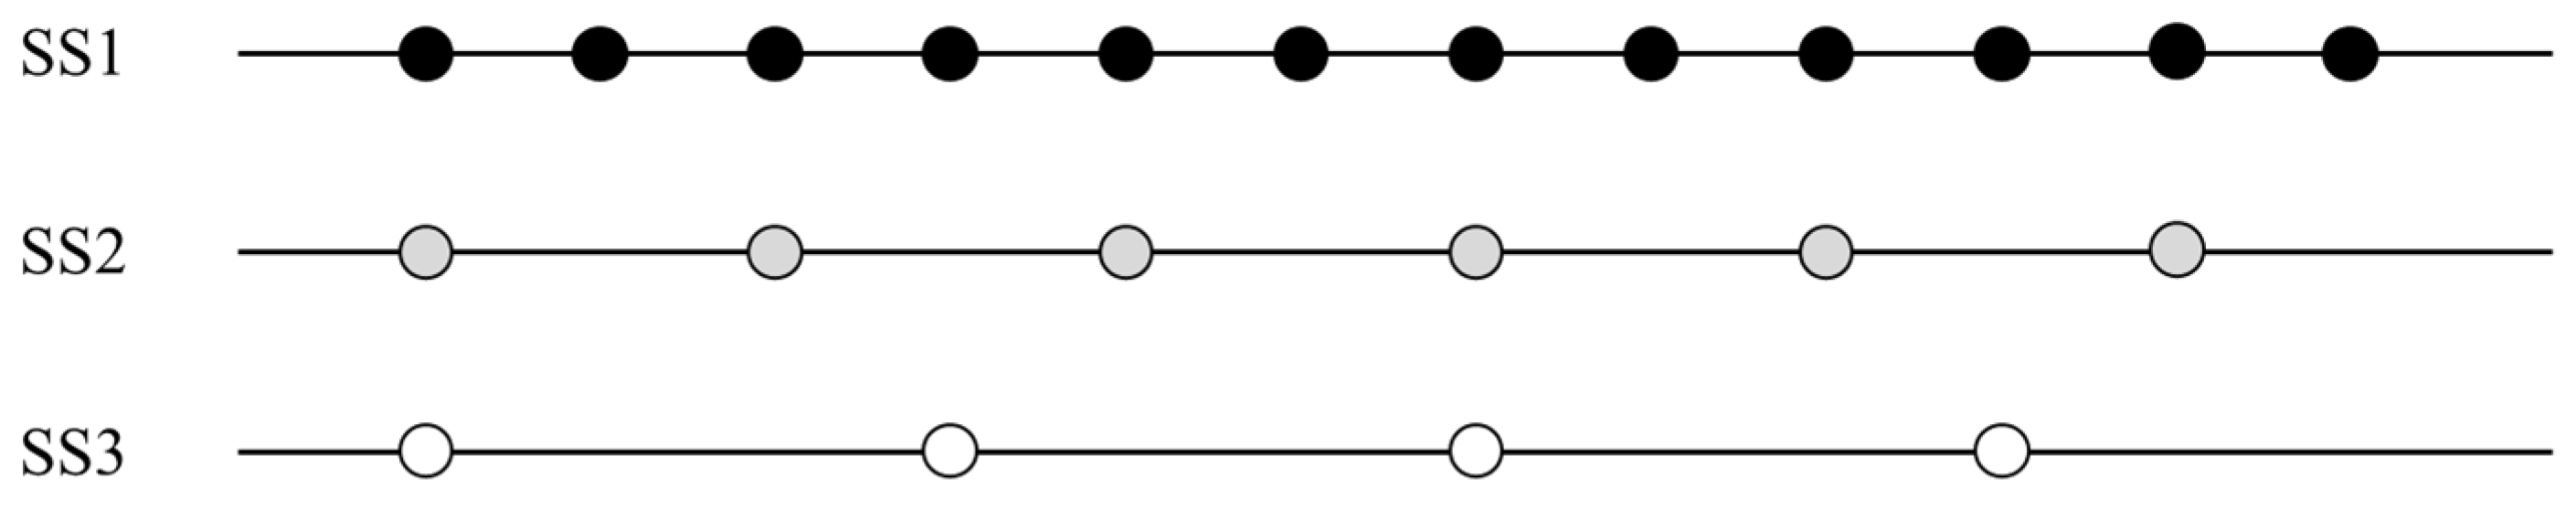
2.1. Study Area and Sampling Scheme
2.2. Fish Sampling Procedure
2.3. Data Analysis
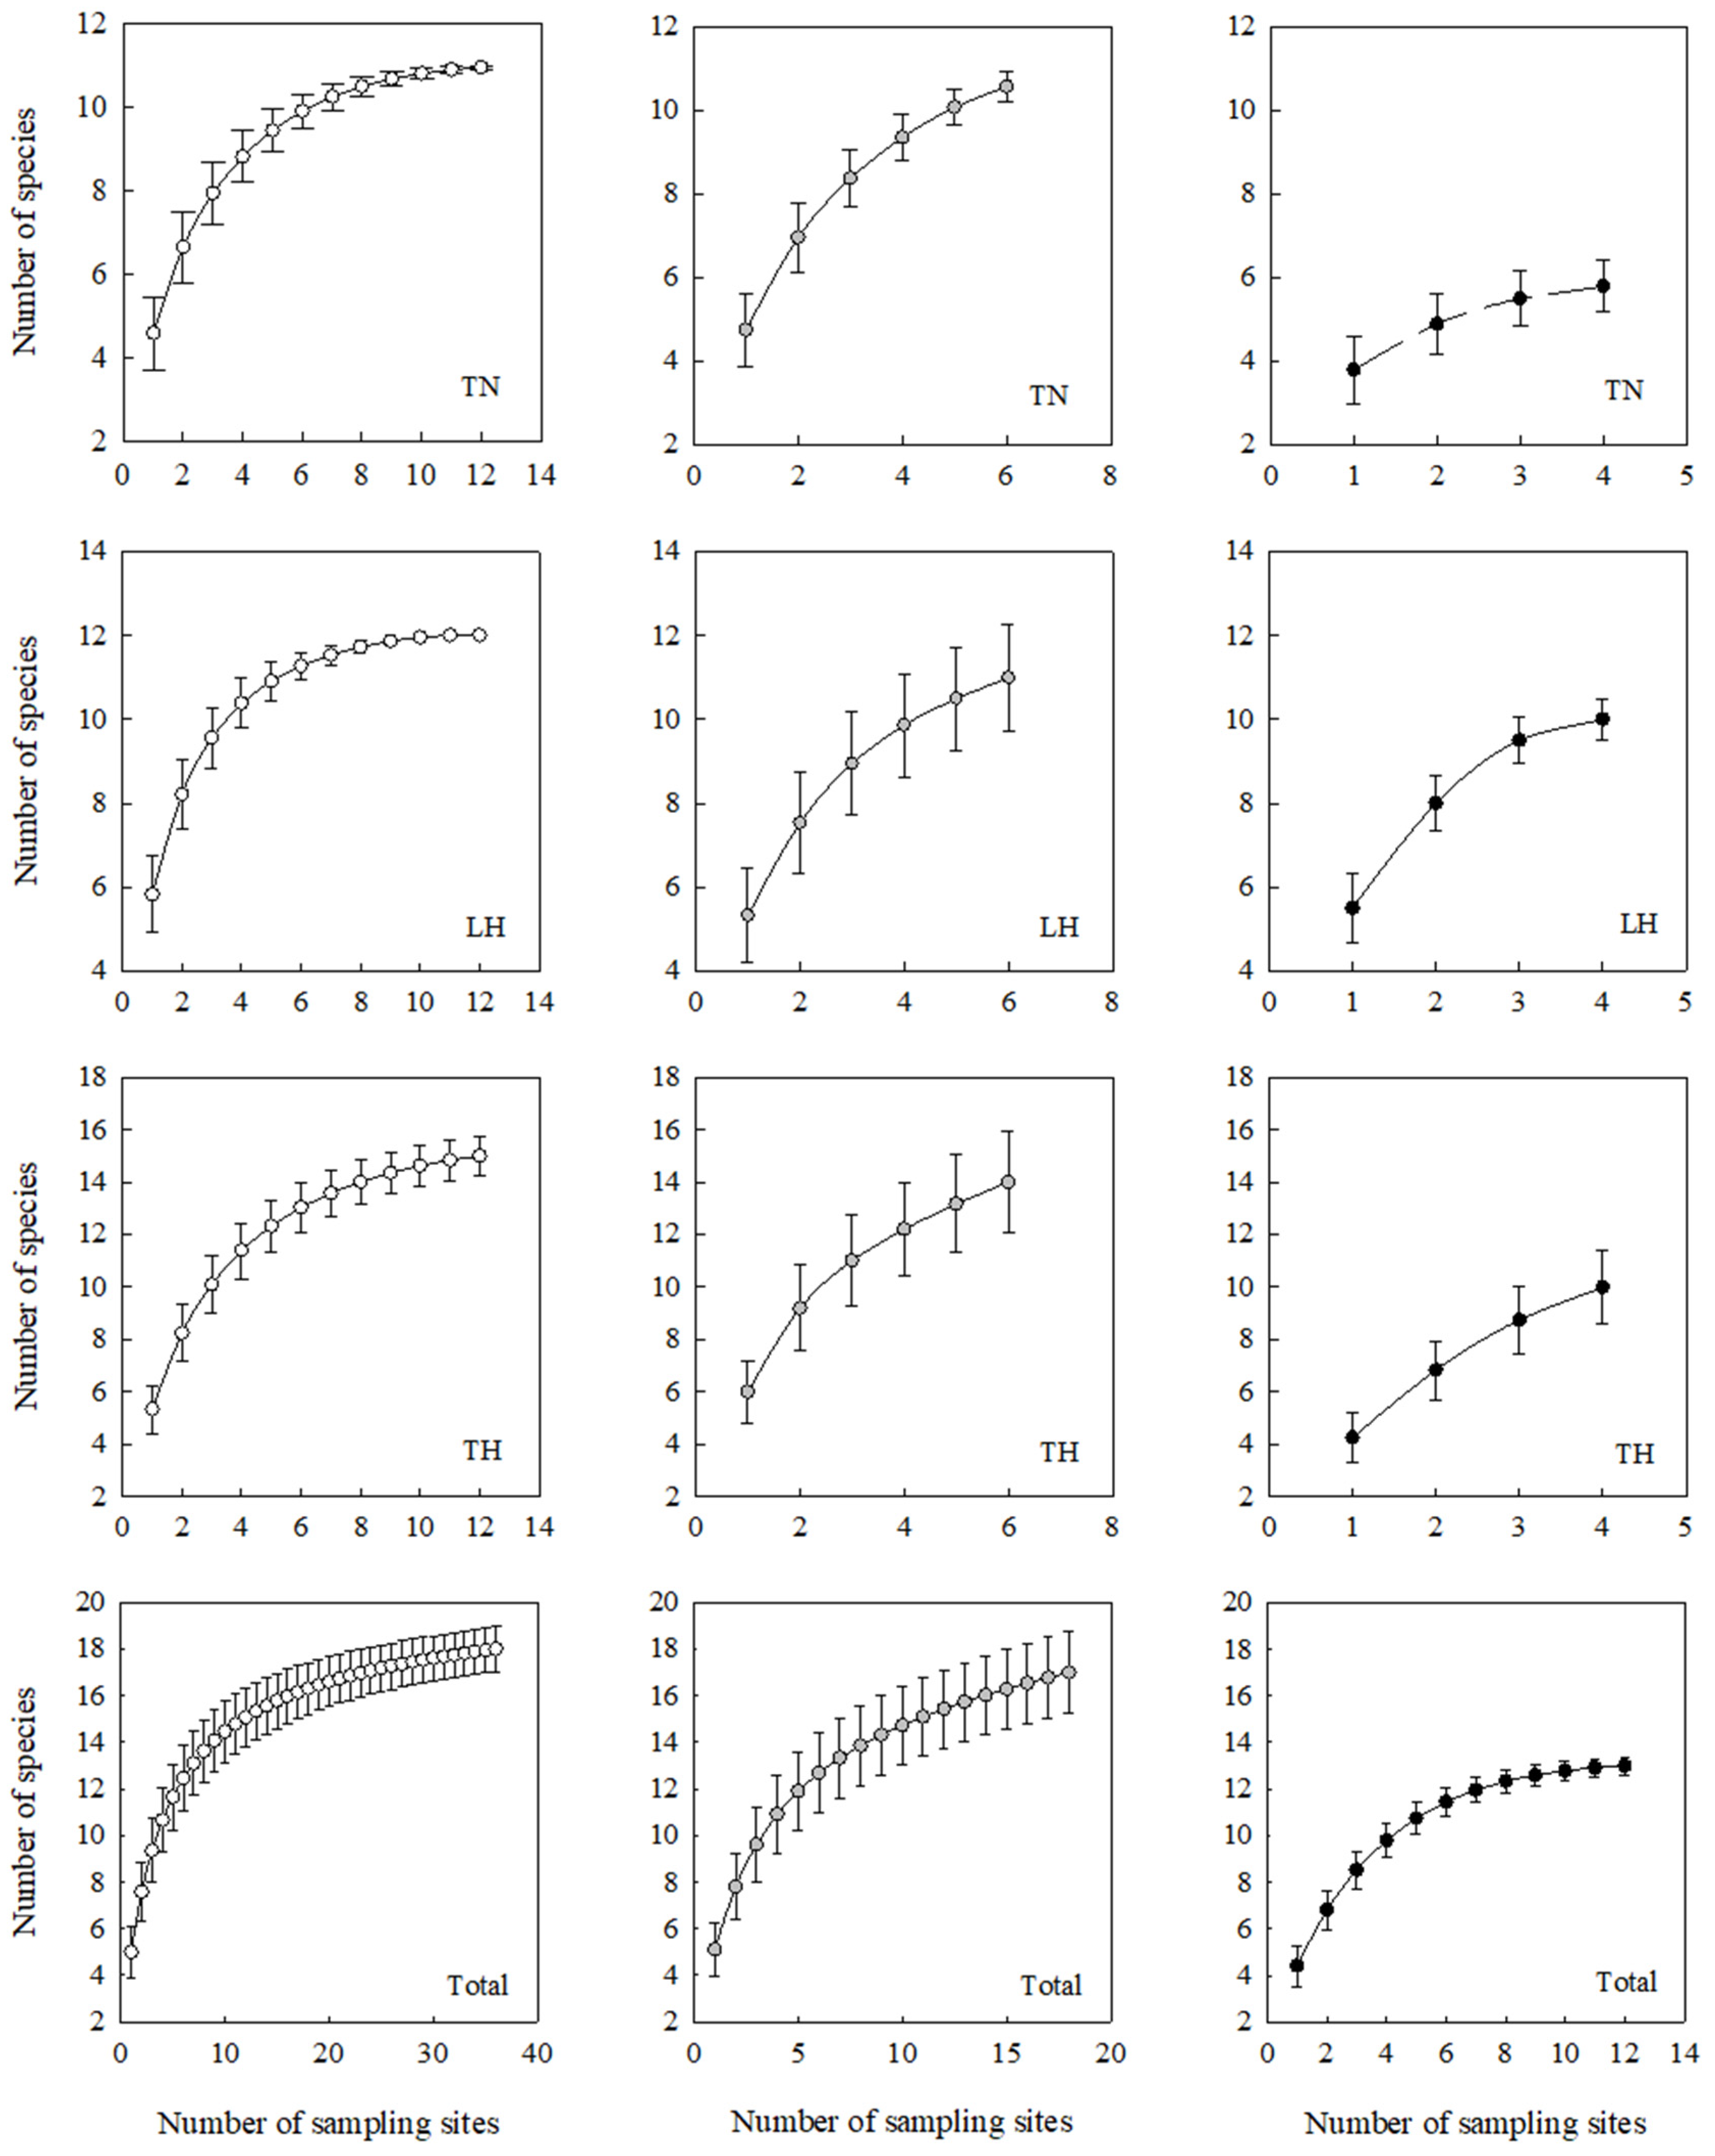
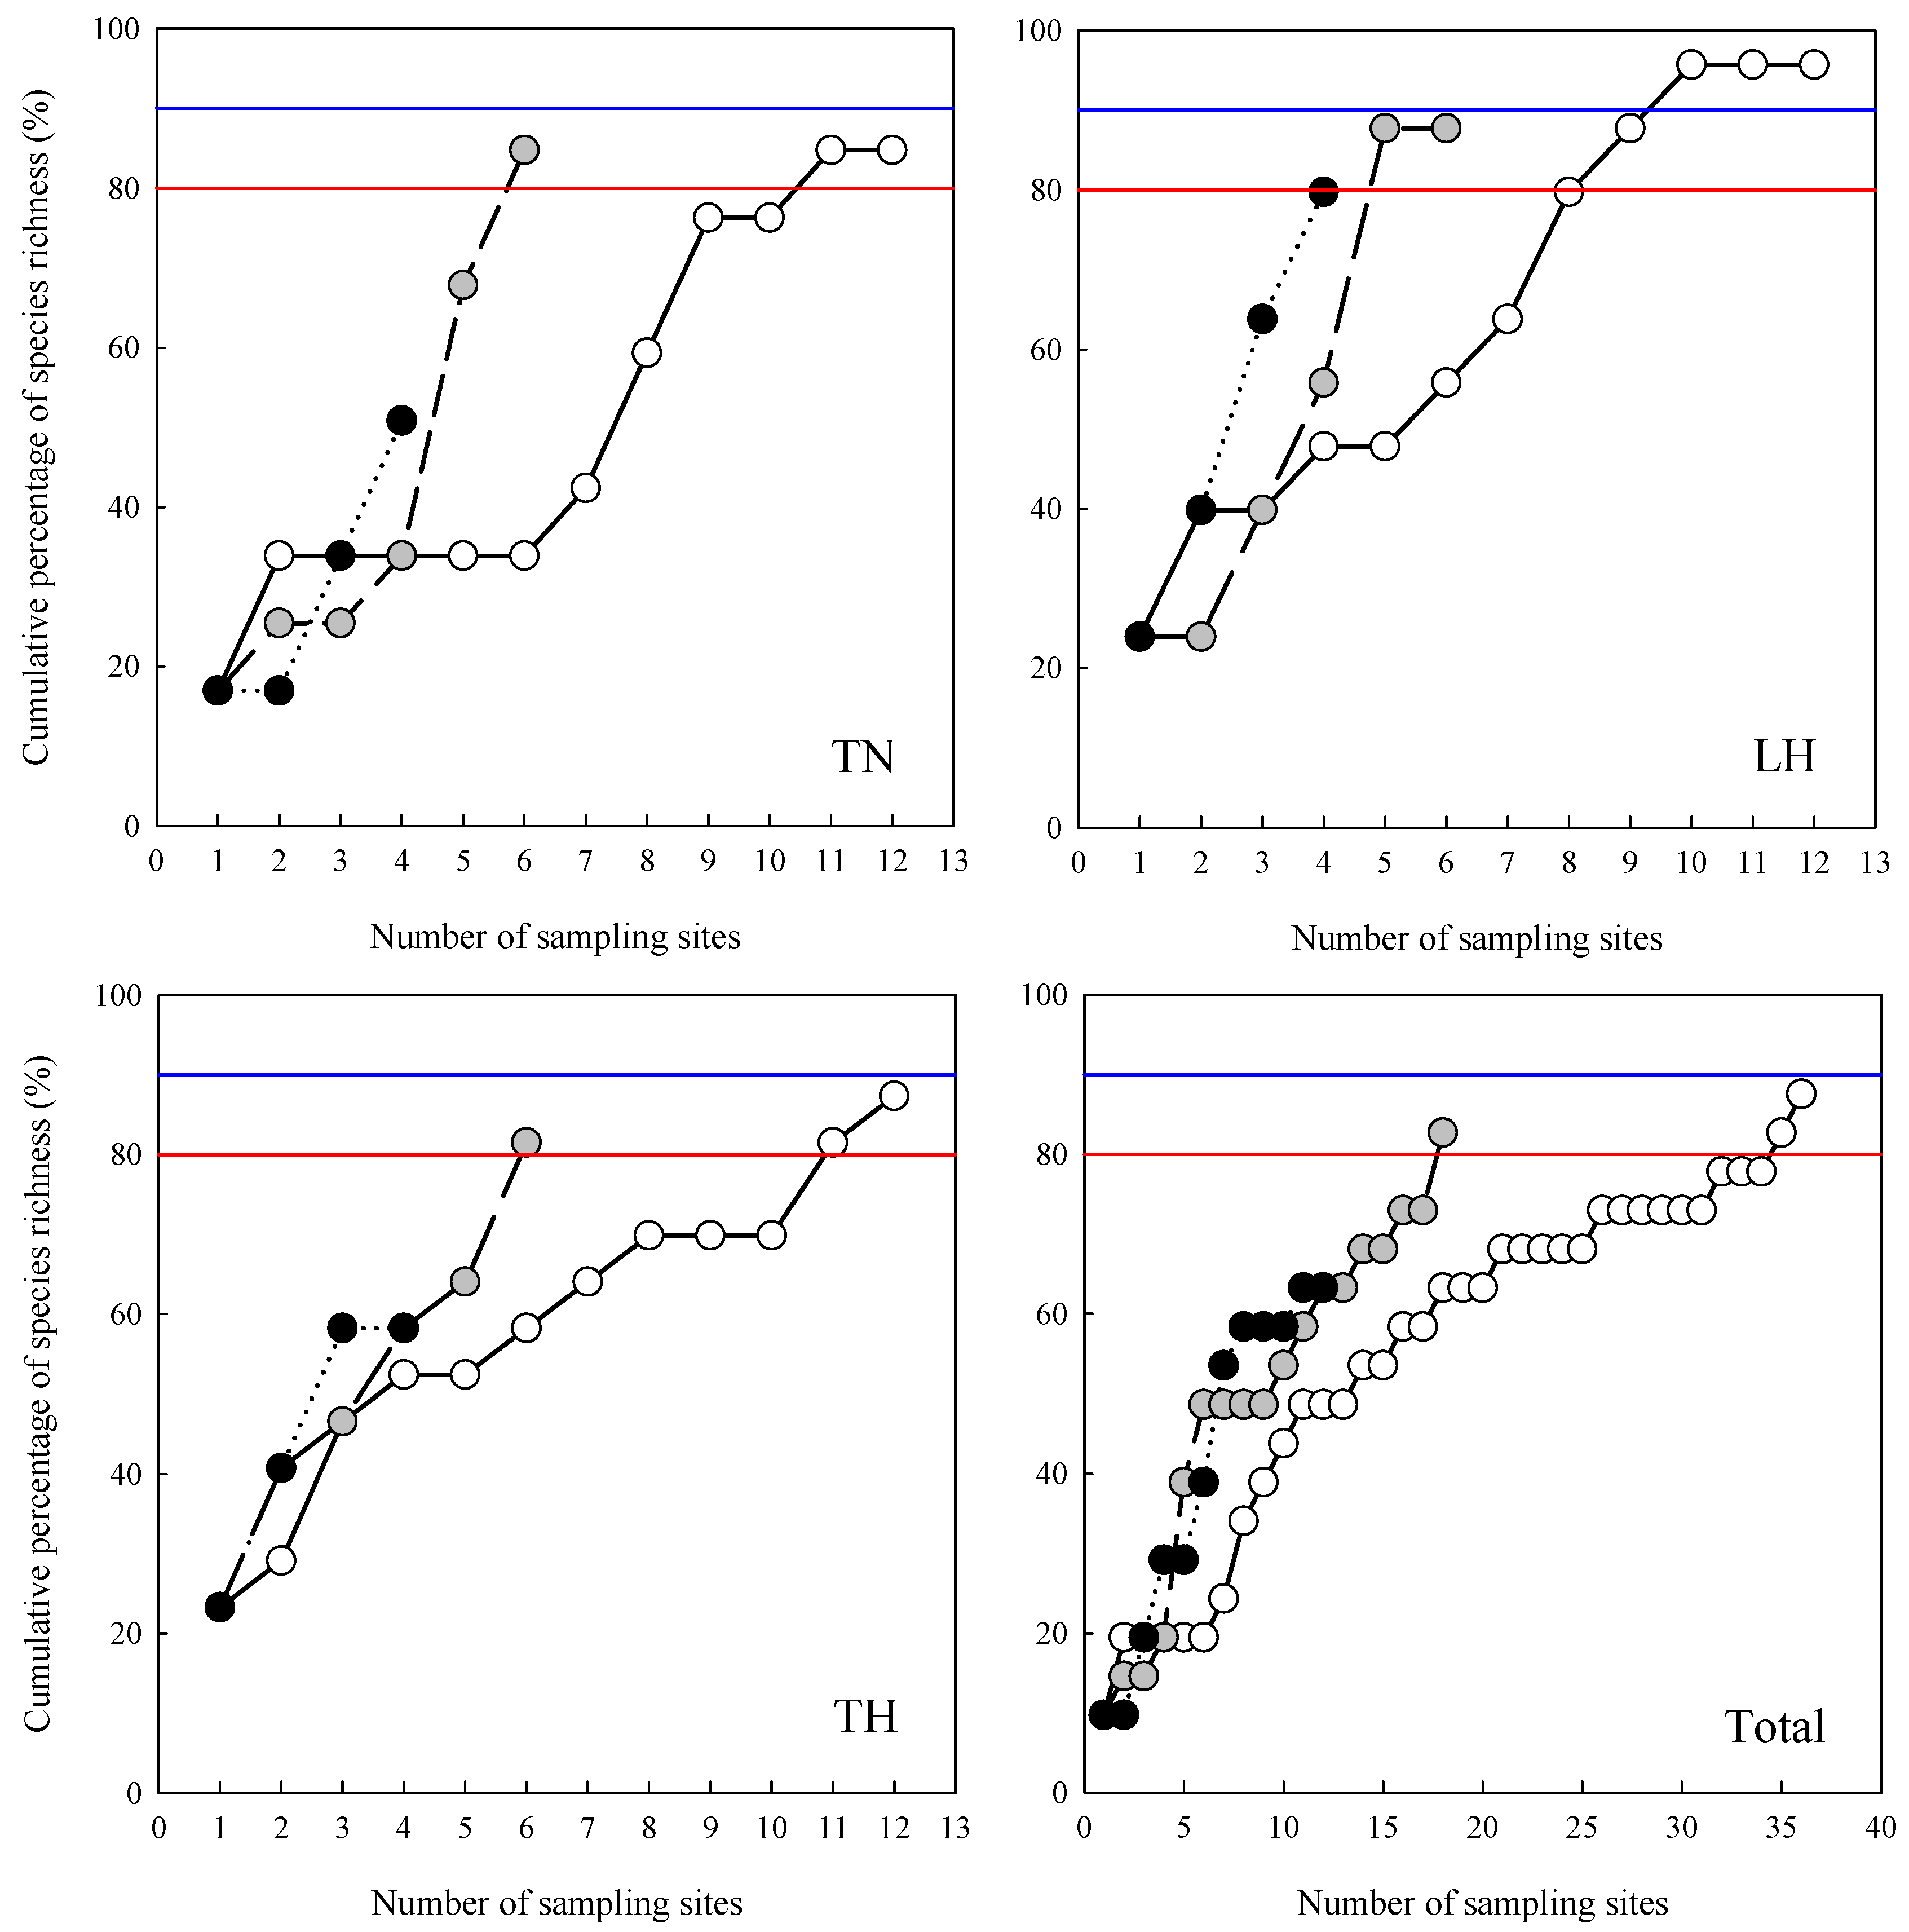
3. Results
4. Discussion
5. Conclusions
Author Contributions
Funding
Institutional Review Board Statement
Data Availability Statement
Conflicts of Interest
Appendix A. List of Environment Variables
| Environmental Variables | Minimum | Maximum | Mean |
| Water temperature (°C) | 8.8 | 17.9 | 13.2 |
| Mean channel depth (cm) | 12 | 36.67 | 17.3767 |
| Mean channel width (m) | 5 | 60 | 16.5333 |
| Mean velocity (m·s−1) | 0.24 | 0.64 | 0.41 |
References
- Simon, T.P.; Morris, C.C.; Robb, J.R.; McCoy, W. Biological diversity, ecological health and condition of aquatic assemblages at national wildlife refuges in southern Indiana, USA. Biodivers. Data J. 2015, 3, e4300. [Google Scholar] [CrossRef] [PubMed]
- Anas, M.U.M.; Mandrak, N.E. Patterns and drivers of native, non-native, and at-risk freshwater fish richness in Canada. Can. J. Fish. Aquat. Sci. 2020, 79, 724–737. [Google Scholar] [CrossRef]
- Dunn, C.G.; Paukert, C.P. A flexible survey design for monitoring spatiotemporal fish richness in nonwadeable rivers: Optimizing efficiency by integrating gears. Can. J. Fish Aquat. Sci. 2020, 77, 978–990. [Google Scholar] [CrossRef]
- Reynolds, L.; Herlihy, A.T.; Kaufmann, P.R.; Gregory, S.V.; Hughes, R.M. Electrofishing effort requirements for assessing species richness and biotic integrity in western Oregon streams. N. Am. J. Fish Manag. 2003, 23, 450–461. [Google Scholar] [CrossRef]
- Fischer, J.R.; Paukert, C.P. Effects of sampling effort, assemblage similarity, and habitat heterogeneity on estimates of species richness and relative abundance of stream fishes. Can. J. Fish Aquat. Sci. 2009, 66, 277–290. [Google Scholar] [CrossRef]
- Terra, B.D.F.; Hughes, R.M.; Araujo, F.G. Sampling sufficiency for fish assemblage surveys of tropical Atlantic Forest streams, southeastern Brazil. Fisheries 2013, 38, 150–158. [Google Scholar] [CrossRef]
- Samarasin, P.; Reid, S.M.; Mandrak, N.E. Optimal sampling effort required to characterize wetland fish communities. Can. J. Fish Aquat. Sci. 2017, 74, 1251–1259. [Google Scholar] [CrossRef]
- Flotemersch, J.E.; Stribling, J.B.; Hughes, R.M.; Reynolds, L.; Paul, M.J.; Wolter, C. Site length for biological assessment of boatable rivers. Riv. Resear. Appl. 2011, 27, 520–535. [Google Scholar] [CrossRef]
- Hughes, R.M.; Herlihy, A.T.; Peck, D.V. Sampling efforts for estimating fish species richness in western USA river sites. Limnologica 2021, 87, 125859. [Google Scholar] [CrossRef]
- Smith, K.L.; Jones, M.L. Watershed-level sampling effort requirements for determining riverine fish species composition. Can. J. Fish Aquat. Sci. 2005, 62, 1580–1588. [Google Scholar] [CrossRef]
- Robinson, W.A.; Lintermans, M.; Harris, J.H.; Guarino, F. A landscape-scale electrofishing monitoring program can evaluate fish responses to climatic conditions in the Murray-Darling River system, Australia. In Advances in Understanding Landscape Influences on Freshwater Habitats and Biological Assemblages; Symposium 90; Hughes, R.M., Infante, D.M., Wang, L., Chen, L., Terra, B.F., Eds.; American Fisheries Society: Bethesda, Maryland, 2019; pp. 179–201. [Google Scholar]
- Vehanen, T.; Sutela, T.; Jounela, P.; Huusko, A.; Mäki-Petäys, A. Assessing electric fishing sampling effort to estimate stream fish assemblage attributes. Fish. Manag. Ecol. 2013, 20, 10–20. [Google Scholar] [CrossRef]
- Cao, Y.; Larsen, D.P.; Hughes, R.M. Evaluating sampling sufficiency in fish assemblage survey: A similarity based approach. Can. J. Fish. Aquat. Sci. 2001, 58, 1782–1793. [Google Scholar] [CrossRef]
- Lyons, J. The length of stream to sample with a towed electrofishing unit when fish species richness is estimated. N. Am. J. Fish. Manag. 1992, 12, 198–203. [Google Scholar] [CrossRef]
- Paller, M.H. Relationships among number of fish species sampled, reach length surveyed, and sampling effort in South Carolina coastal plain streams. N. Am. J. Fish. Manag. 1995, 15, 110–120. [Google Scholar] [CrossRef]
- Peck, D.V.; Herlihy, A.T.; Hill, B.H.; Hughes, R.M.; Kaufmann, P.R.; Klemm, D.J.; Lazorchak, J.M.; McCormick, F.H.; Peterson, S.A.; Ringold, P.L.; et al. Environmental Monitoring and Assessment Program–Surface Waters: Western Pilot Study Field Operations Manual for Wadeable Streams; U.S. Environmental Protection Agency: Washinton, DC, USA, 2006. [Google Scholar]
- Fausch, K.D.; Torgersen, C.E.; Baxter, C.V.; Li, H.W. Landscapes to riverscapes: Bridging the gap between research and conservation of stream fishes. Bioscience 2002, 52, 483–498. [Google Scholar] [CrossRef]
- Kennard, M.J.; Pusey, B.J.; Harch, B.D.; Dore, E.; Arthington, A.H. Estimating local stream fish assemblage attributes: Sampling effort and efficiency at two spatial scales. Mar. Freshw. Res. 2006, 57, 635–653. [Google Scholar] [CrossRef]
- Cheek, B.D.; Grabowski, T.B.; Bean, P.T.; Groeschel, J.R.; Magnelia, S.J. Evaluating habitat associations of a fish assemblage at multiple spatial scales in a minimally disturbed stream using low-cost remote sensing. Aquat. Conserv. 2015, 26, 20–34. [Google Scholar] [CrossRef]
- Spurgeon, J.J.; Pegg, M.A.; Parasiewicz, P.; Rogers, J. Diversity of river fishes influenced by habitat heterogeneity across hydrogeomorphic divisions. River Res. Appl. 2018, 34, 797–806. [Google Scholar] [CrossRef]
- Kanno, Y.; Vokoun, J.C.; Dauwalter, D.C.; Hughes, R.M.; Herlihy, A.T.; Maret, T.R.; Patton, T.M. Influence of rare species on electrofishing distance when estimating species richness of stream and river reaches. Trans. Am. Fish. Soc. 2009, 138, 1240–1251. [Google Scholar] [CrossRef]
- Pritt, J.J.; Frimpong, E.A. The effect of sampling intensity on patterns of rarity and community assessment metrics in stream fish samples. Ecol. Indic. 2014, 39, 169–178. [Google Scholar] [CrossRef]
- Sgarbi, L.F.; Bini, L.M.; Heino, J.; Jyrkänkallio-Mikkola, J.; Landeiro, V.L.; Santos, E.P.; Schneck, F.; Siqueira, T.; Soininen, J.; Tolonen, K.T.; et al. Sampling effort and information quality provided by rare and common species in estimating assemblage structure. Ecol. Indic. 2020, 110, 105937. [Google Scholar] [CrossRef]
- Wang, H.; Wang, P.; Xu, C.; Sun, Y.; Shi, L.; Zhou, L.; Jeppesen, E.; Chen, J.; Xie, P. Can the “10-year fishing ban” rescue biodiversity of the Yangtze River? Innovation 2022, 3, 100235. [Google Scholar] [CrossRef]
- Guo, X.; Lin, Q.; Zheng, X.; Wang, S.; Li, Q.; Shi, C. Protect native fish in China’s Yellow River. Science 2024, 383, 598. [Google Scholar] [CrossRef]
- Zhang, Y.; Ding, S.; Bentsen, C.N.; Ma, S.; Jia, X.; Meng, W. Differences in stream fish assemblages subjected to different levels of anthropogenic pressure in the Taizi River catchment, China. Ichthyol. Res. 2015, 62, 450–462. [Google Scholar] [CrossRef]
- Kong, W.; Meng, W.; Zhang, Y.; Gipple, C.; Qu, X. A freshwater ecoregion delineation approach based on freshwater macroinvertebrate community features and spatial environmental data in Taizi River Basin, northeastern China. Ecol. Res. 2013, 28, 581–592. [Google Scholar] [CrossRef]
- Bu, H.; Meng, W.; Zhang, Y.; Wan, J. Relationships between land use patterns and water quality in the Taizi River basin, China. Ecol. Indic. 2014, 41, 187–197. [Google Scholar] [CrossRef]
- Scrimgeour, G.J.; Hvenegaard, P.J.; Tchir, J. Cumulative industrial activity alters lotic fish assemblages in two boreal forest watersheds of Alberta, Canada. Environ. Manag. 2008, 42, 957–970. [Google Scholar] [CrossRef]
- Lazorchak, J.M.; Klemm, D.J.; Peck, D.V. (Eds.) Environmental Monitoring and Assessment Program—Surface Water: Field Operations and Methods for Measuring the Ecological Conditions of Wadeable Streams; EPA/620/R-94/004; Environmental Monitoring Systems Laboratory, Office of Research and Development, U.S. Environmental Protection Agency: Cincinnati, OH, USA, 1995. [Google Scholar]
- Colwell, R.K.; Mao, C.X.; Chang, J. Interpolating, extrapolating, and comparing incidence-based species accumulation curves. Ecology 2004, 85, 2717–2727. [Google Scholar] [CrossRef]
- Colwell, R.K. EstimateS: Statistical Estimation of Species Richness and Shared Species from Samples Version 9. 2013. Available online: https://purl.oclc.org/estimates (accessed on 3 May 2024).
- Moreno, C.E.; Halffter, G. Assessing the completeness of bat biodiversity inventories using species accumulation curves. J. Appl. Ecol. 2000, 37, 149–158. [Google Scholar] [CrossRef]
- Thompson, G.G.; Thompson, S.A. Using species accumulation curves to estimate trapping effort in fauna surveys and species richness. Austral Ecol. 2007, 32, 564–569. [Google Scholar] [CrossRef]
- Willott, S.J. Species accumulation curves and the measure of sampling effort. J. Appl. Ecol. 2001, 38, 484–486. [Google Scholar] [CrossRef]
- Soberón, M.J.; Llorente, B.J. The use of species accumulation functions for the prediction of species richness. Conserv. Biol. 1993, 7, 480–488. [Google Scholar] [CrossRef]
- Palmer, M.W. The estimation of species richness: The second-order jackknife reconsidered. Ecology 1991, 72, 1512–1513. [Google Scholar] [CrossRef]
- Colwell, R.K.; Coddington, J.A. Estimating terrestrial biodiversity through extrapolation. Philos. Trans. R. Soc. Lond. B 1994, 345, 101–118. [Google Scholar]
- João, C.C.; Nelson, V.; Markus, M.; Jeremy, C.T.; Martin, W. Estimation of regional richness in marine benthic communities: Quantifying the error. Limnol. Oceanogr.-Meth. 2008, 6, 580–590. [Google Scholar]
- Pompeu, P.S.; de Carvalho, D.R.; Leal, C.G.; Leitão, R.P.; Alves, C.B.M.; Braga, D.F.; Castro, M.A.; Junqueira, N.T.; Hughes, R.M. Sampling efforts for determining fish species richness in megadiverse tropical regions. Environ. Biol. Fish 2021, 104, 1487–1499. [Google Scholar] [CrossRef]
- Ross, J.E.; Mayer, C.M.; Tyson, J.T.; Weimer, E.J. Comparison of electrofishing techniques and effort allocation across diel time periods, seasons, sites, and habitat in the Ohio coastal waters of western Lake Erie. N. Am. J. Fish. Manag. 2016, 36, 85–95. [Google Scholar] [CrossRef]
- Blackman, R.C.; Osathanunkul, M.; Brantschen, J.; Di Muri, C.; Harper, L.R.; Mächler, E.; Hänfling, B.; Altermatt, F. Mapping biodiversity hotspots of fish communities in subtropical streams through environmental DNA. Sci. Rep. 2021, 11, 10375. [Google Scholar] [CrossRef]


| Name | SS1 | SS2 | SS3 | |||||||||
|---|---|---|---|---|---|---|---|---|---|---|---|---|
| TN | LH | TH | Total | TN | LH | TH | Total | TN | LH | TH | Total | |
| Abbottina rivularis | - | 140 | 57 | 197 | - | 19 | 16 | 35 | - | 36 | 2 | 38 |
| Abbottina liaoningensis | 1 | 27 | 15 | 43 | 1 | 19 | 6 | 26 | - | 6 | 3 | 9 |
| Barbatula nuda | 42 | 361 | 38 | 441 | 26 | 180 | 9 | 215 | 5 | 123 | 5 | 133 |
| Carassius auratus | - | 3 | 3 | 6 | - | 1 | 1 | 2 | - | - | - | 0 |
| Cobitis granoei | 5 | 30 | 9 | 44 | 3 | 15 | 5 | 23 | 1 | 7 | 1 | 9 |
| Cottus poecilopus | 95 | - | - | 95 | 52 | - | - | 52 | 37 | - | - | 37 |
| Gobio cynocephalus | - | 49 | - | 49 | - | 35 | - | 35 | - | 27 | - | 27 |
| Lampetra mori | - | 3 | 6 | 9 | - | - | 2 | 2 | - | 3 | 4 | 7 |
| Lefua costata | - | - | 4 | 4 | - | - | 1 | 1 | - | - | 1 | 1 |
| Leuciscus waleckii ## | - | - | 2 | 2 | - | - | 1 | 1 | - | - | - | 0 |
| Misgurnus anguillicaudatus | 4 | 17 | 19 | 40 | 3 | 2 | 18 | 23 | - | 2 | 6 | 8 |
| Odontobutis obscurus | 178 | 7 | 11 | 196 | 69 | 3 | 8 | 80 | 48 | 1 | 6 | 55 |
| Phoxinus lagowskii | 1304 | 604 | 226 | 2134 | 672 | 179 | 134 | 985 | 547 | 142 | 86 | 775 |
| Pseudorasbora parva | 4 | 5 | 3 | 12 | 4 | 3 | 1 | 8 | - | 2 | - | 2 |
| Silurus asotus # | - | - | 1 | 1 | - | - | 1 | 1 | - | - | - | 0 |
| Squalidus chankaensis # | - | - | 5 | 5 | - | - | - | 0 | - | - | - | 0 |
| Squalidus wolterstorffi ## | 8 | - | - | 8 | 5 | - | - | 5 | - | - | - | 0 |
| Zacco platypus | 10 | 4 | - | 14 | 4 | 2 | - | 6 | 6 | - | - | 6 |
Disclaimer/Publisher’s Note: The statements, opinions and data contained in all publications are solely those of the individual author(s) and contributor(s) and not of MDPI and/or the editor(s). MDPI and/or the editor(s) disclaim responsibility for any injury to people or property resulting from any ideas, methods, instructions or products referred to in the content. |
© 2024 by the authors. Licensee MDPI, Basel, Switzerland. This article is an open access article distributed under the terms and conditions of the Creative Commons Attribution (CC BY) license (https://creativecommons.org/licenses/by/4.0/).
Share and Cite
Yu, M.; Li, Z.; Zhao, Q.; Ding, S. The Effects of Sampling-Site Intervals on Fish Species Richness in Wadeable Rivers: A Case Study from Taizi River Basin, Northeastern China. Diversity 2024, 16, 330. https://doi.org/10.3390/d16060330
Yu M, Li Z, Zhao Q, Ding S. The Effects of Sampling-Site Intervals on Fish Species Richness in Wadeable Rivers: A Case Study from Taizi River Basin, Northeastern China. Diversity. 2024; 16(6):330. https://doi.org/10.3390/d16060330
Chicago/Turabian StyleYu, Mingqiao, Zhao Li, Qian Zhao, and Sen Ding. 2024. "The Effects of Sampling-Site Intervals on Fish Species Richness in Wadeable Rivers: A Case Study from Taizi River Basin, Northeastern China" Diversity 16, no. 6: 330. https://doi.org/10.3390/d16060330
APA StyleYu, M., Li, Z., Zhao, Q., & Ding, S. (2024). The Effects of Sampling-Site Intervals on Fish Species Richness in Wadeable Rivers: A Case Study from Taizi River Basin, Northeastern China. Diversity, 16(6), 330. https://doi.org/10.3390/d16060330