Abstract
Passerines are the most successfully diversified bird order (around 60% of all avian species). They have developed complicated songs to defend their territories and to attract females for mating that can evolve quickly due to cultural transmission. Complex singing as well as plumage coloration of male birds are honest signals for potential partners and provide information about the males’ quality. To function as honest signals, both traits must be costly for the males. Of course, not all passerine species are equally clever or beautiful. Even within a single family of 50 to 70 species, relevant traits may vary considerably. Tits and chickadees (Paridae) comprise species of similar size, varying a lot in coloration and plumage pattern. The territorial songs are relatively short and simple. We investigated the relationship between song complexity and plumage coloration, taking phylogenetic relationships into account. We studied 55 out of the 64 species with 1084 song recordings retrieved from an online database. In the best model, besides colorfulness, body size had a negative impact on song complexity. Large colorful species were found to sing less complex songs. This result supports the hypothesis of a trade-off between costly traits and their likely intense signal function. This study contributes to a better understanding of how sexual selection influences the diversification of traits. In addition, we found that despite the relatively uniform size, the general negative correlation between body size and song frequency can be recovered. Some song traits are further influenced by distribution and thus by interspecific differences in climate niche.
Keywords:
macroevolution; bioacoustics; Paridae; songbirds; song evolution; macroecology; comparative study 1. Introduction
In the course of evolution, various traits developed within a given clade. The reasons for the preservation of certain traits are natural selection and sexual selection. Natural selection can have an influence on the survival of the individual, whereas sexual selection has an influence on the reproductive success of an individual [1]. Both can affect traits in opposite directions.
The mechanism of female selection is common in birds. In songbirds in particular, song serves not only to defend territories and recognize species but also to attract mates [2,3,4]. The complexity of song is particularly strongly determined by sexual selection [3], with female birds preferring a more complex song [5]. It has been shown that complex songs are more difficult to produce and mean higher energetic costs for the male [6]. Furthermore, it has been shown that the complexity of the song provides information about how well the male has developed after hatching. The brain regions responsible for the development of song complexity develop better in well-fed males, allowing them to sing more complex songs [7,8].
Additionally, the plumage coloration of male birds serves, besides species, sex, and age recognition, also for the attraction of females [9]. In this way, the male sends the female information about his nutritional health state [10,11,12,13]. Thus, plumage coloration can be a signal for lower parasite susceptibility and show that the male is good at finding food [11,14,15]. According to the good-gene hypothesis [16], well-fed and healthy males can feed the offspring well and they are also less susceptible to parasites [1,17]. By passing the good genes on from the father to the offspring, and with a better food supply during the rearing of the young, the survival probability of the offspring would increase, which is a fitness advantage for the female [18].
Thus, plumage color and song complexity serve as honest signals to the female and give information about the quality of the male. In other words, song complexity and plumage color are condition dependent, as they reflect the condition of the male [19].
According to the handicap principle, preference is given to traits that are very costly to develop, so that they cannot be falsified [20]. Only males that can afford these handicaps are best suited for reproduction [20]. A colorful plumage also comes with a cost (e.g., greater conspicuity to predators). Thus, it is to be expected that a trade-off will be made between costly traits due to limited resources [21].
Badyaev et al. [19] already demonstrated a trade-off between song complexity and plumage coloration in cardueline finches. However, other studies on trogons (Trogonidae) and tanagers (Thraupidae) did not show any correlation between these traits [22,23].
In the present study, the relationship between the two traits, song complexity and plumage coloration, was investigated in Paridae. Only traits of males were considered, since song was detected in females, but they sing very little and do not use it for courting males [24]. The Paridae (Table S1) belong to the suborder of songbirds [25] and learn their singing, which makes their songs very complex [3]. It has already been shown that females prefer males that sing more complex songs [5]. Likewise, parids exhibit a wide variation of strikingly colored plumage, such as the Canary Island tit, which has a greater number of different colors compared to, e.g., the plain-colored dusky tit (“Handbook of the Birds of the World”, HBW, [26]). In addition, parids are found throughout the Holarctic as well as in the Afrotropics and Indo-Malayan realm [27], which means that other variables, depending on the respective environment, could also influence the expression of song traits. Thus, other possible explanatory variables such as body size, elevational distribution, and climate niche have been included in order to draw better conclusions about the possible causes for the formation of a trade-off and the overall influence they have on song traits. Tits (Table S1) are therefore an excellent study group for investigating the relationship between song complexity and plumage coloration (Table S2).
Based on the theory that song complexity and plumage coloration are high costs for the male to act as an honest signal, and with limited resources, we hypothesize that more colorful parids sing in a less complex way and thus we expect a trade-off between the two traits. There are certainly other factors influencing song complexity (and other traits), such as body size and environmental variables, but we do not expect them to significantly confound our main research question.
2. Materials and Methods
All statistical analyses and calculations as well as the bioacoustic analysis were performed with R (Version 3.5.3; [28]).
2.1. Song
Bird vocalizations are categorized as calls and songs. Calls are simple, short sounds and serve as the communication between mating partners, rivals, parents, and young within and between species [29]. However, they are difficult to homologize because they are used in various behavioral contexts and are not relevant in the context investigated here. Song, on the other hand, consists of long and complex vocalizations and is specifically used in the context of territory defense and mate advertisement [3].
Song can be represented in sonagrams for visualization [29] and sonagrams thus show sound events. The frequency of a sound is given in kilohertzes and is plotted over time in seconds. The color scale gives information about the volume. The song is divided into verses. A verse consists of a coherent sequence of certain elements, syllables, or phrases, separated from the next by a longer pause. Elements are the smallest sound events, represented by a continuous coloration in the sonagram. Syllables are a coherent sequence of elements that are not very different in type. A phrase consists of a mostly rhythmic sequence of elements or syllables of the same type.
2.2. Data Source and Selection
The metadata table of parid recordings was downloaded from the Xeno-Canto.org database on 4 August 2019 (Table S3). The selection of the recordings was made according to the criteria “song” as the type of vocal expression of male parids with a recording quality of category “A” (“A”: Best quality to “D”: Worst quality; Table S3). Recordings with a recording quality of “B” through “D” were only used if no category “A” recordings were available for a species. For the Miombo tit, the cinnamon-breasted tit, and the ground tit, the only vocalizations were categorized as calls, which were thus not included in the analysis. For the white-fronted tit, it was not certain if they were songs and there was no information on quality. For the stripe-breasted tit, it was also not certain whether the vocalizations were a call or a song. The ground tit is a clear exception. It shows a distinctive social behavior, which is an important component for survival on the Qinghai-Tibetan Plateau. Thus, its survival is increased by cooperative breeding [30]. This may explain the lack of song recordings in the database, as it does not sing as the other parid species do [31].
From a total of 12,171 recordings in the metadata table (Table S3), 1329 for 59 parid species were selected and downloaded according to the criteria above.
2.3. Analysis
For bioacoustic analysis, the R packages warbleR (version 1.1.15; [32]), bioacoustics (version 0.2.0; [33]), and seewave (version 2.1.3; [34]) were used. First, the selected recordings were converted from mp3 to wav format so that they could be processed by the Python script later. Using the package pyAudioAnalysis [35] in Python (version 3.6.6; [36]) and the functions audioSegmentation and audioBasic, which contained an artificial intelligence (AI), the selected song recordings were divided into verses and vocal breaks were removed. The AI learned what “song” was and what was not part of the song in each recording, and it then determined the time where the respective verses would begin and end. The segment times were stored in a file for later use. In a few of the song recordings, there was too much noise, so the AI could not distinguish the songs from song pauses. The verses from these song recordings were measured using Raven Pro (Version 1.5; [37]). All the other verses divided by the AI were then further processed in R for further cleanup. For this purpose, a verse with a duration greater than 1 s was retained and all shorter verses and sounds that were outside the range of 1.3–8.0 kHz were discarded (Pearse et al. [38] adapted according to Bergmann et al. [29]). The following sonagraphic analysis was performed with every verse (Table S2): To assess the spectral characteristics, the duration, mean, median and peak frequencies of a verse were recorded. The peak frequency represented the frequency at which the amplitude was highest. As measures of song complexity, the standard deviation of the frequency, the interquartile range of the frequency, and the Shannon entropy were measured, following Pearse et al. [38]. The entropy of a random noise tends towards 1, while the entropy of a pure sound signal tends towards 0 [38]. The measured values for all verses (Table S4) were first aggregated with median per recording (male; Table S5) and then per species (Table S1).
2.4. Explanatory Variables
2.4.1. Colorfulness
To define the colorfulness, we first determined that 13 primary colors, red, yellow, white, black, light gray, dark gray, light brown, dark brown, light blue, dark blue, light orange, dark orange, and dark green were present in the 64 parid species (Table S1). The colors were determined using pictures of adult male birds in the “Illustrated Checklist of the Birds of the World” [39]. The number of different colors, which occurred per species, represented the colorfulness (Table S1).
Furthermore, the plumage was divided into nine plumage regions, namely breast, belly, bib, cheek, crown, nape, axle, tail, and wings. For the upper side of the wing and tail, the primary colors and, additionally, the secondary colors were listed separately, if they differed from the primary color. The primary color of each region represented the color that was most common there. The secondary color could, for example, appear in the form of a wing bar. If more than one color was present for a plumage region, this was also noted. For example, in the case of the great tit, which has a black stripe in the breast and belly regions, the colors black and yellow were written down (Table S1).
2.4.2. Color Diversity
In addition to colorfulness, the Shannon index was used to determine the color diversity of a species, where pi represents the percentage of a specific color per species across all plumage regions. For example, the color black occurs three times across all eleven plumage regions in the Owston’s tit. Thus, pi for the color black is 0.27. Values for color diversity ranged from 0.0 to 1.5 (Table S1).
2.4.3. Elevational Distribution, Body Length and Mass
To test other potential explanatory variables, we also included data on elevational distribution, body length, and mass. This information was taken from the HBW [26]. Since parids have a diversity hotspot in the Sino-Himalayas [40], vertical segregation along resources and interspecific competition on different elevational belts play an important role. The highest and lowest elevational distributions were selected and averaged. Body length and mass served as proxies for the overall body size. For the data of body mass and length, the mean values and logarithms were calculated for each species (Table S1). Due to new phylogenetic findings through molecular analysis, taxonomy is in a constant state of flux. Therefore, some parids, which were recognized as species in this study, are treated at other taxonomic levels in the HBW.
2.4.4. Climate Variables
To test the influence of climate on the complexity of the song, we compiled various climate data for species–specific occurrences and summarized them in principal components; the parid occurrence data were downloaded from the Global Biodiversity Information Facility (GBIF) website. A total of 351,292 datasets were downloaded. From these, duplicates of coordinates per species were removed and localities outside the species–specific breeding areas according to BirdLife International and NatureServe (2011) [41] were removed using the R packages raster [42], rgdal [43], and sp [44,45]. For the resulting sites of 59 species, 19 bioclimatic variables were determined and downloaded from WorldClim.org (accessed on 15 April 2024). Data for five species (Poecile weigoldicus, Sittiparus castaneoventris, S. olivaceus, S. owstoni, S. semilarvatus) were not available due to different taxonomic treatment (Table S1).
With the 19 bioclimatic variables for the 59 species, a principal-component analysis was performed using the prcomp function (Table S6). With the R package psych, we had checked, according to the Kaiser–Meyer–Olkin criterion, whether a principal-component analysis may be performed with the data, whereby a value of 0.5 was not allowed to fall below, which was not the case [46,47]. The first two principal components (PC1 and PC2) together explained 69% of the total variance. PC1 was negatively loaded with the minimum temperature of the coldest month (Bio 6) and the mean temperature of the coldest quarter (Bio 11), among others, and thus represented the minimum temperature. PC2 was negatively loaded with the precipitation of the driest month (Bio 14) and the precipitation of the driest quarter (Bio 17) and was thus interpreted as minimum precipitation.
2.5. Statistical Analyses
2.5.1. Bivariate Correlations and Phylogenetic Independent Contrasts
All the song variables were correlated with all the explanatory variables (Pearson correlation function cor.test). However, as these species have a common evolutionary history and thus do not provide independent data points for statistical analysis, this violates most basic assumptions of statistical tests [48]. Therefore, to correct for the phylogenetic relationships among parid species, the method of phylogenetically independent contrasts (PIC) was used. The phylogeny from Johansson et al. [27] was pruned to those 55 species for which all the data mentioned before were available. For the PIC, the function pic in R package ape (version 5.3; [49]) was used.
2.5.2. Phylogenetic Generalized Least Squares
Phylogenetically generalized models were created using the method of phylogenetically generalized models with least squares (pGLS). To determine the best model, song complexity together with colorfulness or color diversity and additional predictor variables were included in the model to be tested. Successively, the predictor variables with the highest p-value were removed until all remaining ones were statistically significant (p < 0.05).
The models were then compared using the Akaike Information Criterion (AIC). A model with a small AIC value indicated a good model. Corrected R2 was also considered, which allowed us to assess the quality of the models. The higher the R2, the better the model fits to the data. For the pGLS analysis, the pgls function in R package caper (version 1.0.1; [50]) was used.
For all variables (Table S2), a phylogenetic signal and the best model of trait evolution were calculated using the R packages geiger (version 2.0.6.1; [51]) and picante (version 1.8; [52]).
3. Results
3.1. Relationship between Song Complexity and Colorfulness and Body Size
Regarding the hypothesis, the expectation was that the more complex the song of a species is, the less colorful its plumage is.
When creating the best models using pGLS, a correlation was found for all variables used as a measure of song complexity, with color diversity and body mass acting on song complexity. Using the standard deviation of frequency and the Shannon entropy as a measure of song complexity, this relationship represented the best model with an AIC of 771.51 (standard deviation of frequency) and −138.42 (Shannon entropy), and a corrected R2 of 0.25 (standard deviation of frequency) and 0.26 (Shannon entropy), respectively (Table 1). When using the interquartile frequency, there were two best models in terms of color diversity. Besides color diversity and body mass, it was also shown that body length affects song complexity. The AIC values of the two models hardly differed from each other with an AIC of 884.08 and 884.10 and a corrected R2 of 0.22 (Table S7). Also, the second-best model showed a correlation between colorfulness and body mass on song complexity. Using the standard deviation of frequency and Shannon entropy, this resulted in AIC values of 773.2 (standard deviation of frequency) and −135.98 (Shannon entropy), and a corrected R2 of 0.23 (standard deviation of frequency) and 0.24 (Shannon entropy) (Table S7). Using the interquartile frequency, two second-best models were found. In addition to colorfulness and body mass, it was also shown that body length affects song complexity. The AIC values of the two models hardly differed from each other with an AIC of 886.35 and 886.5 and a corrected R2 of 0.19 (Table S7). Using the standard deviation of frequency and Shannon entropy, only the third- and fourth-best models showed the relationship between color diversity and body length on song complexity or colorfulness and body length on song complexity (Table S7). This means that the smaller and less colorful the parid is, the more it invests in the complexity of its singing. Thus, the hypothesis is confirmed, whereby additionally a connection with the body size exists.

Table 1.
Results of the two best pGLS models with song complexity (interquartile frequency), blue: model with color diversity and body length, orange: model with color diversity and body mass, n = 55, λ = 10−6.
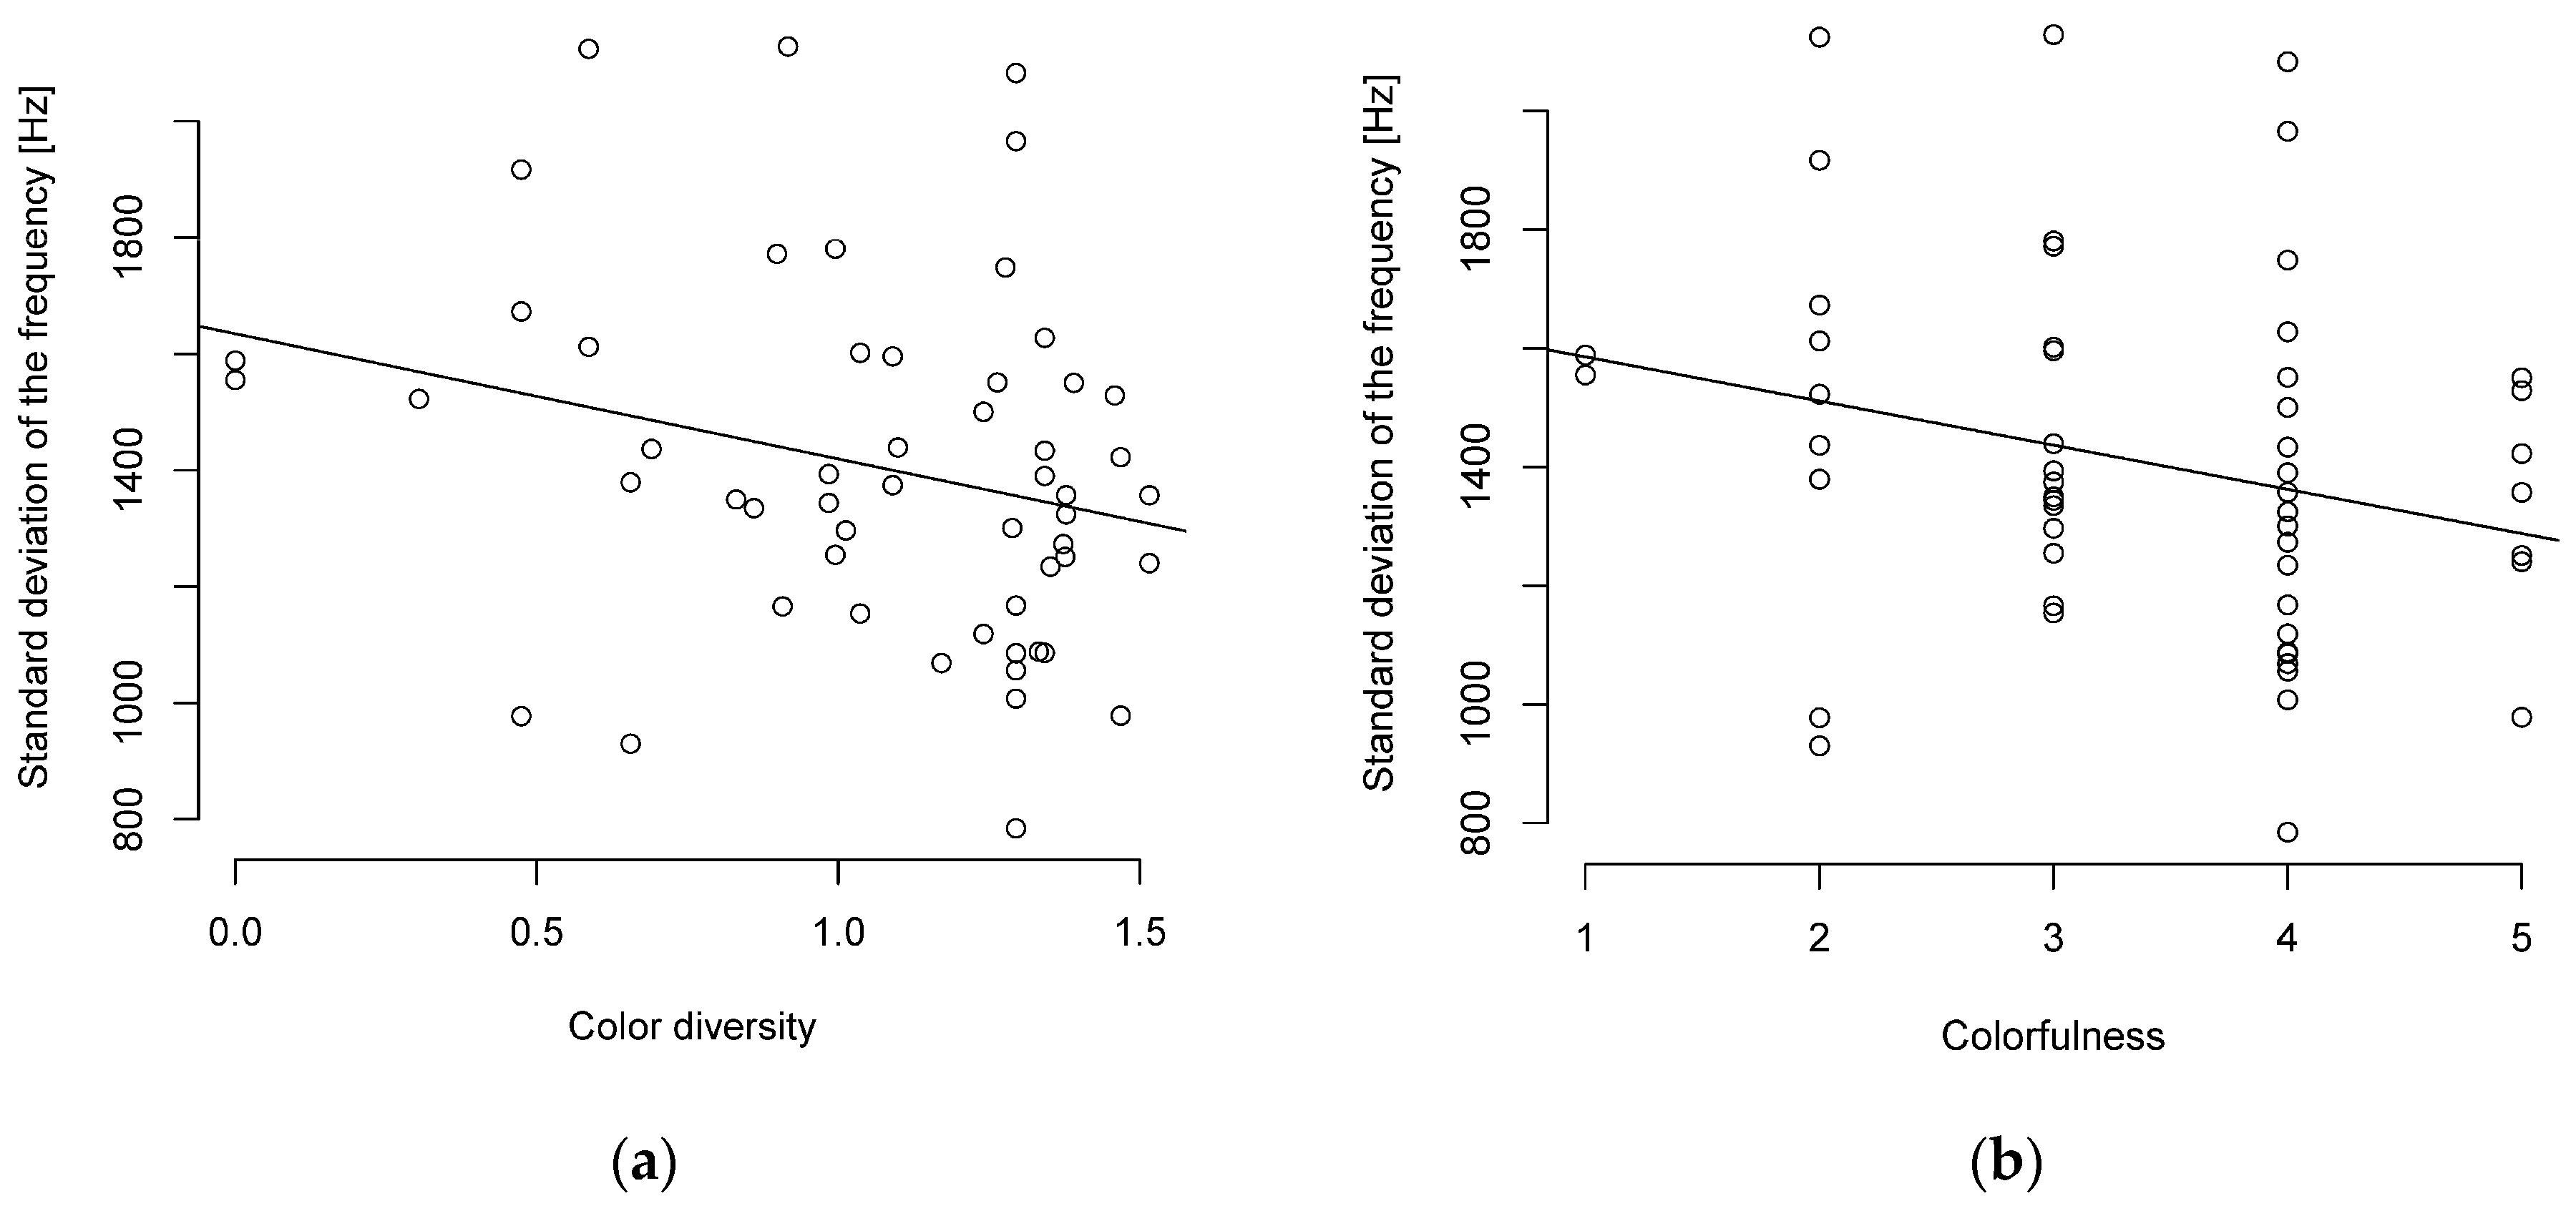
The PIC method also supports the correlation between song complexity and colorfulness or color diversity, with a moderate (R ≥ 0.3–0.4) to almost strong (R ≥ 0.5) negative correlation between colorfulness or color diversity and song complexity (Figure 1, Table S8). The PIC method also supports the relationship between the standard deviation of frequency and body length or body mass with a moderate negative correlation. The Shannon entropy showed only a weak negative correlation for body length and a moderate negative correlation for body mass (Table S8). The interquartile frequency showed a weak to moderate negative correlation to body mass and body length (Table S8).
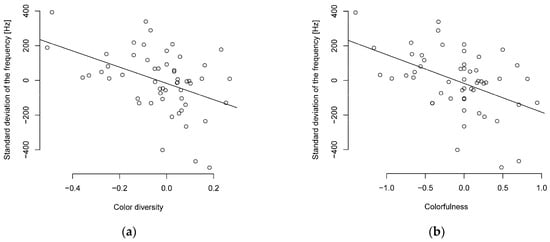
Figure 1.
Phylogenetically independent contrasts of song complexity and (a) color diversity or (b) colorfulness show a negative correlated (n = 55 parid species).
When viewed without the PIC, a similar picture was shown with a weak to moderate negative correlation between song complexity and body length or body mass (Table S9). The Pearson correlation showed only a weak (R ≥ 0.1–0.2) negative correlation with a tendency towards significance between the standard deviation of the frequency and plumage correlation (Figure 2, Table S9). The correlation between the interquartile frequency and color diversity was significant but weak (Table S9).
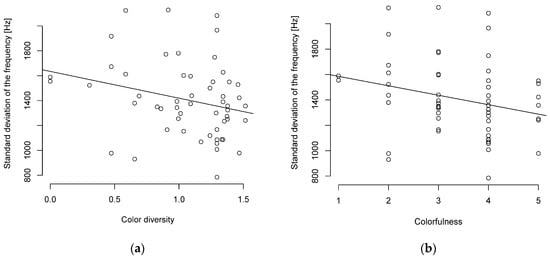
Figure 2.
Song complexity and (a) color diversity or (b) colorfulness are negatively correlated (n = 55 parid species).
3.2. Other Correlations Found
3.2.1. Peak Frequency and Body Size
It turned out that smaller parids sing with a higher frequency. The PIC analysis indicates significant moderately negative correlations between body length and frequency levels (Figure 3, Table S8). Body mass was weakly correlated with the peak, median, and mean frequencies, with a tendency towards significance in the mean frequency (Figure 3). Duration was uncorrelated with body length and mass (Table S8). Overall, the correlation coefficients with the PIC are weaker than without phylogenetic correction (Table S9).
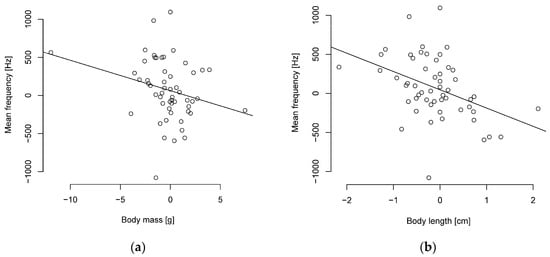
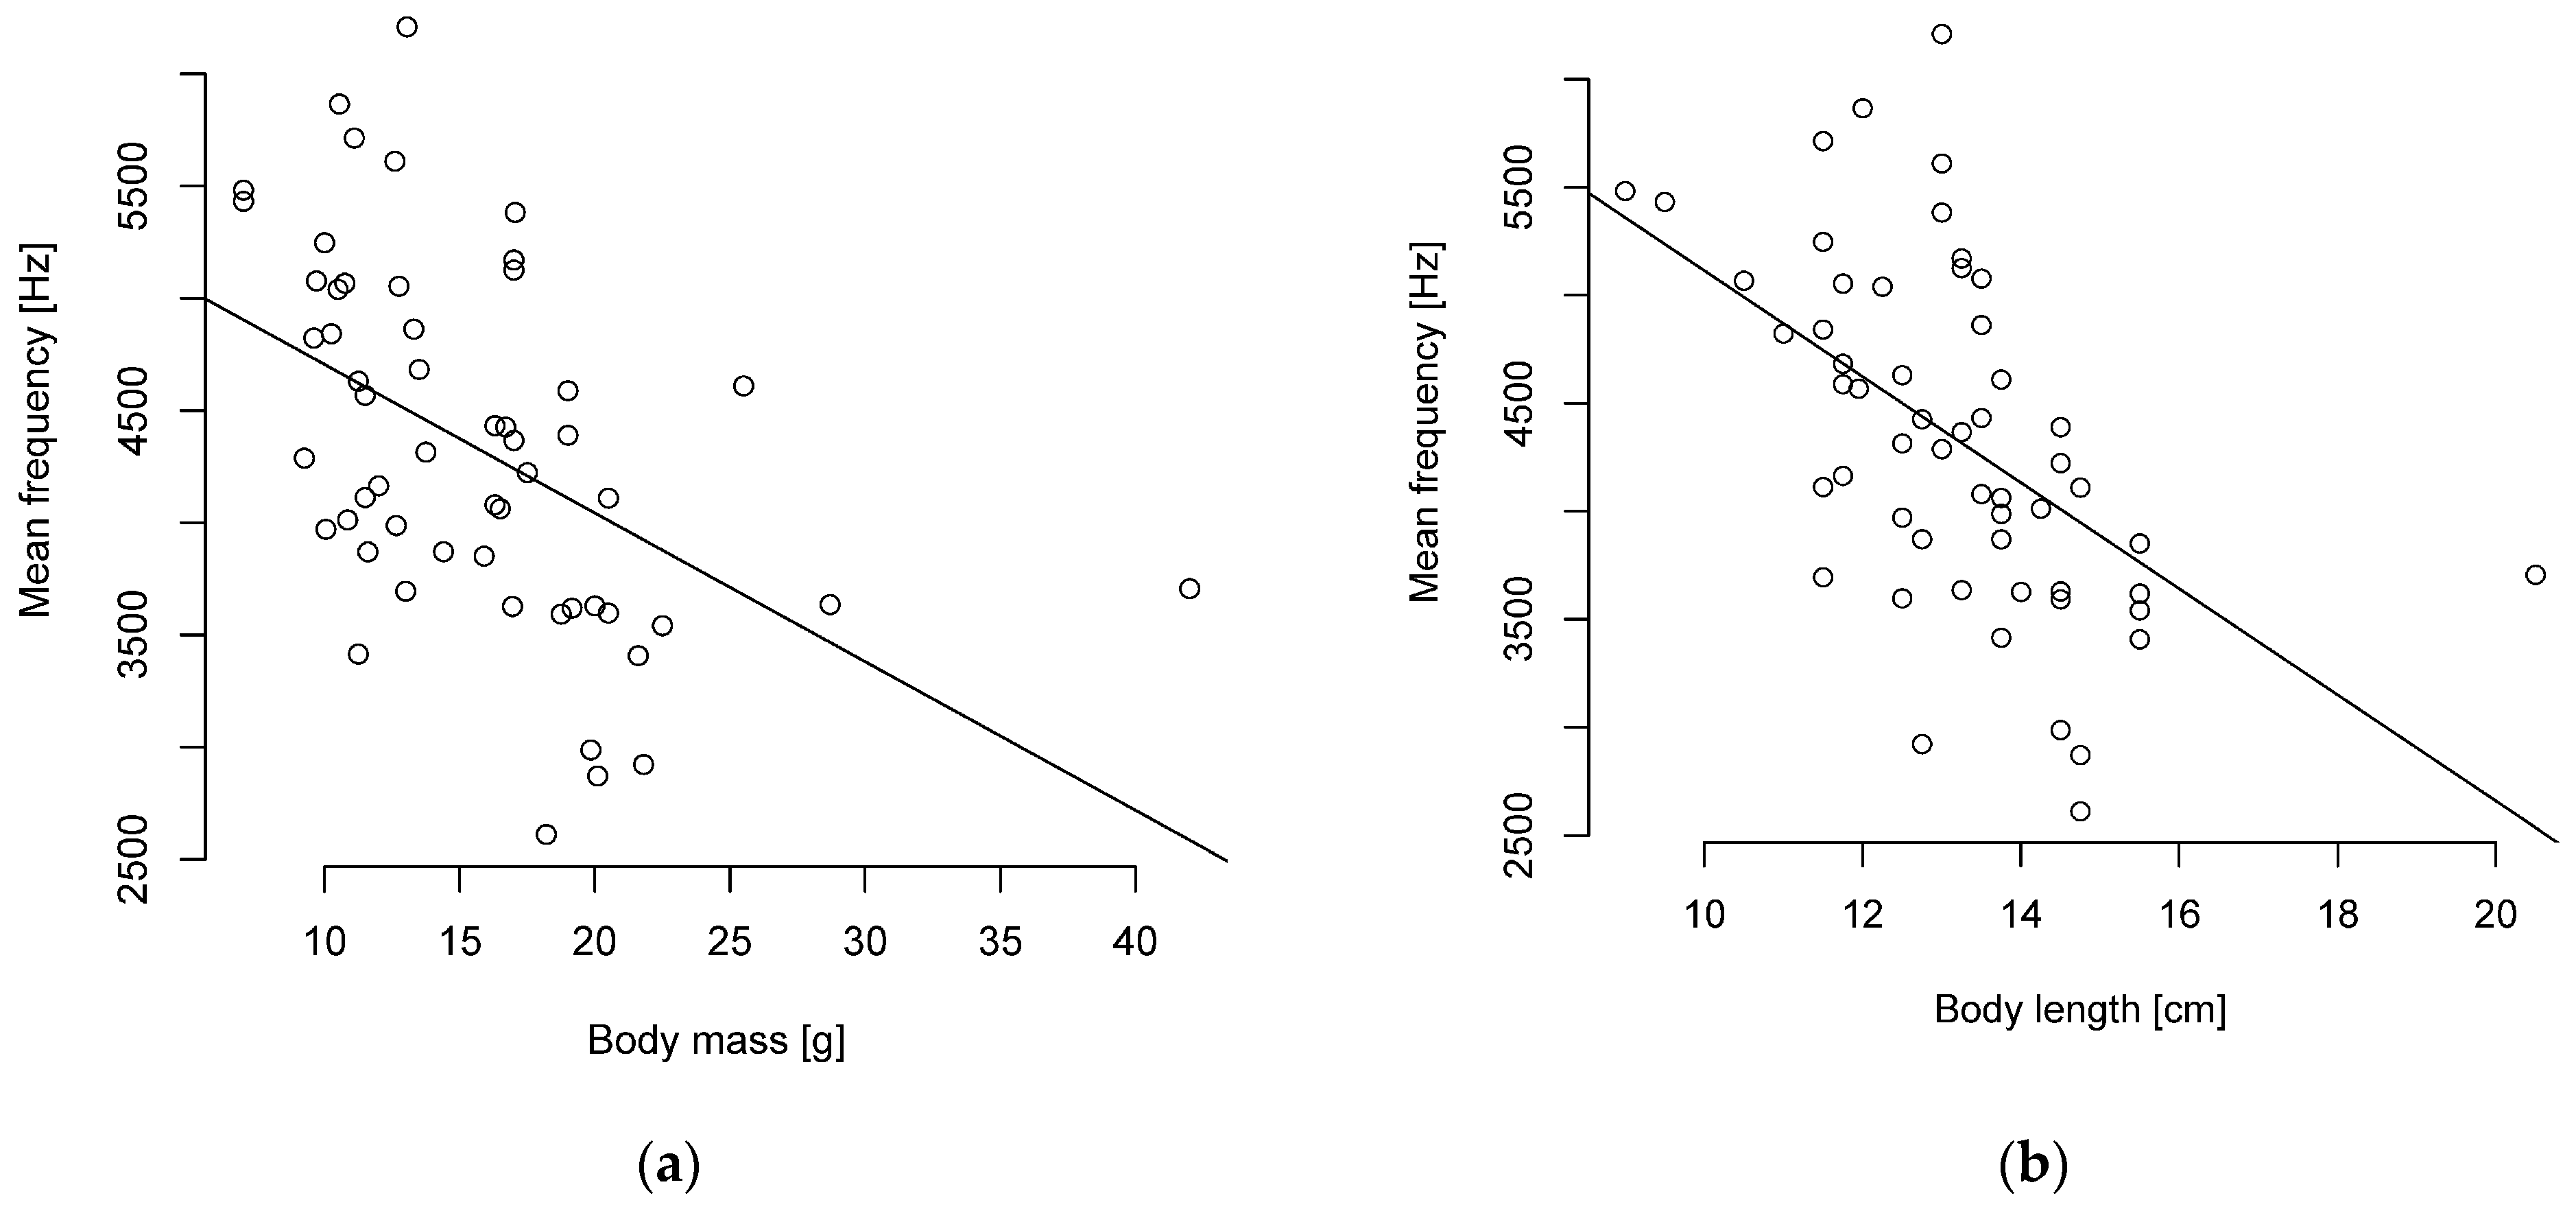
Figure 3.
Phylogenetically independent contrasts between mean frequency and (a) body mass or (b) length are negatively correlated (n = 55 parid species).
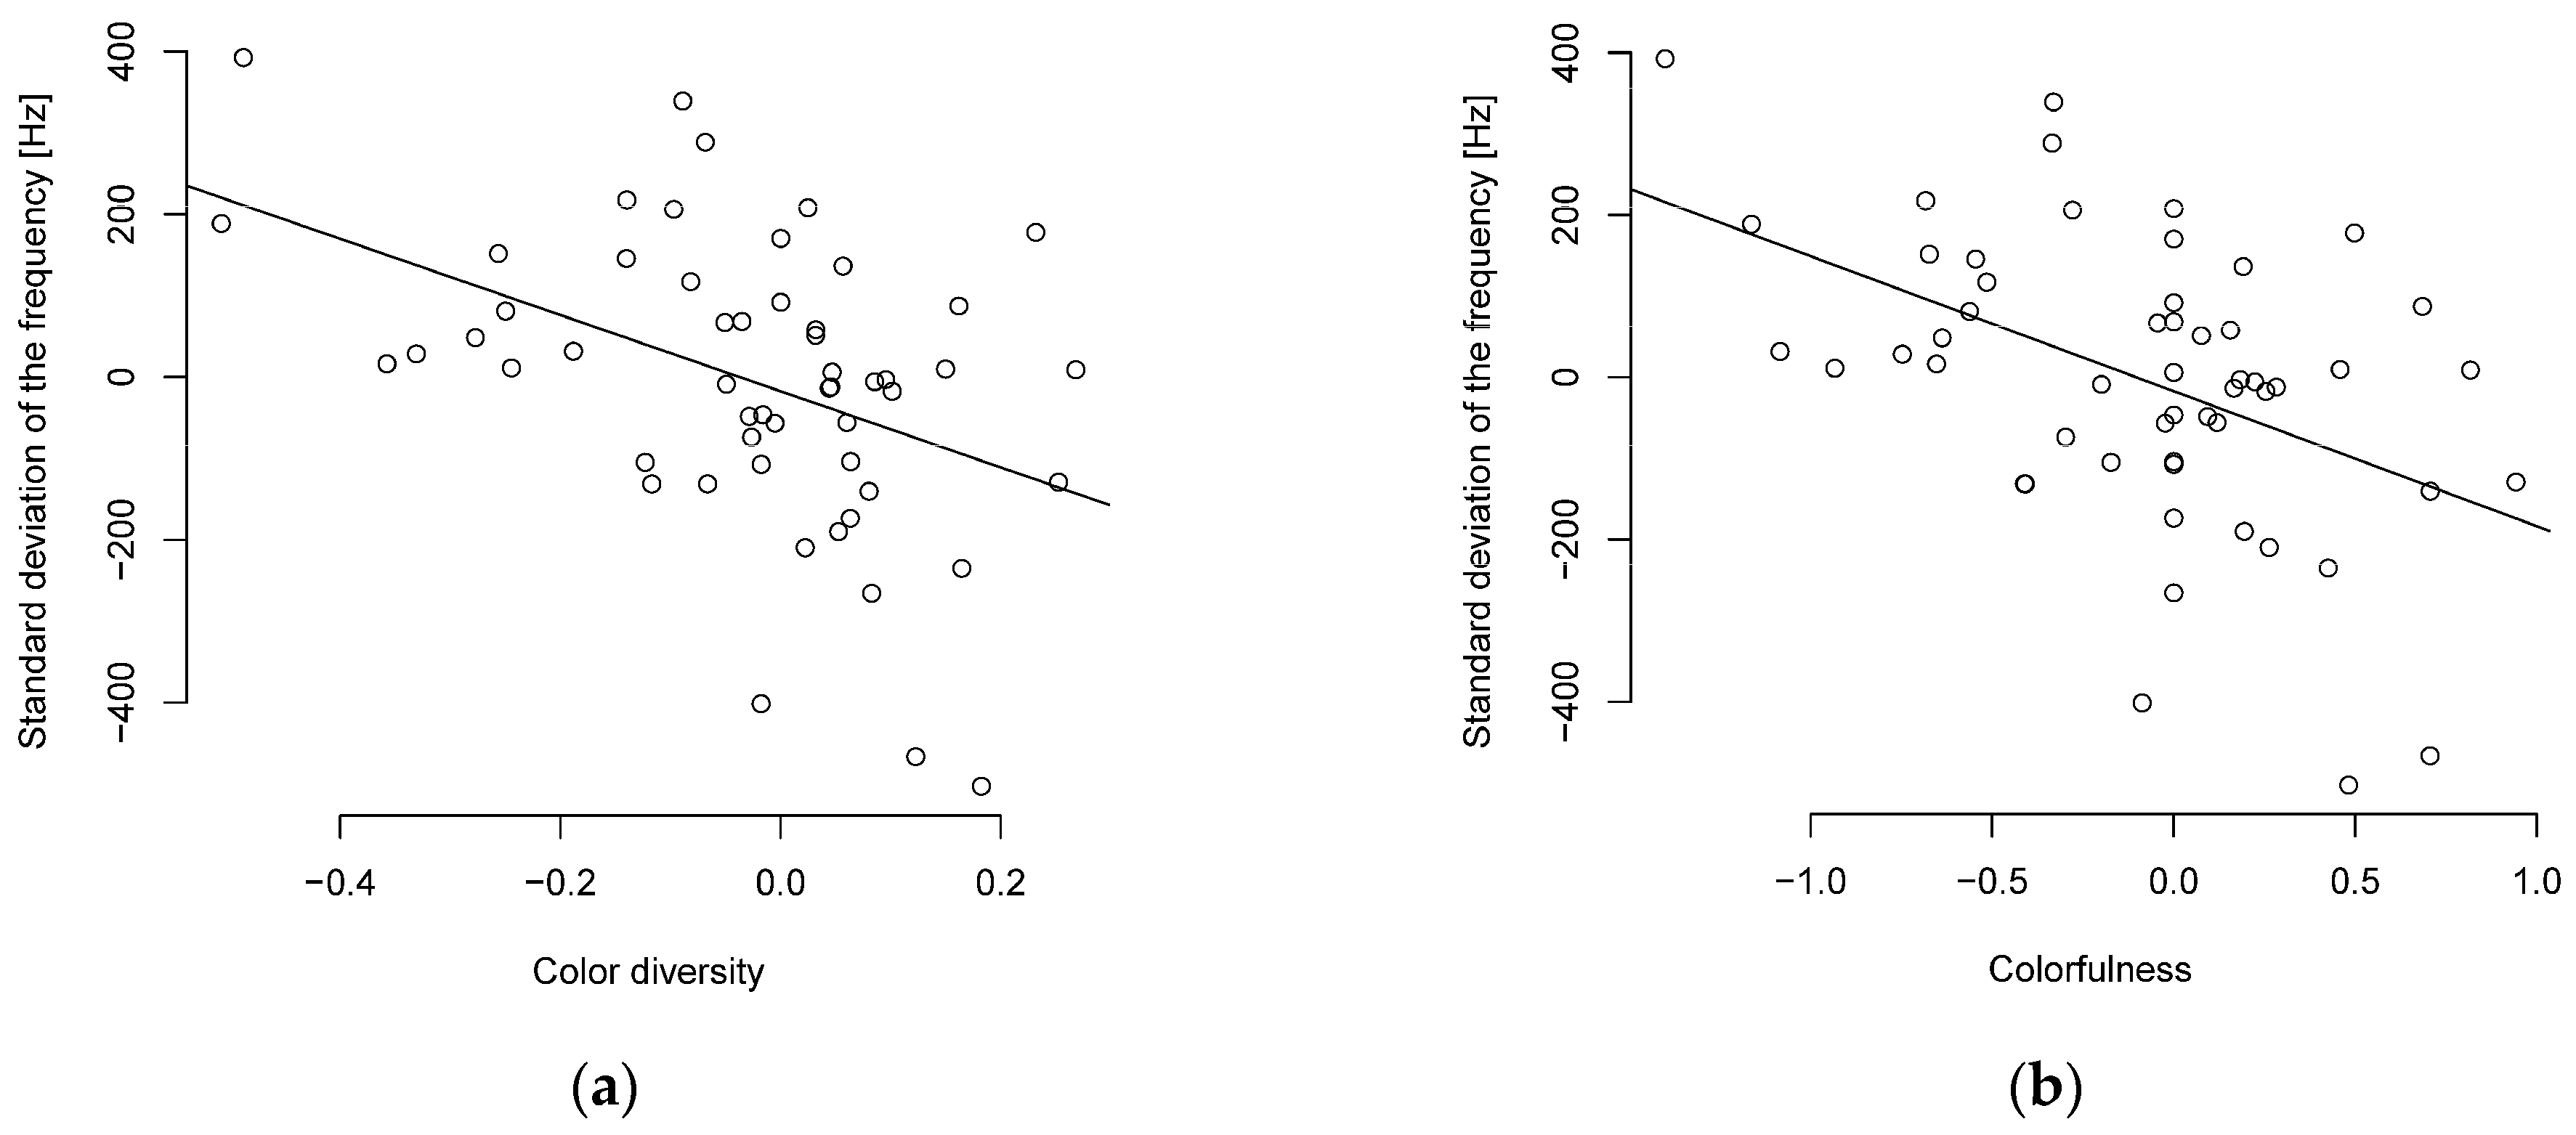
The Pearson correlation showed a weak to strong negative correlation of body length and mass to the level of frequencies and no correlation to duration. A particularly strong negative correlation was found between body length and the mean and median frequencies (Figure 4, Table S9). A strong negative correlation was also found between body mass and the median frequency (Figure 4, Table S9).

Figure 4.
Mean frequency and (a) body mass or (b) length are negatively correlated (n = 55 parid species).
3.2.2. Song Variables and Minimum Temperature
When applying the PIC to the first principal component, a highly significant, moderately negative correlation with song complexity was found. The warmer it is, the more complex parids sing. The peak, median, and mean frequencies showed a weak positive correlation with the first principal component, whereas the correlation with the mean frequency showed a tendency towards significance (Table S8). The warmer it is, the higher parids would sing. In comparison, the Pearson correlation showed rather weak correlations with the song variables (Table S9).
3.2.3. Song Variables and Minimum Precipitation
When applying the PIC to the second principal component, a significant weak negative correlation with the mean frequency and a significantly moderate negative correlation with the median frequency were observed (Table S8). The Pearson correlation showed a highly significant moderate negative correlation with the peak frequency and a highly significant moderate to almost strong negative correlation with the mean and median frequencies (Table S9). Tits sing lower with more precipitation. Regarding song complexity, very weak but not significant correlations were found (Table S9).
3.2.4. Song Complexity and Elevation Distribution
A pGLS model included, in addition to song complexity, the maximum elevation distribution and the interaction between colorfulness and maximum elevation distribution. However, this model did not fit the data well compared to the other models (Table S7).
3.2.5. Peak Frequency and Elevational Distribution
The PIC showed weakly positive correlations between the elevational distribution and song complexity, with the minimum, maximum, and mean elevations being more strongly and significantly correlated in terms of standard deviation of frequency and Shannon entropy (Table S8). Also, more strongly correlated were the maximum and mean elevations with the median and mean frequencies, with the correlation between the mean frequency and the maximum elevation being significant (Table S8).
The Pearson correlation showed weak positive correlations with song variables for the elevational distributions (Table S9). The maximum elevation was positively correlated with the mean and median frequencies (Table S9). The mean elevation showed a weak positive correlation with a tendency to be significant with the median frequency (Table S9). The minimum elevation showed a significant weak positive correlation with Shannon entropy and a tendency towards significance in relation to the standard deviation of the frequency (Table S9). At higher altitudes, parids sing higher and with more complexity.
3.3. Phylogenetic Signal and Models of Evolution
The phylogenetic signal for song traits varied with Blomberg’s K between 0.285 and 0.581, with duration, standard deviation of frequency, interquartile frequency, and Shannon entropy showing a weak signal (Blomberg’s K: 0.285–0.345) and the mean, peak, and median frequencies showing a medium signal (Blomberg’s K: 0.519–0.581). All song traits evolved according to the Ornstein–Uhlenbeck model. According to the same model, colorfulness and color diversity evolved with a medium phylogenetic signal (Blomberg’s K: 0.409–0.461). The principal components of climate variables evolved according to the Lambda model and showed a weak phylogenetic signal (Blomberg’s K: 0.291, 0.311). Also, the elevational distribution showed a weak phylogenetic signal (Blomberg’s K: 0.21–0.308) but evolved under white noise according to the model. The morphological traits had a strong phylogenetic signal (Blomberg’s K: 0.518–1.090) and evolved under Brownian motion (Table S1).
4. Discussion
In the first two best models, color diversity and colorfulness were related to song complexity. Thus, our hypothesis is confirmed and there is a trade-off between song complexity and colorfulness of parids.
The negative correlation suggests that only one of these traits can be favored, since the cost of expressing both would reduce fitness. On the one hand, these costs could be explained by an increased conspicuity for predators, which reduces the probability of survival [53,54]. On the other hand, it could be due to the environment where resources are limited, which tends to lead to a trade-off between two traits [21].
The best models of pGLS included body size in addition to color diversity or colorfulness. Smaller and less color-diverse or colorful parids invest more in the complexity of their song. In Cardoso (2009) [55], the effect of body size on song complexity was also demonstrated. That study showed that noisy Passeriformes were less complex in their singing and that larger birds sing louder. This means that larger birds that sing louder also sing less complex songs. The tested passerine birds, including songbirds, sang with less complexity when they sang louder. Song complexity was measured in that study as the syntax (number of successive repeated syllables divided by the total number of syllables) and the proportion of harmonics as well as the proportion of rattles per syllable length. Harmonic and rattle sounds are two-part sounds that can be produced simultaneously from both sides of the syrinx. Harmonic lutes are harmonic oscillations that are one octave above the fundamental frequency. Rattle sounds are broadband or rough-sounding fast modulations or repetitions within a syllable. The loudness was determined by three experienced ornithologists on a scale of 1–4.
Song complexity may provide a clearer and more transmittable signal than body size. However, it should also be considered that the signal effect of the color could be influenced by the background, for example by the density of vegetation [56]. It has already been found in woodpeckers that birds with large plumage elements, such as large patches of color or a more pronounced pattern, tend to be larger [57].
In comparative studies, both a negative correlation [19] or no correlation [22,23] between song complexity and plumage coloration were found:
Badyaev et al. [19] found—like us—a strong negative correlation between song complexity and the development of carotenoid-based plumage coloration in cardueline finches. However, there was no correlation between melanin-based plumage coloration and song complexity. This indicates that not all plumage colors are equally affected by sexual selection. Song complexity was a principal component there, which included song recordings with a longer duration and a larger number of elements.
Ornelas et al. [23] used syllable versatility as a measure of song complexity, and plumage color was divided into plumage based on carotenoids, melanin, and colors that are created due to certain structures. The syllable versatility was calculated by multiplying the number of syllable types with the number of transitions from one syllable type to another divided by the total number of syllables. However, it should also be noted that the trogons examined here do not belong to the songbirds. This could be the reason why there was no correlation between the two traits. They have a less complex singing behavior than songbirds because they do not learn their songs [3] and therefore it is possible that the singing is not as strongly affected by sexual selection.
Mason et al. [22] studied tanagers. For the song complexity, a principal component was calculated that included a greater frequency range, a longer song duration, and a larger number of element types. In addition, the duration of the song and the number of element types were again considered separately as part of song complexity. The plumage color was recorded from male tanagers using reflectance spectrophotometry on museum specimens. The obtained reflection spectra were quantified by recording them in an avian tetrahedral color space framework. The avian tetrahedral color space framework is a kind of color diagram that takes into account that birds have four types of retinal cones with different spectral sensitivities [58]. Nine plumage traits were used, such as color span variance of the color volume, a principal component (species occupying greater expenses of tetra color space, showing greater contrast between plumage patches and more saturated colors), the brilliance and the color volume (distribution of plumage patches of the species in avian tetrachromatic color space), to calculate for plumage complexity. Also, a division in plumage based on carotenoids and plumage based on structure was made. This study showed that the relationship between song complexity and plumage coloration differed between the subfamilies. Within the subfamilies Dacninae and Nemosiinae they also found quite strong negative correlations, but the sample sizes were only nine and four, respectively.
Additionally, we found a significant negative relationship between body size and the peak frequencies. This relationship has also been shown in other studies [4,38,59,60,61,62,63,64,65,66]. The reason for this relationship between body size and frequency can be explained in that anatomical factors such as syrinx size, tracheal length, and resonance capacity interact [67]. The larger the syrinx, the larger the bird and the deeper it sings, because the membranes vibrate more slowly [68,69]. Thus, larger parids probably have a larger syrinx and sing deeper than smaller ones.
The correlation of minimum temperature with song complexity and frequency was positive. Higher and more complex frequencies are costly to produce, so the energy of the birds is not put into maintaining body temperature but into singing [6]. This is only possible in warmer regions without disadvantage.
A negative correlation between the minimum precipitation and the peak frequency was found. This could be because higher frequencies are more strongly refracted by objects such as raindrops [70]. As a result, the range of frequencies would not be very high, which might mean that the signal of the song does not reach conspecifics. For this reason, the parids probably sing lower in areas with higher precipitation.
A weakly positive correlation was found between elevational distribution and song variables. Tits in higher regions therefore sing higher. This has also been shown in other studies, such as tinamous (Tinamidae) [60], tanagers, grey-breasted wood wren (Henicorhina leucophrys) [71], and in a study across several bird species [72]. The reason may be that the optimal sound transmission is strongly dependent on the environment, such as vegetation density [3,59]. Higher frequencies are, as just explained for raindrops, scattered more by leaves and branches than lower frequencies. At a higher elevation, there is less vegetation, so higher frequencies are scattered less, such that they are not disadvantaged there [70].
The morphological traits such as body size and colorfulness showed a medium to strong phylogenetic signal, indicating a high heritability of the traits. Body size developed according to the Brownian motion model, which suggests random development, have a large number of very small forces acting on the trait [73]. In contrast, the Ornstein-Uhlenbeck model shows that probably a stabilizing selection has an effect on the song traits and the colorfulness or color diversity [74]. The elevational distribution evolved under white noise, which means that the traits developed randomly, independent of phylogeny.
We showed that there is a trade-off between the complexity of singing and colorfulness, and that body size also contributes to this. Overall, we found that there is either an investment in physical or vocal traits. The best model shown, however, is only explained by a small part of the recorded variables. Other yet unknown explanatory variables play a role in the evolution of song complexity. Based on the results shown, it would be interesting to investigate, for example, the distribution of resources. Shutler [21] showed that resources that occur in a normal distribution are more likely for trade-offs than in a negative binomial distribution. This could be a crucial point as to why no trade-off between song complexity and plumage color was found in non-learners such as trogons. Also, the influence of interspecific competition should be considered. Doutrelant et al. [7] already found that the interspecific competition between the blue and great tits limited the size of the song repertoire of the blue tit, given a higher density of great tits. The expression of plumage color could also be influenced by food competition; hence, plumage colors, which give information about the nutritional status, are probably less pronounced, due to less available food.
Cardoso [55] found that song complexity is limited by the loudness of the song. In addition, a relationship was shown regarding body size, with larger birds also singing louder. In this context, it would be interesting to see if the loudness also plays a role in the model we created. If louder birds sing in a less complex way, this could be another physiological trait, which explains the best model even better.
In further studies, it would also be interesting to quantify the colorfulness differently. As in Mason et al. [22], a reflectance spectrophotometer could be used to record reflection spectra of several museum specimens of parids. The color measurements would be performed on the eleven plumage regions defined in the present study and transferred in an avian tetrahedral color space framework for quantification. Color volume measurements per species would then serve as a measure of colorfulness. A larger color volume would represent a greater colorfulness. Based on the results obtained here, a clearer trade-off between song complexity and color volume would be expected.
Different plumage colors mean higher costs in production. A distinction could be made in the synthesis of the individual colors in terms of cost to find out whether there is also a clearer trade-off between a costly color to produce and song complexity. Different colors result from pigments and structural colors [13]. Pigments absorb incident light and reflect certain wavelengths, while the textured color refracts and reflects incident light differently due to the physical structure of the feathers [13]. Pigments such as yellow carotenoids must be absorbed through food and are converted into red carotenoids [13]. They could therefore be more costly to produce, as they not only have to be synthesized but also absorbed. It could also be more costly to create certain nanostructures in the plumage and thus produce blue, yellow, and green colors, for example, as in peacock feathers [13].
Genetics can also play a role in the creation of new color variations. This is due to strong mutations of genes involved in the synthesis of pigments [13]. In subsequent studies, the mutation of genes could be included in order to gain insights into the generation of plumage colors.
The trade-off shown here points to a high signal effect of both song complexity and plumage coloration. A further investigation of the signal effect on individual plumage colors would also be an interesting starting point. A quantification of the signal effect of the individual plumage colors could be made. We assume a more strongly correlated trade-off of plumage colors that, on the one hand, are better recognizable than others, and on the other hand, give females information about their quality. For example, a correlation between plumage coloration based on carotenoids and food intake was shown. The carotenoid-based plumage coloration served as a signal for a good nutritional status as in, for example, the yellow plumage coloration of the great tit [11]. This signal effect was also proven in the house finch (Haemorhous mexicanus) [10,74]. In the black-capped chickadee, evidence was found that the black and white coloration is an indicator of a healthy bird [75]. Sick birds with a keratin disorder showed a dirtier plumage than healthy birds because they could not clean themselves as well due to excessive beak growth. However, the signal effect of plumage coloration based on melanin or structural colors is controversial [22].
Furthermore, the “color” UV light could be included. Birds, unlike humans, can perceive the wavelength range of UV light [58]. For blue tits, a sex dimorphism in UV light has already been observed [56] and evidence has been found that it serves as an indicator of improved survivability and thus quality [76,77]. A certain plumage structure scatters incident light so that UV light is reflected [58]. Consequently, UV light could also play a crucial role in reproduction in other parids. A sexual dimorphism in the UV wavelength range hidden for us humans could also be present in other parid species. On the basis of newly detected sex dimorphisms in other parids, further studies could be made with regard to the strength of sexual selection for plumage color. Badyaev et al. [19] showed that there is a difference in the strength of sexual selection for certain plumage colors. Melanin-based plumage colors were less affected by sexual selection.
5. Conclusions
We show that there are several factors that influence the development of parid song traits. Our results suggest that both song complexity and plumage coloration have an important signal function for females. The relation to body size could be an indication of an increase in the signal function of plumage color and, at the same time, limit the expression of song complexity. It also indicates that the plumage color alone causes high costs in parids, independent of the closer examination of individual color synthesis. How environmental influences contribute to the trade-off could not be shown in this study. In particular, the investigation of influences on plumage color should be carried out at this point. The results show that a trade-off between song complexity and colorfulness was important for the evolutionary diversification of bird song and plumage color, which broadens our understanding of sexual selection of traits.
Supplementary Materials
The following supporting information can be downloaded at: https://www.mdpi.com/article/10.3390/d16060332/s1, Table S1: Parid species and their trait values; Table S2: Definition of song parameters and explanatory traits; Table S3: Metadata of downloaded recordings; Table S4: Sonagraphic measurements of analyzed song verses; Table S5: Sonagraphic measurements aggregated by recording; Table S6: Rotation matrix for the BioClim variables; Table S7: pGLS model summaries; Table S8: PIC correlation values; Table S9: Pearson correlation values.
Author Contributions
Conceptualization, D.T.T.; methodology, D.T.T.; software, D.T.T. and A.H.; validation, D.T.T.; formal analysis, both; investigation, D.T.T.; resources, D.T.T.; data curation, D.T.T.; writing—original draft preparation, A.H.; writing—review and editing, D.T.T.; visualization, D.T.T. and A.H.; supervision, D.T.T.; project administration, D.T.T. All authors have read and agreed to the published version of the manuscript.
Funding
This research received no external funding.
Institutional Review Board Statement
Not applicable.
Data Availability Statement
Original sound recordings are linked in Table S3.
Acknowledgments
Hundreds of sound recordists shared their data on parid vocalizations on Xeno-Canto.org, the essential database for this study. Melanie Löffel and Vivian Nedwed performed preliminary data compilation and analysis. Valentin Amrhein and Walter Salzburger made available the human and computing resources at the University of Basel, Switzerland. Several other colleagues commented on earlier MS versions and presentations, respectively. We are very grateful for all these contributions.
Conflicts of Interest
The authors declare no conflicts of interest.
References
- Kappeler, P. Verhaltensbiologie: Kapitel 7: Sexuelle Selektion: Evolutionäre Grundlagen; Kapitel 9.5.2 Besserer Nachwuchs Durch Gute Gene; Springer: Berlin/Heidelberg, Germany, 2017. [Google Scholar]
- Lind, H.; Dabelsteen, T.; Gregor, P.M. Female great tits can identify mates by song. Anim. Behav. 1996, 52, 667–671. [Google Scholar] [CrossRef]
- Päckert, M. Song: The Learned Language of Three Major Bird Clades, In Bird Species; Tietze, D.T., Ed.; Springer: Cham, Switzerland, 2018; pp. 75–94. [Google Scholar] [CrossRef]
- Tietze, D.T.; Martens, J.; Fischer, B.S.; Sun, Y.-H.; Klussmann-Kolb, A.; Päckert, M. Evolution of leaf warbler songs (Aves: Phylloscopidae). Ecol. Evol. 2015, 5, 781–798. [Google Scholar] [CrossRef]
- Baker, M.; Bjerke, T.; Espmark, Y.; Lampe, H. Sexual response of female great tits to variation in size of males song repertoires. Am. Nat. 1986, 128, 491–498. [Google Scholar] [CrossRef]
- Garamszegi, L.Z.; Moreno, J.; Møller, A.P. Avian song complexity is associated with high field metabolic rate. Evol. Ecol. Res. 2006, 8, 75–90. [Google Scholar]
- Doutrelant, C.; Blondel, J.; Perret, P.; Lambrechts, M.M. Blue tit song repertoire size, male quality and interspecific competition. J. Avian Biol. 2000, 31, 360–366. [Google Scholar] [CrossRef]
- Nowicki, S.; Hasselquist, D.; Bensch, S.; Peters, S. Nestling growth and song repertoire size in great reed warblers: Evidence for song learning as an indicator mechanism in mate choice. Proc. R. Soc. Lond. Ser. B Biol. Sci. 2000, 267, 2419–2424. [Google Scholar] [CrossRef] [PubMed]
- Bostwick, K. (Ed.) Handbook of Bird Biology: Chapter 4: Feathers and Plumages, 3rd ed.; Wiley: New York, USA, 2016. [Google Scholar]
- Hill, G.E. Plumage coloration is a sexually selected indicator of male quality. Nature 1991, 350, 337–339. [Google Scholar] [CrossRef]
- Senar, J.C.; Figuerola, J.; Domènech, J. Plumage coloration and nutritional condition in the great tit Parus major: The roles of carotenoids and melanins differ. Die Naturwissenschaften 2003, 90, 234–237. [Google Scholar] [CrossRef]
- Slagsvold, T.; Lifjeld, J.T. Variation in plumage colour of the great tit Parus major in relation to habitat, season and food. J. Zool. 1985, 206, 321–328. [Google Scholar] [CrossRef]
- Orteu, A.; Jiggins, C.D. The genomics of coloration provides insights into adaptive evolution. Nat. Rev. Genet. 2020, 21, 461–475. [Google Scholar] [CrossRef]
- Dufva, R.; Allander, K. Intraspecific variation in plumage coloration reflects immune response in great tit (Parus major) males. Funct. Ecol. 1995, 9, 785. [Google Scholar] [CrossRef]
- Völker, O. Die Isolierung eines gelben und eines roten Lipochroms aus Vogelfedern. J. Für Ornithol. 1951, 93, 20–26. [Google Scholar] [CrossRef]
- Weatherhead, P.J.; Robertson, R.J. Offspring quality and the polygyny threshold: ‘The sexy son hypothesis’. Am. Nat. 1979, 113, 201–208. [Google Scholar] [CrossRef]
- Petrie, M. Improved growth and survival of offspring of peacocks with more elaborate trains. Nature 1994, 371, 598–599. [Google Scholar] [CrossRef]
- Lovette, I.J. (Ed.) Handbook of Bird Biology: Chapter 2: Avian Diversity and Classification, Chapter 3: How Birds Evolve, 3rd ed.; Wiley: Chichester, UK, 2016. [Google Scholar]
- Badyaev, A.V.; Hill, G.E.; Weckworth, B.V. Species divergence in sexually selected traits: Increase in song elaboration is related to decrease in plumage ornamentation in finches. Evolution 2002, 56, 412–419. [Google Scholar] [CrossRef]
- Zahavi, A. Mate selection: A selection for a handicap. J. Theor. Biol. 1975, 53, 205–214. [Google Scholar] [CrossRef] [PubMed]
- Shutler, D. Sexual selection: When to expect trade-offs. Biol. Lett. 2011, 7, 101–104. [Google Scholar] [CrossRef] [PubMed]
- Mason, N.A.; Shultz, A.J.; Burns, K.J. Elaborate visual and acoustic signals evolve independently in a large, phenotypically diverse radiation of songbirds. Proc. Biol. Sci. 2014, 281, 20140967. [Google Scholar] [CrossRef] [PubMed]
- Ornelas, J.F.; González, C.; de los Monteros, A.E. Uncorrelated evolution between vocal and plumage coloration traits in the trogons: A comparative study. J. Evol. Biol. 2009, 22, 471–484. [Google Scholar] [CrossRef]
- Hailman, J. The organization of major vocalizations in the Paridae. Wilson Bull. 1989, 101, 305–343. [Google Scholar]
- Fjeldså, J.; Christidis, L.; Ericson, P.G.P. (Eds.) Largest Avian Radiation; Lynx Edicions: Barcelona, Spain, 2020; 445p. [Google Scholar]
- Gosler, A.; Clement, P. Family Paridae (tits and chickadees). In Handbook of the Birds of the World; 12; Elliot, A., Christie, D., Eds.; Lynx Edicions: Barcelona, Spain, 2007; 815p. [Google Scholar]
- Johansson, U.S.; Nylinder, S.; Ohlson, J.I.; Tietze, D.T. Reconstruction of the late Miocene biogeographical history of tits and chickadees (Aves: Passeriformes: Paridae): A comparison between discrete area analyses and probabilistic diffusion approach. J. Biogeogr. 2018, 45, 14–25. [Google Scholar] [CrossRef]
- R Core Team. R: A Language and Environment for Statistical Computing. 2019. Available online: https://www.R-project.org/ (accessed on 7 July 2020).
- Bergmann, H.-H.; Helb, H.-W.; Baumann, S. Die Stimmen der Vögel Europas; Aula: Wiebelsheim, Germany, 2008. [Google Scholar]
- Tang, S.; Ke, D.; Yu, T.; Wang, C.; Zhao, Q.; Fan, H.; Zhang, G.; Wang, C.; Lu, X. Social organization, demography and genetic mating system of a Tibetan cooperative breeder. Ibis 2017, 159, 687–692. [Google Scholar] [CrossRef]
- Gebauer, A.; Jacob, J.; Kaiser, M.; Eck, S. Chemistry of the uropygial gland secretion of Hume’s ground jay Pseudopodoces humilis and its taxonomic implications. J. Für Ornithol. 2004, 145, 352–355. [Google Scholar] [CrossRef]
- Araya-Salas, M.; Smith-Vidaurre, G. Warbler: An R Package to Streamline Analysis of Animal Acoustic Signals. 2017. Available online: https://CRAN.R-project.org/package=warbleR (accessed on 7 July 2020).
- Marchal, J.; Fabianek, F.; Scott, C.; Corben, C.; Riggs, D.; Wilson, P. Bioacoustics: Analyse Audio Recordings and Automatically Extract Animal Vocalizations; R Package: 2019. Available online: https://CRAN.R-project.org/package=bioacoustics (accessed on 7 July 2020).
- Sueur, J.; Aubin, T.; Simonis, C. Seewave: A Free Modular Tool for Sound Analysis and Synthesis. 2008. Available online: https://CRAN.R-project.org/package=seewave (accessed on 7 July 2020).
- Giannakopoulos, T. pyAudioAnalysis: An open-source python library for audio signal analysis. PLoS ONE 2015, 10, e0144610. [Google Scholar] [CrossRef] [PubMed]
- Van Rossum, G.; Guido, J.; Fred, L.; Drake, J. Python Tutorial; Python Software Foundation: Wilmington, DE, USA, 1995. [Google Scholar]
- Center for Conservation Bioacoustics. Raven Pro: Interactive Sound Analysis Software, Version 1.5. 2014. Available online: http://ravensoundsoftware.com/ (accessed on 7 July 2020).
- Pearse, W.D.; Morales-Castilla, I.; James, L.S.; Farrell, M.; Boivin, F.; Davies, T.J. Global macroevolution and macroecology of passerine song. Evolution 2018, 72, 944–960. [Google Scholar] [CrossRef] [PubMed]
- del Hoyo, J.; Pascual, C.; Sargatal, J. Illustrated Checklist of the Birds of the World; Lynx Edition: Barcelona, Spain, 2016. [Google Scholar]
- Tietze, D.T.; Borthakur, U. Historical biogeography of tits (Aves: Paridae, Remizidae). Org. Divers. Evol. 2012, 12, 433–444. [Google Scholar] [CrossRef]
- BirdLife International, & NaturServe. Bird Species Distribution Maps of the World; BirdLife International and NatureServe: Cambridge, UK, 2011; Available online: https://datazone.birdlife.org/species/requestdis (accessed on 7 July 2020).
- Hijmans, R.J. Raster: Geographic Data Analysis and Modeling, R Package Version 3.0-12; 2020. Available online: https://CRAN.R-project.org/package=raster (accessed on 7 July 2020).
- Bivand, R.; Keitt, T.; Rowlingson, B. Rgdal: Bindings for the ‘Geospatial’ Data Abstraction Library, R Package Version 1.4-8; 2019. Available online: https://rdrr.io/cran/rgdal/ (accessed on 7 July 2020).
- Pebesma, E.J.; Bivand, R.S. S Classes and Methods for Spatial Data: The sp Package. R News. 2005. Available online: https://www.researchgate.net/publication/228765679_S_Classes_and_Methods_for_Spatial_Data_the_sp_Package (accessed on 7 July 2020).
- Bivand, R.; Pebesma, E.J.; Gómez-Rubio, V. Applied Spatial Data Analysis with R, 2nd ed.; Springer: New York, NY, USA, 2013. [Google Scholar]
- Elle, O. Einführung in die multivariate Statistik für Feldornithologen: Hauptkomponentenanalyse, Diskriminanzanalyse und Clusteranalyse. Vogelwarte 2005, 43, 19–38. [Google Scholar]
- Revelle, W. Psych: Procedures for Psychological, Psychometric, and Personality Research; Northwestern University: Evanston, IL, USA, 2020. [Google Scholar]
- Garamszegi, L.Z. Modern Phylogenetic Comparative Methods and Their Application in Evolutionary Biology; Springer: Berlin/Heidelberg, Germany, 2014. [Google Scholar]
- Paradis, E.; Schliep, K. Ape 5.0: An environment for modern phylogenetics and evolutionary analyses in R, R package version Version 5.3. Bioinformatics 2019, 35, 526–528. [Google Scholar] [CrossRef] [PubMed]
- Orme, D.; Freckleton, R.; Thomas, G.; Petzoldt, T.; Fritz, S.; Isaac, N. Caper: Comparative Analyses of Phylogenetics and Evolution in R, R Package Version 1.0.1. 2018. Available online: https://CRAN.R-project.org/package=caper (accessed on 7 July 2020).
- Brock, C.D.; Challenger, W.; Glor, R.E.; Harmon, L.J.; Weir, J.T. Geiger: Investigating evolutionary radiations, R package version 2.0.6.1. Bioinformatics 2008, 24, 129–131. [Google Scholar] [CrossRef]
- Ackerly, D.D.; Blomberg, S.P.; Cornwell, W.K.; Cowan, P.D.; Helmus, M.R.; Kembeland, S.W.; Morlon, H.; Webb, C.O. Picante: Tools for integrating phylogenies and ecology. Bioinformatics 2010, 26, 1463–1464. [Google Scholar] [CrossRef]
- Shutler, D.; Weatherhead, P.J. Targets of sexual selection: Song and plumage of wood warblers. Evolution 1990, 44, 1967–1977. [Google Scholar] [CrossRef] [PubMed]
- Wiens, J.J.; Tuschhoff, E. Songs versus colours versus horns: What explains the diversity of sexually selected traits? Biol. Rev. Camb. Philos. Soc. 2020, 95, 847–864. [Google Scholar] [CrossRef] [PubMed]
- Cardoso, G.C. Loudness of birdsong is related to the body size, syntax and phonology of passerine species. J. Evol. Biol. 2009, 23, 212–219. [Google Scholar] [CrossRef] [PubMed]
- Andersson, S.; Örnborg, J.; Andersson, M. Ultraviolet sexual dimorphism and assortative mating in blue tits. Proc. R. Soc. Lond. Ser. B Biol. Sci. 1998, 265, 445–450. [Google Scholar] [CrossRef]
- Miller, E.T.; Leighton, G.M.; Freeman, B.G.; Lees, A.C.; Ligon, R.A. Ecological and geographical overlap drive plumage evolution and mimicry in woodpeckers. Nat. Commun. 2019, 10, 1602. [Google Scholar] [CrossRef] [PubMed]
- McWilliams, S.; Adkins-Regan, E.; Vleck, C. (Eds.) Handbook of Bird Biology: Chapter 7: Bird Physiology, 3rd ed.; Wiley: Chichester, UK, 2016. [Google Scholar]
- Badyaev, A.V.; Leaf, E.S. Habitat associations of song characteristics in Phylloscopus and Hippolais warblers. Auk 1997, 114, 40–46. [Google Scholar] [CrossRef]
- Bertelli, S.; Tubaro, P.L. Body mass and habitat correlates of song structure in a primitive group of birds. Biol. J. Linn. Soc. 2002, 77, 423–430. [Google Scholar] [CrossRef]
- Derryberry, E.P.; Seddon, N.; Derryberry, G.E.; Claramunt, S.; Seeholzer, G.F.; Brumfield, R.T.; Tobias, J.A. Ecological drivers of song evolution in birds: Disentangling the effects of habitat and morphology. Ecol. Evol. 2018, 8, 1890–1905. [Google Scholar] [CrossRef] [PubMed]
- Greig, E.I.; Price, J.J.; Pruett-Jones, S. Song evolution in Maluridae: Influences of natural and sexual selection on acoustic structure. Emu Austral Ornithol. 2013, 113, 270–281. [Google Scholar] [CrossRef]
- Martin, J.P.; Doucet, S.M.; Knox, R.C.; Mennill, D.J. Body size correlates negatively with the frequency of distress calls and songs of Neotropical birds. J. Field Ornithol. 2011, 82, 259–268. [Google Scholar] [CrossRef]
- Mason, N.A.; Burns, K.J. The effect of habitat and body size on the evolution of vocal displays in Thraupidae (tanagers), the largest family of songbirds. Biol. J. Linn. Soc. 2015, 114, 538–551. [Google Scholar] [CrossRef]
- Seddon, N. Ecological adaptation and species recognition drives vocal evolution in Neotropical Suboscine birds. Evolution 2005, 59, 200. [Google Scholar] [CrossRef]
- Tubaro, P.L.; Mahler, B. Acoustic frequencies and body mass in New World doves. Condor 1998, 100, 54–61. [Google Scholar] [CrossRef]
- Wallschläger, D. Correlation of song frequency and body weight in passerine birds. Experientia 1980, 36, 412. [Google Scholar] [CrossRef]
- Podos, J. Correlated evolution of morphology and vocal signal structure in Darwin’s finches. Nature 2001, 409, 185–188. [Google Scholar] [CrossRef] [PubMed]
- Podos, J.; Nowicki, S. Beaks, adaptation, and vocal evolution in Darwin’s finches. Evolution 2004, 54, 501. [Google Scholar] [CrossRef]
- Wiley, R.H. Associations of song properties with habitats for territorial Oscine birds of eastern North America. Am. Nat. 1991, 138, 973–993. [Google Scholar] [CrossRef]
- Caro, L.M.; Caycedo-Rosales, P.C.; Bowie, R.C.K.; Slabbekoorn, H.; Cadena, C.D. Ecological speciation along an elevational gradient in a tropical passerine bird? J. Evol. Biol. 2013, 26, 357–374. [Google Scholar] [CrossRef] [PubMed]
- Boncoraglio, G.; Saino, N. Habitat structure and the evolution of bird song: A meta-analysis of the evidence for the acoustic adaptation hypothesis. Funct. Ecol. 2007, 21, 134–142. [Google Scholar] [CrossRef]
- Harmon, L.J. Phylogenetic Comparative Methods; CreateSpace Independent Publishing Platform: Scotts Valley, CA, USA, 2019; 286p. [Google Scholar]
- Hill, G.E.; Montgomerie, R. Plumage colour signals nutritional condition in the house finch. Proc. R. Soc. Lond. Ser. B Biol. Sci. 1994, 258, 47–52. [Google Scholar] [CrossRef]
- D’Alba, L.; van Hemert, C.; Handel, C.M.; Shawkey, M.D. A natural experiment on the condition-dependence of achromatic plumage reflectance in black-capped chickadees. PLoS ONE 2011, 6, e25877. [Google Scholar] [CrossRef]
- Sheldon, B.C.; Andersson, S.; Griffith, S.C.; Örnborg, J.; Sendecka, J. Ultraviolet colour variation influences blue tit sex ratios. Nature 1999, 402, 874–877. [Google Scholar] [CrossRef]
- Örnborg, J.; Andersson, S.; Griffith, S.C.; Sheldon, B.C.E.N. Seasonal changes in a ultraviolet structural colour signal in blue tits, Parus caeruleus. Biol. J. Linn. Soc. 2002, 76, 237–245. [Google Scholar] [CrossRef]

Disclaimer/Publisher’s Note: The statements, opinions and data contained in all publications are solely those of the individual author(s) and contributor(s) and not of MDPI and/or the editor(s). MDPI and/or the editor(s) disclaim responsibility for any injury to people or property resulting from any ideas, methods, instructions or products referred to in the content. |
© 2024 by the authors. Licensee MDPI, Basel, Switzerland. This article is an open access article distributed under the terms and conditions of the Creative Commons Attribution (CC BY) license (https://creativecommons.org/licenses/by/4.0/).