Article

Maxent Predictive Species Distribution Models and Model Accuracy Assessment for Two Species of Psilochalcis Kieffer (Hymenoptera: Chalcididae) Occurring in the Eastern Great Basin of Utah, USA

1
Department of Plant and Wildlife Sciences, Brigham Young University, Provo, UT 84602, USA
2
Chicago Botanic Garden, Negaunee Institute for Plant Conservation Science and Action, Glencoe, IL 60022, USA
3
Harold B. Lee Library, Department of Science and Engineering, Brigham Young University, Provo, UT 84602, USA
4
Department of Biology, Brigham Young University, Provo, UT 84602, USA
*
Authors to whom correspondence should be addressed.
Diversity 2024, 16(6), 348; https://doi.org/10.3390/d16060348
Submission received: 7 May 2024 / Revised: 12 June 2024 / Accepted: 13 June 2024 / Published: 16 June 2024

Abstract

:
Two species of Psilochalcis wasps (P. minuta and P. quadratis) were recently described from Utah’s eastern Great Basin. The extent of their known distributions is extremely limited, based on few data points. We developed species distribution models (SDMs) using Maxent modeling software for each Psilochalcis species to identify areas of probable suitable habitat for targeted collecting to improve our knowledge of their distributions. We used six occurrence data points for P. minuta and eight occurrence data points for P. quadratis, along with ten environmental variables as inputs into the Maxent modeling software. Model-predicted areas with a potential suitable habitat value greater than 0.69 were mapped using ArcGIS Pro to help select locations for model accuracy assessment. Employing Malaise traps, eighteen sites were sampled to evaluate each SDM’s ability to predict the occurrence of Psilochalcis species. Psilochalcis minuta occurred at eight of nine juniper-dominated sample sites that were predicted as having high suitability by the model for this species. Likewise, P. quadratis occurred at two of four cheatgrass-dominated sample sites predicted by the model. Psilochalcis minuta occurred at three of nine sampled sites that were not predicted by the model, and P. quadratis occurred at seven of fourteen non-predicted sites. The Maxent SDM results yielded an AUC value of 0.70 and p-value of 0.02 for P. minuta and 0.68 and 0.02. for P. quadratis. These results were reflected in our model accuracy assessment. Of the selected environmental variables, aspect, historic fire disturbance, and elevation yielded the greatest percent contributions to both species’ models. Sympatric distributions were observed for P. minuta and P. quadratis. Elevation, vegetation type, NDVI, and soil type are the most important environmental variables in differentiating areas of optimal suitable habitat for the two species.

1. Introduction

The arid Great Basin has experienced significant habitat fragmentation due to the encroachment of cheatgrass (Bromus tectorum L.), increased fire frequency, and revegetation with non-native perennial grasses [1]. Commonly, the resulting upland landscape is segregated into four ubiquitous habitat types made of remnant native or introduced plant assemblages in the Great Basin, namely (1) pinyon/juniper (P. monophylla Torr. & Frem. and Juniperus osteosperma (Torr.) Little), (2) sagebrush (Artemisia tridentata Nutt.), (3) cheatgrass (Bromus tectorum L.), and (4) crested wheatgrass (Agropyron cristatum (L.) Gaertn.) [1]. In Utah’s eastern Great Basin, three locations containing these four contiguous habitats were sampled for the occurrence of two recently described species of Psilochalcis Kieffer (Hymenoptera: Chalcididae): P. minuta Petersen and P. quadratis Petersen (Figure 1) [2]. The distributions, biologies, and ecological relationships of P. minuta and P. quadratis are just beginning to be explored [2,3]. Because these wasps are rarely collected and appear to exhibit habitat fidelity, we determined to use habitat modeling tools to better predict areas of suitable habitat and potential sites for further study. We aimed to better understand the distribution patterns of these two Psilochalcis species beyond that of their initial discovery.
Species distribution models (SDMs) correlate environmental and ecological variables with species occurrence data to predict potential suitable habitat areas with the highest probability of species occurrence. They have a wide range of applications in wildlife management, invasive species risk assessment, climate change response detection, habitat management and restoration, and biodiversity assessment [4]. These models help explain ecological processes as well as predict future species distributions in areas that have yet to be sampled [5]. For uncommon species, predictive models can identify areas of suitable habitat for study [6,7]. Creating predictive SDMs with this intent is the primary purpose of our study.
Maximum entropy (Maxent) [8] is a widely used modeling tool for creating SDMs [9,10]. It has been shown to outperform other different modeling methods [11,12] using presence-only data. Maxent maintains predictive reliability for species where the number of known occurrence data points is very small [13,14,15]. It has been used successfully in predicting areas of suitable habitat for various threatened and endangered species, including frogs and damselflies [16], freshwater mussels [17], trees [11], and geckos [18].
In order to further our understanding of species distribution, we developed SDMs using Maxent for P. minuta and P. quadratis to identify areas of suitable habitat. We tested the predictive accuracy of these models through field sampling areas of predicted suitable habitat for P. minuta and P. quadratis occurrence.

2. Materials and Methods

2.1. Species Occurrence Data

We extracted all specimens of P. minuta and P. quadratis from Malaise trap samples collected and stored in 70% ethanol from 2006 and 2007 [2]. Samples were from three locations: Utah, Juab County, Tintic Valley; Juab County, Yuba Valley; and Sanpete County, Antelope Valley. At each location, twelve Malaise traps were set up: three in each of four contiguous habitat types made up of native remnant shrub or tree communities or non-native grass communities. The habitats, named based on their dominant species, were pinyon/juniper (native), sagebrush (native), cheatgrass (non-native invasive), and crested wheatgrass (non-native revegetated). The associations of these two species, P. minuta with pinyon/juniper habitat and P. quadratis with cheatgrass habitat, have been shown to be statistically significant [3], with most occurrences of both species found at the Yuba Valley site. The data points from these associations provided the limited extent of known distribution for these species.
During the summer of 2020, Malaise traps were set up in four new locations to acquire additional occurrence data points. One pinyon/juniper and one cheatgrass site was chosen at the south end of Yuba Valley, just east of Yuba Reservoir. One pinyon/juniper and one cheatgrass site was chosen in Sage Valley, the next valley northwest to Yuba Valley in Juab County. Additionally, two traps were set at the original Yuba Valley pinyon/juniper and cheatgrass sites. This was carried out to take into account the thirteen-year gap between samplings and verify the continued presence of P. minuta and P. quadratis in those areas. Incorporating all previous and newly acquired geographic occurrence data points for P. minuta and P. quadratis, csv files were created for input into Maxent for building the SDMs for each species using Microsoft Excel 2016.

2.2. Environmental Variables

A review of the pertinent literature helped guide our selection of environmental variables for model construction. Temperature and precipitation are known to have an effect on insect distributions [7,19]. These environmental variables in turn affect the structure and composition of plant communities with associated insect populations. Vegetation type is closely associated with soil composition. Elevation, slope, and aspect also have an effect on vegetation type and plant community structure. This suite of variables is widely used in almost all terrestrial species distribution modeling. Specific to this study, the occurrence of P. minuta and P. quadratis has been associated with pinyon/juniper and cheatgrass habitats, respectively [3]. Fire disturbance has also been shown to affect insect distributions [20,21]. It is well documented that cheatgrass rapidly invades native plant communities following significant physical disturbance, particularly after wildfire [22]. The cheatgrass areas in which P. quadratis was predominantly collected all originated from historic fire disturbance [1]. Thus, fire disturbance or the absence of fire disturbance was selected as a potential variable affecting Psilochalcis species distributions. The distance-to-water-source variable was selected based on the specific environmental conditions at the original occurrence sites. Psilochalcis minuta and P. quadratis were almost exclusively collected from the Yuba Valley site. The Yuba Valley and Antelope Valley sites were the only sites close to a body of water, namely Yuba Reservoir and Gunnison Reservoir. We therefore included “distance to nearest water source” as a variable having a potential effect on these species’ distributions.
Data for ten environmental variables were downloaded from various sources (Table 1) and imported into ArcGIS Pro by Esri version 3.0.0 for visualization and preparation for input into Maxent to create the SDMs. A digital elevation model (DEM) was obtained from the Shuttle Radar Topography Mission (SRTM) [23]. Four 30 m tiles were downloaded to cover all portions of the area of interest: N40W113, N40W112, N39W112, and N39W113. Rasters were mosaicked and clipped to the model testing boundary. Elevation, slope, and aspect were generated from the DEM, producing three corresponding data layers in ArcGIS Pro. Historical disturbance by wildfire and vegetation type data were obtained from LANDFIRE [24]. Both layers were clipped to the model testing boundary. Precipitation (monthly total precipitation) and temperature (daily mean temperature) data were obtained from the parameter-elevation regressions on independent slopes model (PRISM) [25] and clipped to the sampling boundary. Water feature data for lakes and rivers, streams, and springs were obtained from the Utah Geospatial Resource Center’s (UGRC) State Geographic Information Database (SGID) [26]. A small buffer was created around streams and springs data, which are point features, allowing their conversion into polygon features. These were merged with the lakes data polygon features to make a single “distance to closest water source” data layer. The distance tool was used to calculate the distance to the closest water source, and the layer was clipped to the model testing boundary. A Landsat normalized difference vegetation index (NDVI) was downloaded for the area of interest courtesy of the U.S. Geological Survey Earth Resources Observation and Science Center. This was imported into ArcGIS Pro and clipped to the model testing boundary. Soil data were obtained from Web Soil Survey (WSS) [27]. Six soil data files were downloaded that covered the area of interest: Tooele; Millard and Juab; Fairfield Nephi; Fishlake National Forest Tushar Pavant Division; Millard County, Utah; and Sanpete Valley. The files were combined using the mosaic tool and clipped to the model testing boundary. All environmental layers were resampled to be in the same projection (WGS 1984 UTM Zone 12N) and resolution (30 m). To ensure we selected the most relevant environmental variables with the lowest multicollinearity in the study area, we used the Pearson correlation coefficient r using ENMTools [28] in Rstudio [29].

2.3. Species Distribution Model Construction

Species distribution models for Psilochalcis in Utah’s eastern Great Basin were created using Maxent software version 3.4.3 [30]. Maxent was selected to analyze Psilochalcis wasps’ geographic distribution considering (1) its accuracy in geographically modeling the habitat suitability of species with limited occurrence records and complex geographical-environmental niches [18,31] and (2) Maxent’s versatility in creating species geographical suitability maps, reducing overfitting of input data, and controlling model complexity [32], which is crucial for geographically understanding species with limited data and knowledge of their ecological niches and environmental envelope.
Model calibration was performed using ENMeval package [33] in Rstudio 4.2.0. We used the standardized Akaike information criteria coefficient (AICc) for parameter optimization and model selection [34]. Maxent outputs of independent variables to construct Psilochalcis wasps’ models were extracted and analyzed individually.
Species-specific Maxent models were constructed for P. minuta and P. quadratis to identify areas of the highest potential for habitat suitability and identify the environmental variables that have the greatest effect on probability of occurrence of each species. Model boundaries were established on two criteria. First, we observed that P. minuta and P. quadratis were not collected at the Antelope Valley site. We therefore expanded the sampling boundary to the west and north of Yuba Valley for each SDM accuracy assessment. Second, the boundary needed to be within a five to eight-hour roundtrip drive of potential sampling locations to accommodate Malaise trap setup and sample retrieval. This was necessary due to time, manpower, and budget constraints.
From the collection data of 2006–2007 and 2020, we used six occurrence data points for P. minuta and eight occurrence data points for P. quadratis along with the ten environmental variable data layers as inputs [35] to the Maxent modeling software to create SDMs for both species. Due to the low number of occurrence data points, a bias file was created and used for background points for model testing [36,37,38]. We used the area under the receiver operating curve (AUC) approach to evaluate each model’s predictive accuracy [39]. We examined percent contribution to determine which environmental variables contributed most to model performance. We analyzed jackknife test outputs to better understand the relative importance of single explanatory variables in species model creation [40], evaluate model sensitivity by variable, and analyze variable effects on predicting species niche [41]. Variable response graphs were created to visualize and compare trends of species responses to environmental variables.

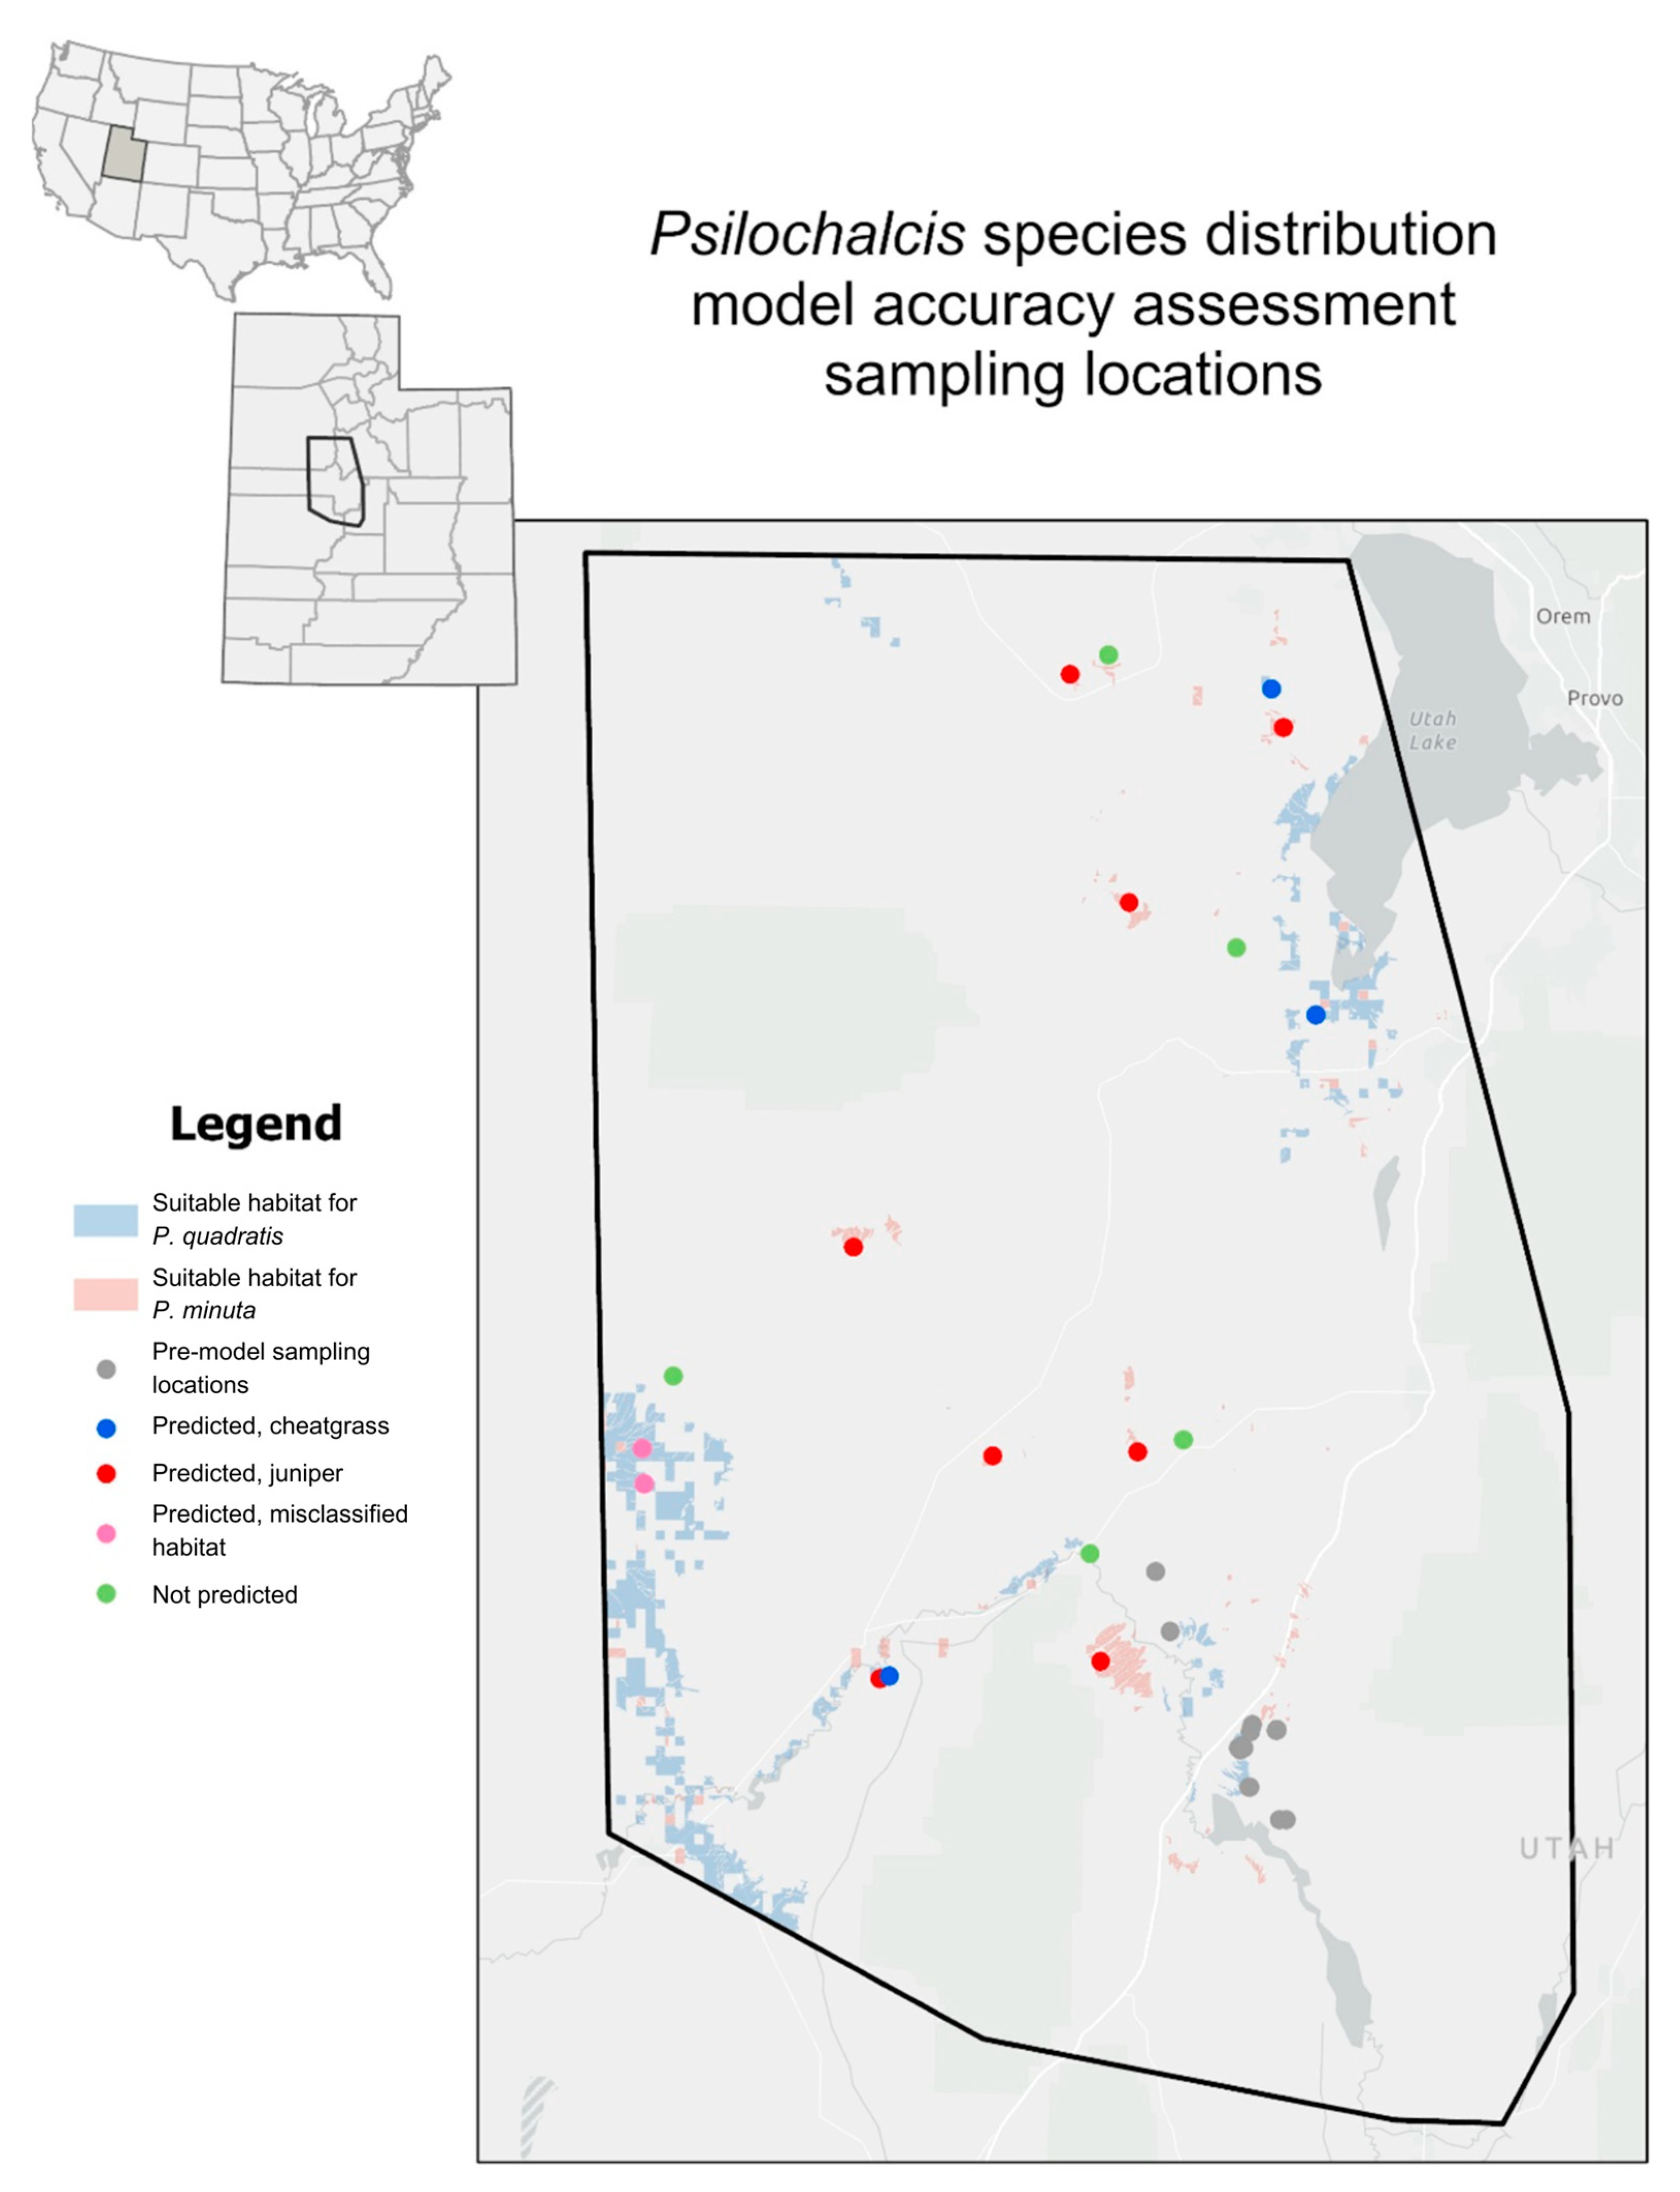
2.4. Sampling Location Selection for Model Accuracy Assessment

The potential suitable habitat maps generated in Maxent for P. minuta and P. quadratis were imported into ArcGIS Pro. From these, a map of potential sampling areas was created. Areas with a potential suitable habitat value estimate greater than 0.69 were mapped to better visualize potential sampling locations for each species. The selection of sample sites was not randomly assigned because of accessibility issues. The setup of Malaise traps required road access as well as a topography which obscured the trap from visual observation by other people. Our experience with Malaise traps set up in highly visible areas frequently led to vandalism. These factors guided us to select the following sample sites that could be weekly monitored across a two-day period: nine sites with high suitability predicted for P. minuta, four sites with high suitability predicted for P. quadratis, and five sites with low predicted suitability for either species (Figure 2). Appropriate sample sites for P. minuta were much more common than for P. quadratis.
During the summers of 2021–2022, 18 sites were sampled for occurrence of Psilochalcis species by setting up Malaise traps within the habitat boundaries predicted or not predicted by Maxent. Sampling ran continuously from the beginning of July through mid-August. The time of peak abundance of both species [3] was used to determine the midpoint of the sampling period. Trap samples were retrieved weekly.

3. Results

3.1. Model Accuracy Assessment Sampling Summary

Our assessments of the 2021–2022 Malaise trap sampling showed P. minuta occurred at eleven sites: eight sites predicted by the SDM and three sites not predicted (Table 2). Psilochalcis minuta showed a high fidelity to pinyon/juniper habitat, with ten of the eleven sampled sites characterized by this habitat type proving positive for occurrence. Ground-truth observations revealed that one of the P. minuta predicted sites was composed primarily of greasewood (Sarcobatus vermiculatus (Hook.)), lacking any pinyon/juniper, whereas all other predicted sites were pinyon/juniper. Psilochalcis quadratis occurred at nine sites: two predicted by the SDM and seven non-predicted sites (Table 2). We observed that three of the predicted sites were composed of cheatgrass and one composed primarily of greasewood. To maintain the testing validity of the predictive models for both Psilochalcis species, Malaise traps were set at all chosen predicted sites even if they were not composed of the predicted dominant vegetation.
The sampling conducted at sites not predicted for either species showed various results (Table 2). Two sites characterized by pinyon/juniper and pinyon/juniper/-sagebrush showed the presence of both species, with considerably higher numbers of P. minuta collected compared to P. quadratis. We observed this same phenomenon at all but one site where both species were collected. One site was characterized as barren, with only one specimen of P. quadratis retrieved. One site was not easily characterized by habitat type, comprised of native shrubs and native and non-native grasses. Neither Psilochalcis species were collected at this site. One site was composed primarily of greasewood, from which five specimens of P. minuta and four specimens of P. quadratis were retrieved.

3.2. Maxent Modeling Results

The AUC values for the P. minuta model and the P. quadratis model were 0.701 and 0.680, respectively (Table 3). Model p-values were calculated based on the maximum test sensitivity plus specificity threshold to assess model performance. The calculated p-values for P. minuta and P. quadratis (Table 3) are considered statistically significant, indicating a low degree of variation between the sensitivity of the test and the estimation of the suitability of the two species. Additional model metrics and features are given in Table 3.

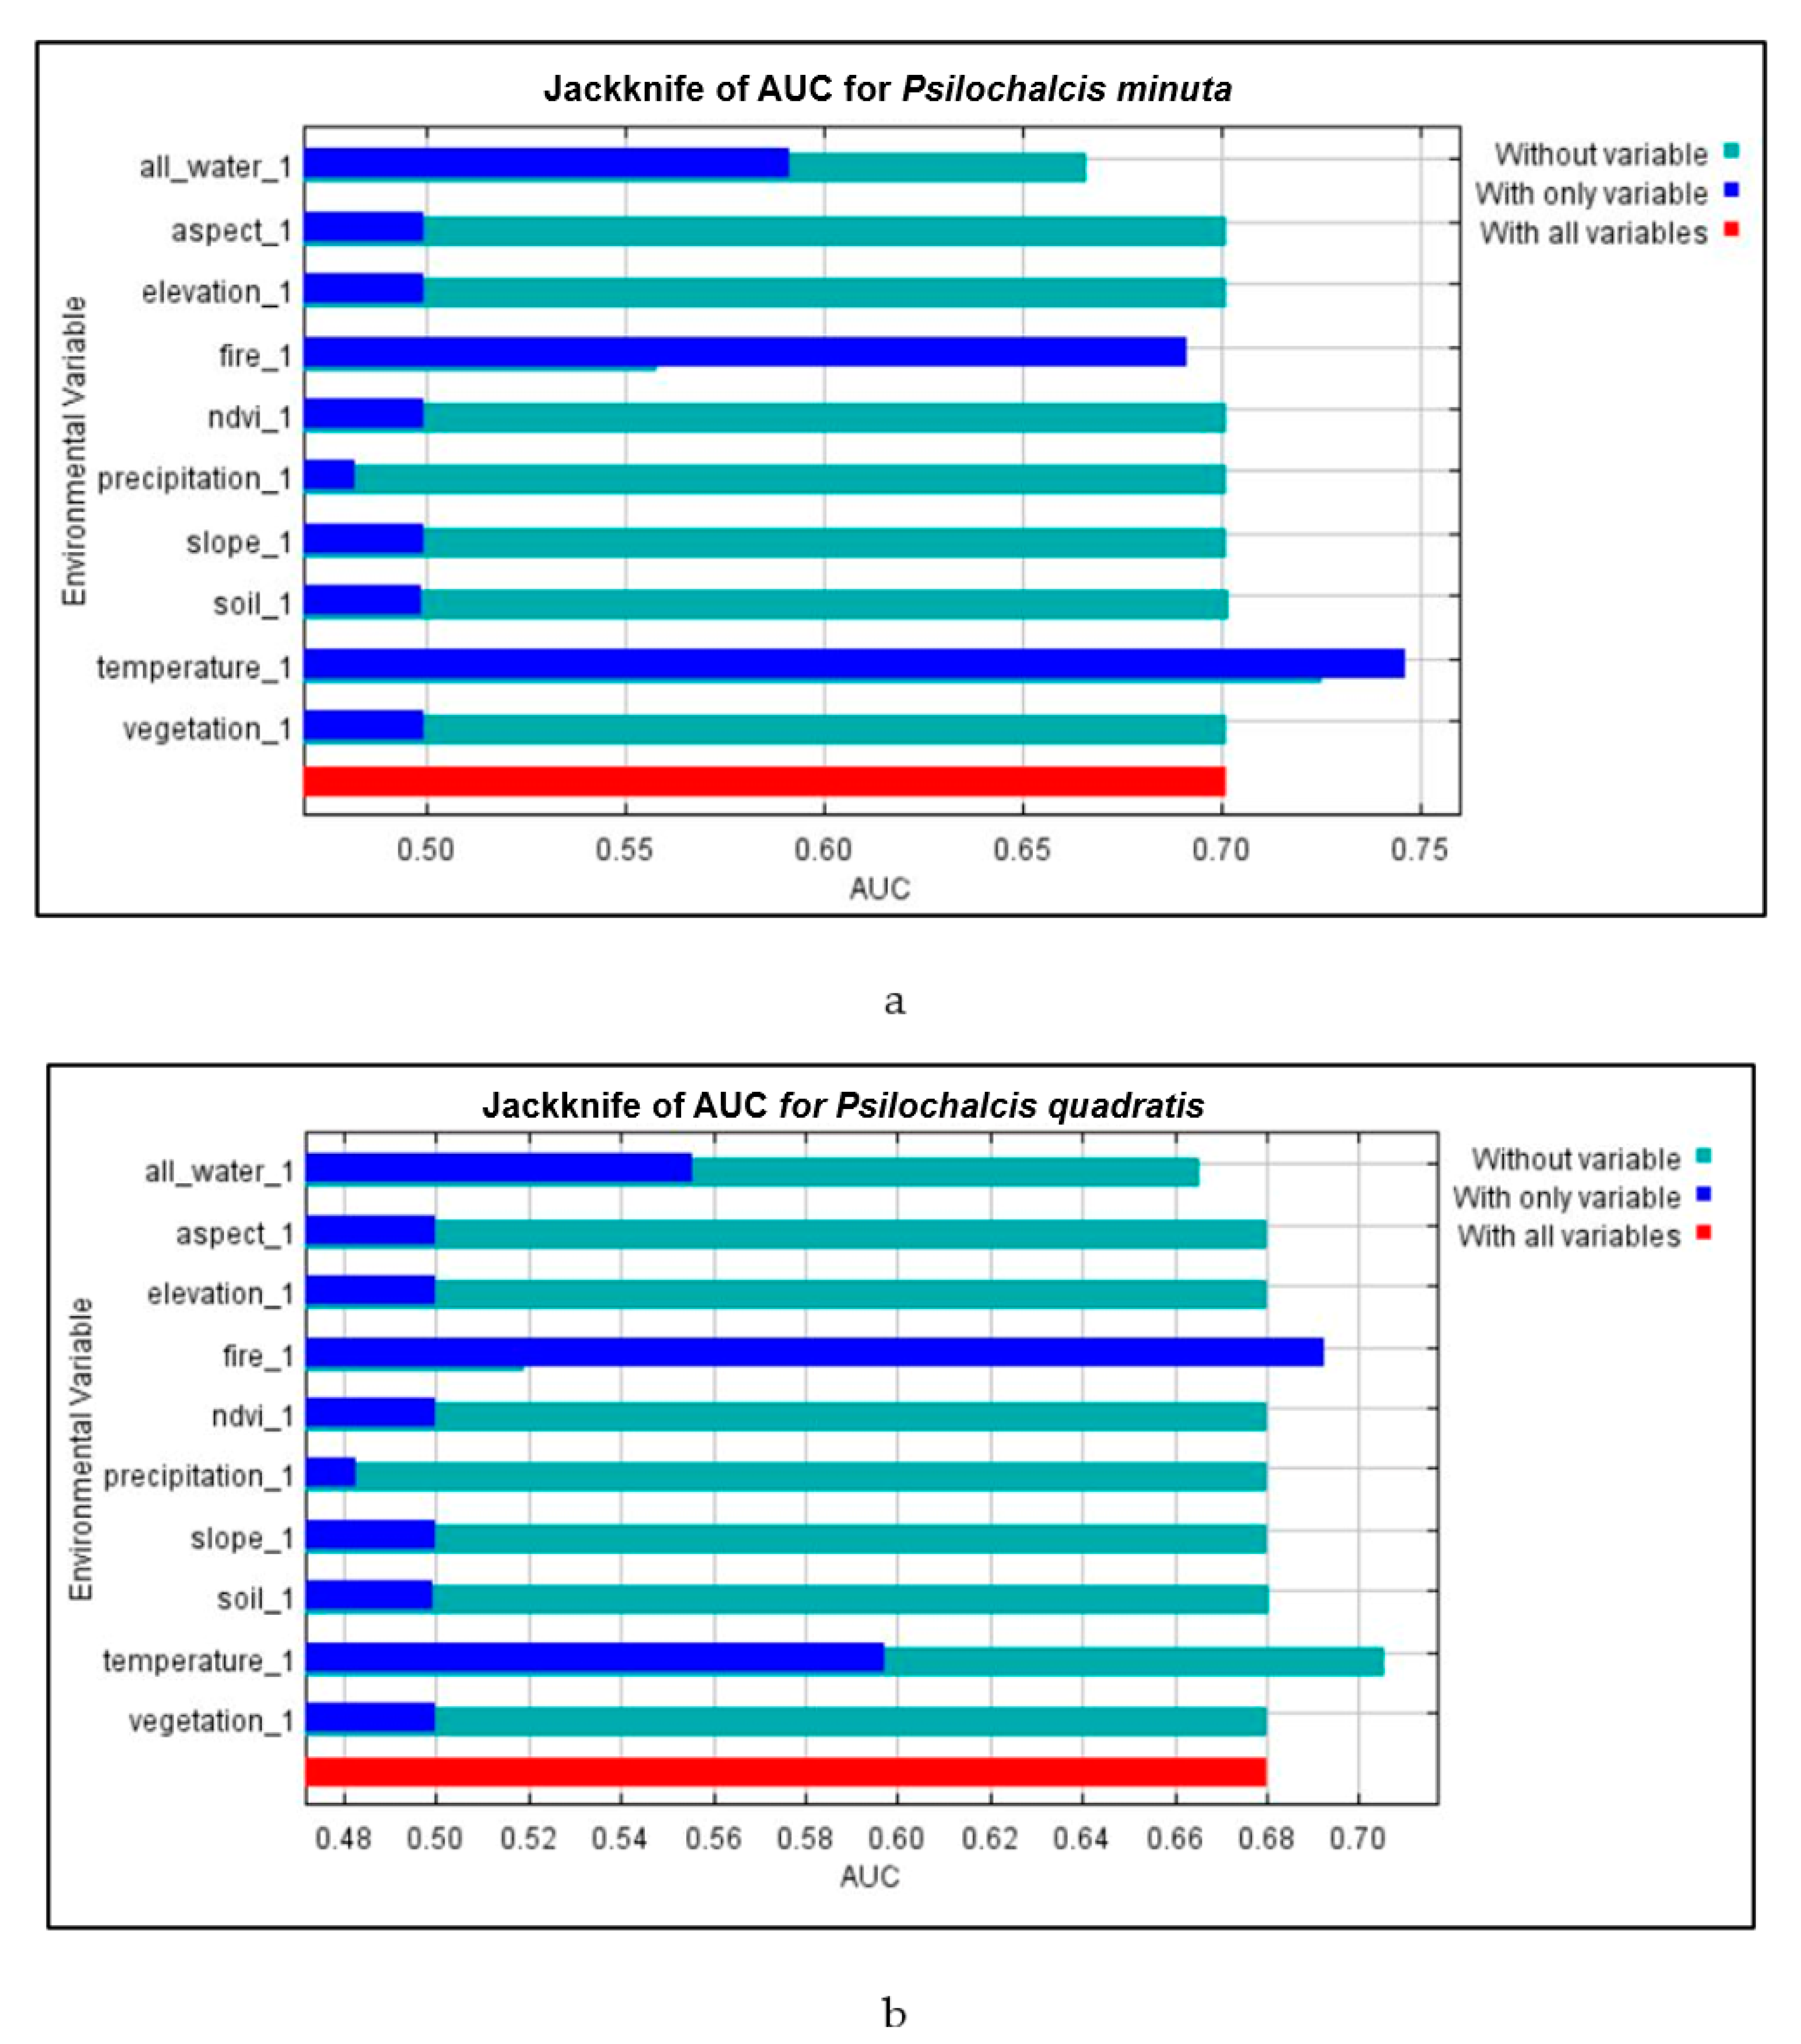
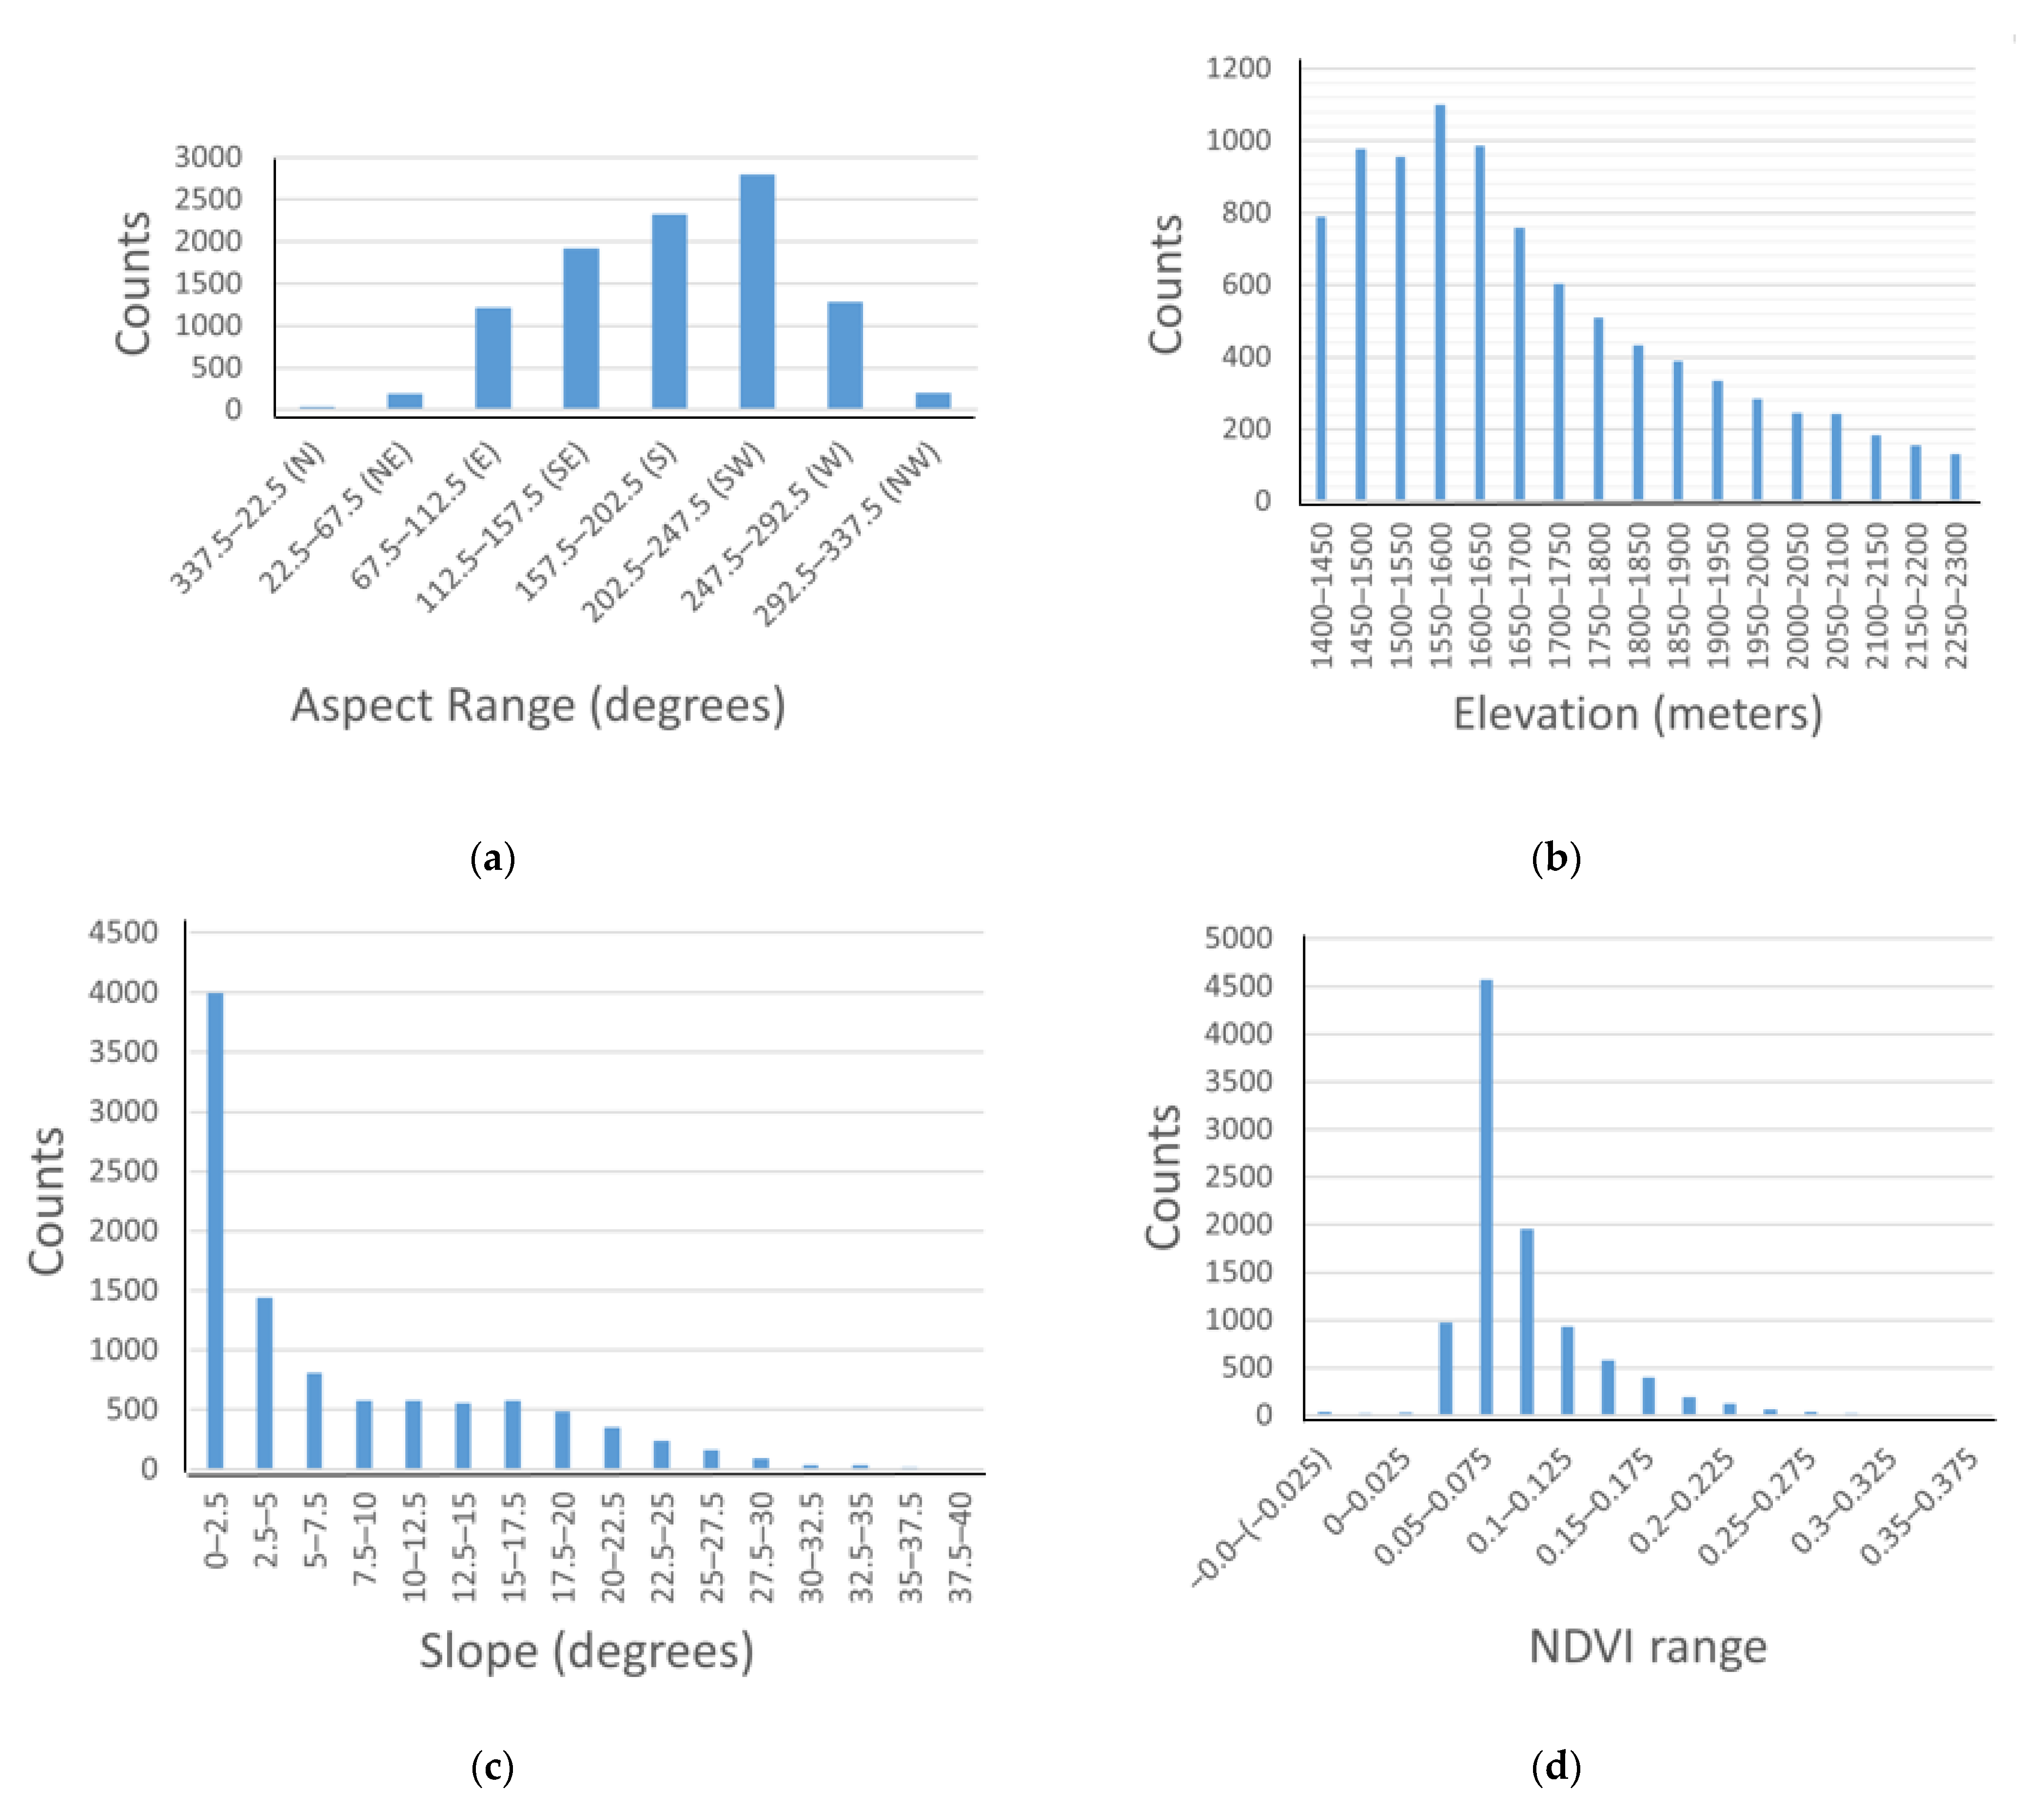
3.3. Environmental Variable Analyses

The percentage contributions to the SDMs for the ten environmental variables are divided into three categories; high (>10%), moderate (1–10%), and low (<1%). Aspect (40.8%), historic fire disturbance (14.3%), elevation (13.4%), and soil composition (10.1%) are considered the most important environmental predictors of suitable habitat for the occurrence of P. minuta. (Table 4). The same variables in the same order are considered important predictors of suitable habitat for P. quadratis, with small differences in actual percentage contribution values (Table 4).
Jackknife tests show the trends in test AUC gain for environmental variables through the “leave one out” method. The three single most important environmental predictors for modeling were temperature, historic fire disturbance, and distance to closest water source (all_water) for both P. minuta (Figure 3a) and P. quadratis (Figure 3b). Many predictor variables had minimal impact for estimating the suitability of occurrence of either Psilochalcis species. Precipitation had the least impact on model AUC gain. Temperature provided the most information to the model relative to the other variables in the study, particularly for P. minuta, whereas historic fire disturbance provided the most information relative to the other environmental variables to the P. quadratis model.

3.4. Variable Response Graphs

The predicted areas of suitable habitat for P. minuta and P. quadratis have a high degree of overlap as demonstrated by the variable response curves for aspect, elevation, slope, and NDVI (Figure 4). Only one set of graphs is shown since the responses for these variables were nearly identical for both P. minuta and P. quadratis.
Both Psilochalcis species are likely to occur in areas with a southwest aspect, with slopes less than 2.5 degrees, and between 1500–1650 m elevation. An NDVI range between 0.05–0.075 indicates both species are likely to occur in areas with sparse vegetation characterized by open grassland, shrubland, or woodland. Temperature, precipitation, and distance to closest water source were fairly evenly distributed throughout the range of variable grid predictions, with no distinct range in variable response.

4. Discussion

When inspecting a sampling site, the most visible and quickly characterized environmental variable is vegetation type, which we use synonymously with habitat. Vegetation type has been shown to be significantly associated with Psilochalcis species occurrence in central Utah amongst ubiquitous Great Basin vegetation types, specifically P. minuta with pinyon/juniper and P. quadratis with cheatgrass habitats [3]. Our model accuracy assessment sampling results reflect a similar association for P. minuta. The P. minuta model was extremely reliable in predicting probable areas of suitability for P. minuta occurrence. Psilochalcis minuta occurred at all sites composed of pinyon/juniper predicted by the model. The model did not however, include all pinyon/juniper habitat as suitable, even though P. minuta occurred at all non-predicted sample sites composed of pinyon/juniper. Localized variations may explain why some areas of pinyon/juniper were not predicted by the model. It is likely that within apparently uniform vegetation communities, the microclimate conditions, local geologic and geographic features, and biological composition will vary. As a result, certain pinyon/juniper areas were not predicted by the SDM.
The P. quadratis model was much less reliable in predicting probable areas of occurrence for this species. Psilochalcis quadratis occurred at only one-third of predicted sites composed of cheatgrass habitat. It occurred at 53% of sites characterized as other habitat types. Differences in cheatgrass community structure may be a contributing factor to this model’s poorer reliability. During sampling, we observed predicted cheatgrass areas that were in different states of succession. Our sampling results suggest that P. quadratis occurs throughout a much broader suite of Great Basin habitats than previously suggested [3]. The occurrence of P. quadratis in areas other than predominantly cheatgrass is possibly a byproduct of the widespread invasion of cheatgrass into different habitat types throughout the Great Basin [42] and helps answer the question of why the P. quadratis model was less effective in predicting the occurrence of this species. Cheatgrass has a low fidelity to specific site criterion and has been documented to quickly expand into multiple habitat types, particularly after fire disturbance [43]. Studies have shown that cheatgrass alters and accelerates the fire cycle in these areas [44,45], perpetuating more frequent disturbance due to its high flammability, giving itself an advantage for establishment over native species due to its greater seed production capacity [46]. Psilochalcis quadratis is most likely occurring in native habitat types that have experienced fire disturbance and subsequent cheatgrass invasion. This may also help to explain the observed anomaly of a likely endemic wasp species occurring in areas now dominated by an introduced exotic species such as cheatgrass.
Our sampling results showed both Psilochalcis species occurred in areas of greasewood habitat. Greasewood is a native species that is less affected by fire disturbance. It is capable of vegetative regeneration through new shoot production, quickly growing back after fire disturbance [47]. We gained valuable insights from assessing the accuracy of model suitability predictions even when the predicted vegetation types did not match habitats of known occurrence. Finding both Psilochalcis species in sites composed of greasewood vegetation, which has not been typically associated with either species, led us to realize that these Psilochalcis species occur in native vegetation types other than those originally sampled. This suggests that our modeling would be improved if additional samplings were conducted in areas of persistent salt desert shrub like greasewood as well as areas of salt desert shrub that have experienced fire disturbance and are now predominantly cheatgrass.
The two species models are statistically similar. p-values for the individual species models were identical (Table 3), suggesting that although there were limited occurrence data used as inputs for the two species models, Maxent was able to estimate the potential habitat suitability of the two species within the study area. The model AUC for P. minuta is higher than the AUC for the P. quadratis model (Table 3), indicating a greater reliability in predicting potential areas of probable occurrence for P. minuta than P. quadratis [48]. This statistical difference is confirmed in the results of our model accuracy sampling.
The jackknife analyses (Figure 3) showed strong discrimination between single environmental variables for the two species. Moreover, the individual effect of temperature, historic fire disturbance, and distance to closest water source observed in both species highlight how each species sensitivity of occurrence and ecological niche are affected by climate. Although drought was not included in this study, prolonged extreme temperatures and erratic precipitation amounts in the region likely affect suitable habitat for Psilochalcis species found in central Utah.
The spatial distributions observed in the models for P. minuta and P. quadratis suggest sympatric distributions with very similar environmental and ecological characteristics for these two species. Psilochalcis minuta and P. quadratis likely occupy similar ecological niches in the study area. Our results indicate aspect, elevation, and historic fire disturbance as the most important variables when modeling Psilochalcis wasps’ habitat in Utah. These three variables are known to directly and indirectly affect the vegetation type of a particular area. Aspect and elevation have an effect on vegetation type, plant density, and community structure [49,50,51]. Specifically, pinyon/juniper’s ecological niche is associated with a distinct range in elevation [42]. Habitat disturbance due to wildfire is well documented throughout the study area, so its contribution to each model’s performance is to be expected.
We note that both species models were similar in variable percent contributions, with only slight differences observed between environmental variables selected for this study. The overlapping distributions of these two species can be explained by these slight differences in percentage contribution by variables used to create their SDMs. The difference in aspect between the P. minuta and P. quadratis models was only 0.5%. For historic fire disturbance, no difference in percent contribution was found between the two species models. This suggests that the probability of either species occurrence is less sensitive to the range of aspect and degree of fire disturbance in the region, even though both variables show a greater percent contribution to the overall models. There was a 0.5% difference between species models for temperature, with only a 4.5% and 4.0% contribution to each species model, respectively. Similarly, precipitation and distance to closest water source showed an even smaller difference of 0.1% between species models. This suggests that species occurrences are less sensitive overall to the effects of these variables throughout the study area.
We observed greater differences in the percent contributions between the P. minuta and P. quadratis models for elevation, vegetation type, NDVI, and soil type. The difference in elevation between the P. minuta and P. quadratis models was 0.8%. This greater difference suggests that the two species are somewhat affected by the elevation gradient. Due to the relatively small study area (approximately 9400 km2) and where P. minuta and P. quadratis have been found in previous studies [2,3], it is likely that elevation is ecologically important to differentiate the optimal suitable habitat of the two species. Similar results are seen for vegetation type and NDVI, which yielded 0.8% and 0.9% differences between species models. This suggests that vegetation type as well as the degree of openness or sparsity of vegetation within these areas are ecologically important in differentiating areas of suitable habitat of each species.
Psilochalcis are known parasitoids of moths in the families Pyralidae and Gelechiidae [52]. We do not yet know the host moth species for P. minuta and P. quadratis or the host plant species of these moths. It is possible that the plant species utilized by these moths may not be pinyon/juniper or cheatgrass, but currently we do not have a different vegetation metric to look at other than the dominant plant species in areas where P. minuta and P. quadratis occur. Interestingly, the difference in percent contribution for soil type between the two species models was 1.3%, being slightly higher for P. quadratis (10.1%) than for P. minuta (8.8%), indicating that soil type is an important ecological factor for each species dynamic in the region. This is most likely related to the interactions of the host moth species and their plant hosts with soil type in completing their life cycles [53]. Slope should also be considered an important environmental factor affecting Psilochalcis species distribution with a 1.5% difference between models, being slightly higher for P. quadratis (6.8%) than for P. minuta (5.3%). This suggests that each species occupies areas of differing slope within the 0–2.5° range, as seen in this variable’s response curves for both species. This may also be associated with differences in vegetation type throughout the study area, with pinyon/juniper tending to be found on foothill areas of slightly greater slope.
The greater differences in percent contribution between models for soil type and slope over vegetation type and NDVI may indicate these variables are the underlying predominant factor at an ecological site, which in turn affects not only the dominant vegetation type that occurs but all plant species occurring at the site. It is possible that early spring ephemeral forb species are the plants that the host moth species utilize. Different forb species and/or combination of species occur at different sites due to soil and slope differences between sites. This is supported by the differences in plant species composition observed between the Yuba Valley site, where both Psilochalcis species were abundant, and the Antelope Valley site, where both species were starkly absent [3]. Historic grazing practices may also contribute to the differences seen in plant species composition between these two sites. It is known that sheep facilities have been operated continually at Antelope Valley for many decades, whereas rangelands at Yuba Valley have been used for cattle grazing. Unlike cattle, sheep are indiscriminate grazers, eating shrubs, forbs, and grasses. It is possible that the forb species utilized by Psilochalcis host moth species are greatly reduced or even absent in Antelope Valley sites due to sheep grazing and are still present or even prevalent at Yuba Valley.
Other studies have used Maxent to describe the ecological niches of wasp species with much broader distributions than those of P. minuta and P. quadratis. The ecological niche for the invasive species Vespula germanica L. was strongly affected by humidity and mean annual temperature [54]. Likewise, the distribution of the widely ranging species Polistes dominula Christ was shown to be affected by annual mean temperature, seasonal variation of summer temperatures, and precipitation [55]. Unlike these species affected by moisture and temperature that are likely thriving in mesic habitats, our Maxent modeling results highlights the endemism and adaptations to high temperatures and low moisture of P. minuta and P. quadratis within their narrow distribution ranges in central Utah. Moreover, microhabitats with particular topographic and vegetation composition and climate have a greater effect on the ecological niches of these species.

5. Conclusions

We demonstrated that the potential distribution of two Psilochalcis species can be adequately modeled using Maxent. We recognize that the Maxent models in this study were built using a low number of species occurrences, but the purpose of these models was to help improve species distribution knowledge by predicting suitable sites for future collection efforts. The fact that the assessment of Maxent models could be so informative with relatively low numbers of sites and individuals collected for analysis is useful. There may be high utility in the potential of using this methodology for other species that occur sporadically and in relatively low numbers for which habitats are relatively obscure. Expanding the distribution knowledge for these Psilochalcis species is important since they are so infrequently collected.
We recognize the value in assessing the predictive accuracy of models, which in our case increased our understanding of model performance for Psilochalcis species.
Our modeling results supported our assumption of an ecological relationship between P. minuta and pinyon/juniper communities. Conversely, our modeling results did not support a clear relationship between P. quadratis and cheatgrass communities. Psilochalcis quadratis occurs in sites independent of cheatgrass and does not occur at other sites primarily composed of cheatgrass. Additionally, our discovery that P. quadratis occurs in greasewood communities is informative. It partially explains why we found P. quadratis in cheatgrass communities that were originally greasewood sites prior to fire. We infer that both plant and moth host species associated with Psilochalcis species must still remain in these altered communities. The extent to which P. quadratis occurs in other salt desert shrub communities is unknown. These conclusions would not have been as apparent without the verification of model predictions through field sampling. We recommend that assessment of model accuracy through field sampling be considered in study design and utilized more often to help interpret Maxent model predictions.
Maxent modeling is valuable in identifying environmental variables that are important predictors of potential suitable habitat for species with sympatric distributions, thus giving a more complete picture of each species ecological niche.
We better understand that ecological site and disturbance history are critically important in species distribution modeling and managing for organisms that may be relatively endemic to Great Basin rangelands and are potentially at risk of being eliminated.

Author Contributions

Conceptualization, M.J.P., R.L.J. and V.J.A.; methodology, M.J.P., R.L.J. and V.J.A.; software, M.J.P., H.G.O.C. and T.G.; formal analysis, M.J.P., H.G.O.C. and S.L.P.; resources, V.J.A.; writing—original draft preparation, M.J.P., H.G.O.C. and T.G.; writing—review and editing, M.J.P., H.G.O.C., T.G., R.L.J., V.J.A. and S.L.P.; visualization, M.J.P., H.G.O.C. and T.G.; supervision V.J.A.; project administration, V.J.A.; funding acquisition, V.J.A. All authors have read and agreed to the published version of the manuscript.

Funding

This research received no external funding.

Institutional Review Board Statement

Not applicable.

Data Availability Statement

The original contributions presented in the study are included in the article, further inquiries can be directed to the corresponding author.

Conflicts of Interest

The authors declare no conflicts of interest.

References

  1. Johnson, R.L.; Anderson, V.J.; Clark, S.M. Chapter 1 Impact of Habitat Alterations to Bee Diversity in Sagebrush and Pinyon/Juniper Communities of the Eastern Great Basin. Unpublished Dissertation, Department of Plant and Wildlife Sciences, Brigham Young University, Provo, UT, USA, 2008. [Google Scholar]
  2. Petersen, M.J.; Johnson, R.L.; Anderson, V.J. A review of Psilochalcis Kieffer (Hymenoptera: Chalcidoidea: Chalcididae) from the western United States with descriptions of three new species from Utah and surrounding states. West. N. Am. Nat. 2022, 82, 704–718. [Google Scholar] [CrossRef]
  3. Petersen, M.J.; Anderson, V.J.; Johnson, R.L.; Eggett, D.L. Seasonal Trap Abundance of Two Species of Psilochalcis Kieffer (Hymenoptera: Chalcididae) in Rangelands of the Eastern Great Basin of Utah, USA. Land 2023, 12, 54. [Google Scholar] [CrossRef]
  4. Franklin, J. Mapping Species Distributions: Spatial Inference and Prediction; Cambridge University Press: Cambridge, UK, 2010. [Google Scholar]
  5. Wiersma, Y.F.; Huettmann, F.; Drew, C.A. Introduction. landscape modeling of species and their habitats: History, uncertainty, and complexity. In Predictive Species and Habitat Modeling in Landscape Ecology; Springer: New York, NY, USA, 2011; pp. 1–6. [Google Scholar]
  6. Davies, A.J.; Wisshak, M.; Orr, J.C.; Roberts, J.M. Predicting suitable habitat for the cold-water coral Lophelia pertusa (Scleractinia). Deep Sea Res. Part I Oceanogr. Res. Pap. 2008, 55, 1048–1062. [Google Scholar] [CrossRef]
  7. Ulrichs, C.; Hopper, K.R. Predicting insect distributions from climate and habitat data. BioControl 2008, 53, 881–894. [Google Scholar] [CrossRef]
  8. Phillips, S.J.; Anderson, R.P.; Schapire, R.E. Maximum entropy modeling of species geographic distributions. Ecol. Model. 2006, 190, 231–259. [Google Scholar] [CrossRef]
  9. Yoon, S.; Lee, W.H. Methodological analysis of bioclimatic variable selection in species distribution modeling with application to agricultural pests (Metcalfa pruinosa and Spodoptera litura). Comput. Electron. Agric. 2021, 190, 106430. [Google Scholar] [CrossRef]
  10. Byeon, D.H.; Jung, S.; Lee, W.H. Review of CLIMEX and MaxEnt for studying species distribution in South Korea. J. Asia-Pac. Biodivers. 2018, 11, 325–333. [Google Scholar] [CrossRef]
  11. Sunil, K.; Stohlgren, T.J. MaxEnt modeling for predicting suitable habitat for threatened and endangered tree Canacomyrica monticola in New Caledonia. J. Ecol. Nat. Environ. 2009, 1, 094–098. [Google Scholar]
  12. Elith, J.; Graham, C.H.; Anderson, R.P.; Dudík, M.; Ferrier, S.; Guisan, A.; Hijmans, R.J.; Huettmann, F.; Leathwick, J.R.; Lehmann, A.; et al. Novel methods improve prediction of species’ distributions from occurrence data. Ecography 2006, 29, 129–151. [Google Scholar] [CrossRef]
  13. Senula, S.F.; Scavetta, J.T.; Banta, J.A.; Mueller, U.G.; Seal, J.N.; Kellner, K. Potential distribution of six north American higher-attine fungus-farming ant (Hymenoptera: Formicidae) species. J. Insect Sci. 2019, 19, 24. [Google Scholar] [CrossRef]
  14. van Proosdij, A.S.; Sosef, M.S.; Wieringa, J.J.; Raes, N. Minimum required number of specimen records to develop accurate species distribution models. Ecography 2016, 39, 542–552. [Google Scholar] [CrossRef]
  15. Hernandez, P.A.; Graham, C.H.; Master, L.L.; Albert, D.L. The effect of sample size and species characteristics on performance of different species distribution modeling methods. Ecography 2006, 29, 773–785. [Google Scholar] [CrossRef]
  16. Mafuwe, K.; Broadley, S.; Moyo, S. Use of maximum entropy (Maxent) niche modelling to predict the occurrence of threatened freshwater species in a biodiversity hotspot of Zimbabwe. Afr. J. Ecol. 2022, 60, 557–565. [Google Scholar] [CrossRef]
  17. Walters, A.D.; Ford, D.; Chong, E.T.; Williams, M.G.; Ford, N.B.; Williams, L.R.; Banta, J.A. High-resolution ecological niche modelling of threatened freshwater mussels in east Texas, USA. Aquat. Conserv. Mar. Freshw. Ecosyst. 2017, 27, 1251–1260. [Google Scholar] [CrossRef]
  18. Pearson, R.G.; Raxworthy, C.J.; Nakamura, M.; Townsend Peterson, A. Predicting species distributions from small numbers of occurrence records: A test case using cryptic geckos in Madagascar. J. Biogeogr. 2007, 34, 102–117. [Google Scholar] [CrossRef]
  19. Zhu, H.; Wang, D.; Wang, L.; Fang, J.; Sun, W.; Ren, B. Effects of altered precipitation on insect community composition and structure in a meadow steppe. Ecol. Entomol. 2014, 39, 453–461. [Google Scholar] [CrossRef]
  20. Rohde, A.T.; Pilliod, D.S.; Novak, S.J. Insect communities in big sagebrush habitat are altered by wildfire and post-fire restoration seeding. Insect Conserv. Divers. 2019, 12, 216–230. [Google Scholar] [CrossRef]
  21. Wenninger, E.J.; Inouye, R.S. Insect community response to plant diversity and productivity in a sagebrush–steppe ecosystem. J. Arid. Environ. 2008, 72, 24–33. [Google Scholar] [CrossRef]
  22. Bradley, B.A.; Curtis, C.A.; Fusco, E.J.; Abatzoglou, J.T.; Balch, J.K.; Dadashi, S.; Tuanmu, M.N. Cheatgrass (Bromus tectorum) distribution in the intermountain Western United States and its relationship to fire frequency, seasonality, and ignitions. Biol. Invasions 2018, 20, 1493–1506. [Google Scholar] [CrossRef]
  23. U.S. Geological Survey, Earth Resources Observation and Science Center. U.S. Landsat Analysis Ready Data (ARD). Available online: https://dwtkns.com/srtm30m/ (accessed on 9 May 2022).
  24. LANDFIRE (LF), LF 2016 Remap, U.S. Department n of the Interior, Geological Survey, and U.S Department of Agriculture. Available online: https://www.landfire.gov/viewer/ (accessed on 8 January 2023).
  25. PRISM Climate Group, Oregon State University. (Data Created 20 September 2020). Available online: http://prism.oregonstate.edu (accessed on 9 May 2022).
  26. State Geographic Information Database. NHD Lakes (Data Layer), NHD Streams (Data Layer), NHD Springs (Point Layer). Utah Geospatial Resource Center. Available online: https://gis.utah.gov/data/water/lakes-river-dams/ (accessed on 7 January 2023).
  27. Soil Survey Staff, Natural Resources Conservation Service, United States Department of Agriculture. Web Soil Survey. Available online: https://websoilsurvey.sc.egov.usda.gov/ (accessed on 7 January 2023).
  28. Warren, D.L.; Glor, R.E.; Turelli, M. ENMTools: A toolbox for comparative studies of environmental niche models. Ecography 2010, 33, 607–611. [Google Scholar] [CrossRef]
  29. R Development Core Team. R: A Language and Environment for Statistical Computing; R Foundation for Statistical Computing: Vienna, Austria, 2023; Available online: https://www.R-pfoject.org/ (accessed on 23 July 2023).
  30. Phillips, S.J.; Dudik, M.; Schapire, R.E. Maxent Software for Modeling Species Niches and Distributions (Version 3.4.3). Available online: https://biodiversityinformatics.amnh.org/open_source/maxent/ (accessed on 6 April 2022).
  31. Warren, D.L.; Seifert, S.N. Ecological niche modeling in Maxent: The importance of model complexity and the performance of model selection criteria. Ecol. Appl. 2011, 21, 335–342. [Google Scholar] [CrossRef] [PubMed]
  32. Anderson, R.P.; Gonzalez, I., Jr. Species-specific tuning increases robustness to sampling bias in models of species distributions: An implementation with Maxent. Ecol. Model. 2011, 222, 2796–2811. [Google Scholar] [CrossRef]
  33. Muscarella, R.; Galante, P.J.; Soley-Guardia, M.; Boria, R.A.; Kass, J.M.; Uriarte, M.; Anderson, R.P. ENM eval: An R package for conducting spatially independent evaluations and estimating optimal model complexity for Maxent ecological niche models. Methods Ecol. Evol. 2014, 5, 1198–1205. [Google Scholar] [CrossRef]
  34. Warren, D.L.; Wright, A.N.; Seifert, S.N.; Shaffer, H.B. Incorporating model complexity and spatial sampling bias into ecological niche models of climate change risks faced by 90 California vertebrate species of concern. Divers. Distrib. 2014, 20, 334–343. [Google Scholar] [CrossRef]
  35. Merow, C.; Smith, M.J.; Silander, J.A., Jr. A practical guide to MaxEnt for modeling species’ distributions: What it does, and why inputs and settings matter. Ecography 2013, 36, 1058–1069. [Google Scholar] [CrossRef]
  36. Stolar, J.; Nielsen, S.E. Accounting for spatially biased sampling effort in presence-only species distribution modelling. Divers. Distrib. 2015, 21, 595–608. [Google Scholar] [CrossRef]
  37. Syfert, M.M.; Smith, M.J.; Coomes, D.A. The effects of sampling bias and model complexity on the predictive performance of MaxEnt species distribution models. PLoS ONE 2013, 8, e55158. [Google Scholar] [CrossRef]
  38. Phillips, S.J.; Dudík, M.; Elith, J.; Graham, C.H.; Lehmann, A.; Leathwick, J.; Ferrier, S. Sample selection bias and presence-only distribution models: Implications for background and pseudo-absence data. Ecol. Appl. 2009, 19, 181–197. [Google Scholar] [CrossRef] [PubMed]
  39. Pearce, J.; Ferrier, S. Evaluating the predictive performance of habitat models developed using logistic regression. Ecol. Model. 2000, 133, 225–245. [Google Scholar] [CrossRef]
  40. Liao, Y.; Lei, Y.; Ren, Z.; Chen, H.; Li, D. Predicting the potential risk area of illegal vaccine trade in China. Sci. Rep. 2017, 7, 3883. [Google Scholar] [CrossRef]
  41. Elith, J.; Phillips, S.J.; Hastie, T.; Dudík, M.; Chee, Y.E.; Yates, C.J. A statistical explanation of MaxEnt for ecologists. Divers. Distrib. 2011, 17, 43–57. [Google Scholar] [CrossRef]
  42. Bradley, B.A.; Fleishman, E. Relationships between expanding pinyon–juniper cover and topography in the central Great Basin, Nevada. J. Biogeogr. 2008, 35, 951–964. [Google Scholar] [CrossRef]
  43. Merrill, K.R.; Meyer, S.E.; Coleman, C.E. Population genetic analysis of Bromus tectorum (Poaceae) indicates recent range expansion may be facilitated by specialist genotypes. Am. J. Bot. 2012, 99, 529–537. [Google Scholar] [CrossRef] [PubMed]
  44. Balch, J.K.; Bradley, B.A.; D’Antonio, C.M.; Gómez-Dans, J. Introduced annual grass increases regional fire activity across the arid western USA (1980–2009). Glob. Chang. Biol. 2013, 19, 173–183. [Google Scholar] [CrossRef] [PubMed]
  45. Whisenant, S.G. Changing fire frequencies on Idaho’s Snake River Plains: Ecological and management implications. In Proceedings: Symposium on Cheatgrass Invasion, Shrub Die-Off, and Other Aspects of Shrub Biology and Management; General Technical Report INT-276; McArthur, E.D., Romney, E.M., Smith, S.D., Tueller, P.T., Eds.; USDA Forest Service Intermountain Research Station: Ogden, UT, USA, 1990; pp. 4–10. [Google Scholar]
  46. Meyer, S.E.; Leger, E.A. Inbreeding, genetic variation, and invasiveness: The strange case of Bromus tectorum. Rangelands 2010, 32, 6–11. [Google Scholar] [CrossRef]
  47. Paysen, T.E.; Ansley, R.J.; Brown, J.K.; Gottfried, G.J.; Haase, S.M.; Harrington, M.G.; Narog, M.G.; Sackett, S.S.; Wilson, R.C. Fire in western shrubland, woodland, and grassland ecosystems. Wildland Fire Ecosyst. Eff. Fire Flora 2000, 2, 121–159. [Google Scholar]
  48. Ardestani, E.G.; Tarkesh, M.; Bassiri, M.; Vahabi, M.R. Potential habitat modeling for reintroduction of three native plant species in central Iran. J. Arid. Land 2015, 7, 381–390. [Google Scholar] [CrossRef]
  49. Westerband, A.; Dovčiak, M.; La Quay-Velázquez, G.; Medeiros, J.S. Aspect reduces soil moisture and tree cover, but not nitrogen mineralization or grass cover, in semiarid pinyon-juniper woodlands of the Southwestern United States. Southwest. Nat. 2015, 60, 21–29. [Google Scholar] [CrossRef]
  50. Petersen, S.L.; Stringham, T.K. Infiltration, runoff, and sediment yield in response to western juniper encroachment in southeast Oregon. Rangel. Ecol. Manag. 2008, 61, 74–81. [Google Scholar] [CrossRef]
  51. Pinder, J.E.; Kroh, G.C.; White, J.D.; Basham May, A.M. The relationships between vegetation type and topography in Lassen Volcanic National Park. Plant Ecol. 1997, 131, 17–29. [Google Scholar] [CrossRef]
  52. Boŭcek, Z.; Halstead, J.A. Chalcididae. In Annotated Keys to the Genera of Nearctic Chalcidoidea (Hymenoptera); Gibson, G.A., Huber, J.T., Woolley, J.B., Eds.; NRC Research Press: Ottawa, ON, Canada, 1997; pp. 151–164. [Google Scholar]
  53. Wall, R.; Berberet, R.C. Parasitoids associated with lepidopterous pests on peanuts; Oklahoma fauna. Environ. Entomol. 1975, 4, 877–882. [Google Scholar] [CrossRef]
  54. Veldtman, R.; Daly, D.; Bekker, G.F.V.G. Spatio–environmental analysis of Vespula germanica nest records explains slow invasion in South Africa. Insects 2021, 12, 732. [Google Scholar] [CrossRef] [PubMed]
  55. Howse, M.W.; Haywood, J.; Lester, P.J. Bioclimatic modelling identifies suitable habitat for the establishment of the invasive European paper wasp (Hymenoptera: Vespidae) across the southern hemisphere. Insects 2020, 11, 784. [Google Scholar] [CrossRef] [PubMed]
Figure 1. Lateral habitus of (a) Psilochalcis minuta female and (b) Psilochalcis quadratis female. Photos from species descriptions [2].
Diversity 16 00348 g001
Figure 2. Malaise trap sampling locations and areas of suitable habitat for Psilochalcis minuta and Psilochalcis quadratis as predicted by Maxent species distribution models. Map created in ArcGIS Pro.
Diversity 16 00348 g002
Figure 3. Results of jackknife analyses of area under the receiver operating curve (AUC) for environmental variables used in predicting areas of suitable habitat for (a) Psilochalcis minuta and (b) Psilochalcis quadratis.
Diversity 16 00348 g003
Figure 4. Environmental variable responses for (a) aspect, (b) elevation, (c) slope, and (d) NDVI. Graphs created from value range counts from the estimated probability of occurrence in 10,000 data point grid. Note: Only one set of graphs is shown since the variable responses were nearly identical for both P. minuta and P. quadratis.
Diversity 16 00348 g004
Table 1. Environmental variables selected for construction of Psilochalcis species distribution models. Note: Data sources are EROS, Earth Resources Observation and Science Center; NRCS, National Resource Conservation Service; PRISM, parameter-elevation regressions on independent slopes model; SRTM, Shuttle Radar Topography Mission; UGRC, Utah Geospatial Resource Center; USGS, United States Geological Survey; WSS, Web Soil Survey.
VariableData Source
ElevationEROS, SRTM
AspectGenerated in ArcGIS
SlopeGenerated in ArcGIS
Historic fire disturbanceLANDFIRE
Existing vegetation typeLANDFIRE
PrecipitationPRISM Climate Group
TemperaturePRISM Climate Group
Distance to closest water sourceUGRC calculated in ArcGIS
NDVIUSGS/EROS
Soil compositionWSS/NRCS
Table 2. 2021–2022 Malaise trap sampling summary showing occurrence of Psilochalcis minuta and Psilochalcis quadratis. * Note: Two predicted sites were observed as being primarily composed of greasewood. Initial species distribution models predicted these sites as being potentially suitable for P. minuta (orange) and P. quadratis (blue), respectively.
Sampling Location Latitude LongitudePredicted HabitatObserved HabitatNumber of
P. minuta Retrieved
Number of
P. quadratis
Retrieved
40.21209, −111.97083Pinyon/juniperPinyon/juniper20
39.65849, −112.24926 Pinyon/juniperPinyon/juniper215
39.48876, −112.35678Pinyon/juniperPinyon/juniper100
40.25033, −112.18350Pinyon/juniperPinyon/juniper210
40.07829, −112.12203Pinyon/juniperPinyon/juniper50
39.66354, −112.10690Pinyon/juniperPinyon/juniper512
39.50412, −112.14085Pinyon/juniperPinyon/juniper1652
39.81450, −112.38919Pinyon/juniperPinyon/juniper90
39.66003, −112.59415Pinyon/juniper* Greasewood00
40.24126, −111.98340CheatgrassCheatgrass01
39.49077, −112.34794CheatgrassCheatgrass00
39.59726, −111.56220CheatgrassCheatgrass00
39.63317, −112.59161Cheatgrass* Greasewood02
40.26538, −112.14526No predictionPinyon/juniper213
40.04515, −112.01527No predictionPinyon/juniper
and sagebrush
71
39.67244, −112.06180No predictionMixed shrub and grasses00
39.58563, −112.15250No predictionGreasewood54
39.71542, −112.56461No predictionBarren01
Table 3. Maxent model performance and features for evaluating two Psilochalcis species in central Utah. Note: p-value is determined by the maximum test sensitivity plus specificity.
Modelp-ValueAUCStandard DeviationLinear/Quadratic
Product
CategoricalThresholdHinge
P. minuta0.020.7010.1191.0000.5301.9200.500
P. quadratis0.020.6800.0581.0000.5301.9200.500
Table 4. Environmental variable percentage contributions to species distribution models for Psilochalcis minuta and Psilochalcis quadratis. Bolded numbers indicate high, red moderate, and blue low percentage contribution to the model.
ModelAspectElevationSlopeSoilFireWaterVegetationNDVITemperaturePrecipitation
P. minuta40.813.45.310.114.30.34.17.04.50.3
P. quadratis40.312.66.88.814.30.24.97.94.00.2
Disclaimer/Publisher’s Note: The statements, opinions and data contained in all publications are solely those of the individual author(s) and contributor(s) and not of MDPI and/or the editor(s). MDPI and/or the editor(s) disclaim responsibility for any injury to people or property resulting from any ideas, methods, instructions or products referred to in the content.

