Abstract
Relationships of the three bryophyte lineages (liverworts, mosses, and hornworts) to vascular plants is a pivotal question in the study of the origin and evolution of land plants. In recent decades, this question has been subjected to intense phylogenetic analyses using morphological characters, multigene DNA sequences, and genome structural characters. A tentative consensus, reached ten years ago, suggested that bryophytes are a paraphyletic group, with liverworts being sister to all other land plants and hornworts being sister to vascular plants. However, several more recent nuclear phylogenomic studies have concluded that bryophytes represent a monophyletic group that is sister to vascular plants. A discussion is presented here on strengths and weaknesses of different types of characters (morphological traits, nucleotide sequences, and genome structural arrangements) and their suitability for resolving deep phylogenetic relationships. Moreover, several criteria for credible phylogenetic reconstruction are proposed. Strong statistical support for reconstructed relationships should be derived from high-quality, independent characters selected for suitability to the particular question being addressed. The relationships inferred in a study should be congruent with those from as many other lines of phylogenetic evidence as possible. Any incongruities should be explicable by well-understood biological mechanisms. It is concluded that the relationships of the three bryophyte lineages to vascular plants should currently be viewed as unresolved. This is a difficult phylogenetic problem; the land plants underwent a rapid radiation a long time ago. Yet, further exploration of analytical methods and careful choice of characters should lead to the eventual elucidation of diversification patterns among early land plants.
1. Theoretical Considerations in Deep Phylogenetic Analyses
While this review is focused on early land plant relationships, it is necessary to begin by pointing out that this case is but one example of a large set of similar, very difficult cases in phylogenetics. Scattered around throughout the tree of life are places where rapid radiations that occurred a long time ago are represented by only a few terminal lineages in the present. These extant lineages have been pruned by extinction, resulting in a situation where a number of long, naked phylogenetic branches trace back to very short connecting branches. These sorts of cases are referred to as “deep” phylogenetic inference, following a distinction made earlier [1]—the worst-case scenario for phylogeny reconstruction. Much of the relevant phylogenetic signal, i.e., characters that changed state on the short, deep connecting branches, which can thus serve as evidence of relationships, has been erased over time. In addition, false phylogenetic signal has been generated independently on the long branches, leading to the present homoplastic matches potentially resulting in “long branch attraction (LBA)” [2].
When approaching a problem of deep phylogenetic inference, it is important to think clearly about the task at hand and what tools are needed to address that task. It is abundantly clear that there are four main clades of extant land plants: liverworts, mosses, hornworts, and vascular plants. There is uncontroversial evidence for the monophyly of each of these clades taken separately, all with clear synapomorphies (Figure 1). There is also uncontroversial evidence for their monophyly taken together (as a major branch of the tree of life known as the land plants or embryophytes). However, the relationships among those four clades are maximally controversial. Seven of the fifteen possible resolutions among the four lineages have received statistically significant support in published analyses of morphological, single gene, multigene, genome structural, or genome-scale data (Figure 2, Table 1), with some data supporting only partially resolved relationships (Figure 3, Table 1). It is abundantly clear that remnants of an ancient radiation are being studied; whatever the shared lineages were among these four extant clades (if any), they existed for short periods of time, a very long time ago, and so much of the true signal has decayed. Another possibility is that there really was a rapid radiation of several lineages at the same time, so a polytomy might be the correct result. In any case, the potential for false signal prone to LBA is maximal in this type of situation.

Figure 1.
The four main lineages of land plants and their synapomorphies [3]: liverworts (elaters in sporangium, oil bodies in cells, and lunularic acid), mosses (multicellular rhizoids), hornworts (pseudo-elaters in sporangium and non-synchronous production of spores), and vascular plants (free-living, branched sporophyte with multiple sporangia and ornamentation on xylem cells). From bottom to top: Treubia lacunosa, Acrophyllum quadrifarium, Anthoceros agrestis, and Cyathea smithii (photos by Yin-Long Qiu).
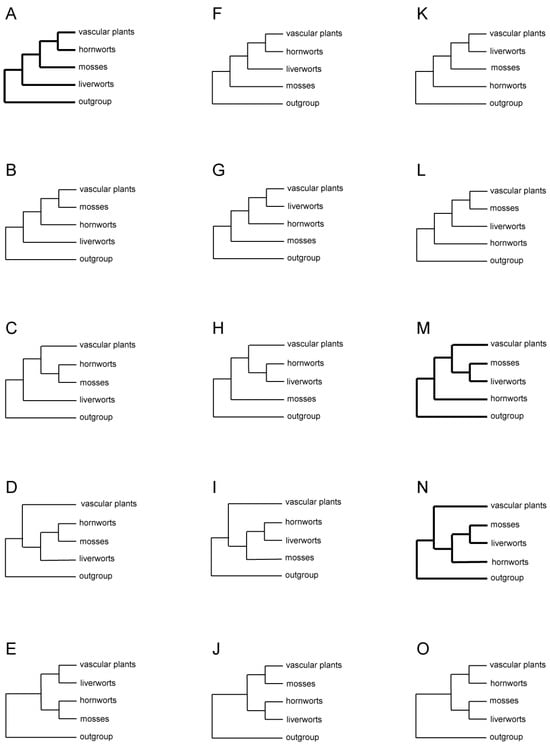
Figure 2.
All 15 possible arrangements of three bryophyte lineages, vascular plants, and the outgroup. Three topologies commonly seen in studies of morphological and molecular data are shown in thick lines.

Table 1.
Relationships of bryophyte lineages and vascular plants as inferred in phylogenetic studies reviewed in this article *.
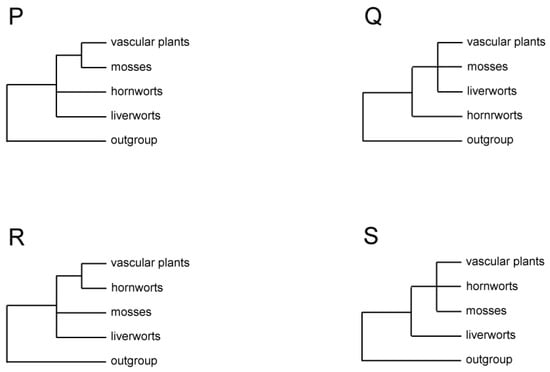
Figure 3.
Four partially resolved topologies of relationships among three bryophyte lineages, vascular plants, and the outgroup, as seen in studies of some morphological and molecular data.
In approaching this problem, it is thus necessary to pay careful attention to finding evidence that is likely to preserve traces of the actual branching pattern, keeping in mind that polytomies are possible as well. In addition, judicious taxon sampling, which is always a good idea when possible, does not work in these cases (for molecular data, at least), given the patterns of extinction that have generated these long, naked branches. Deep phylogenetic inferences are not going to be solved simply by adding more and more characters, which is the misguided trend in recent “phylogenomic” analyses. If one is not careful, adding more rapidly evolving genes to such an analysis is simply adding more LBA and potentially making one increasingly confident in the wrong relationships. Smaller, more carefully curated data sets are needed instead. As discussed earlier [1,38], clock-like markers are particularly undesirable in these deep analyses since they keep on ticking and remove the signal for the deep branches. Also undesirable are markers with a high rate of change relative to the short intervals of deep time we are interested in capturing, for example, most nuclear and some organellar genes. These markers not only tend to lose the true signal but, more importantly, gain false signal that leads to LBA. Instead, the way forward is selecting the right characters for the task at hand: those that have changed slowly and episodically (to preserve true phylogenetic signal unobscured by further changes), ideally with many character states (to lower the chance of parallel changes causing false signal). Note that we are advocating selecting data because of its match with the phylogenetic level being addressed, i.e., leaving out genes that are evolving too rapidly, not because it supports some preferred result (which would be terribly circular). There is evidence of how fast a character is evolving that can and should be assessed before a tree is built, e.g., a gene that is difficult to align and has multiple base pairs present in many sites.
2. Previous Studies on Early Land Plant Relationships
2.1. Morphological and Early Molecular Studies
Formal phylogenetic analyses of land plants focusing on relationships among the major lineages began with cladistic analyses of mostly morphological characters in the early 1980s [3,4]. The three bryophyte lineages were found to be paraphyletic to vascular plants, but how they were related to each other and to vascular plants differed in these seminal studies. In one study, liverworts were sister to all other land plants, and mosses were sister to hornworts plus vascular plants [4] (Figure 2A, Table 1). In the other study, liverworts were sister to the rest of land plants, with hornworts sister to mosses plus vascular plants [3] (Figure 2B). Two subsequent cladistic studies of morphological data sets reached the same or similar conclusion as the latter study [19,35] (Figure 2B and Figure 3P). One of them also included well-understood extinct taxa of early land plants, such as Horneophyton and Aglaophyton, which likely represented transitional lineages between bryophytes and vascular plants [35]. However, two analyses of spermatogenesis characters both uncovered a topology showing bryophyte monophyly with hornworts sister to a clade of liverworts and mosses but with bryophytes either nested in [39] or sister to vascular plants [21] (Figure 2N). Furthermore, when some of the spermatogenesis characters were combined with developmental and morphological characters in a parsimony analysis, bryophytes were found to be paraphyletic to vascular plants, with hornworts being sister to all other land plants and a clade or grade of liverworts–mosses sister to vascular plants [21] (Figure 2M).
As molecular systematics started to develop in the early 1990s, analyses of DNA sequences of mostly single genes from all three plant genomic compartments dominated the first wave of phylogenetic reconstruction of early land plants: nuclear 18S and 26S rDNAs [19,40], 18S [22,23,41], chloroplast rbcL [37,42,43], rDNA ITS [5], mitochondrial cox3 [44], and SSU rDNA [36]. While these genes were chosen for their putatively slow evolutionary rate—a feature critically important for reconstructing ancient phylogenetic branching events—taxon sampling schemes, including outgroup choices, varied widely due to the different goals of these studies (Table 1). Sometimes, molecular data were analyzed in combination with morphological characters [19,21]. As a result, a dazzling array of relationships among the four major lineages of land plants were obtained, mostly with low to moderate statistical support. Three general patterns emerged from these studies. First, bryophytes were paraphyletic to vascular plants in most analyses [5,19,21,22,23,36,37,40,44]. Second, hornworts were sister to either all other land plants in analyses of nuclear 18S rDNA [22,23] (Figure 2M, Table 1) and mitochondrial SSU rDNA [36] (Figure 3Q), or just vascular plants, as seen in analyses of chloroplast rbcL [37] (Figure 3R). Third, liverworts were sister to all other land plants in analyses of chloroplast rDNA ITS [5] (Figure 2A).
Because DNA sequences have only four (or five if missing information is counted) character states in evolution, they can suffer from a problem where homoplastic mutations cause LBA [2] when taxon sampling is sparse (which was the case for most single gene analyses in the 1990s) or sampled genes evolved too fast relative to the depth of reconstruction. To avoid this predicament, slow-changing structural characters, such as intron gains [45] or large DNA inversions [46] in organellar genomes, have been explored for their phylogenetic utility. A survey of group II introns in the mitochondrial genome of over 350 species of land plants found that three introns in cox2 and nad1 genes were present in all major lineages of land plants, except liverworts, and that they were also absent in the outgroup taxa green and red algae. These data were interpreted as evidence of independent gains of the three introns in the early stage of land plant evolution, supporting liverworts as the sister lineage to the rest of land plants as well as bryophytes being paraphyletic to vascular plants [47]. These conclusions were reinforced later by an expanded analysis of the absence/presence of 28 group II introns in 13 land plants and three related green alga mitochondrial genomes [6] (Figure 3S, Table 1). Moreover, three versions of a parsimony analysis of chloroplast genome structural characters, the first with 40 characters from 19 taxa, the second with 42 characters from 21 taxa, and the third with 47 characters from 28 taxa, all reached the same conclusions [7,17,48], with further evidence on hornworts being sister to vascular plants (Figure 2A, Table 1).
As automated sequencing became available in the late 1990s, and theoretical simulation and empirical exploration also showed that longer sequences were needed to reconstruct complex phylogenies [49,50], multiple genes began to be used for unraveling difficult phylogenetic patterns. In a study analyzing chloroplast rbcL and SSU rDNA from all three plant genomic compartments using both parsimony and maximum likelihood methods, bryophytes were found to be paraphyletic to vascular plants, with hornworts being sister to all other land plants and liverworts and mosses together forming a clade sister to vascular plants [24] (Figure 2M). This study took special care in dealing with site-to-site rate variation in sequence evolution as well as the third codon position saturation of the protein-coding rbcL. The reconstructed relationships received moderate to high statistical support in most of the analyses. However, the strength of the conclusions was weakened by sparse taxon sampling used in the study, especially in bryophytes, as only thirty taxa were used to cover the entire land plants and green algae, and merely seven bryophyte taxa were sampled (Table 1). Another multigene study, sampling chloroplast atpB, rbcL, SSU and LSU rDNAs, mitochondrial LSU rDNA, and nuclear 18S rDNA, made a significant improvement in taxon sampling by including 193 taxa of land plants and green algae, with 96 of them covering the full diversity of bryophytes [6] (Table 1). In both parsimony and maximum likelihood analyses, bryophytes were shown to be paraphyletic to vascular plants, with liverworts being sister to all other land plants and hornworts being sister to vascular plants (Figure 2A). As described above, analyses of the absence/presence of 28 group II introns in 13 land plants and green algae were also included in this study, which supported bryophyte paraphyly and liverworts being sister to all other land plants with relatively high bootstrap values [6]. In a third multigene study, which sampled 17 chloroplast genes and associated non-coding regions from 43 taxa of land plants and green algae, the same relationships among three bryophyte lineages and vascular plants as in the last study were reconstructed using both parsimony and maximum likelihood methods, all with high statistical support [8].
Finally, an analysis of five genes, chloroplast atpB and rbcL, mitochondrial atp1 and nad5, and nuclear 18S rDNA, was carried out using a comprehensive matrix with intensive and unbiased family-level sampling across land plants, including 633 land plant taxa plus 23 green alga species as outgroups [9] (Table 1). Each of the five genes was analyzed individually using a maximum likelihood method, as were concatenated matrices of the two genes from the chloroplast and mitochondrial genomes, respectively. These analyses aimed to ensure that all problematic sequences were removed and that effects of any gene- and genome-specific sequence evolutionary phenomena, such as RNA editing and base-composition bias, could be revealed. The five-gene matrix was then analyzed with the knowledge of single-gene data set limitations. In none of the single or multigene analyses did bryophytes form a monophyletic group. The final analysis of the concatenated five-gene matrix showed that bryophytes were paraphyletic to vascular plants, with strong support for liverworts as sister to all other land plants [9] (Figure 2A).
2.2. Large-Scale Phylogenomic Studies
Advancement of both sequencing technology and informatics in the early 2000s ushered in the era of phylogenomics. The chloroplast genome, thanks to its small size and conservative structural evolution, was the first explored among three plant cellular compartments for reconstructing land plant phylogeny. Bryophytes were shown to be paraphyletic to vascular plants by most studies that analyzed all or most of the genes in the chloroplast genome [6,7,10,11,12,20,33,34] (Table 1), with liverworts and mosses always placed near each other as either a clade or a grade, and hornworts being sister to vascular plants, depending on which portions of the data were analyzed with which methods (Figure 2A,F,M–O, and Figure 3R). Statistical support was generally high for the resolved relationships. However, two of these studies [10,20], plus two others [28,29], found topologies in which bryophytes formed a monophyletic group, being either sister to [10,20,28,29] or nested among vascular plants [20]. Perhaps due to the nature of phylogenomic analyses, all genes were included regardless of their significant rate differences and suitability (due to evolutionary rate) to this deep reconstruction problem (Table 1).
In phylogenomic analyses of mitochondrial genome sequences, bryophytes were also found to be paraphyletic to vascular plants, with either liverworts sister to the rest of land plants and hornworts being sister to vascular plants [14,15] (Figure 2A) or hornworts sister to the rest of land plants and liverworts and mosses together forming a clade sister to vascular plants [16] (Figure 2M). Most of these relationships received high support. Taxon sampling was sparse in two studies [14,16] but relatively extensive in the third one [15] (Table 1). Again, all genes were included with no concern as to their suitability for the questions at hand.
In all these organellar phylogenomic studies, various treatments of data were used in an attempt to moderate potential distorting effects of some evolutionary forces on reconstructing the underlying organismal phylogeny. The most common approaches were the removal of the third codon positions in nucleotide sequences and the use of amino acid sequences of protein-coding genes when nucleotide substitution saturation was suspected to cause erosion of phylogenetic signal [6,7,10,11,14,15,16,20,28,34]. A less common and more nuanced way of dealing with this saturation problem was the removal of fast-evolving codons or amino acid positions entirely after they were ranked by certain criteria [12,14]. Base compositional bias in nucleotide sequence evolution had also been considered [10,28], and a method of data transformation, LogDet [51,52], was used to correct the problem. Deletion of taxa that had excessively long branches was performed to try to alleviate the LBA problem [33]. Finally, different methods of phylogenetic reconstruction were used, ranging from the commonly used maximum likelihood and parsimony methods to less frequently used Bayesian and neighbor-joining analyses. Model-fitting was performed in two studies when model-based methods were used [16,20]. All these practices seemed to be sensible according to some presumably understood molecular evolutionary mechanisms. Nevertheless, whether they have led to successful reconstruction of the phylogenies from the given data is difficult to conclude (see below). Many of these practices clearly did not work because many different relationships were reconstructed when, at most, one of them could be correct.
Two of the chloroplast phylogenomic studies discussed above were performed in conjunction with analyses of a second matrix of different types of characters, i.e., genome structural characters such as intron gains and gene order changes from the same [7] or a different genomic compartment [6]. This kind of analysis was designed to overcome some potential problems associated with sequence characters, with their limited number of character states. In both studies, the results from analyses of the two types of data were congruent, showing bryophytes as a paraphyletic group to vascular plants, with liverworts being sister to all other land plants (Figure 2A and Figure 3S, Table 1).
The scale of phylogenomics and its impact on studies of relationships among major land plant lineages could really be felt with the increase of sequenced nuclear genomes and transcriptomes, as the number of genes that were analyzed increased exponentially in comparison to all other molecular systematic studies. In the first such study, a whopping 852 nuclear genes from 103 species of land plants and green algae were analyzed in 69 analyses with different permutations of data matrix and phylogenetic method, including supermatrix, supertree, and coalescent-based approaches, maximum likelihood and Bayesian methods, partitioned and unpartitioned analyses, and amino acid versus DNA alignments [25]. Among the various results obtained, two different topologies stood out. One, from a maximum likelihood analysis of concatenated alignments of the first and second codon positions of 674 genes from 103 species, showed hornworts being sister to all other land plants and liverworts and mosses together forming a clade sister to vascular plants (Figure 2M, Table 1). The other, in a coalescent-based tree from an ASTRAL analysis [53] of 424 gene trees obtained through analyzing the first and second codon position alignments, showed all three bryophyte lineages forming a monophyletic group sister to vascular plants, with hornworts sister to liverworts plus mosses (Figure 2N, Table 1). Both these two topologies had 100% bootstrap support for nearly all relevant relationships. The data from this study were re-analyzed later by two groups of authors using different methods. In one study [30], the bryophyte monophyly topology (Figure 2N) was recovered with strong support when gene trees of 852 single-copy orthologs were analyzed using the Bayesian supertree inference [54]. However, a different topology, in which a clade of liverworts and mosses was sister to the clade of hornworts and vascular plants (Figure 2O), was obtained when gene trees of 148 orthologs with the least heterogeneous base composition were analyzed with the same method, also with strong support. In the other study [26], while re-analyses of the data obtained similar results to the original study [25], a reduced matrix was made using some putatively stringent criteria to remove some genes and taxa so as to minimize effects of composition heterogeneity, substitution saturation, missing data, and %GC deviation. This matrix consisted of only 100 genes and 26 taxa. In both maximum likelihood and Bayesian analyses of the amino acid version of this reduced matrix, as well as a maximum likelihood analysis of the codon-degenerate re-coding nucleotide version of the matrix, bryophytes were found to form a monophyletic group sister to vascular plants (Figure 2N, Table 1). On the other hand, in a maximum likelihood analysis of the nucleotide version of the matrix, with all positions included and unaltered, bryophytes were found to be paraphyletic to vascular plants, with hornworts sister to all other land plants (Figure 2M, Table 1). Almost all of the relationships had perfect bootstrap or Bayesian probability support [26].
In a second major nuclear phylogenomic study from the 1000 Plant Transcriptome Project (1KP Project), even more impressive amounts of data were analyzed [27]. A tree was obtained from an ASTRAL analysis of 410 single-copy nuclear gene families from 1090 species of green plants plus 63 species of outgroup taxa, showing bryophytes together as a monophyletic group sister to vascular plants, with hornworts being sister to liverworts plus mosses [27] (Figure 2N, Table 1). Some of the data from this study were again re-analyzed by other authors. In one study [31], a matrix consisted of the concatenation of 151 orthologs conserved across 162 green plant genomes and transcriptomes was assembled from the 1KP Project data source. A maximum likelihood analysis of this matrix showed bryophytes as a monophyletic group sister to vascular plants, with hornworts being sister to liverworts plus mosses (Figure 2N, Table 1). These relationships all received 100% bootstrap support [31]. In the second study, 1440 genes from 120 streptophyte species were gathered from the 1KP Project, as well as other public data sources and the authors’ own sequencing project [32]. Maximum likelihood and Bayesian analyses of amino acid sequences recovered bryophyte monophyly with strong support, as did a coalescent species tree from an ASTRAL analysis [32] (Figure 2N, Table 1). A third study, using data from both the 1KP Project and other public sources, took two different and complementary approaches to investigate the rooting issue of land plant phylogeny [18]. One consisted of conventional supermatrix and supertree analyses of amino acid sequences of 160 single-copy gene families from 154 land plants and 23 alga species. When the tree was rooted using the algae as the outgroup, bryophytes were monophyletic and sister to vascular plants with high support across all analyses (Figure 2N, Table 1). The other approach was to infer root placement on a data set of 24 high-quality embryophyte genomes without the inclusion of an algal outgroup using two methods: ALE (amalgamated likelihood estimation) [55] and STRIDE (species tree root inference from gene duplication events) [56]. The former identified three possible roots (the first diverging lineage) of the land plant phylogeny: hornworts, mosses, and all bryophytes (Table 1). The latter assigned 0.2%, 39.9%, and 59.8% probability to hornworts, all bryophytes, and liverworts separately as the root in three possible scenarios (Table 1). Paradoxically, those authors concluded that bryophytes together represented the root of land plant phylogeny despite these variable results. Clearly, rooting of the land plant phylogeny remains one of the most difficult issues. LBA involving the long branch to the outgroup is just as problematic as LBA among the four lineages of interest in the ingroup.
Thus, despite rapidly increasing amounts of raw data, no conclusion seems to be in sight for the resolution of this recalcitrant problem. More raw data is not necessarily the answer; in fact, as indicated in the first section, adding more and more inappropriate data may make things worse. Several studies have also made efforts to fine-tune the data before phylogenetic analyses for chloroplast [10,11,20,28], mitochondrial [15,16], and nuclear phylogenomic matrices [25,26,30]. The dilemma is how a particular data treatment and its consequential effect on the result can be justified without reference to other information. One particular issue that has received much attention is base composition heterogeneity in DNA sequences. When two lineages share similar base compositions, it is impossible to know whether they are due to shared common ancestry or convergence. Hence, using models that only accept base composition homogeneity in analyses could prematurely discard phylogenetic signals in the case of common ancestry-derived similar base compositions. It is, thus, not surprising to see that when one phylogenomic data set is analyzed by sub-data sets and/or different methods, different and conflicting topologies are produced [6,10,12,13,15,16,20,25,26,30].
We are clearly not making progress towards a consensus about this important question over time. Thus, we need to step back and think more clearly about what sorts of data are needed to make progress. Not all raw nucleotide sequences should be regarded as useful data to use at this level, and other types of information, such as genome structural characters and morphology, should be explored and included in analyses as much as possible. In the following section, several types of characters are discussed that have been used in phylogenetic studies over the last several decades, and their strengths and weaknesses are evaluated.
3. Properties of Different Types of Characters for Reconstructing Deep Relationships of Land Plants
Following on from the discussion in the initial section of this paper, we will focus here on the strengths and weaknesses of different categories of characters for “deep” reconstruction problems, as distinguished from “shallow” reconstruction problems [1]. The former are characterized by long extant branches, which have been much pruned by extinction, connected in the deep past by short branches of primary phylogenetic interest; the latter are characterized by relatively recent, similar-length branches of primary phylogenetic interest, little pruned by extinction. These, of course, occupy the extremes of a spectrum, but our focus is on the extremes in these discussions, given that land plant relationships are clearly at the deep end of the spectrum. The types of characters suited to that extreme are quite different from those suited to the shallow end (e.g., an analysis of a plant radiation over the last few million years where most of the lineages are still around to be sampled).
3.1. Morphology
Morphological data can often be quite difficult to score objectively for use in shallow phylogenetic studies, given that differences between very closely related taxa can be hard to quantify. Thus, they have tended to fall out of favor in such studies as compared to DNA sequences and, at most, are mapped onto the tree built from molecular data. However, in deep phylogenetic studies, some morphological characters are objectively easy to score if they are highly conserved. For example, stomates are quite easy to compare among the major groups of land plants [57]. While we do not have good evolutionary models for such complex characters, and they are relatively few in number as compared to nucleotide characters, which could both be considered drawbacks, morphological characters have strengths that more than compensate.
Morphological characters have more states (e.g., there are many more ways to modify stomates than there are possible point mutations at a given site)—that alone reduces the possibility of LBA since the more possible states, the less likely for a homoplastic match to occur at random [58]. Homology can be easier to hypothesize in morphology, given its three-dimensional positional information plus ontogeny compared to the one-dimensional positional information present for use in DNA sequence alignments. Furthermore, morphological characters tend to show episodic evolution, i.e., major changes followed by periods of stasis. A clock-like marker is ideal for a shallow phylogenetic study, but the ideal character for a deep phylogenetic study is a broken clock, which quit ticking at some point in the past and retains its state until the present [38]. Finally, having morphological characters in the matrix can allow the addition of fossil taxa to the matrix if those characters are observable in them, which is a potential way to break up long branches and reduce LBA.
Some have objected to morphological characters because they are more likely to be subject to selection than DNA sequence data, but this is an unfair and illogical comparison—certainly, genes that are conserved enough to be useful in deep phylogenetic studies must be under tremendous selection pressure as well. Having functional ribosomes and a working RuBisCO enzyme is certainly more important to the fitness of a plant than a certain shape of stomata. Convergence at the molecular level just needs to be considered as seriously as with morphology. Conflicting topologies among different data sets is not only due to LBA, lineage sorting, or horizontal transfer (the three processes most often invoked), but it can just as well be due to selectively driven convergence (a process that is completely ignored by current analytical methods). Our ability to find the true history in the face of all these confounding processes depends on the inclusion of as many distinctly different data types as possible. Each type may have its issues, but at least if the issues with one data type are independent of the issues of other data types, there is hope of finding a common historical pattern shared by all. When morphology is left out, an important category of distinct data is left out.
3.2. Nucleotide Sequences
Nucleotide sequences represent the most abundant characters for phylogenetic reconstruction. They include coding and non-coding regions that make up the genome and are directly inherited (unlike phenotypic features). For protein-coding genes, their amino acid sequences are often used in analysis to minimize the effect of long-branch attraction caused by the limited number of character states in nucleotide sequences. Both DNA and protein sequences have the advantage of clearly defined states. The well-understood chemistry of the four nucleotides and 20 amino acids also allows relatively easy development of evolutionary models. In recent years, automated sequencing has made the acquisition of this colossal body of potential phylogenetic information within the reach of systematists.
The massive number of sequence characters, however, poses difficulties for sorting out phylogenetic signals from noise generated by LBA, convergence, lineage sorting, and reticulate evolution, as a genome has been shaped by many forces over evolutionary time. One manifestation of this complexity is evolutionary rate heterogeneity in different genes and at different positions in DNA and protein sequences [59,60], as well as across lineages of organisms [61]. Thus, although evolution at DNA and protein levels may seem to be easier to model than at other levels, it is no simple task to develop models to fit real data. Specifically, several factors may contribute to the data–model fit challenge. First, a vast majority of nuclear genes evolve much faster than chloroplast and mitochondrial genes used in earlier years of molecular systematics. This rate increase complicates an already difficult rate heterogeneity problem. Second, most phylogenomic data sets are much larger than multigene data sets in character number but not in taxon number, causing under-sampling of intermediate states for faster-evolving characters. Third, because most sequenced genomes are from model organisms or economically important species, taxon sampling in phylogenomic studies tends to skew densely toward certain groups yet sparsely in phylogenetically critically positioned taxa, resulting in a highly uneven representation of diversity in the study group. As a result, many minor insignificant but system-wide factors that generate only negligible random errors in single to multigene matrices can exert their cumulative influence to produce systematic errors, leading to statistically well-supported but incorrect results in phylogenomic studies [62].
Recent studies have shown that algorithms employing models that incorporate higher-level genome and proteome organizational information, such as protein secondary structures [63,64] and amino acid solvent accessibility [65], tend to outperform those that use simple models in dealing with systematic errors in phylogenomic data. One study of animal phylogeny found that by using a site-heterogeneous infinite mixture model CAT-GTR (which is able to adapt to the complexity actually present in the data) [64] and recoding conventional amino acid sequences into partitioned phylogenomic data by masking biochemically similar and/or highly exchangeable amino acids, analyses of two data sets that contain 89 genes from 62 taxa and 117 genes from 76 taxa both placed sponges as the sister lineage to all other animals, as most previous studies had shown [66]. The competing hypothesis advocated by two more simplistic phylogenomic studies, which placed comb jellies as the sister lineage of all other animals [67,68], turned out to be a result of LBA. In another study [69], which analyzed a chloroplast data set of 61 proteins from 24 land plants [70], both Amborella and Nymphaea were identified as members of a clade sister to all other angiosperms when three models that considered distinct structural and functional constraints of protein evolution were used (JTT+C20+F+gamma, JTT + PMSF2 + gamma, and CAT + GTR + gamma). In contrast, Amborella alone was found to occupy such a position when a conventional model (JTT + F + gamma) was used [69]. The former result is consistent with the consensus that has emerged from analyses of slow-evolving mitochondrial genes [71] and nuclear phylogenomic data with a coalescent model [72], whereas the latter likely represents an artifact generated by LBA. Both of these cases involve lineages stemming from ancient radiations and demonstrate that when analyzing large phylogenomic matrices to unravel phylogenetic patterns at highly compressed deep nodes, models incorporating higher-level structural features of protein sequences may offer better resolution than conventional DNA sequences.
Another manifestation of the complexity of the nuclear genome is that a vast majority of nuclear genes exist in families of varying sizes, which arose from repeated genome duplications throughout the history of eukaryotes [73]. These genes have duplicated copies that coalesce back in time at different points. Functional divergence and selective retention/loss of the copies after duplication [74] produce genes that fail to meet orthology and evolutionary rate constancy criteria of ideal phylogenetic markers. Nevertheless, theoreticians have developed coalescence conceptual frameworks that allow the process of gene duplication and species/lineage cladogenesis to be modeled and reconciled [75,76,77,78]. Consequently, gene copies that are not strictly orthologous may provide information for species tree reconstruction. As mentioned above, the use of a coalescent method in a phylogenomic analysis uncovered the presumably correct position of Amborella in the angiosperm phylogeny [72]. However, it has been found that a protocol of “statistical binning”, which seeks to overcome gene tree estimation error by concatenating loci of different coalescent histories into longer multi-locus supergenes, is operating under an assumption/model that is often violated, as >92% of supergenes comprise discordant loci [79]. In an ideal situation, the supergene tree set should be an accurate estimate of the true underlying gene tree distribution. In this regard, it is not certain whether the bryophyte monophyly topology obtained by two phylogenomic studies of land plant phylogeny in coalescent model-based analyses [25,30] was caused by this model violation. More theoretical clarification on data matrix parameters is needed before any firm conclusions can be drawn on conditions under which coalescent models can or cannot perform optimally to reconcile the discrepancy between gene trees and species trees. What should be added here is that organellar genes generally do not have this homology–orthology confounding problem, as they are all single-copy genes that date back to at least the eubacterial ancestors of both chloroplasts and mitochondria.
Model violation has been reported to be rather prevalent in phylogenetic studies [79,80]. This phenomenon may be caused by higher-level structural organization features of the genome/proteome than codons and exons/protein secondary structures, e.g., protein tertiary structures and interaction networks [81,82], or paralogy–orthology [83] mixing of many genes in the nuclear genome. Further challenges lie ahead to develop more realistic models that can handle large complex phylogenomic data sets as more taxa and genes become available for analysis.
In light of the crucial role played by models in analyses of large phylogenomic matrices, it may be helpful to examine how model choices were made in several land plant phylogenomic studies reviewed earlier, so as to understand why they almost all produced the bryophyte monophyly topology. Three studies used the CAT-GTR model, but because it was computationally costly [69,84], adjustments were made to cut taxon and/or character numbers [25,26,30]. This compromise between the model and data effectively reduced the matrix size considerably and might have undermined the merit of genome-wide extensive character sampling of phylogenomic studies. Further, no protein secondary structural constraints were introduced together with the model in their analyses. Four other studies used less sophisticated models, GTR+gamma for nucleotide data [27] and JTT, JTTF and JTTDCMUT [27], LG + C60 + G + F [18,31], and LG + C20 + F + R5 [32] for amino acid sequences, presumably because they represented computationally implementable choices. Only one study employed the CAT-GTR model in a Bayesian analysis of a large amino acid sequence matrix of 160 genes and 177 taxa, but again without adding protein secondary structural constraints to the model [18]. These model choices and implementation modifications raise a question about the accuracy of the phylogenetic relationships reconstructed in these studies.
As to how the orthology assumption was followed in these land plant phylogenomic studies, it is worth noting that the data analyzed by two original and several follow-up studies were largely from organ-specific transcriptomes [18,25,27,30,31,32]. It is questionable whether sequences of many so-called “single-copy” genes are truly orthologous across such a broad time span because, during colonization of the land and subsequent diversification into both terrestrial and aquatic niches, plants went through many rounds of whole genome duplication, followed by loss of some copies and retention of tissue-specific copies [74,85]. This gene sampling strategy again casts doubt on the validity of the conclusions reached from these studies.
From the above discussion, it appears that although phylogenomics has the potential to locate all historical information present in genomes, there is also a huge amount of confounding variation to be sorted out, especially for these deep reconstruction issues. It will be some time before its power can be fully realized to resolve many deep phylogenetic nodes, as the current models and computational resources still cannot match the complexity and ever-increasing sizes of phylogenomic data sets. Therefore, it is time to re-think the practice of uncritically constructing a mammoth-sized supermatrix and relying on supercomputers to deliver “correct” results. The time-tested strategy of constructing a smaller but better-curated data set by carefully and rigorously selecting orthologous characters/genes, as well as taxa that are suitable to the questions attempted, still should be a critical part of a good study design.
Several specific recommendations may be worth consideration. First, for all sequenced genomes, only those that represent diversity as evenly as possible spanning the study group need to be included. Extra taxon sampling should be concentrated on lineages that (based on previous work) are thought to branch relatively closely to the deep nodes of interest in a particular study; adding many lineages nested in recent clades will not particularly help.
Second, among all single-copy genes, hopefully, with only orthologous sequences that can be collected from sequenced genomes, different rate categories can be established even at the alignment stage. Slow-evolving genes can form a core data set, and fast-evolving genes should be either removed or at least analyzed separately so that they do not unnecessarily burden the analysis with LBA. Since chloroplast and mitochondrial genes are generally slow-evolving and have been used extensively in the early stage of plant molecular systematics, it is always advisable to include them, especially the very slow-evolving ones, in analyses (no matter how many nuclear genes are included) so that comparative analyses can be conducted to monitor the performance of the genes from three cellular genome compartments.
Third, it may be a good idea to divide the genes according to their functions, preferably after the rate categories are established, as this kind of data partition can help to identify function-specific selective forces that might have distorted phylogenetic signals. For example, in the study of early land plant phylogeny, it is possible that genes related to gametophyte development might have undergone convergent evolution due to the similar life cycle of the three bryophyte lineages and thus produced the bryophyte monophyly topology. Rate comparison of these genes and those that support the bryophyte–paraphyly topology might identify the cause of phylogenetic incongruence.
Fourth, different models should be applied to genes of different rate categories to identify the best data–model fit sets for analyses, even though some may perform better than others in some aspects, such as running time.
Recently, an investigation of the thorny rooting issue of the eukaryote phylogeny showed that when eight different models were applied in analyses of a matrix of 183 eukaryotic proteins of archaeal ancestry from 185 taxa, all analyses were all able to obtain the presumably correct result, placing four excavate taxa, Parabasalia, Fornicata, Preaxostyla, and Discoba, as serial sister lineages to other eukaryotes. Nevertheless, one analysis with a protein structure partition model, which recognized six categories of buried and exposed helices, sheets, and loops of secondary structures, took only a fraction of the run time used by analyses with seven other common models [84]. Obtaining the same result using different models also satisfies one of the gold criteria of scientific studies—reproducibility [86]; hence, increasing the likelihood that the result represents a reconstruction of a historical divergence event. On the other hand, if some models are found to fit certain matrices better than others, and when different results are produced, the rate and functional characteristics of the matrices should offer explanations on which topology represents the historical diversification pattern and which topologies are analytical artifacts. Explanation of homoplasy is one of the fundamental goals of systematics and deepens understanding of evolution. In this regard, it is worth noting that several land plant phylogenomic studies obtained multiple conflicting topologies of bryophyte relationships and could not provide clear evidence to support a firm conclusion because of lack of diagnostic information on the matrices as all data were amalgamated into one supermatrix [25,30,32].
3.3. Genome Structural Characters
Genome structural characters refer to non-point mutations in genomes, such as gene order or syntenic block changes, insertions/deletions in genes or on chromosomes, gene/genome duplication events, intron gains/losses, and cis- to trans-splicing changes of group I or II introns. In the early years of molecular systematics, thanks to their rarity, these mutations were used as special characters to resolve phylogenetic issues using the maximum parsimony principle [45,46,47,87]. As more genomes were sequenced, such characters became more abundant and thus could form a separate matrix for reconstructing the phylogeny of a group in parallel to sequence characters [6,7,14,34]. Mitochondrial and chloroplast genomes, being fundamentally prokaryotic in nature with extremely low levels of recombination in most eukaryotes, have been the major sources of such characters for both plants [6,14,34,48] and animals [87,88]. The nuclear genome, being much larger and also having more rearrangements of gene order than its organellar counterparts, has not yet been broadly amenable to such type of analysis. However, recent developments in bioinformatics have revealed a large number of microsyntenic characters (i.e., local regions with conserved gene content and order) in angiosperms through genome-wide screening of gene order at a fine scale [89]. Further, inference of the ancestral timing of genome duplication by examining distribution patterns of duplicated genes among sequenced nuclear genomes has made it possible to determine relationships among early land plant lineages without having to use an outgroup [18]. Finally, the Archaea sister group of Eukaryota has also been resolved using the shared presence of several eukaryote signature protein genes (actin and tubulin, archaeal cell division proteins related to the eukaryotic Endosomal Sorting Complexes Required for Transport (ESCRT)-III complex, and several information-processing proteins involved in transcription and translation) [90]. Hence, the nuclear genome is likely to become a rich source of such structural characters for resolving difficult deep issues in the tree of life as more species are fully sequenced.
One major strength of genome structural characters is their conservative nature of evolution, which would tend to result in low levels of homoplasy in the sort of deep analyses being discussed in this review. This merit is partly derived from a pre-screening process during the matrix assembly, where fast-evolving changes in genomes are either excluded or simply unrecognized when their frequency and extent of changes are high and substantial.
A second strength of these characters is their complexity—there are diverse mechanisms for genome structural changes from recombination to intron-splicing—yet having a simple mode of transformation, having merely two states—presence or absence. Some complex changes in genome structure can be broken into multiple characters, with coding made simpler. Thus, the clarity in character and character state definition inherently leads to low homoplasy levels in the matrices of these types of characters, as long as their rate of change is slow. They are also less prone to being affected by LBA in comparison to nucleotide and amino acid sequences, which often suffer from this problem due to compositional bias in ancient lineages involved in water–land environment transition [10,14,16,20,28].
Third, genome structural characters are usually independent of each other, represent a different kind of genetic variation than point mutations, and are sampled across the entire genome, presumably randomly. Thus, they satisfy the independence criterion of ideal phylogenetic characters [91,92] better than sequence characters from a gene or a gene network. Taken together, these features of genome structural characters make them a class of unique and distinct characters that can contribute to reconstructing organismal phylogenies together with DNA sequences and morphological characters.
The major weakness of genome structural characters, that they are few in numbers, comes from one of their strengths, their rarity. Many characters of this category go undetected until variants from newly sequenced genes or genomes are exposed and their phylogenetic informativeness is manifested. A certain amount of prior knowledge of gene and genome evolution is required before the matrix assembly. To exploit the large numbers of cryptic microsyntenic characters in the nuclear genome, as shown in the recent study of angiosperm phylogeny [89], sophisticated niche bioinformatic tools are a prerequisite. Hence, genome structural characters, despite having a unique role to play in phylogenetic reconstruction, currently remain a secondary source of information to the massive number of sequence characters, but hopefully, their use will increase in importance in the future.
In the study of phylogeny of early land plants, genome structural characters have played a distinctive and prominent role in resolving some highly contentious issues. As reviewed earlier, such characters from both mitochondrial and chloroplast genomes were discovered, and when analyzed, supported the paraphyly of bryophytes, with liverworts being sister to all other land plants (Figure 2A and Figure 3S) [6,7,17,47,48]. Most recently, two analyses of a data set of 24 high-quality embryophyte nuclear genomes were conducted to infer root placement on the land plant phylogeny without including an algal outgroup, one using the method ALE (amalgamated likelihood estimation) [55] and the other with STRIDE (species tree root inference from gene duplication events) [56]. The former identified three possible roots of the land plant phylogeny: hornworts (Figure 2M), mosses (Figure 2F), and all bryophytes (Figure 2N), and the latter assigned 0.2%, 39.9%, and 59.8% probability to hornworts (Figure 2M), all bryophytes (Figure 2N), and liverworts (Figure 2A) separately as the root [18]. Despite some ambiguity, it seemed that there was a signal in these nuclear gene duplication events that could shed light on the relationships of early land plants. Moreover, the microsyntenic characters amassed in the nuclear genome of angiosperms recently [89] should be able to be extended to all streptophytes, as all key lineages of green algae and land plants have had representative genomes sequenced. Ultimately, genome structural characters, given their unique characteristics, should be able to provide a distinct perspective, complementary to that of sequence characters and morphology, on diversification patterns of early land plants, as the five long branches separating green algae, each of the three bryophyte lineages, and vascular plants will continue to haunt phylogenetic algorithms for analyzing sequence data [93].
3.4. Fossil Evidence
Extant plants have been the main subject of phylogenetic analyses to understand relationships among bryophytes and vascular plants, partly because only morphological traits are available for such ancient fossils. Fossil plants, however, represent a unique and distinct source of information that has shed considerable light on the questions of origin and early evolution of land plants, as they contain both structural and temporal information. As discussed above, if extinct taxa have enough characters available, they can and should be included in morphological analyses together with extant taxa. Indeed, one early major cladistic study was conducted this way, including several fossil taxa, placing the well-known early Devonian plants Horneophyton lignieri and Aglaophyton major between mosses and vascular plants, with bryophytes being paraphyletic [35].
The major problem, however, is that almost no plant structures other than spores have been discovered in the Ordovician and Cambrian, periods when the oldest fossils of land plants are known [94,95,96]. To date, only one study has reported sporangia with in situ spores of putative liverwort affinity from the Late Ordovician (Caradoc) rocks of Oman [97]. Mega-fossils belonging to plants on the stem lineages of vascular plants are relatively common in the Silurian [35,98], and those for crown group members of liverworts have also been found in the Devonian [99,100,101], but those are too late for the phylogenetic resolution of the bryophyte lineages and vascular plants. If more information can be extracted from morphology and development of the spores (especially the tetrahedral tetrad type) that are found in the Cambrian, Ordovician, and Silurian, which have been suggested being produced by plants related to proto-embryophytes, bryophytes, and vascular plants [96,97,102,103,104,105,106,107], explicit inclusion of extinct taxa in phylogenetic analyses with extant plants would be possible. These new analyses would likely play a critical role in resolving the controversial relationships among bryophyte lineages and vascular plants.
4. Criteria for Successful Phylogenetic Reconstruction
From the trees of life reconstructed by naturalists in the 19th century, such as those by Ernest Haeckel [108], relationships among organisms have been among the primary targets of intellectual pursuits in biological sciences [109]. The cladistic conceptual revolution [110] and the development of molecular systematics over the last several decades greatly accelerated the pace of such reconstruction. At the beginning of molecular phylogenetics, what constituted the proper kind and number of markers to retrace an accurate organismal evolutionary history was vigorously debated [91,111,112]. As the quantity and quality of analyzed information increased, it became evident that congruence among trees inferred from different types of data using various methods serves as the best criterion for successful phylogenetic reconstruction [92,113,114].
Paradoxically, recent phylogenomic studies have largely ignored this congruence criterion; they seem to rely on internal statistical support such as bootstrap values and Bayesian posterior probabilities as the sole indicator of phylogenetic analysis quality. It should be stressed that these statistical values merely measure the precision of an analysis, which gauges the fit between a hypothesis and the analyzed data [115]. In reality, it is accuracy that is desired in a study, which reflects the relationship between a hypothesis and the underlying universe [115]. Several factors may affect phylogenetic inference, including processes causing confounding signals (codon usage bias, horizontal gene transfer, incomplete lineage sorting, and convergence) and data selection issues causing homoplasy that can lead to LBA (insufficient or biased data sampling and inappropriately high evolutionary rates of the markers included). In phylogenomic studies, these factors or processes can lead to statistically well-supported but inaccurate results due to the amplification of the above problems in data sets of massive sizes [62].
To provide a thorough and objective assessment of the quality of a phylogenetic study, several criteria are proposed here. It is important to examine the characters influencing strong statistical support for a particular relationship, bringing transparency to an otherwise rather opaque process that generated the number. Firstly, they should have low evolutionary rates/homoplasy levels, be free of compositional and codon usage bias, and have no heavy RNA editing in the case of organellar genes. If some of these mechanisms appear to be involved in generating the results, they should be reported so that the “synapomorphies” can be refuted or reaffirmed when the hypothetic relationship is evaluated against other evidence. This process is what Willi Hennig called reciprocal illumination in phylogenetic analysis [110].
Secondly, the characters should be from diverse sources, i.e., the sites are from genes encoding different functions. Character independence is one of the prime standards for good phylogenetic markers [91,92]. If informative sites are distributed in many different types of genes, they satisfy the character independence criterion better than otherwise. In addition, the results of an analysis based on sequences from the nucleus should be compared with those from two other compartments, i.e., chloroplast and mitochondrion. Furthermore, the results from a sequence analysis should always be checked against those from genomic structural characters (which may come from one, two, or all three cellular genomic compartments) and those inferred from morphology.
Thirdly, it is crucial in nuclear phylogenomic studies that all sequences of a gene are orthologous to one another. Given the common occurrence of duplications in the nuclear genome, many “single-copy” genes have actually experienced duplications, with only one copy retained due to functional divergence and differential extinction [74], and sampled sequences may not be strictly orthologous to each other in representing the species where they are from.
Lastly, when maximum likelihood and Bayesian analysis methods are used, models used must be carefully chosen in an attempt to minimize suspected problems. However, because of the colossal sizes of most phylogenomic data sets, shortcuts are often implemented through different parameter choices, which may compromise the performance of the software, especially on challenging parts of a tree. Thus, it is crucial that cross-examination of the results using both internal and external information be conducted after analysis to ensure that no serious methodological errors were introduced.
To summarize, the primary goal of a phylogenetic study is to seek the reconstruction of congruent relationships among taxa from as many data types as possible, and equally important is the task of explaining any incongruities through well-understood biological mechanisms. Through this dual-goal pursuit, a comprehensive understanding of the evolution of biological patterns and processes can be reached. While this goal may not be immediately achievable in some situations, it is crucial to recognize that an insufficiently tested phylogenetic hypothesis should never be regarded as the actual historical relationships among investigated taxa. The phylogeny represents the central organizing scheme of all biological information [109], and only through rigorous falsification and corroboration tests can a set of hypothetic relationships attain the status of serving as the most efficient guide to further study the genome, phenome, and their interactions with the environment.
Author Contributions
Y.-L.Q. and B.D.M. wrote and revised the paper together. All authors have read and agreed to the published version of the manuscript.
Funding
This research received no external funding.
Data Availability Statement
The original contributions presented in the study are included in the article, further inquiries can be directed to the corresponding author.
Acknowledgments
Yin-Long Qiu would like to thank John Braggins and Edi Urmi for their help with field guidance and plant identification in New Zealand and Switzerland, where the plant photos in Figure 1 were taken.
Conflicts of Interest
The authors declare no conflict of interest.
References
- Mishler, B.D. Deep phylogenetic relationships among “plants“ and their implications for classification. Taxon 2000, 49, 661–683. [Google Scholar] [CrossRef]
- Felsenstein, J. Cases in which parsimony or compatibility methods will be positively misleading. Syst. Zool. 1978, 27, 401–410. [Google Scholar] [CrossRef]
- Mishler, B.D.; Churchill, S.P. A cladistic approach to the phylogeny of the bryophytes. Brittonia 1984, 36, 406–424. [Google Scholar] [CrossRef]
- Parenti, L.R. A phylogenetic analysis of the land plants. Biol. J. Linn. Soc. 1980, 13, 225–242. [Google Scholar] [CrossRef]
- Samigullin, T.K.; Yacentyuk, S.P.; Degtyaryeva, G.V.; Valiehoroman, K.M.; Bobrova, V.K.; Capesius, I.; Martin, W.M.; Troitsky, A.V.; Filin, V.R.; Antonov, A.S. Paraphyly of bryophytes and close relationship of hornworts and vascular plants inferred from analysis of chloroplast rDNA ITS (cpITS) sequences. Arctoa 2002, 11, 31–43. [Google Scholar] [CrossRef]
- Qiu, Y.-L.; Li, L.B.; Wang, B.; Chen, Z.D.; Knoop, V.; Groth-Malonek, M.; Dombrovska, O.; Lee, J.; Kent, L.; Rest, J.; et al. The deepest divergences in land plants inferred from phylogenomic evidence. Proc. Natl. Acad. Sci. USA 2006, 103, 15511–15516. [Google Scholar] [CrossRef]
- Wolf, P.G.; Karol, K.G.; Mandoli, D.F.; Kuehl, J.; Arumuganathan, K.; Ellis, M.W.; Mishler, B.D.; Kelch, D.G.; Olmstead, R.G.; Boore, J.L. The first complete chloroplast genome sequence of a lycophyte, Huperzia lucidula (Lycopodiaceae). Gene 2005, 350, 117–128. [Google Scholar] [CrossRef]
- Chang, Y.; Graham, S.W. Inferring the higher-order phylogeny of mosses (Bryophyta) and relatives using a large, multigene plastid data set. Am. J. Bot. 2011, 98, 839–849. [Google Scholar] [CrossRef]
- Qiu, Y.-L.; Taylor, A.B.; Fine, I.M. A molecular temporal evolutionary framework of land plants and the age of angiosperms. Ann. Mo. Bot. Gard. 2025, in press. [Google Scholar]
- Nishiyama, T.; Wolf, P.G.; Kugita, M.; Sinclair, R.B.; Sugita, M.; Sugiura, C.; Wakasugi, T.; Yamada, K.; Yoshinaga, K.; Yamaguchi, K.; et al. Chloroplast phylogeny indicates that bryophytes are monophyletic. Mol. Biol. Evol. 2004, 21, 1813–1819. [Google Scholar] [CrossRef]
- Ruhfel, B.R.; Gitzendanner, M.A.; Soltis, P.S.; Soltis, D.E.; Burleigh, J.G. From algae to angiosperms–inferring the phylogeny of green plants (Viridiplantae) from 360 plastid genomes. BMC Evol. Biol. 2014, 14, 23. [Google Scholar] [CrossRef] [PubMed]
- Zhong, B.; Xi, Z.; Goremykin, V.V.; Fong, R.; Mclenachan, P.A.; Novis, P.M.; Davis, C.C.; Penny, D. Streptophyte algae and the origin of land plants revisited using heterogeneous models with three new algal chloroplast genomes. Mol. Biol. Evol. 2014, 31, 177–183. [Google Scholar] [CrossRef] [PubMed]
- Yang, T.; Sahu, S.K.; Yang, L.; Liu, Y.; Mu, W.; Liu, X.; Strube, M.L.; Liu, H.; Zhong, B. Comparative analyses of 3,654 plastid genomes unravel insights into evolutionary dynamics and phylogenetic discordance of green plants. Front. Plant Sci. 2022, 13, 808156. [Google Scholar] [CrossRef] [PubMed]
- Turmel, M.; Otis, C.; Lemieux, C. Tracing the evolution of streptophyte algae and their mitochondrial genome. Genome Biol. Evol. 2013, 5, 1817–1835. [Google Scholar] [CrossRef] [PubMed]
- Liu, Y.; Cox, C.J.; Wang, W.; Goffinet, B. Mitochondrial phylogenomics of early land plants: Mitigating the effects of saturation, compositional heterogeneity, and codon-usage bias. Syst. Biol. 2014, 63, 862–878. [Google Scholar] [CrossRef] [PubMed]
- Sousa, F.; Civan, P.; Brazao, J.; Foster, P.G.; Cox, C.J. The mitochondrial phylogeny of land plants shows support for Setaphyta under composition-heterogeneous substitution models. PeerJ 2020, 8, e8995. [Google Scholar] [CrossRef] [PubMed]
- Mishler, B.D.; Kelch, D.G. Phylogenomics and early land plant evolution. In Bryophyte Biology, 2nd ed.; Goffinet, B., Shaw, A.J., Eds.; Cambridge University Press: Cambridge, MA, USA, 2009; pp. 173–197. [Google Scholar]
- Harris, B.J.; Clark, J.W.; Schrempf, D.; Szollosi, G.J.; Donoghue, P.C.J.; Hetherington, A.M.; Williams, T.A. Divergent evolutionary trajectories of bryophytes and tracheophytes from a complex common ancestor of land plants. Nat. Ecol. Evol. 2022, 6, 1634–1643. [Google Scholar] [CrossRef]
- Mishler, B.D.; Lewis, L.A.; Buchheim, M.A.; Renzaglia, K.S.; Garbary, D.J.; Delwiche, C.F.; Zechman, F.W.; Kantz, T.S.; Chapman, R.L. Phylogenetic relationships of the “green-algae“ and “bryophytes“. Ann. Mo. Bot. Gard. 1994, 81, 451–483. [Google Scholar] [CrossRef]
- Sousa, F.; Civan, P.; Foster, P.G.; Cox, C.J. The chloroplast land plant phylogeny: Analyses employing better-fitting tree- and site-heterogeneous composition models. Front. Plant Sci. 2020, 11, 1062. [Google Scholar] [CrossRef] [PubMed]
- Renzaglia, K.S.; Duff, R.J.; Nickrent, D.L.; Garbary, D.J. Vegetative and reproductive innovations of early land plants: Implications for a unified phylogeny. Philos. Trans. R. Soc. Lond. Ser. B 2000, 355, 769–793. [Google Scholar] [CrossRef]
- Hedderson, T.A.; Chapman, R.L.; Rootes, W.L. Phylogenetic relationships of bryophytes inferred from nuclear-encoded rRNA gene sequences. Plant Syst. Evol. 1996, 200, 213–224. [Google Scholar] [CrossRef]
- Hedderson, T.A.; Chapman, R.; Cox, C.J. Bryophytes and the origins and diversification of land plants: New evidence from molecules. In Bryology for the Twenty-First Century; Bates, J.W., Ashton, N.W., Duckett, J.G., Eds.; W.S. Maney & Son Ltd.: Leeds, UK, 1998; pp. 65–77. [Google Scholar]
- Nickrent, D.L.; Parkinson, C.L.; Palmer, J.D.; Duff, R.J. Multigene phylogeny of land plants with special reference to bryophytes and the earliest land plants. Mol. Biol. Evol. 2000, 17, 1885–1895. [Google Scholar] [CrossRef]
- Wickett, N.J.; Mirarab, S.; Nguyen, N.; Warnow, T.; Carpenter, E.; Matasci, N.; Ayyampalayam, S.; Barker, M.S.; Burleigh, J.G.; Gitzendanner, M.A.; et al. Phylotranscriptomic analysis of the origin and early diversification of land plants. Proc. Natl. Acad. Sci. USA 2014, 111, E4859–E4868. [Google Scholar] [CrossRef]
- Sousa, F.d.; Foster, P.G.; Donoghue, P.C.J.; Schneider, H.; Cox, C.J. Nuclear protein phylogenies support the monophyly of the three bryophyte groups (Bryophyta Schimp.). New Phytol. 2019, 222, 565–575. [Google Scholar] [CrossRef]
- One Thousand Plant Transcriptomes Initiative. One thousand plant transcriptomes and the phylogenomics of green plants. Nature 2019, 574, 679–685. [Google Scholar] [CrossRef]
- Goremykin, V.V.; Hellwig, F.H. Evidence for the most basal split in land plants dividing bryophyte and tracheophyte lineages. Plant Syst. Evol. 2005, 254, 93–103. [Google Scholar] [CrossRef]
- Gitzendanner, M.A.; Soltis, P.S.; Wong, G.K.-S.; Ruhfel, B.R.; Soltis, D.E. Plastid phylogenomic analysis of green plants: A billion years of evolutionary history. Am. J. Bot. 2018, 105, 291–301. [Google Scholar] [CrossRef]
- Puttick, M.N.; Morris, J.L.; Williams, T.A.; Cox, C.J.; Edwards, D.; Kenrick, P.; Pressel, S.; Wellman, C.H.; Schneider, H.; Pisani, D.; et al. The Interrelationships of land plants and the nature of the ancestral embryophyte. Curr. Biol. 2018, 28, 733–745. [Google Scholar] [CrossRef]
- Harris, B.J.; Harrison, C.J.; Hetherington, A.M.; Williams, T.A. Phylogenomic evidence for the monophyly of bryophytes and the reductive evolution of stomata. Curr. Biol. 2020, 30, 2001–2012. [Google Scholar] [CrossRef]
- Su, D.; Yang, L.; Shi, X.; Ma, X.; Zhou, X.; Hedges, S.B.; Zhong, B. Large-scale phylogenomic analyses reveal the monophyly of bryophytes and Neoproterozoic origin of land plants. Mol. Biol. Evol. 2021, 38, 3332–3344. [Google Scholar] [CrossRef]
- Karol, K.G.; Arumuganathan, K.; Boore, J.L.; Duffy, A.M.; Everett, K.D.E.; Hall, J.D.; Hansen, S.K.; Kuehl, J.V.; Mandoli, D.F.; Mishler, B.D.; et al. Complete plastome sequences of Equisetum arvense and Isoetes flaccida: Implications for phylogeny and plastid genome evolution of early land plant lineages. BMC Evol. Biol. 2010, 10, 321. [Google Scholar] [CrossRef]
- Lemieux, C.; Otis, C.; Turmel, M. Comparative chloroplast genome analyses of streptophyte green algae uncover major structural alterations in the Klebsormidiophyceae, Coleochaetophyceae and Zygnematophyceae. Front. Plant Sci. 2016, 7, 679. [Google Scholar] [CrossRef]
- Kenrick, P.; Crane, P.R. The Origin and Early Diversification of Land Plants: A Cladistic Study; Smithsonian Institution Press: Washington, DC, USA, 1997; p. 441. [Google Scholar]
- Duff, R.J.; Nickrent, D.L. Phylogenetic relationships of land plants using mitochondrial small-subunit rDNA sequences. Am. J. Bot. 1999, 86, 372–386. [Google Scholar] [CrossRef]
- Lewis, L.A.; Mishler, B.D.; Vilgalys, R. Phylogenetic relationships of the liverworts (Hepaticae), a basal embryophyte lineage, inferred from nucleotide sequence data of the chloroplast gene rbcL. Mol. Phylogen. Evol. 1997, 7, 377–393. [Google Scholar] [CrossRef]
- Mishler, B.D. The logic of the data matrix in phylogenetic analysis. In Parsimony, Phylogeny, and Genomics; Albert, V.A., Ed.; Oxford University Press: Oxford, UK, 2005; pp. 57–70. [Google Scholar]
- Garbary, D.J.; Renzaglia, K.S.; Duckett, J.G. The phylogeny of land plants—A cladistic analysis based on male gametogenesis. Plant Syst. Evol. 1993, 188, 237–269. [Google Scholar] [CrossRef]
- Chapman, R.L.; Buchheim, M.A. Green algae and the evolution of land plants: Inferences from nuclear-encoded rRNA gene sequences. Biosystems 1992, 28, 127–137. [Google Scholar] [CrossRef]
- Soltis, P.S.; Soltis, D.E.; Wolf, P.G.; Nickrent, D.L.; Chaw, S.; Chapman, R.L. The phylogeny of land plants inferred from 18S rDNA sequences: Pushing the limits of rDNA signal? Mol. Biol. Evol. 1999, 16, 1774–1784. [Google Scholar] [CrossRef]
- Manhart, J.R. Phylogenetic analysis of green plant rbcL sequences. Mol. Phylogen. Evol. 1994, 3, 114–127. [Google Scholar] [CrossRef]
- Kallersjo, M.; Farris, J.S.; Chase, M.W.; Bremer, B.; Fay, M.F.; Humphries, C.J.; Petersen, G.; Seberg, O.; Bremer, K. Simultaneous parsimony jackknife analysis of 2538 rbcL DNA sequences reveals support for major clades of green plants, land plants, seed plants and flowering plants. Plant Syst. Evol. 1998, 213, 259–287. [Google Scholar] [CrossRef]
- Malek, O.; Lattig, K.; Hiesel, R.; Brennicke, A.; Knoop, V. RNA editing in bryophytes and a molecular phylogeny of land plants. EMBO J. 1996, 15, 1403–1411. [Google Scholar] [CrossRef]
- Manhart, J.R.; Palmer, J.D. The gain of two chloroplast transfer-RNA introns marks the green algal ancestors of land plants. Nature 1990, 345, 268–270. [Google Scholar] [CrossRef]
- Raubeson, L.A.; Jansen, R.K. Chloroplast DNA evidence on the ancient evolutionary split in vascular land plants. Science 1992, 255, 1697–1699. [Google Scholar] [CrossRef]
- Qiu, Y.-L.; Cho, Y.R.; Cox, J.C.; Palmer, J.D. The gain of three mitochondrial introns identifies liverworts as the earliest land plants. Nature 1998, 394, 671–674. [Google Scholar] [CrossRef]
- Kelch, D.G.; Driskell, A.; Mishler, B.D. Inferring phylogeny using genomic characters: A case study using land plant plastomes. In Molecular Systematics of Bryophytes; Goffinet, B., Hollowell, V., Magill, R., Eds.; Missouri Botanical Garden Press: St. Louis, MO, USA, 2004; pp. 3–11. [Google Scholar]
- Soltis, D.E.; Soltis, P.S.; Mort, M.E.; Chase, M.W.; Savolainen, V.; Hoot, S.B.; Morton, C.M. Inferring complex phylogenies using parsimony: An empirical approach using three large DNA data sets for angiosperms. Syst. Biol. 1998, 47, 32–42. [Google Scholar] [CrossRef]
- Hillis, D.M. Inferring complex phylogenies. Nature 1996, 383, 130–131. [Google Scholar] [CrossRef]
- Lake, J.A. Reconstructing evolutionary trees from DNA and protein sequences: Paralinear distances. Proc. Natl. Acad. Sci. USA 1994, 91, 1455–1459. [Google Scholar] [CrossRef]
- Lockhart, P.J.; Steel, M.A.; Hendy, M.D.; Penny, D. Recovering evolutionary trees under a more realistic model of sequence evolution. Mol. Biol. Evol. 1994, 11, 605–612. [Google Scholar]
- Mirarab, S.; Reaz, R.; Bayzid, M.S.; Zimmermann, T.; Swenson, M.S.; Warnow, T. ASTRAL: Genome-scale coalescent-based species tree estimation. Bioinformatics 2014, 30, i541–i548. [Google Scholar] [CrossRef]
- Steel, M.; Rodrigo, A. Maximum likelihood supertrees. Syst. Biol. 2008, 57, 243–250. [Google Scholar] [CrossRef]
- Szöllosi, G.J.; Tannier, E.; Lartillot, N.; Daubin, V. Lateral gene transfer from the dead. Syst. Biol. 2013, 62, 386–397. [Google Scholar] [CrossRef]
- Emms, D.M.; Kelly, S. STRIDE: Species tree root inference from gene duplication events. Mol. Biol. Evol. 2017, 34, 3267–3278. [Google Scholar] [CrossRef] [PubMed]
- Sack, F.D. The development and structure of stomata. In Stomatal Function; Zieger, E., Farquhar, G.D., Cowan, I.R., Eds.; Stanford University Press: Stanford, CA, USA, 1987; pp. 59–89. [Google Scholar]
- Mishler, B.D. Cladistic analysis of molecular and morphological data. Am. J. Phys. Anthropol. 1994, 94, 143–156. [Google Scholar] [CrossRef] [PubMed]
- Yang, Z. Maximum-likelihood estimation of phylogeny from DNA sequences when substitution rates differ over sites. Mol. Biol. Evol. 1993, 10, 1396–1401. [Google Scholar] [PubMed]
- Pagel, M.; Meade, A. A phylogenetic mixture model for detecting pattern-heterogeneity in gene sequence or character-state data. Syst. Biol. 2004, 53, 571–581. [Google Scholar] [CrossRef] [PubMed]
- Blanquart, S.; Lartillot, N. A site- and time-heterogeneous model of amino acid replacement. Mol. Biol. Evol. 2008, 25, 842–858. [Google Scholar] [CrossRef] [PubMed]
- Philippe, H.; de Vienne, D.M.; Ranwez, V.; Roure, B.; Baurain, D.; Delsuc, F. Pitfalls in supermatrix phylogenomics. Eur. J. Taxon. 2017, 283, 1–25. [Google Scholar] [CrossRef]
- Thorne, J.L.; Goldman, N.; Jones, D.T. Combining protein evolution and secondary structure. Mol. Biol. Evol. 1996, 13, 666–673. [Google Scholar] [CrossRef] [PubMed]
- Lartillot, N.; Philippe, H. A bayesian mixture model for across-site heterogeneities in the amino-acid replacement process. Mol. Biol. Evol. 2004, 21, 1095–1109. [Google Scholar] [CrossRef]
- Goldman, N.; Thorne, J.L.; Jones, D.T. Assessing the impact of secondary structure and solvent accessibility on protein evolution. Genetics 1998, 149, 445–458. [Google Scholar] [CrossRef]
- Redmond, A.K.; McLysaght, A. Evidence for sponges as sister to all other animals from partitioned phylogenomics with mixture models and recoding. Nat. Commun. 2021, 12, 1783. [Google Scholar] [CrossRef]
- Dunn, C.W.; Hejnol, A.; Matus, D.Q.; Pang, K.; Browne, W.E.; Smith, S.A.; Seaver, E.; Rouse, G.W.; Obst, M.; Edgecombe, G.D.; et al. Broad phylogenomic sampling improves resolution of the animal tree of life. Nature 2008, 452, 745–749. [Google Scholar] [CrossRef] [PubMed]
- Laumer, C.E.; Fernández, R.; Lemer, S.; Combosch, D.; Kocot, K.M.; Riesgo, A.; Andrade, S.C.S.; Sterrer, W.; Sørensen, M.V.; Giribet, G. Revisiting metazoan phylogeny with genomic sampling of all phyla. Proc. R. Soc. B 2019, 286, 20190831. [Google Scholar] [CrossRef] [PubMed]
- Wang, H.-C.; Minh, B.Q.; Susko, E.; Roger, A.J. Modeling site heterogeneity with posterior mean site frequency profiles accelerates accurate phylogenomic estimation. Syst. Biol. 2018, 67, 216–235. [Google Scholar] [CrossRef]
- Leebens-Mack, J.; Raubeson, L.A.; Cui, L.Y.; Kuehl, J.V.; Fourcade, M.H.; Chumley, T.W.; Boore, J.L.; Jansen, R.K.; de Pamphilis, C.W. Identifying the basal angiosperm node in chloroplast genome phylogenies: Sampling one’s way out of the felsenstein zone. Mol. Biol. Evol. 2005, 22, 1948–1963. [Google Scholar] [CrossRef]
- Qiu, Y.-L.; Li, L.; Wang, B.; Xue, J.-Y.; Hendry, T.A.; Li, R.; Brown, J.W.; Liu, Y.; Hudson, G.T.; Chen, Z. Angiosperm phylogeny inferred from sequences of four mitochondrial genes. J. Syst. Evol. 2010, 48, 391–425. [Google Scholar] [CrossRef]
- Xi, Z.; Liu, L.; Rest, J.S.; Davis, C.C. Coalescent versus concatenation methods and the placement of Amborella as sister to water lilies. Syst. Biol. 2014, 63, 919–932. [Google Scholar] [CrossRef]
- Ohno, S. Evolution by Gene Duplication; Springer: New York, NY, USA, 1970. [Google Scholar]
- Wendel, J.F. Genome evolution in polyploids. Plant Mol. Biol. 2000, 42, 225–249. [Google Scholar] [CrossRef]
- Kingman, J.F.C. On the genealogy of large populations. J. Appl. Probab. 1982, 19, 27–43. [Google Scholar] [CrossRef]
- Hudson, R.R. Gene genealogies and the coalescent process. In Oxford Surveys in Evolutionary Biology; Futuyma, D.J., Antonovics, J.D., Eds.; Oxford University Press: New York, NY, USA, 1990; pp. 1–44. [Google Scholar]
- Maddison, W.P. Gene trees in species trees. Syst. Biol. 1997, 46, 523–536. [Google Scholar] [CrossRef]
- Rannala, B.; Yang, Z. Bayes estimation of species divergence times and ancestral population sizes using DNA sequences from multiple loci. Genetics 2003, 164, 1645–1656. [Google Scholar] [CrossRef]
- Adams, R.H.; Castoe, T.A. Statistical binning leads to profound model violation due to gene tree error incurred by trying to avoid gene tree error. Mol. Phylogen. Evol. 2019, 134, 164–171. [Google Scholar] [CrossRef] [PubMed]
- Naser-Khdour, S.; Minh, B.Q.; Zhang, W.; Stone, E.A.; Lanfear, R. The prevalence and impact of model violations in phylogenetic analysis. Genome Biol. Evol. 2019, 11, 3341–3352. [Google Scholar] [CrossRef]
- Zitnik, M.; Sosic, R.; Feldman, M.W.; Leskovec, J. Evolution of resilience in protein interactomes across the tree of life. Proc. Natl. Acad. Sci. USA 2019, 116, 4426–4433. [Google Scholar] [CrossRef]
- Arabidopsis Interactome Mapping Consortium. Evidence for network evolution in an Arabidopsis interactome map. Science 2011, 333, 601–607. [Google Scholar] [CrossRef]
- Fitch, W.M. Distinguishing homologous from analogous proteins. Syst. Zool. 1970, 19, 99–113. [Google Scholar] [CrossRef] [PubMed]
- Al Jewari, C.; Baldauf, S.L. An excavate root for the eukaryote tree of life. Sci. Adv. 2023, 9, eade4973. [Google Scholar] [CrossRef] [PubMed]
- Qiao, X.; Zhang, S.; Paterson, A.H. Pervasive genome duplications across the plant tree of life and their links to major evolutionary innovations and transitions. Comput. Struct. Biotechnol. J. 2023, 20, 3248–3256. [Google Scholar] [CrossRef]
- Popper, K. The Logic of Scientific Discovery; Routledge Classics: London, UK; New York, NY, USA, 2002. [Google Scholar]
- Boore, J.L.; Lavrov, D.V.; Brown, W.M. Gene translocation links insects and crustaceans. Nature 1998, 392, 667–668. [Google Scholar] [CrossRef]
- Macey, J.R.; Schulte, J.A.I.; Larson, A. Evolution and phylogenetic information content of mitochondrial genomic structural features illustrated with acrodont lizards. Syst. Biol. 2000, 49, 257–277. [Google Scholar] [CrossRef]
- Zhao, T.; Zwaenepoel, A.; Xue, J.-Y.; Kao, S.-M.; Li, Z.; Schranz, M.E.; Van de Peer, Y. Whole-genome microsynteny-based phylogeny of angiosperms. Nat. Commun. 2021, 12, 3498. [Google Scholar] [CrossRef]
- Spang, A.; Saw, J.H.; Jørgensen, S.L.; Zaremba-Niedzwiedzka, K.; Martijn, J.; Lind, A.E.; van Eijk, R.; Schleper, C.; Guy, L.; Ettema, T.J.G. Complex archaea that bridge the gap between prokaryotes and eukaryotes. Nature 2015, 521, 173–179. [Google Scholar] [CrossRef] [PubMed]
- Doyle, J.J. Gene trees and species trees: Molecular systematics as one-character taxonomy. Syst. Bot. 1992, 17, 144–163. [Google Scholar] [CrossRef]
- Miyamoto, M.M.; Fitch, W.M. Testing species phylogenies and phylogenetic methods with congruence. Syst. Biol. 1995, 44, 64–76. [Google Scholar] [CrossRef]
- Bell, D.; Lin, Q.; Gerelle, W.K.; Joya, S.; Chang, Y.; Taylor, Z.N.; Rothfels, C.J.; Larsson, A.; Villarreal, J.C.; Li, F.-W.; et al. Organellomic data sets confirm a cryptic consensus on (unrooted) land-plant relationships and provide new insights into bryophyte molecular evolution. Am. J. Bot. 2019, 107, 91–115. [Google Scholar] [CrossRef] [PubMed]
- Gray, J. Major Paleozoic land plant evolutionary bio-events. Palaeogeogr. Palaeoclimatol. Palaeoecol. 1993, 104, 153–169. [Google Scholar] [CrossRef]
- Strother, P.K.; Taylor, W.A. A fossil record of spores before sporophytes. Diversity 2024, in press. [Google Scholar]
- Edwards, D.; Morris, J.L.; Richardson, J.B.; Kenrick, P. Cryptospores and cryptophytes reveal hidden diversity in early land floras. New Phytol. 2014, 202, 50–78. [Google Scholar] [CrossRef] [PubMed]
- Wellman, C.H.; Osterloff, P.L.; Mohiuddin, U. Fragments of the earliest land plants. Nature 2003, 425, 282–285. [Google Scholar] [CrossRef]
- Edwards, D.; Wellman, C. Embryophytes on land: The Ordovician to Lochkovian (Lower Devonian) record. In Plants Invade the Land: Evolutionary & Environmental Perspectives; Gensel, P.G., Edwards, D., Eds.; Columbia University Press: New York, NY, USA, 2001; pp. 3–28. [Google Scholar]
- Labandeira, C.C.; Tremblay, S.L.; Bartowski, K.E.; Hernick, L.V. Middle Devonian liverwort herbivory and antiherbivor defence. New Phytol. 2014, 202, 247–258. [Google Scholar] [CrossRef]
- Hernick, L.V.; Landing, E.; Bartowski, K.E. Earth’s oldest liverworts—Metzgeriothallus sharonae sp. nov. from the Middle Devonian (Giventian) of eastern New York, USA. Rev. Palaeobot. Palynol. 2008, 148, 154–162. [Google Scholar] [CrossRef]
- Hueber, F.M. Hepaticites devonicus: A new fossil liverwort from the Devonian of New York. Ann. Mo. Bot. Gard. 1961, 48, 125–131. [Google Scholar] [CrossRef]
- Gray, J.; Massa, D.; Boucot, A.J. Caradocian land plant microfossils from Libya. Geology 1982, 10, 197–201. [Google Scholar] [CrossRef]
- Strother, P.K.; Al-Hajri, S.; Traverse, A. New evidence for land plants from the lower Middle Ordovician of Saudia Arabia. Geology 1996, 24, 55–58. [Google Scholar] [CrossRef]
- Rubinstein, C.V.; Gerrienne, P.; de la Puente, G.S.; Astini, R.A.; Steemans, P. Early Middle Ordovician evidence for land plants in Argentina (eastern Gondwana). New Phytol. 2010, 188, 365–369. [Google Scholar] [CrossRef] [PubMed]
- Strother, P.K.; Foster, C. A fossil record of land plant origins from charophyte algae. Science 2021, 373, 792–796. [Google Scholar] [CrossRef] [PubMed]
- Strother, P.K.; Traverse, A.; Vecoli, M. Cryptospores from the Hanadir Shale Member of the Qasim Formation, Ordovician (Darriwilian) of Saudi Arabia: Taxonomy and systematics. Rev. Palaeobot. Palynol. 2015, 212, 97–110. [Google Scholar] [CrossRef]
- Wang, K.; Xu, H.-H.; Yin, L.-M. A palynological assemblage from the Cambrian (Series 2, Stage 4) of Shandong Province, China, and its implications to the transition from algae to land plants. Rev. Palaeobot. Palynol. 2022, 301, 104645. [Google Scholar] [CrossRef]
- Haeckel, E. Generelle Morphologie der Organismen. Zweiter Band: Allgemeine Entwickelungsgeschichte; Georg Reimer: Berlin, Germany, 1866. [Google Scholar]
- Mayr, E. The Growth of Biological Thought: Diversity, Evolution, and Inheritance; The Belknap Press of Harvard University Press: Cambridge, MA, USA, 1982; p. 974. [Google Scholar]
- Hennig, W. Phylogenetic Systematics; University of Illinois Press: Urbana, IL, USA, 1966. [Google Scholar]
- Pamilo, P.; Nei, M. Relationships between gene trees and species trees. Mol. Biol. Evol. 1988, 5, 568–583. [Google Scholar] [PubMed]
- Atchley, W.R.; Fitch, W.M. Gene trees and the origins of inbreed mice. Science 1991, 254, 554–558. [Google Scholar] [CrossRef]
- Leigh, J.W.; Lapointe, F.-J.; Lopez, P.; Bapteste, E. Evaluating phylogenetic congruence in the post-genomic era. Genome Biol. Evol. 2011, 3, 571–587. [Google Scholar] [CrossRef]
- Keating, J.N.; Garwood, R.J.; Sansom, R.S. Phylogenetic congruence, conflict and consilience between molecular and morphological data. BMC Ecol. Evol. 2023, 23, 30. [Google Scholar] [CrossRef] [PubMed]
- Swofford, D.L.; Olsen, O.J.; Waddell, P.J.; Hillis, D.M. Phylogenetic inference. In Molecular Systematics, 2nd ed.; Hillis, D.M., Moritz, C., Mable, B.K., Eds.; Sinauer: Sunderland, MA, USA, 1996; pp. 407–514. [Google Scholar]
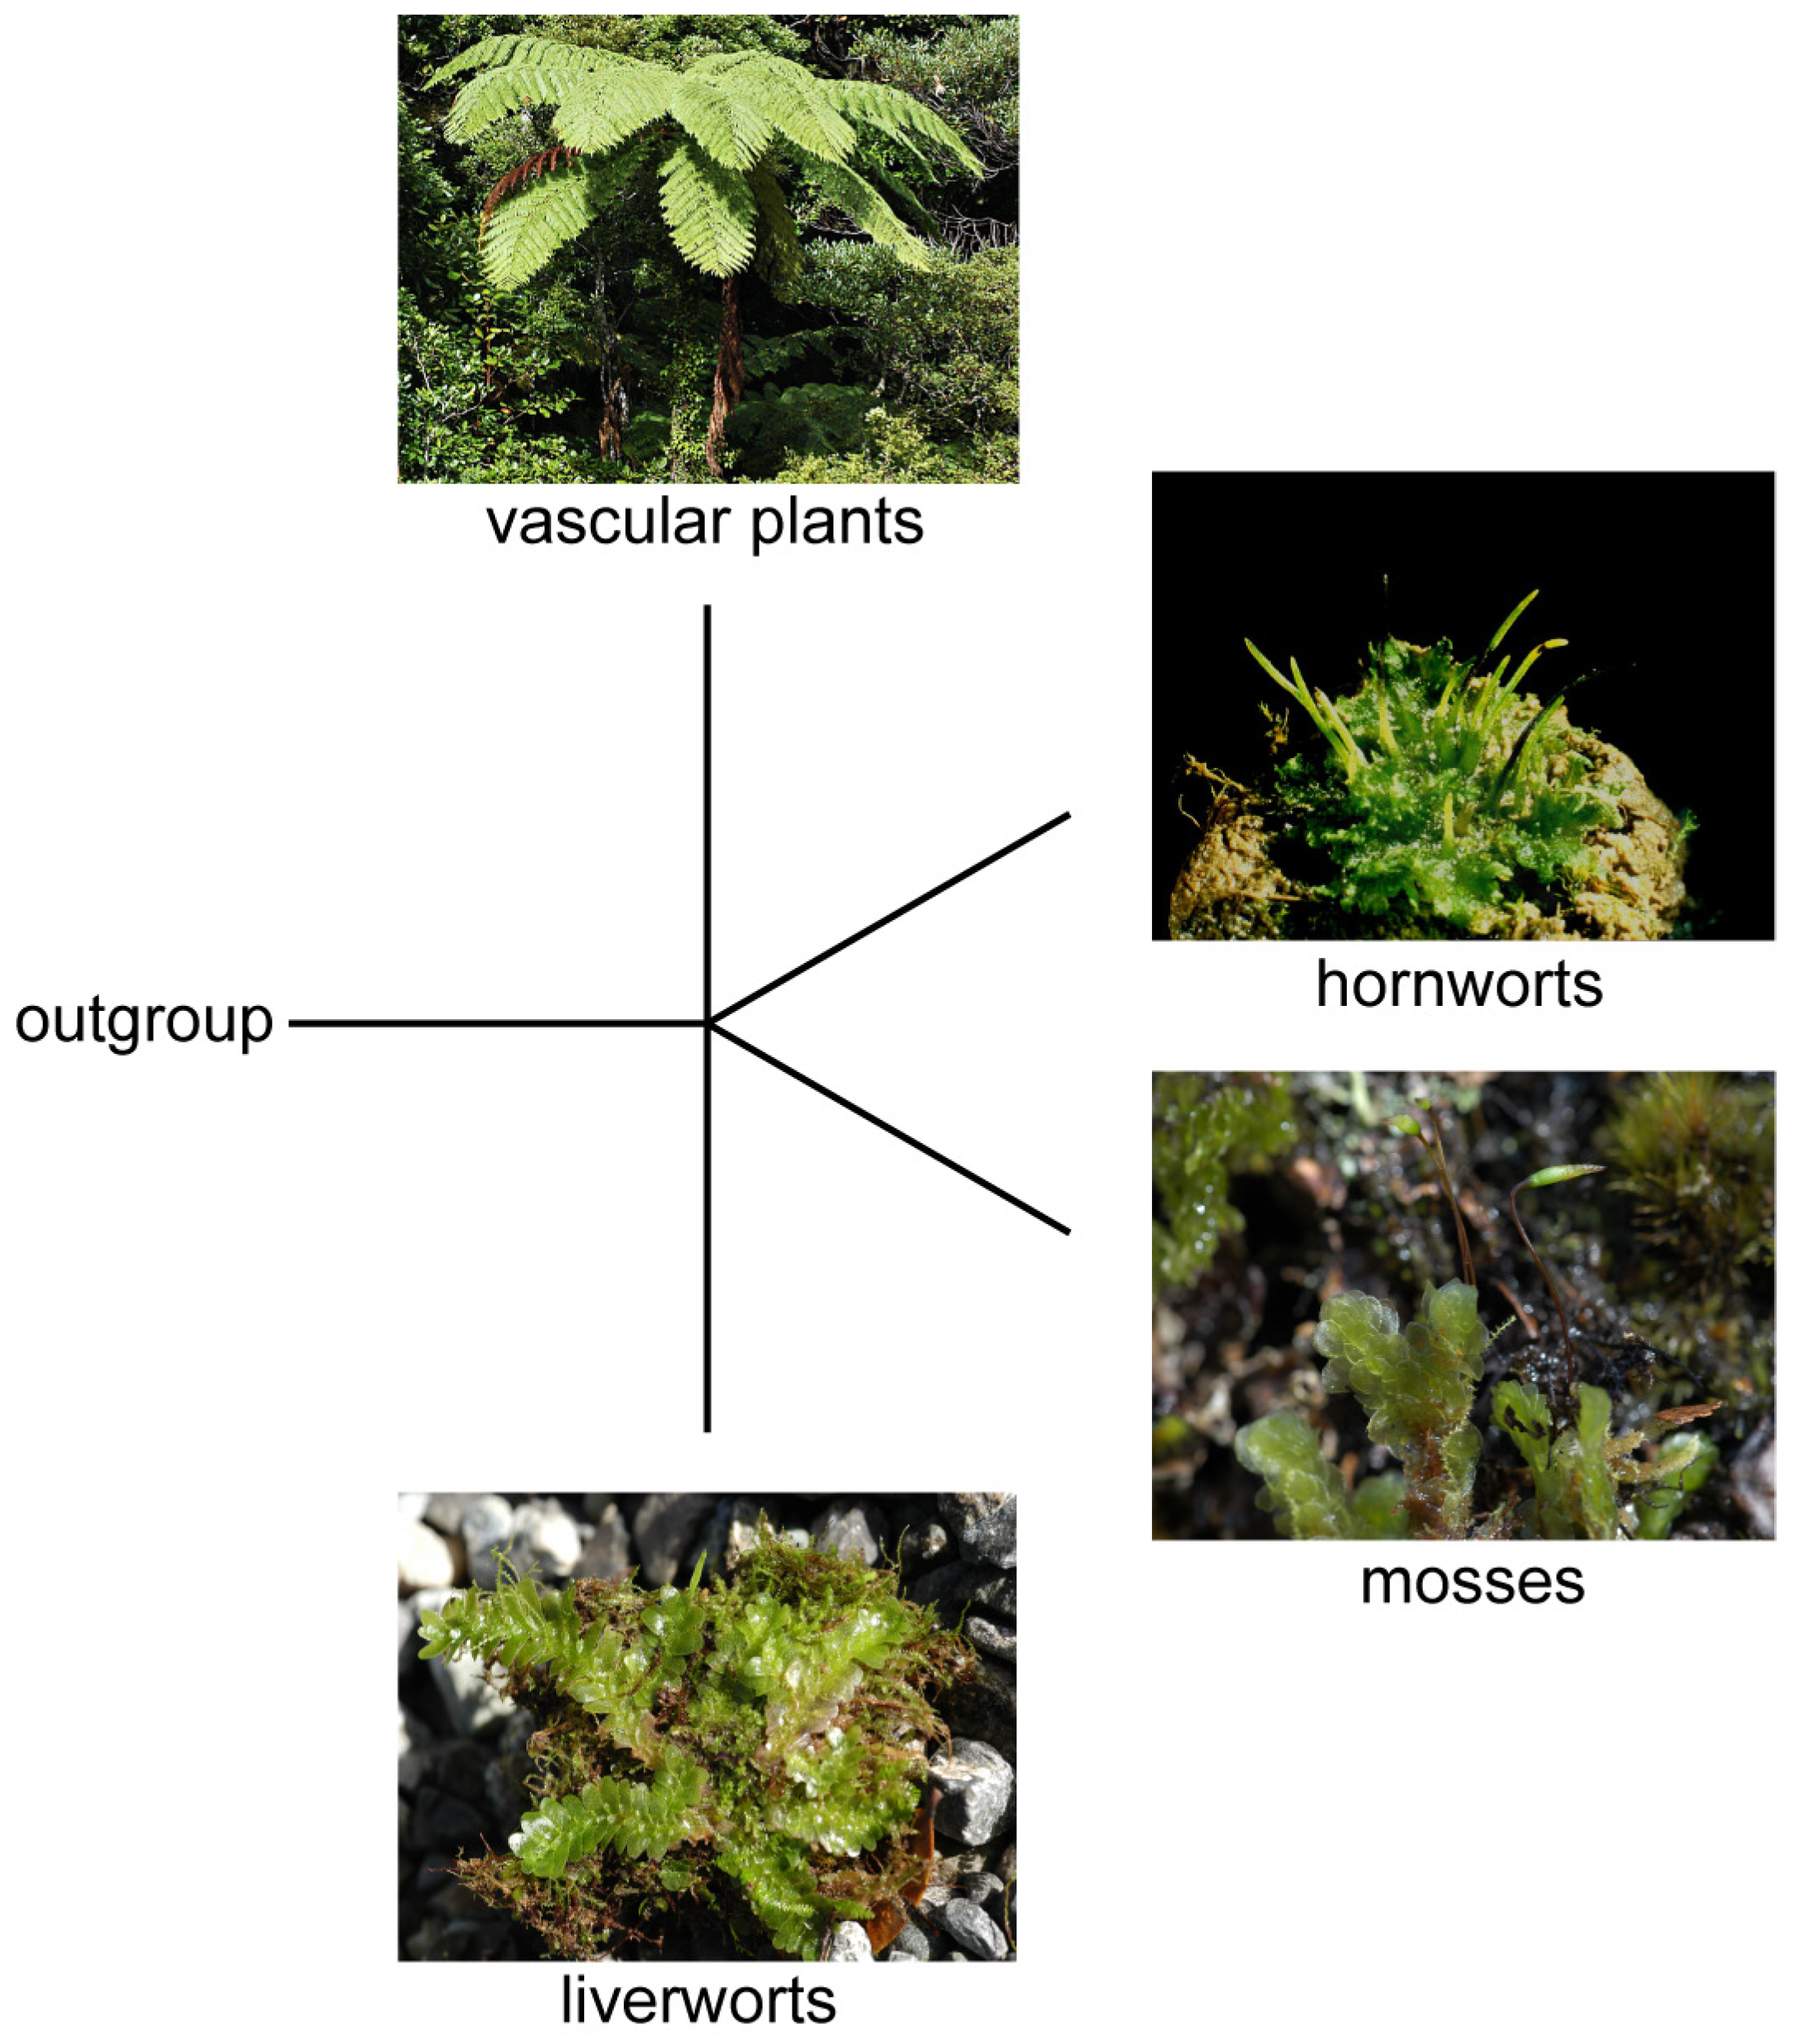
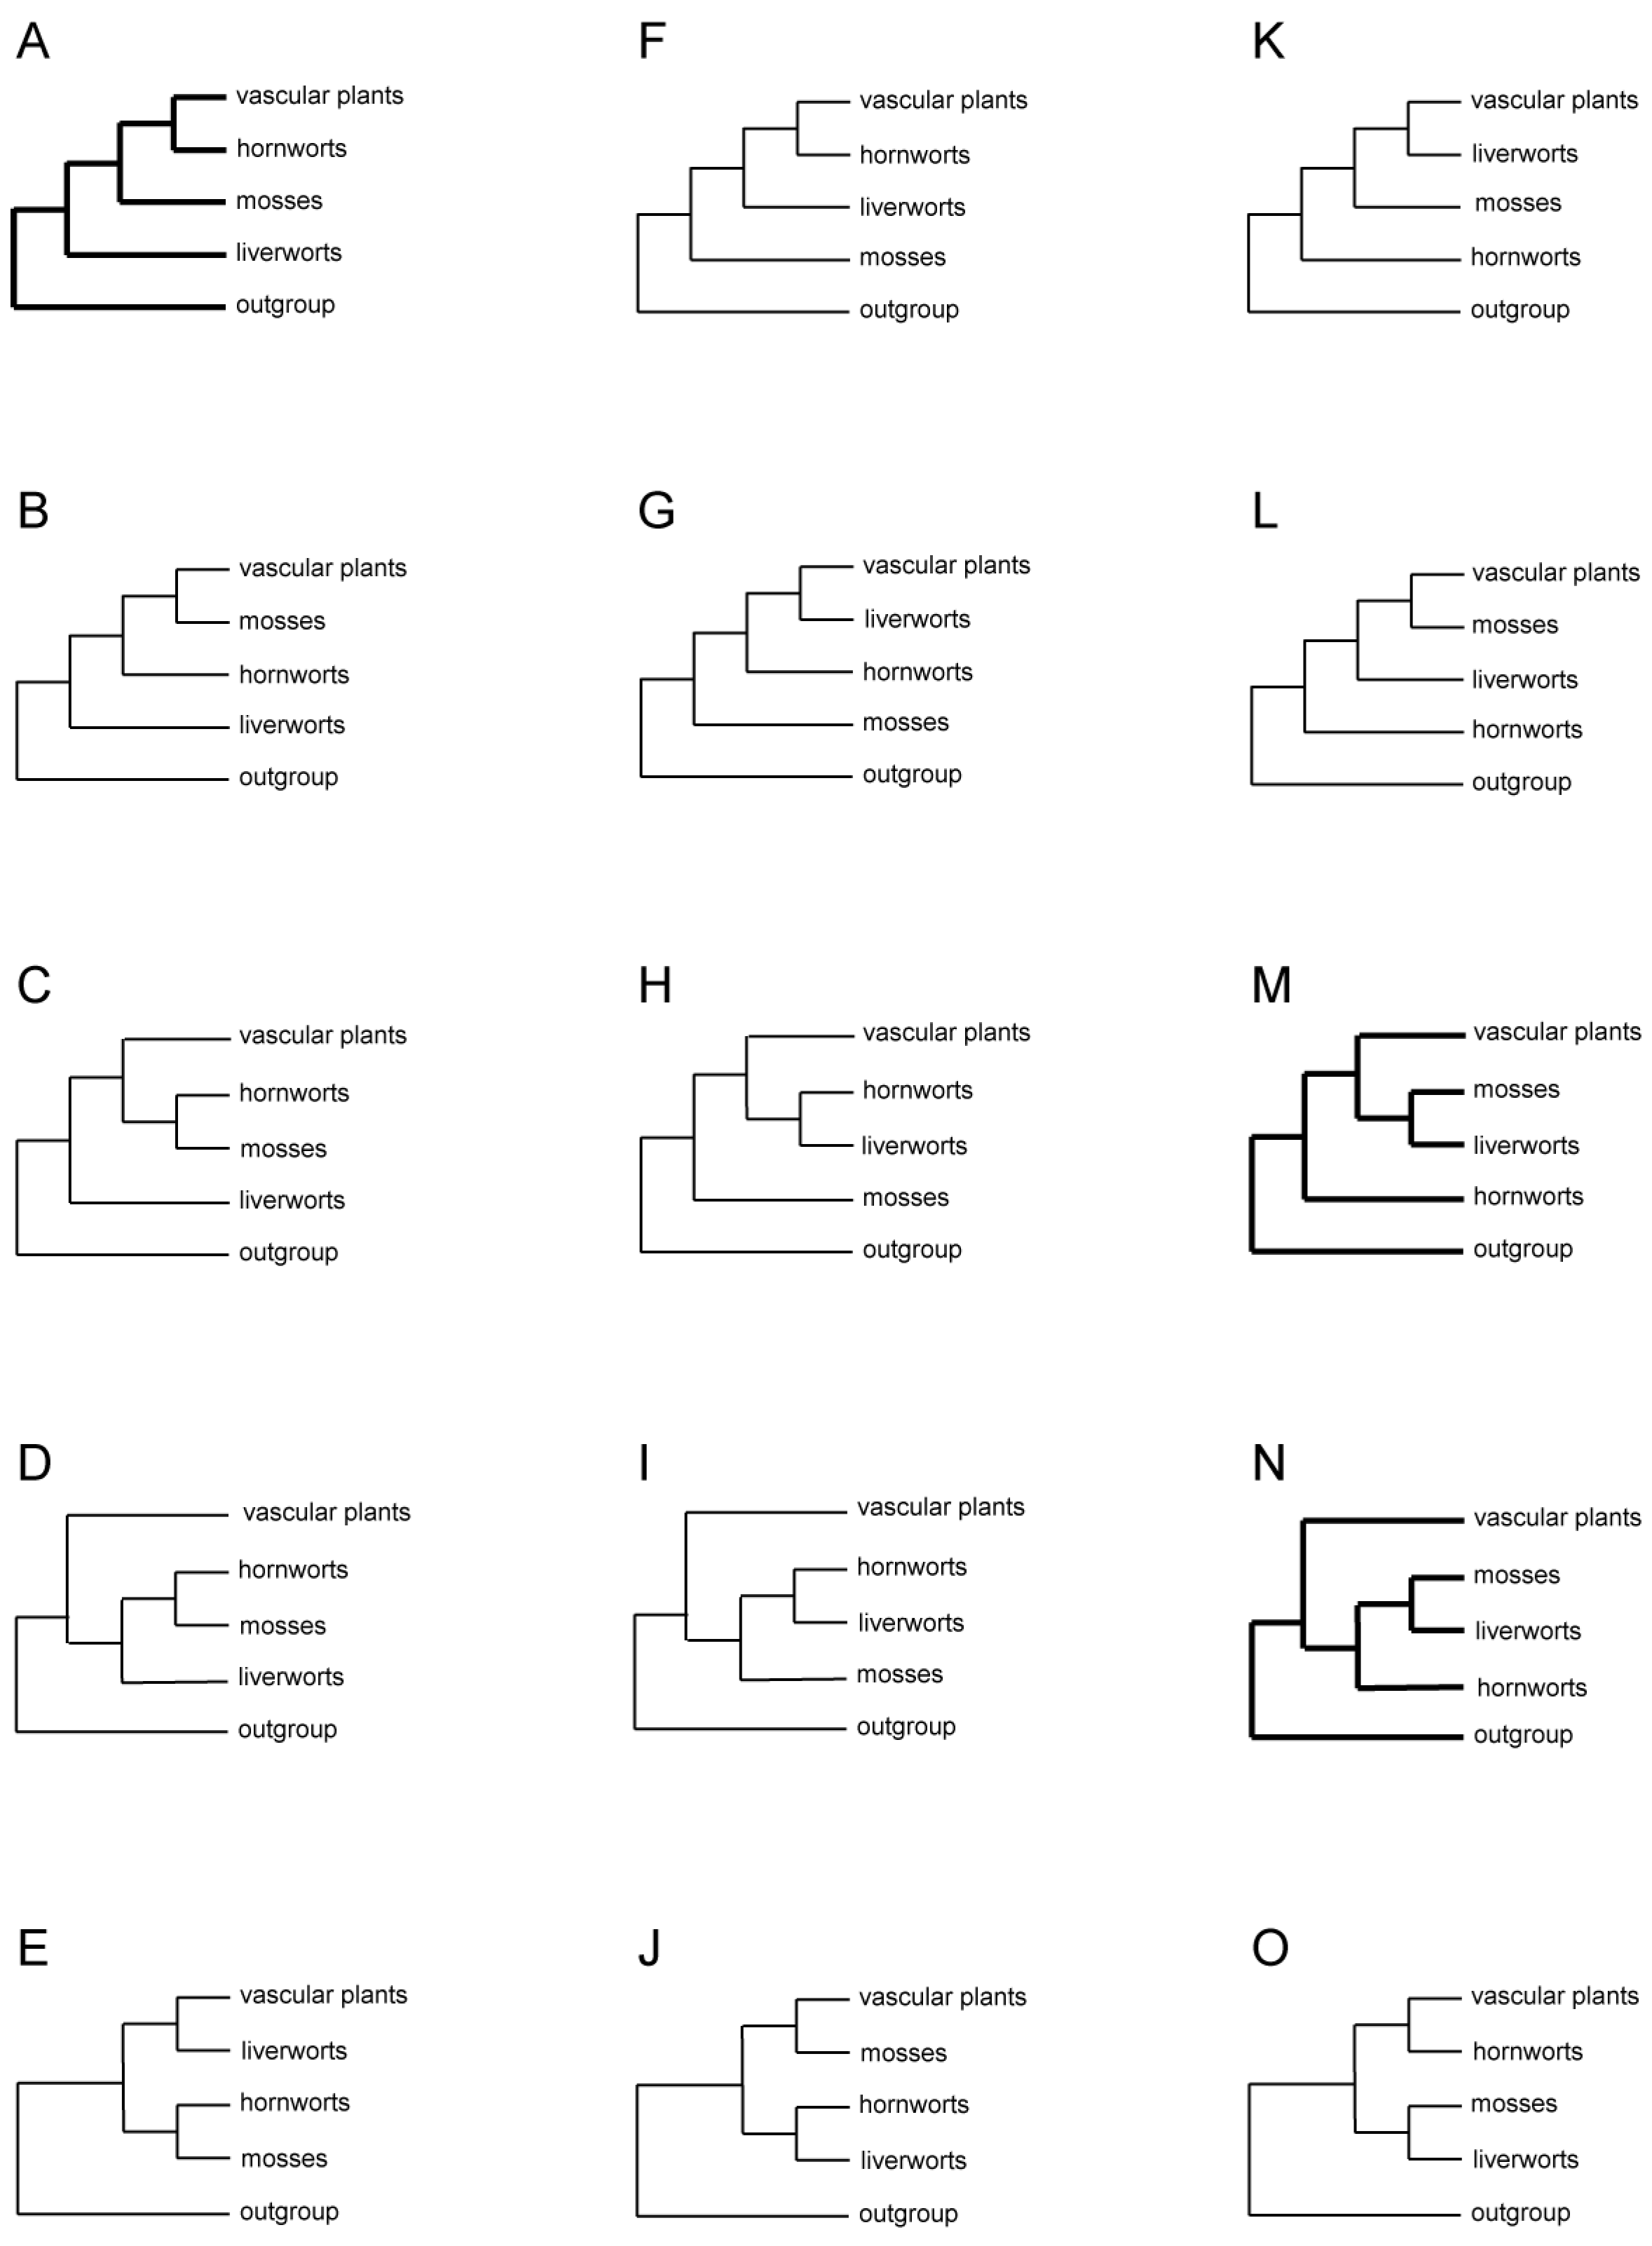
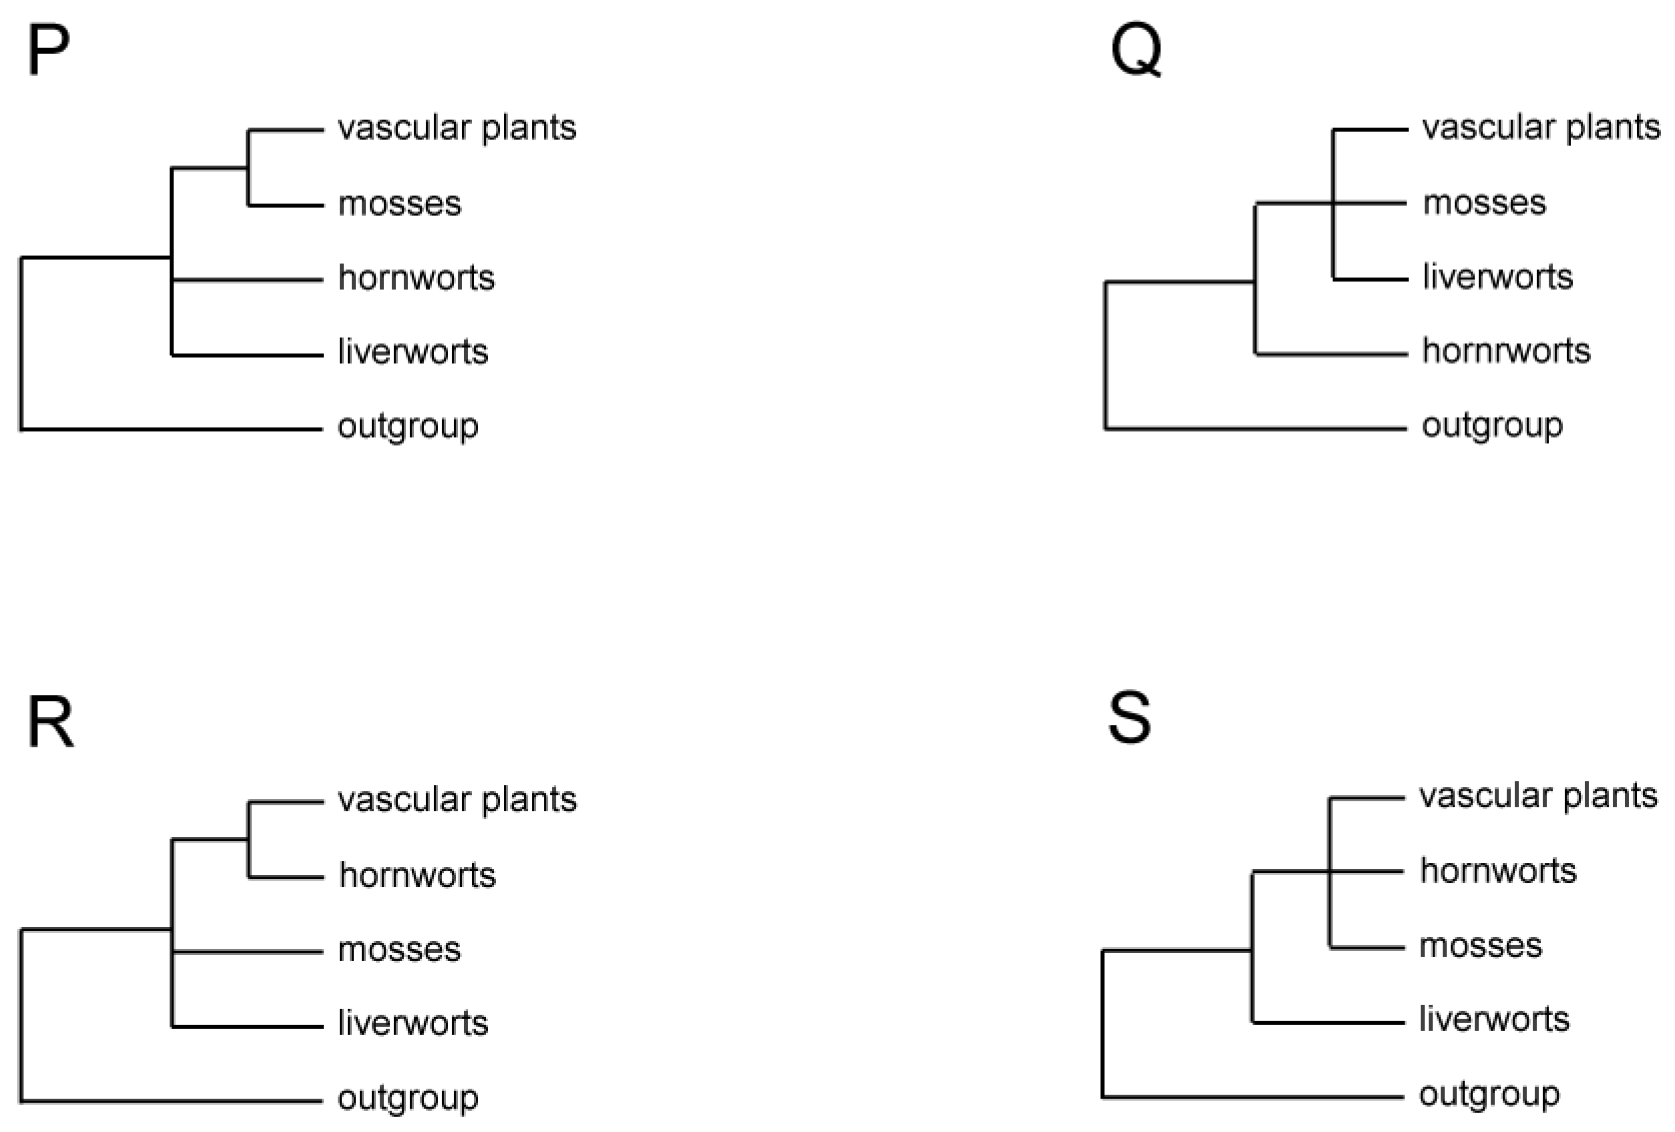
Disclaimer/Publisher’s Note: The statements, opinions and data contained in all publications are solely those of the individual author(s) and contributor(s) and not of MDPI and/or the editor(s). MDPI and/or the editor(s) disclaim responsibility for any injury to people or property resulting from any ideas, methods, instructions or products referred to in the content. |
© 2024 by the authors. Licensee MDPI, Basel, Switzerland. This article is an open access article distributed under the terms and conditions of the Creative Commons Attribution (CC BY) license (https://creativecommons.org/licenses/by/4.0/).