
Diatoms’ Diversity in the Assessment of the Impact of Diamond and Oil and Gas Mining on Aquatic Ecosystems of the Central Yakut Plain (Eastern Siberia, Yakutia) Using Bioindication and Statistical Mapping Methods


Abstract
:1. Introduction
2. Materials and Methods
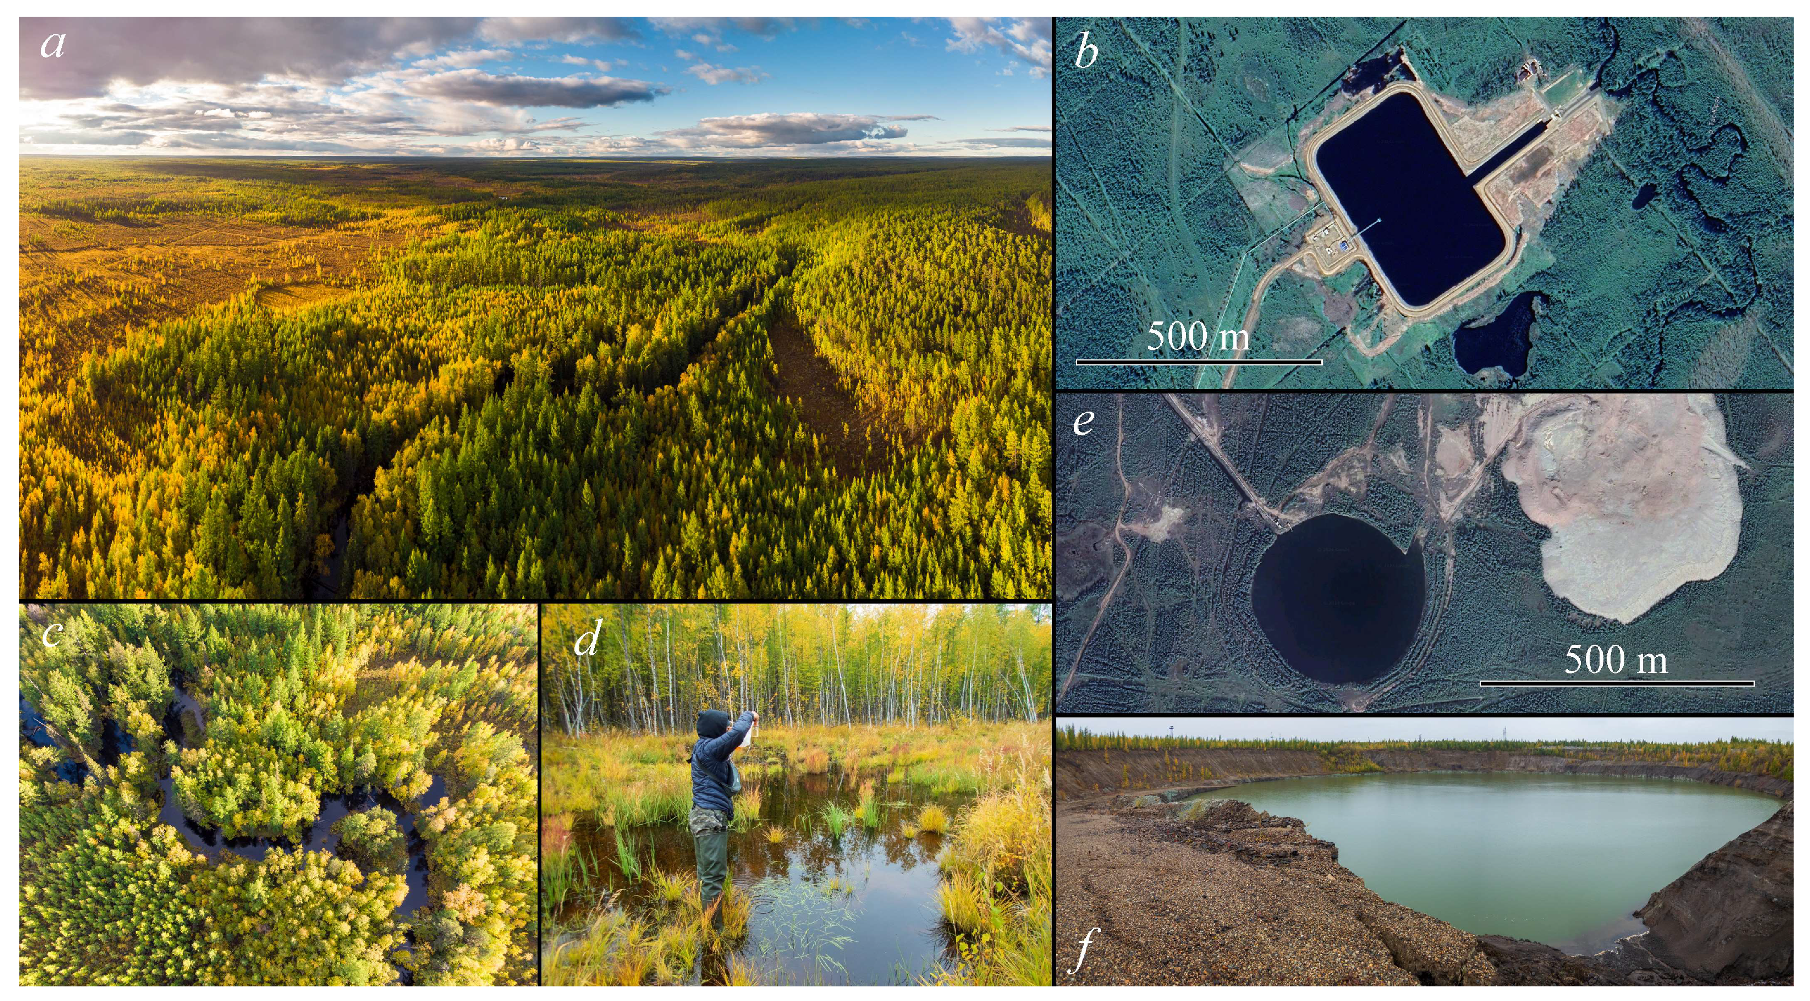
2.1. Description of Study Area
2.2. Sampling
2.3. Water Chemistry Analysis
2.4. Diatom Analysis
2.5. Bioindication
2.6. Ecological Mapping and JASP
2.7. Species–Environments Relationship Analysis
3. Results
3.1. Water Chemistry
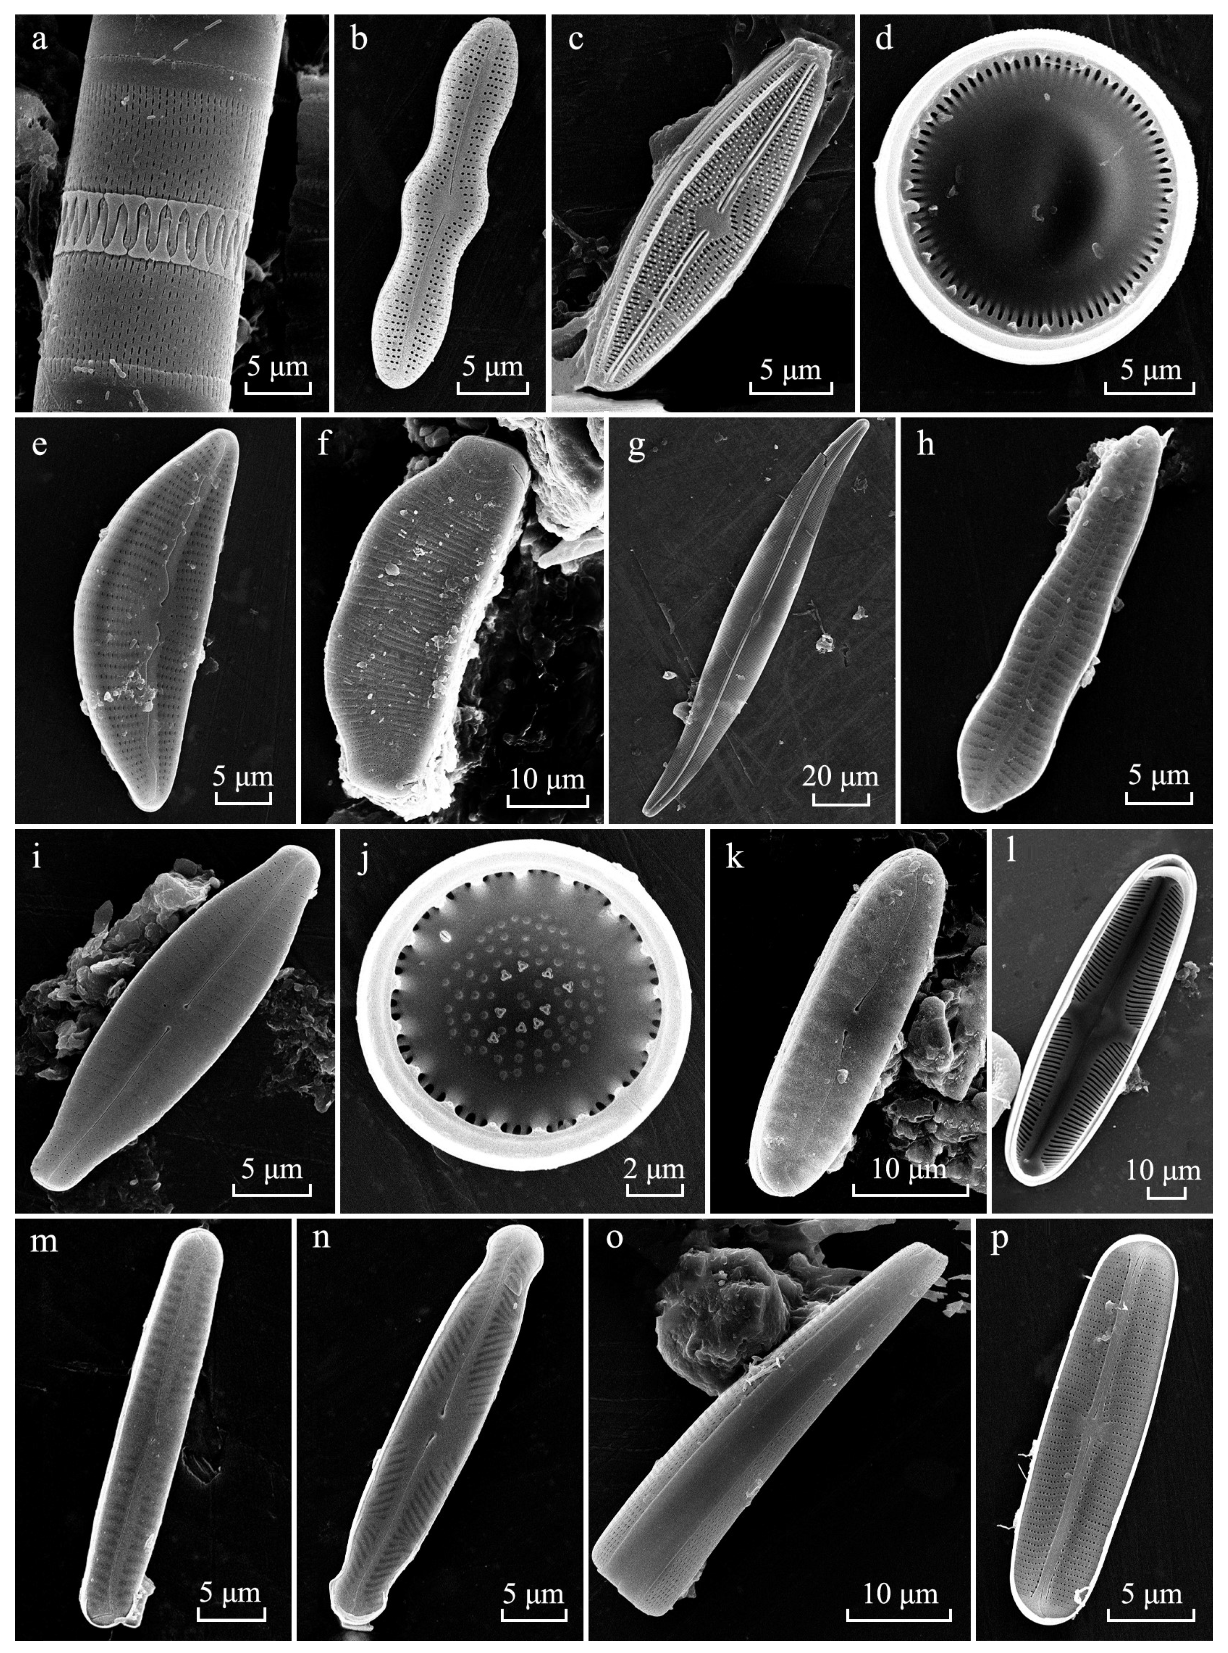
3.2. Taxonomic Analysis
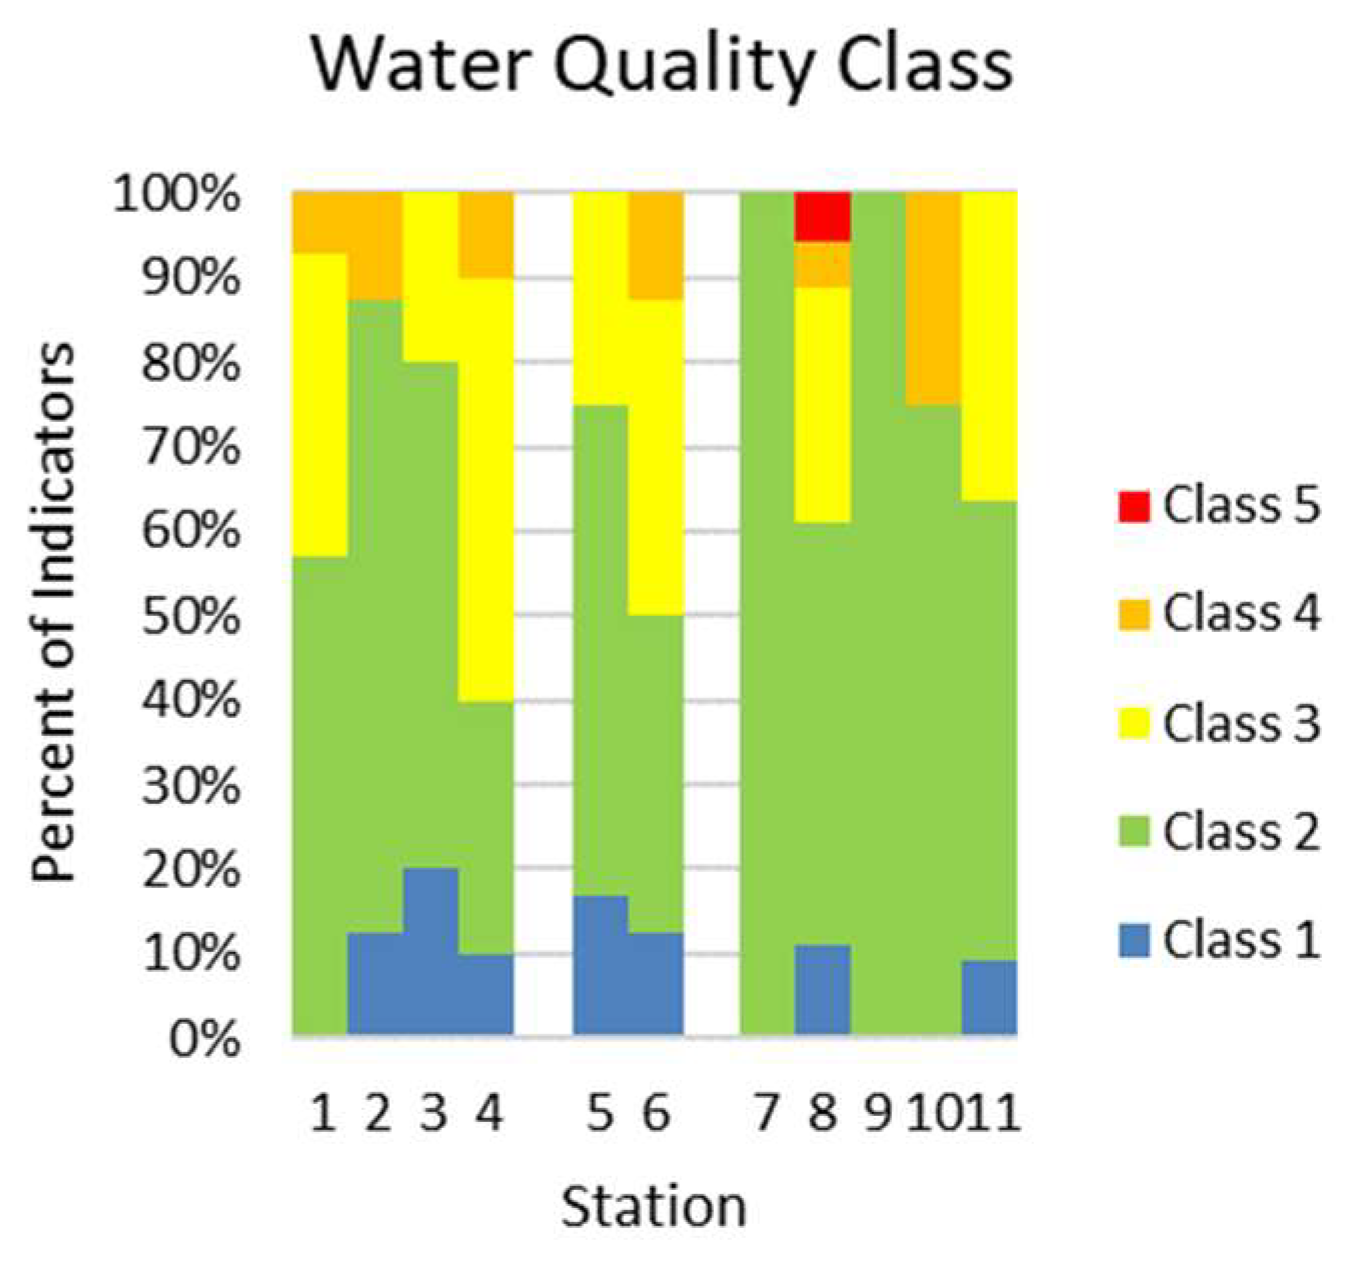
3.3. Bioindication
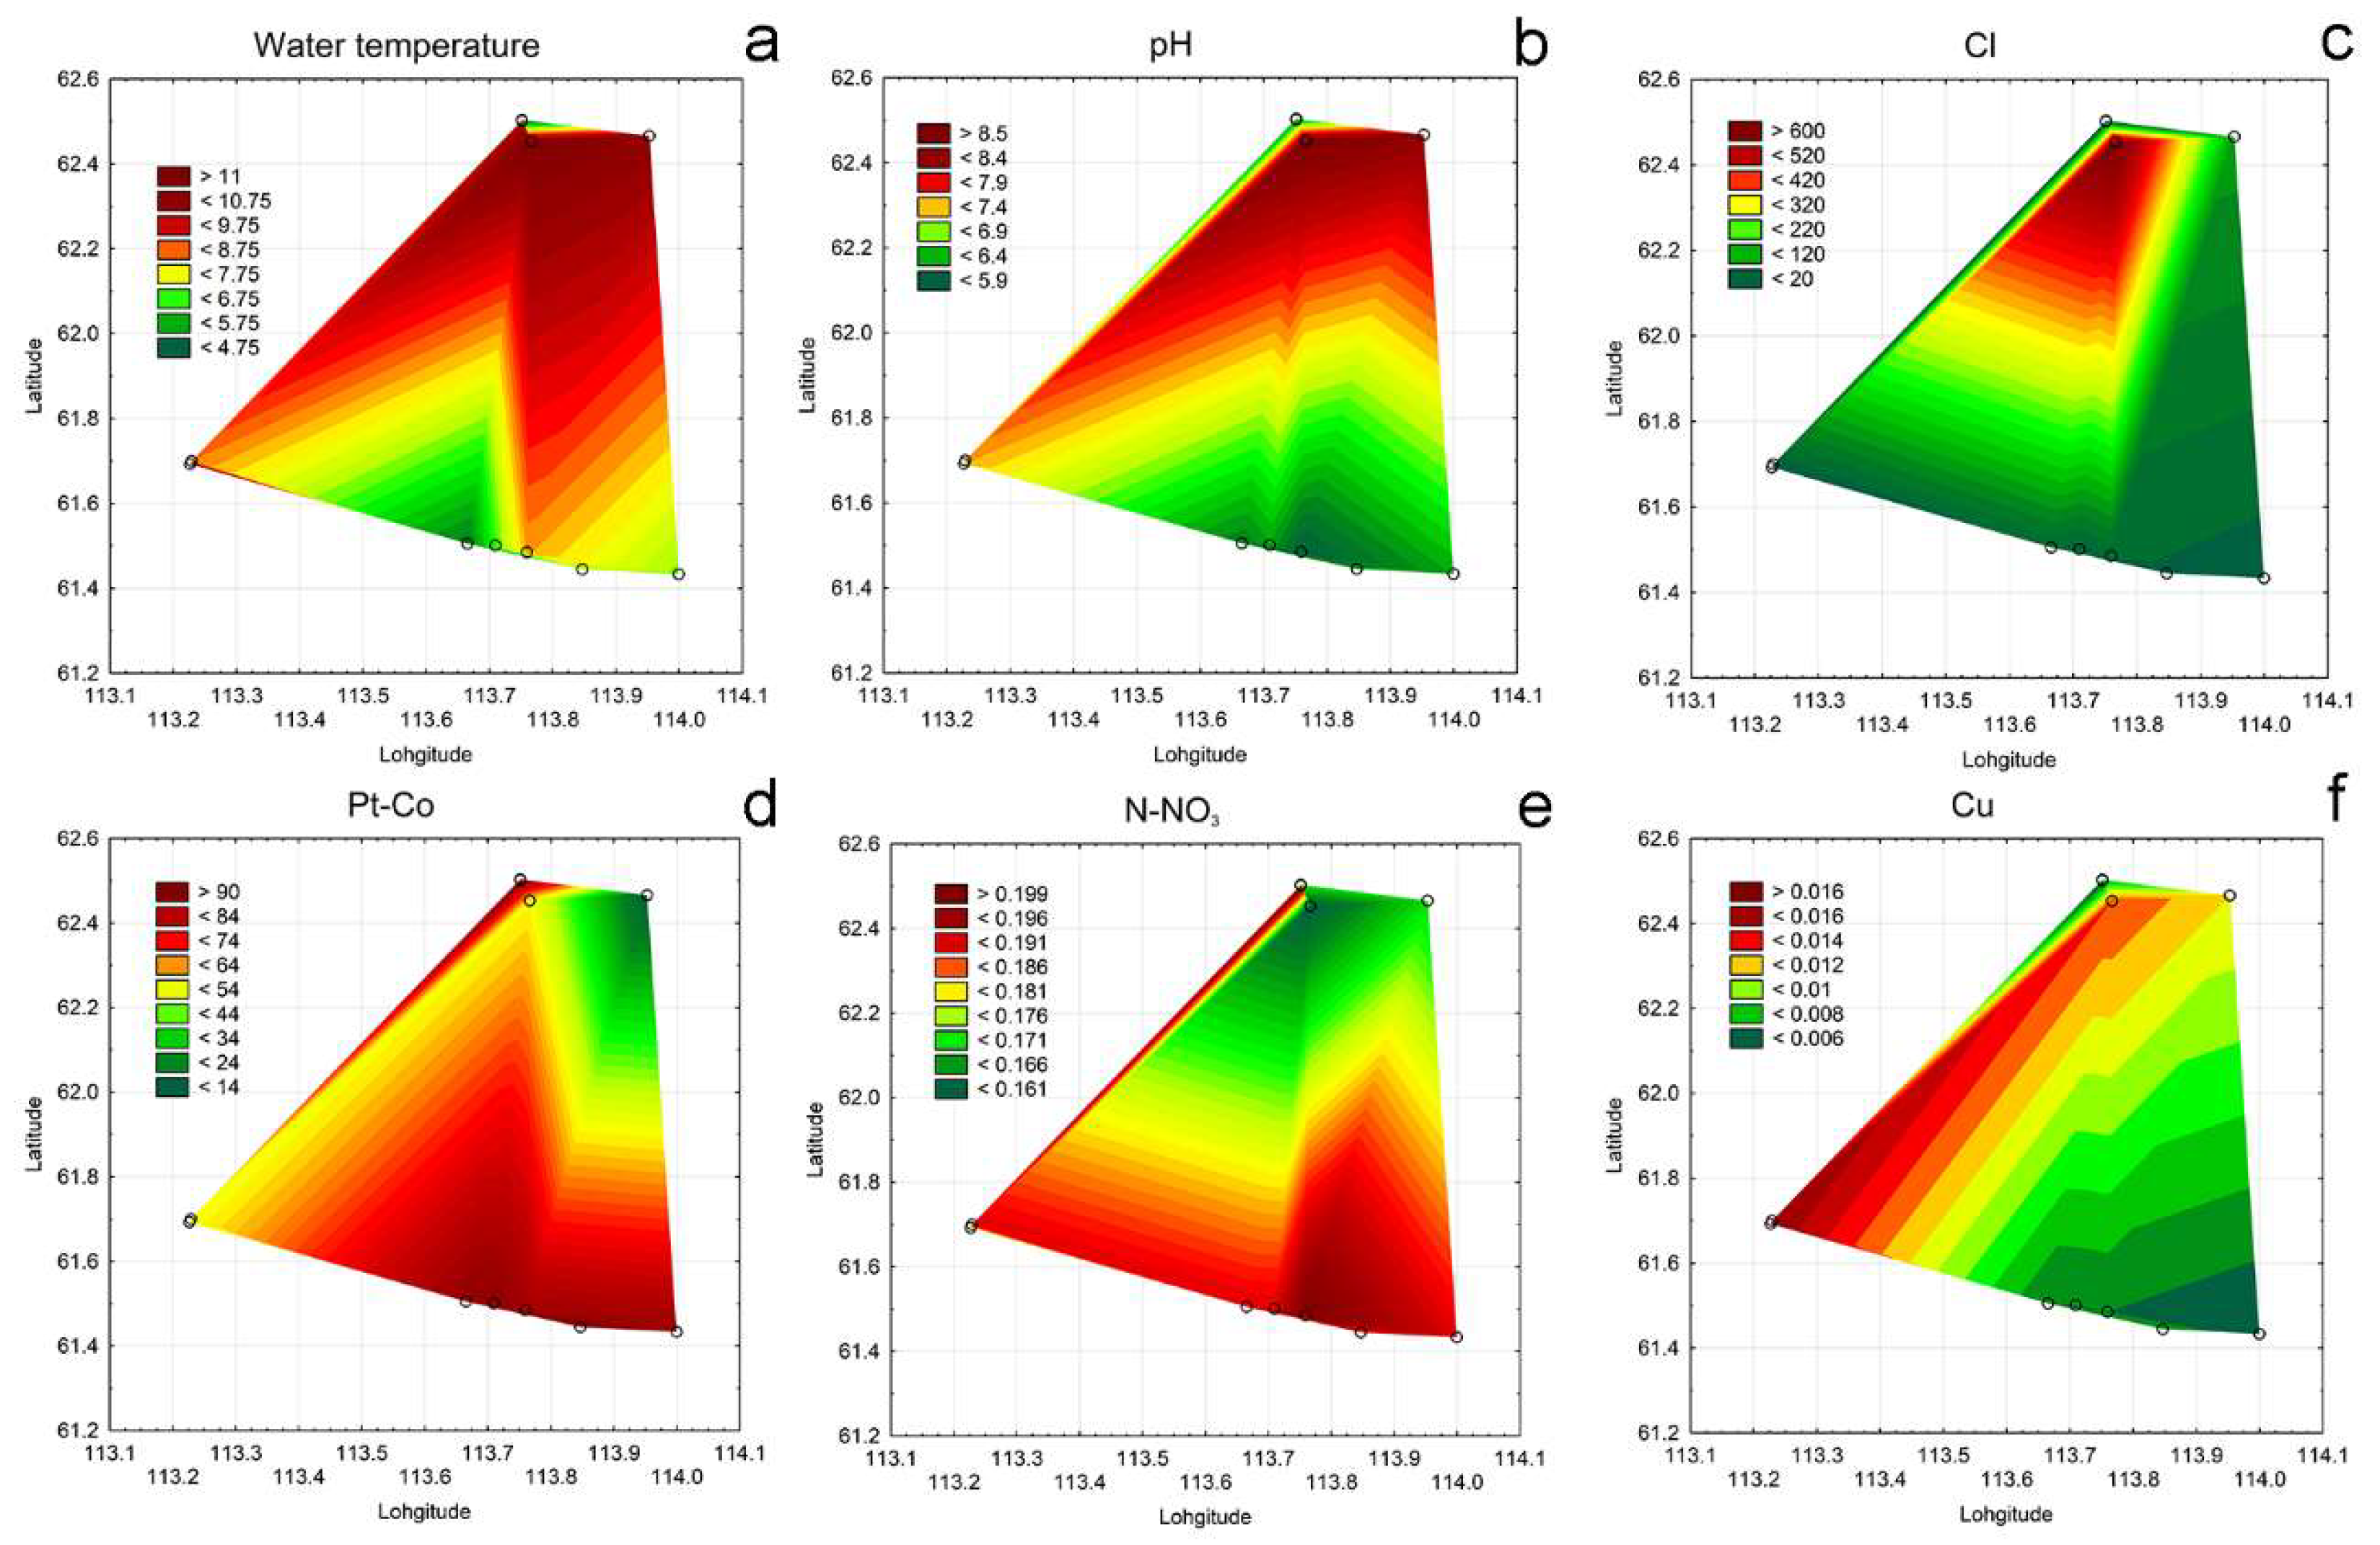
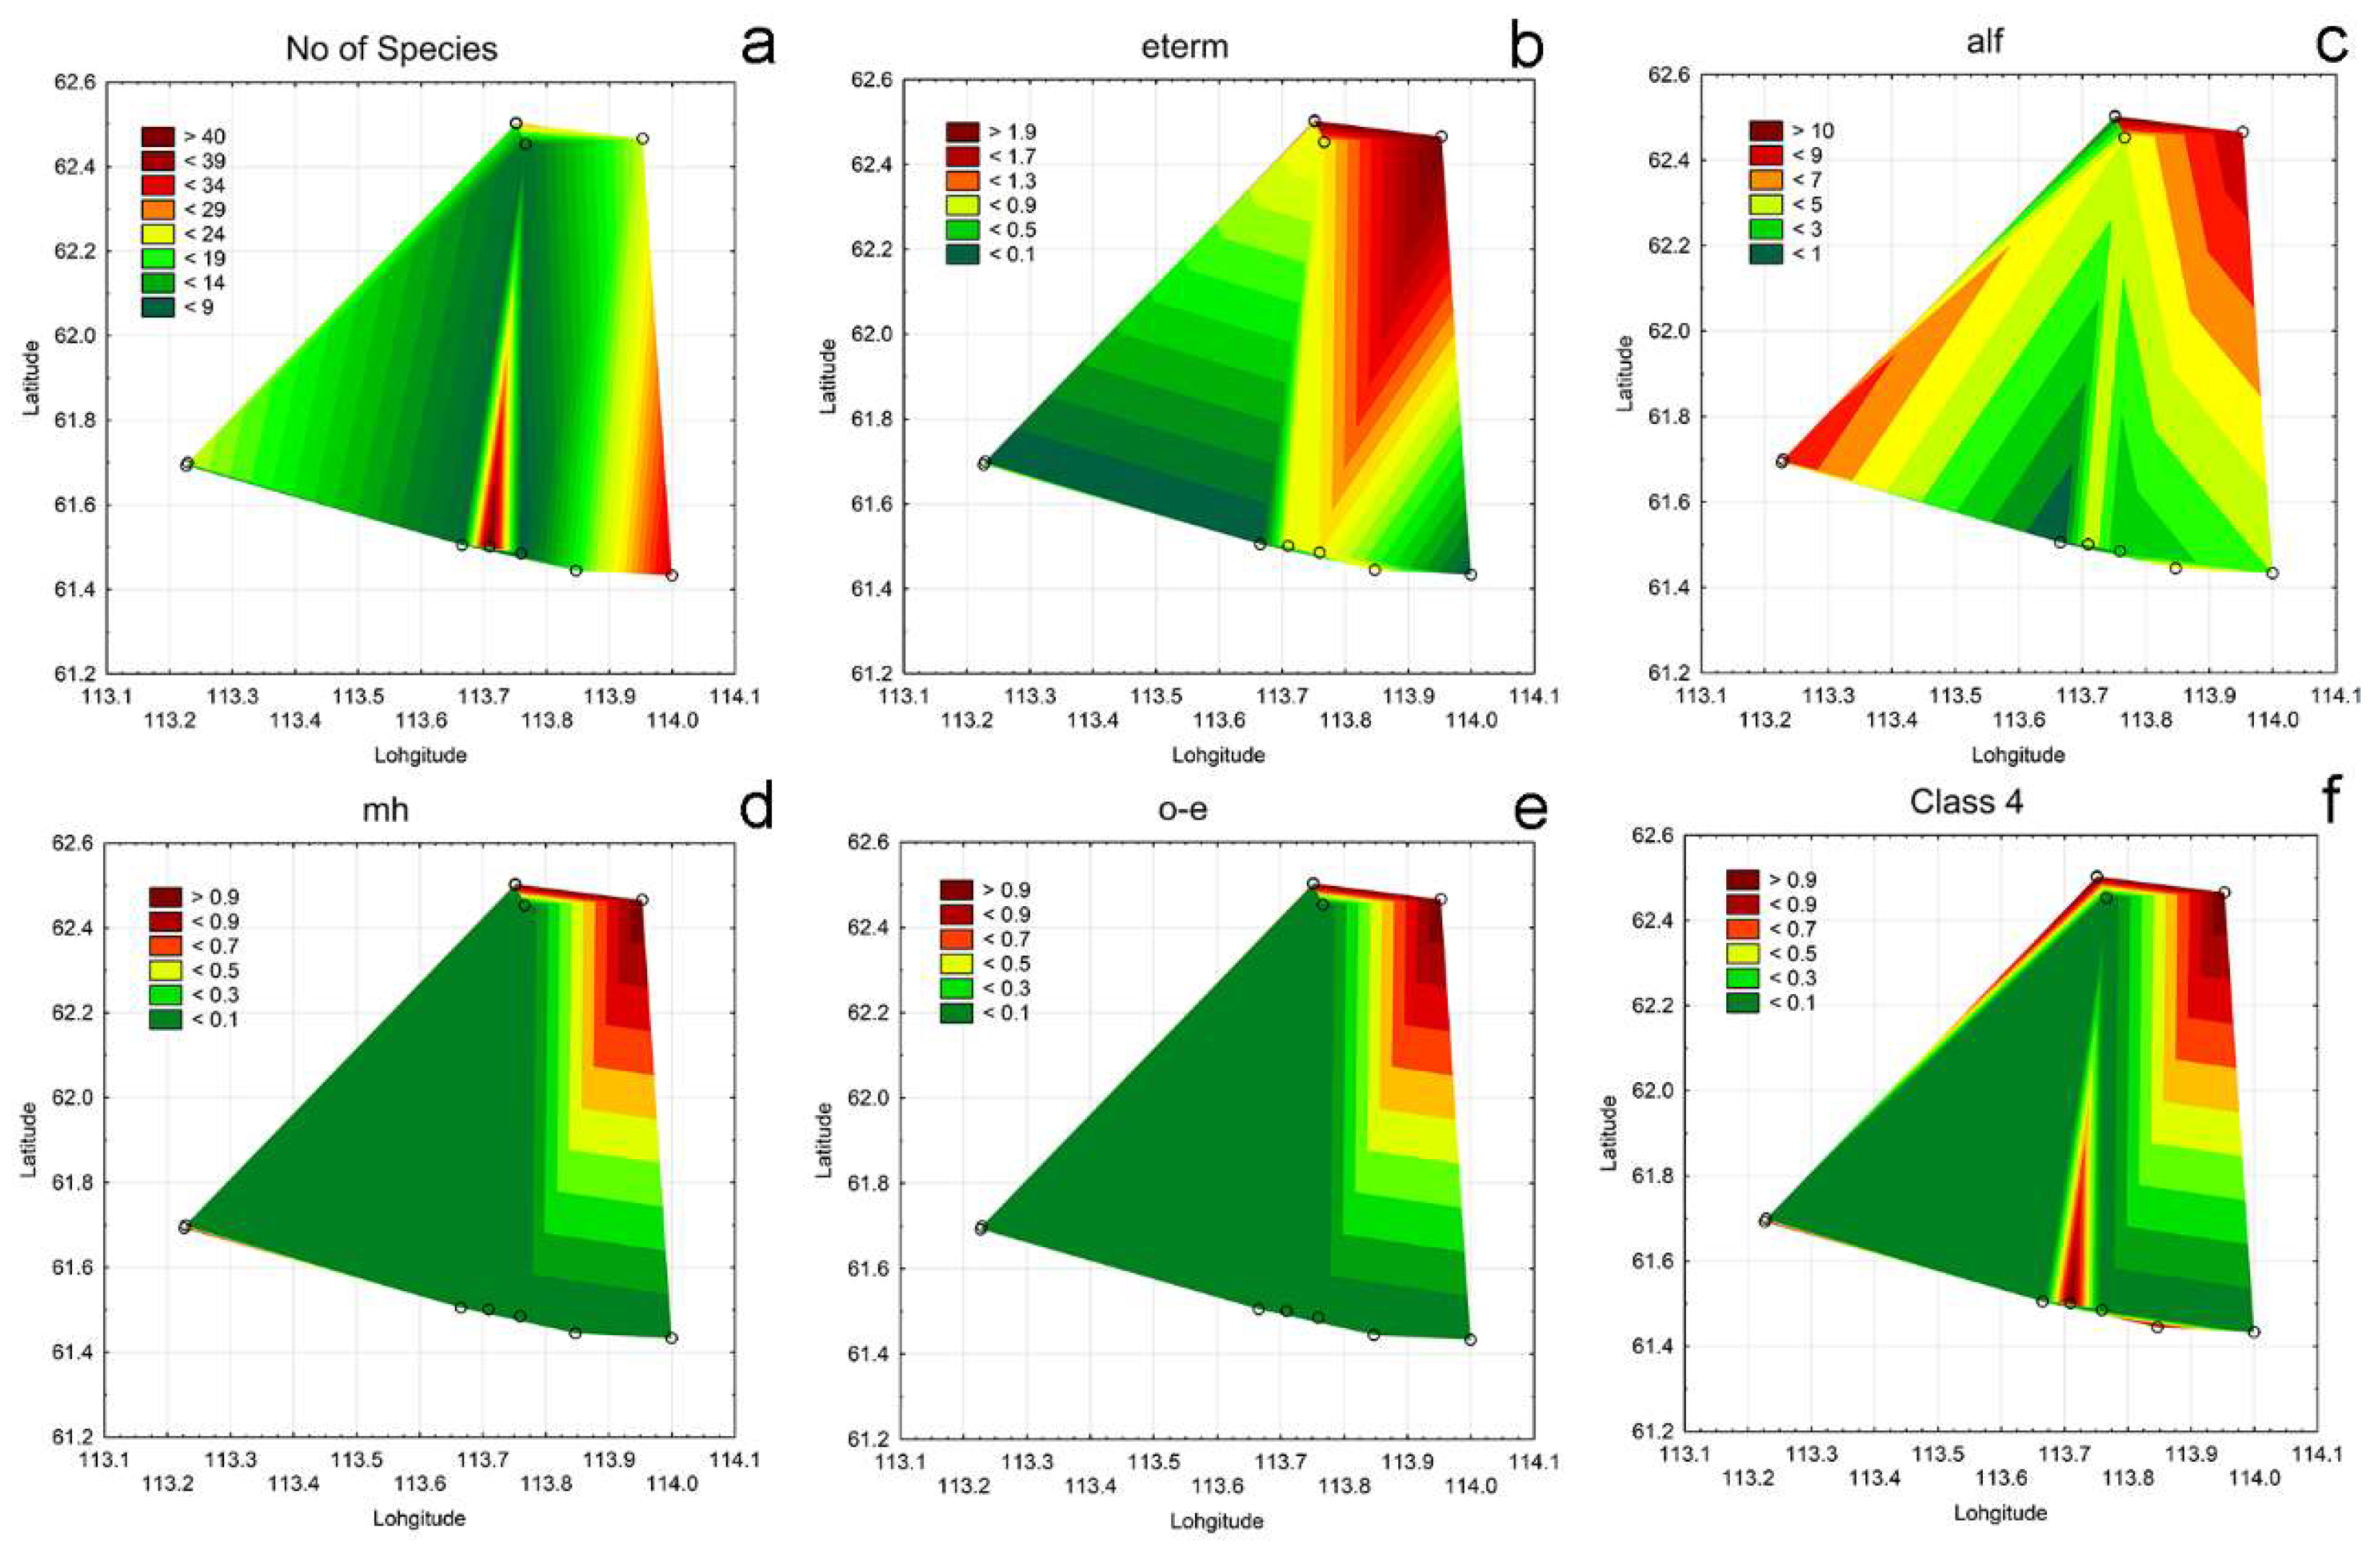
3.4. Ecological Mapping
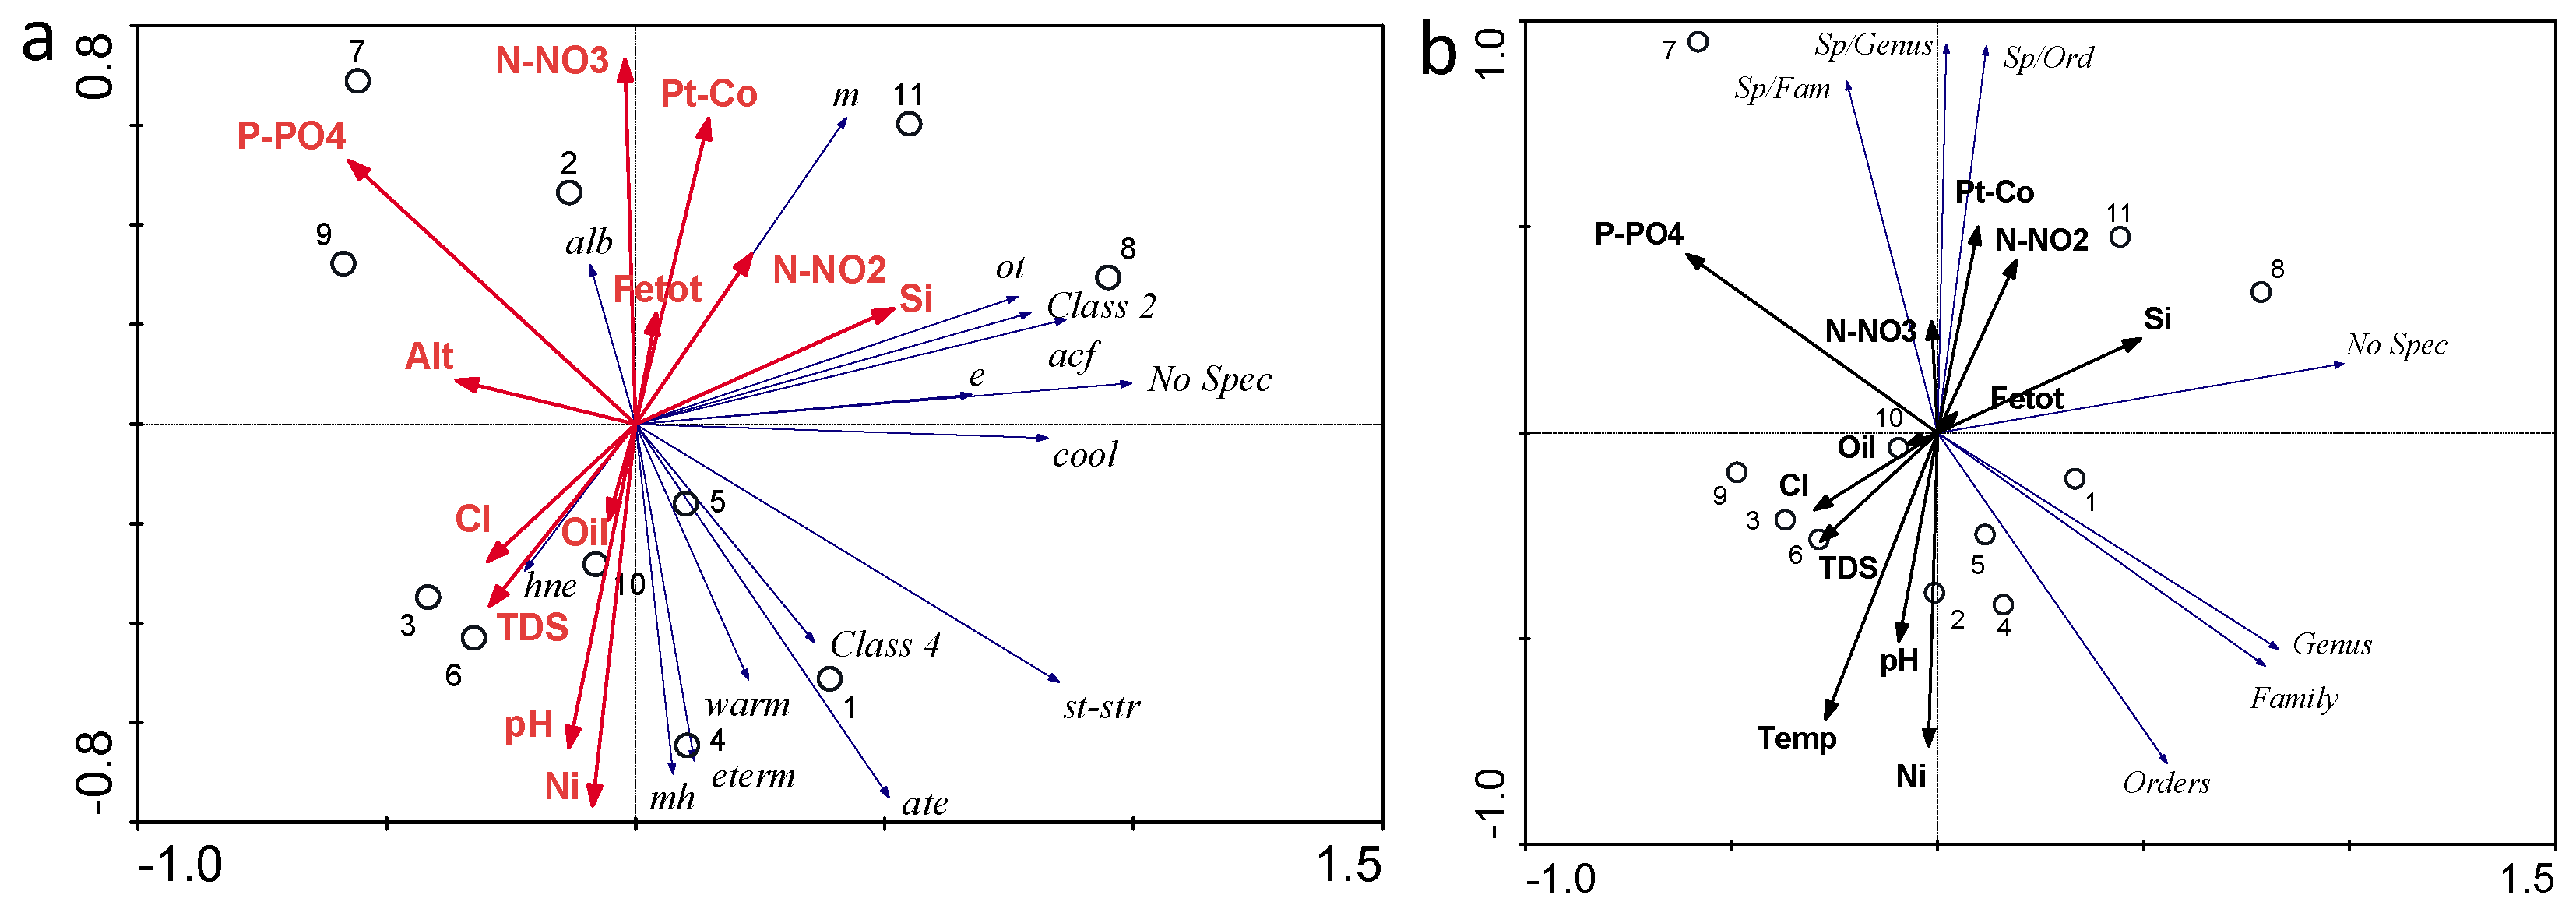
3.5. Species–Environments Relationship Analysis
4. Discussion
5. Conclusions
Author Contributions
Funding
Institutional Review Board Statement
Data Availability Statement
Acknowledgments
Conflicts of Interest
Appendix A

| Taxa | 1 | 2 | 3 | 4 | 5 | 6 | 7 | 8 | 9 | 10 | 11 |
|---|---|---|---|---|---|---|---|---|---|---|---|
| Achnanthidium minutissimum (Kützing) Czarnecki | 0 | 1 | 0 | 1 | 0 | 0 | 0 | 0 | 1 | 0 | 0 |
| Amphipleura pellucida (Kützing) Kützing | 0 | 0 | 0 | 0 | 1 | 0 | 0 | 0 | 0 | 0 | 0 |
| Asterionella formosa Hassall | 1 | 0 | 1 | 0 | 0 | 1 | 0 | 0 | 0 | 0 | 0 |
| Aulacoseira ambigua (Grunow) Simonsen | 0 | 0 | 0 | 1 | 0 | 0 | 0 | 0 | 0 | 1 | 0 |
| Aulacoseira alpigena (Grunow) Krammer | 1 | 1 | 1 | 0 | 0 | 0 | 0 | 0 | 0 | 1 | 1 |
| Aulacoseira islandica (O.Müller) Simonsen | 1 | 0 | 0 | 1 | 0 | 0 | 0 | 0 | 0 | 0 | 0 |
| Aulacoseira italica (Ehrenberg) Simonsen | 0 | 0 | 0 | 0 | 1 | 0 | 0 | 0 | 0 | 0 | 0 |
| Aulacoseira pusilla (F.Meister) A.Tuji & A.Houki | 1 | 0 | 0 | 0 | 0 | 0 | 0 | 1 | 1 | 1 | 0 |
| Aulacoseira subarctica (O.Müller) E.Y.Haworth | 1 | 0 | 0 | 1 | 0 | 0 | 0 | 0 | 0 | 0 | 0 |
| Aulacoseira valida (Grunow) Krammer | 0 | 0 | 0 | 0 | 1 | 0 | 0 | 0 | 0 | 0 | 0 |
| Boreozonacola hustedtii Lange-Bertalot, Kulikovskiy & Witkowski | 0 | 0 | 0 | 0 | 0 | 0 | 0 | 1 | 0 | 0 | 0 |
| Brachysira brebissonii R.Ross | 0 | 0 | 1 | 1 | 0 | 0 | 0 | 0 | 0 | 0 | 0 |
| Caloneis silicula var. elliptica (Frenguelli) Frenguelli | 0 | 1 | 0 | 0 | 0 | 0 | 0 | 0 | 0 | 0 | 0 |
| Caloneis placentula Ehrenberg | 0 | 0 | 0 | 0 | 1 | 0 | 0 | 0 | 0 | 1 | 0 |
| Cocconeis lineata Ehrenberg | 1 | 0 | 0 | 0 | 0 | 0 | 0 | 0 | 0 | 0 | 0 |
| Craticula ambigua (Ehrenberg) D.G.Mann | 0 | 0 | 0 | 0 | 0 | 0 | 0 | 1 | 0 | 0 | 0 |
| Cyclostephanos dubius (Hustedt) Round | 1 | 0 | 0 | 0 | 0 | 0 | 0 | 0 | 0 | 0 | 0 |
| Cyclotella distinguenda Hustedt | 0 | 0 | 0 | 1 | 0 | 0 | 0 | 0 | 1 | 0 | 1 |
| Cymbella neogena (Grunow) Krammer | 0 | 0 | 0 | 0 | 1 | 0 | 0 | 0 | 0 | 0 | 0 |
| Cymbella cymbiformis C.Agardh | 0 | 0 | 1 | 0 | 1 | 0 | 0 | 0 | 0 | 0 | 0 |
| Cymbella sp. | 1 | 0 | 0 | 0 | 0 | 0 | 0 | 0 | 0 | 0 | 0 |
| Cymbopleura fluminea (R.M.Patrick & Freese) Lange-Bertalot & Krammer ex Lange-Bertalot & Genkal | 0 | 0 | 0 | 0 | 0 | 0 | 0 | 1 | 0 | 0 | 1 |
| Cymbopleura apiculata Krammer | 0 | 0 | 0 | 0 | 0 | 0 | 0 | 1 | 0 | 0 | 0 |
| Cymbopleura subcuspidata (Krammer) Krammer | 0 | 1 | 0 | 0 | 0 | 0 | 0 | 0 | 0 | 0 | 0 |
| Cymbopleura tynnii (Krammer) Krammer | 0 | 0 | 0 | 0 | 0 | 0 | 0 | 1 | 0 | 0 | 0 |
| Diploneis cf. fontanella Lange-Bertalot | 0 | 0 | 0 | 0 | 0 | 0 | 0 | 1 | 0 | 0 | 0 |
| Diploneis ovalis (Hilse) Cleve | 0 | 0 | 0 | 0 | 0 | 0 | 0 | 1 | 0 | 0 | 0 |
| Discostella stelligera (Cleve & Grunow) Houk & Klee | 0 | 0 | 0 | 1 | 0 | 0 | 0 | 0 | 0 | 0 | 0 |
| Encyonema silesiacum (Bleisch) D.G.Mann | 0 | 0 | 0 | 0 | 1 | 0 | 0 | 0 | 0 | 0 | 0 |
| Encyonema minutum (Hilse) D.G.Mann | 0 | 0 | 0 | 0 | 0 | 0 | 0 | 0 | 0 | 0 | 1 |
| Encyonema cf. leibleinii (C.Agardh) W.J.Silva, R.Jahn, T.A.V.Ludwig & M.Menezes | 0 | 1 | 0 | 0 | 0 | 0 | 0 | 0 | 0 | 0 | 0 |
| Entomoneis ornata (Bailey) Reimer | 0 | 0 | 0 | 0 | 0 | 1 | 0 | 0 | 0 | 0 | 0 |
| Eunotia pectinalis (Kützing) Rabenhorst | 0 | 0 | 0 | 0 | 1 | 1 | 0 | 0 | 0 | 0 | 0 |
| Eunotia bidens Ehrenberg | 0 | 1 | 0 | 0 | 0 | 0 | 0 | 1 | 0 | 0 | 1 |
| Eunotia bilunaris (Ehrenberg) Schaarschmidt | 0 | 0 | 0 | 0 | 0 | 0 | 0 | 0 | 1 | 1 | 1 |
| Eunotia boreotenuis Nörpel-Schempp & Lange-Bertalot | 0 | 0 | 0 | 0 | 0 | 0 | 0 | 0 | 0 | 1 | 0 |
| Eunotia curtagrunowii Nörpel-Schempp & Lange-Bertalot | 0 | 0 | 0 | 0 | 0 | 0 | 0 | 1 | 0 | 0 | 0 |
| Eunotia genuflexa Nörpel-Schempp | 0 | 0 | 0 | 0 | 0 | 0 | 0 | 1 | 0 | 0 | 0 |
| Eunotia mucophila (Lange-Bertalot, Nörpel-Schempp & Alles) Lange-Bertalot | 0 | 0 | 0 | 0 | 0 | 0 | 0 | 0 | 0 | 0 | 1 |
| Eunotia praerupta Ehrenberg | 0 | 0 | 0 | 0 | 0 | 0 | 0 | 1 | 0 | 0 | 0 |
| Eunotia scandiorussica Kulikovskiy, Lange-Bertalot, Genkal & Witkowski | 0 | 0 | 0 | 0 | 0 | 0 | 0 | 0 | 0 | 0 | 1 |
| Eunotia septentrionalis Østrup | 0 | 0 | 0 | 0 | 0 | 0 | 0 | 1 | 0 | 1 | 1 |
| Eunotia superbidens Lange-Bertalot | 0 | 0 | 0 | 0 | 0 | 0 | 0 | 0 | 0 | 0 | 1 |
| Fragilaria radians (Kützing) D.M.Williams & Round | 0 | 0 | 0 | 1 | 0 | 0 | 0 | 0 | 0 | 0 | 0 |
| Fragilaria aequalis Heiberg | 0 | 0 | 0 | 0 | 0 | 1 | 0 | 0 | 1 | 0 | 0 |
| Fragilariforma mesolepta (Rabenhorst) Kharitonov | 0 | 0 | 0 | 0 | 1 | 1 | 0 | 0 | 0 | 0 | 0 |
| Fragilaria rumpens (Kützing) G.W.F.Carlson | 1 | 0 | 0 | 0 | 0 | 0 | 0 | 0 | 0 | 0 | 0 |
| Fragilaris sp. | 0 | 0 | 0 | 0 | 0 | 1 | 0 | 0 | 1 | 0 | 0 |
| Frustulia crassinervia (Brébisson ex W.Smith) Lange-Bertalot & Krammer | 0 | 1 | 0 | 0 | 1 | 0 | 0 | 0 | 0 | 0 | 0 |
| Gomphonema naviculoides W.Smith | 0 | 0 | 0 | 0 | 0 | 1 | 0 | 0 | 0 | 0 | 0 |
| Gomphonema acuminatum Ehrenberg | 0 | 0 | 0 | 0 | 1 | 0 | 0 | 0 | 0 | 0 | 0 |
| Gomphonema angusticephalum E.Reichardt & Lange-Bertalot | 1 | 0 | 0 | 0 | 0 | 0 | 0 | 0 | 0 | 0 | 0 |
| Gomphonema brebissonii Kützing | 0 | 0 | 0 | 0 | 1 | 0 | 0 | 0 | 0 | 0 | 1 |
| Gomphonema micropus Kützing | 0 | 1 | 0 | 0 | 0 | 0 | 0 | 0 | 0 | 0 | 0 |
| Gomphonema pala E.Reichardt | 0 | 0 | 0 | 0 | 1 | 0 | 0 | 0 | 0 | 0 | 0 |
| Gomphonema pelisteriense Levkov, Mitic-Kopanja & E.Reichardt | 0 | 0 | 0 | 0 | 0 | 0 | 0 | 0 | 0 | 0 | 1 |
| Gomphonema truncatum Ehrenberg | 0 | 0 | 0 | 0 | 1 | 0 | 0 | 0 | 0 | 0 | 0 |
| Gomphonema sp. | 1 | 1 | 0 | 0 | 1 | 0 | 0 | 1 | 0 | 0 | 1 |
| Gyrosigma acuminatum (Kützing) Rabenhorst | 0 | 0 | 1 | 1 | 0 | 0 | 0 | 0 | 0 | 0 | 0 |
| Lindavia comta (Kützing) T.Nakov & al. | 1 | 1 | 0 | 1 | 1 | 0 | 0 | 0 | 0 | 0 | 0 |
| Kobayasiella parasubtilissima (H.Kobayasi & T.Nagumo) Lange-Bertalot | 0 | 0 | 0 | 0 | 0 | 0 | 1 | 0 | 0 | 0 | 0 |
| Luticola goeppertiana (Bleisch) D.G.Mann ex Rarick, S.Wu, S.S.Lee & Edlund | 0 | 1 | 1 | 1 | 0 | 0 | 0 | 0 | 0 | 0 | 0 |
| Luticola acidoclinata Lange-Bertalot | 0 | 1 | 0 | 0 | 0 | 0 | 0 | 0 | 0 | 0 | 1 |
| Luticola permuticopsis Kopalová & Van de Vijver | 1 | 1 | 0 | 0 | 0 | 0 | 0 | 0 | 0 | 0 | 0 |
| Luticola sp. | 0 | 0 | 0 | 0 | 0 | 0 | 0 | 0 | 0 | 0 | 1 |
| Mastogloia sp. | 0 | 1 | 1 | 0 | 0 | 0 | 0 | 0 | 0 | 0 | 0 |
| Meridion circulare (Greville) C.Agardh | 0 | 0 | 0 | 0 | 0 | 0 | 0 | 1 | 0 | 0 | 0 |
| Navicula salinicola Hustedt | 0 | 0 | 0 | 1 | 0 | 0 | 0 | 0 | 0 | 0 | 0 |
| Navicula antonii Lange-Bertalot | 1 | 0 | 0 | 0 | 1 | 0 | 0 | 0 | 0 | 0 | 0 |
| Navicula capitatoradiata H.Germain ex Gasse | 1 | 0 | 0 | 0 | 0 | 1 | 0 | 0 | 0 | 0 | 0 |
| Navicula cryptocephala Kützing | 1 | 0 | 0 | 0 | 0 | 0 | 0 | 1 | 0 | 0 | 1 |
| Cymbella lanceolata C.Agardh | 0 | 0 | 0 | 0 | 0 | 0 | 0 | 0 | 0 | 0 | 1 |
| Navicula moenofranconica Lange-Bertalot | 1 | 0 | 0 | 0 | 0 | 0 | 0 | 0 | 0 | 0 | 0 |
| Navicula radiosa Kützing | 1 | 0 | 1 | 0 | 1 | 0 | 0 | 0 | 0 | 0 | 0 |
| Navicula rostellata Kützing | 1 | 0 | 0 | 0 | 0 | 0 | 0 | 0 | 0 | 0 | 0 |
| Navicula semenicula Kulikovskiy, Lange-Bertalot & Metzeltin | 0 | 0 | 0 | 1 | 0 | 0 | 0 | 0 | 0 | 0 | 0 |
| Navicula sp. | 0 | 0 | 0 | 0 | 0 | 0 | 0 | 0 | 0 | 0 | 1 |
| Neidium hercynicum Ant.Mayer | 0 | 0 | 0 | 0 | 0 | 0 | 0 | 1 | 0 | 0 | 0 |
| Neidium affine (Ehrenberg) Pfitzer | 0 | 0 | 0 | 0 | 0 | 0 | 0 | 1 | 0 | 0 | 0 |
| Neidium ampliatum (Ehrenberg) Krammer | 0 | 0 | 0 | 0 | 0 | 0 | 0 | 1 | 0 | 0 | 0 |
| Neidium bisulcatum (Lagerstedt) Cleve | 0 | 0 | 0 | 0 | 0 | 0 | 0 | 1 | 0 | 1 | 0 |
| Neidium longiceps (W.Gregory) R.Ross | 0 | 0 | 0 | 0 | 0 | 0 | 0 | 1 | 0 | 0 | 0 |
| Neidium sp. | 0 | 0 | 0 | 0 | 0 | 0 | 0 | 1 | 0 | 0 | 0 |
| Nitzschia acidoclinata Lange-Bertalot | 0 | 1 | 0 | 0 | 0 | 0 | 0 | 1 | 0 | 0 | 0 |
| Nitzschia alpina Hustedt | 1 | 0 | 0 | 0 | 0 | 0 | 0 | 0 | 0 | 0 | 0 |
| Nitzschia archibaldii Lange-Bertalot | 0 | 0 | 0 | 0 | 0 | 0 | 0 | 1 | 0 | 1 | 1 |
| Nitzschia bacillum Hustedt | 1 | 0 | 0 | 0 | 0 | 0 | 0 | 0 | 0 | 0 | 0 |
| Nitzschia inconspicua Grunow | 0 | 0 | 0 | 0 | 0 | 0 | 0 | 1 | 0 | 0 | 0 |
| Nitzschia perminuta Grunow | 0 | 0 | 0 | 0 | 0 | 0 | 0 | 0 | 0 | 1 | 1 |
| Nitzschia vermicularis (Kützing) Hantzsch | 0 | 0 | 0 | 1 | 0 | 0 | 0 | 0 | 0 | 0 | 0 |
| Nitzschia sp. | 0 | 0 | 0 | 0 | 0 | 0 | 0 | 1 | 0 | 0 | 0 |
| Odontidium mesodon (Ehrenberg) Kützing | 0 | 0 | 0 | 0 | 0 | 1 | 0 | 0 | 0 | 0 | 0 |
| Pantocsekiella sp. | 0 | 0 | 0 | 0 | 0 | 1 | 0 | 0 | 0 | 0 | 0 |
| Pinnularia cf. globiceps var. linearis Krammer | 0 | 0 | 0 | 1 | 0 | 0 | 0 | 0 | 0 | 0 | 0 |
| Pinnularia acrosphaeria W.Smith | 0 | 0 | 0 | 0 | 0 | 0 | 0 | 1 | 0 | 0 | 0 |
| Pinnularia anglica Krammer | 0 | 0 | 0 | 0 | 0 | 0 | 0 | 0 | 0 | 0 | 1 |
| Pinnularia borealis var. scalaris (Ehrenberg) Rabenhorst | 0 | 0 | 0 | 0 | 0 | 0 | 0 | 0 | 0 | 0 | 1 |
| Pinnularia crucifera A.Cleve | 0 | 0 | 0 | 0 | 0 | 0 | 1 | 0 | 0 | 1 | 1 |
| Pinnularia eifeliana (Krammer) Krammer | 1 | 1 | 0 | 0 | 0 | 0 | 0 | 0 | 0 | 0 | 0 |
| Pinnularia flexuosa Cleve | 0 | 0 | 0 | 0 | 0 | 0 | 1 | 0 | 0 | 0 | 0 |
| Pinnularia ilkaschoenfelderae Krammer | 0 | 0 | 0 | 0 | 0 | 0 | 0 | 0 | 0 | 0 | 1 |
| Pinnularia isselana Krammer | 0 | 0 | 0 | 0 | 0 | 0 | 0 | 1 | 0 | 0 | 0 |
| Pinnularia lailaensis Foged | 0 | 0 | 0 | 0 | 0 | 0 | 0 | 0 | 0 | 1 | 0 |
| Pinnularia neomajor Krammer | 0 | 0 | 0 | 0 | 1 | 0 | 1 | 1 | 0 | 0 | 1 |
| Pinnularia obscura Krasske | 0 | 0 | 0 | 0 | 0 | 0 | 0 | 0 | 0 | 0 | 1 |
| Pinnularia ovata Krammer | 0 | 0 | 0 | 0 | 0 | 0 | 1 | 0 | 0 | 0 | 0 |
| Pinnularia pisciculus Ehrenberg | 0 | 0 | 0 | 0 | 1 | 0 | 0 | 0 | 0 | 0 | 1 |
| Pinnularia sinistra Krammer | 0 | 0 | 0 | 0 | 0 | 0 | 1 | 0 | 0 | 1 | 1 |
| Pinnularia spitsbergensis Cleve | 0 | 0 | 0 | 0 | 0 | 0 | 1 | 0 | 0 | 0 | 0 |
| Pinnularia stomatophora (Grunow) Cleve | 0 | 0 | 0 | 0 | 0 | 0 | 0 | 1 | 0 | 0 | 0 |
| Pinnularia subgibba var. sublinearis Krammer | 0 | 0 | 0 | 0 | 0 | 0 | 0 | 0 | 0 | 0 | 1 |
| Pinnularia subrostrata (A.Cleve) A.Cleve | 0 | 0 | 0 | 0 | 0 | 0 | 1 | 0 | 0 | 0 | 0 |
| Pinnularia undula (Schumann) Krammer | 0 | 0 | 0 | 0 | 0 | 0 | 0 | 1 | 0 | 0 | 0 |
| Pinnularia viridis (Nitzsch) Ehrenberg | 0 | 0 | 0 | 0 | 0 | 0 | 1 | 0 | 0 | 1 | 1 |
| Pinnularia sp. | 0 | 0 | 0 | 1 | 0 | 0 | 0 | 0 | 0 | 0 | 0 |
| Placoneis symmetrica (Hustedt) Lange-Bertalot | 0 | 0 | 0 | 0 | 0 | 0 | 0 | 0 | 0 | 0 | 1 |
| Platessa conspicua (Ant.Mayer) Lange-Bertalot | 0 | 0 | 0 | 0 | 1 | 0 | 0 | 0 | 0 | 0 | 0 |
| Psammothidium subatomoides (Hustedt) Bukhtiyarova & Round | 0 | 0 | 0 | 1 | 0 | 0 | 0 | 0 | 0 | 0 | 0 |
| Pseudostaurosira linearis (Pantocsek) E.A.Morales, Buczkó & Ector | 1 | 0 | 0 | 0 | 0 | 0 | 0 | 0 | 0 | 0 | 0 |
| Punctastriata subalpina C.E.Wetzel & Ector | 0 | 0 | 0 | 0 | 0 | 0 | 0 | 0 | 1 | 0 | 0 |
| Reimeria sinuata (W.Gregory) Kociolek & Stoermer | 1 | 0 | 0 | 0 | 0 | 0 | 0 | 0 | 0 | 0 | 0 |
| Rhoicosphenia abbreviata (C.Agardh) Lange-Bertalot | 0 | 0 | 0 | 0 | 0 | 0 | 0 | 0 | 0 | 1 | 0 |
| Epithemia gibba (Ehrenberg) Kützing | 0 | 0 | 1 | 1 | 1 | 0 | 0 | 0 | 0 | 0 | 0 |
| Sellaphora pseudopupula (Krasske) Lange-Bertalot | 0 | 0 | 0 | 0 | 0 | 0 | 0 | 1 | 0 | 0 | 0 |
| Sellaphora parapupula Lange-Bertalot | 0 | 0 | 0 | 0 | 0 | 0 | 0 | 1 | 1 | 0 | 0 |
| Sellaphora laevissima (Kützing) D.G.Mann | 0 | 0 | 0 | 0 | 0 | 0 | 0 | 1 | 0 | 0 | 0 |
| Stauroneis amphicephala Kützing | 0 | 0 | 0 | 1 | 0 | 0 | 0 | 1 | 0 | 0 | 0 |
| Stauroneis agrestis J.B.Petersen | 0 | 1 | 0 | 0 | 0 | 0 | 0 | 0 | 0 | 0 | 0 |
| Stauroneis anceps Ehrenberg | 1 | 0 | 0 | 0 | 0 | 0 | 0 | 1 | 0 | 0 | 0 |
| Stauroneis kuelbsii Lange-Bertalot | 0 | 0 | 0 | 0 | 0 | 0 | 0 | 0 | 0 | 0 | 1 |
| Stauroneis phoenicenteron (Nitzsch) Ehrenberg | 0 | 1 | 0 | 0 | 0 | 0 | 0 | 1 | 0 | 1 | 1 |
| Staurosira venter (Ehrenberg) Cleve & J.D.Möller | 1 | 0 | 0 | 0 | 0 | 0 | 0 | 0 | 0 | 0 | 0 |
| Stenopterobia anceps (F.W.Lewis) Brébisson ex Van Heurck | 0 | 0 | 0 | 0 | 0 | 0 | 0 | 1 | 0 | 0 | 0 |
| Stephanodiscus hantzschii Grunow | 0 | 0 | 0 | 1 | 0 | 0 | 0 | 0 | 0 | 0 | 0 |
| Tabellaria flocculosa (Roth) Kützing | 1 | 0 | 1 | 1 | 0 | 1 | 0 | 1 | 0 | 1 | 0 |
| Ulnaria acus (Kützing) Aboal | 0 | 0 | 0 | 1 | 0 | 1 | 0 | 0 | 0 | 1 | 0 |
| Ulnaria ulna (Nitzsch) Compère | 0 | 0 | 0 | 0 | 1 | 1 | 0 | 1 | 0 | 0 | 0 |
| Order | St. 1 | St. 2 | St. 3 | St. 4 | St. 5 | St. 6 | St. 7 | St. 8 | St. 9 | St. 10 | St. 11 |
|---|---|---|---|---|---|---|---|---|---|---|---|
| Achnanthales | 1 | 1 | 0 | 2 | 1 | 0 | 0 | 0 | 1 | 0 | 0 |
| Aulacoseirales | 4 | 1 | 1 | 3 | 1 | 0 | 0 | 1 | 1 | 3 | 1 |
| Bacillariales | 2 | 1 | 0 | 1 | 0 | 0 | 0 | 5 | 0 | 2 | 2 |
| Cymbellales | 5 | 4 | 1 | 0 | 8 | 1 | 0 | 6 | 0 | 1 | 8 |
| Eunotiales | 0 | 1 | 0 | 0 | 1 | 1 | 0 | 5 | 1 | 3 | 6 |
| Fragilariales | 3 | 0 | 0 | 1 | 1 | 4 | 0 | 0 | 3 | 0 | 0 |
| Licmophorales | 0 | 0 | 0 | 1 | 1 | 2 | 0 | 1 | 0 | 1 | 0 |
| Mastogloiales | 0 | 1 | 1 | 0 | 0 | 0 | 0 | 0 | 0 | 0 | 0 |
| Naviculales | 9 | 8 | 4 | 8 | 7 | 1 | 9 | 22 | 1 | 7 | 16 |
| Rhabdonematales | 2 | 0 | 2 | 1 | 0 | 2 | 0 | 2 | 0 | 1 | 0 |
| Rhopalodiales | 0 | 0 | 1 | 1 | 1 | 0 | 0 | 0 | 0 | 0 | 0 |
| Stephanodiscales | 2 | 1 | 0 | 4 | 1 | 1 | 0 | 0 | 1 | 0 | 1 |
| Surirellales | 0 | 0 | 0 | 0 | 0 | 1 | 0 | 1 | 0 | 0 | 0 |
| No of Species | 28 | 18 | 10 | 22 | 22 | 12 | 9 | 42 | 8 | 18 | 34 |
| No of Orders | 8 | 8 | 6 | 9 | 9 | 8 | 1 | 8 | 6 | 7 | 6 |
| Sp/Order | 3.5 | 2.3 | 1.7 | 2.4 | 2.4 | 1.5 | 9.0 | 5.3 | 1.3 | 2.6 | 5.7 |
| Family | St. 1 | St. 2 | St. 3 | St. 4 | St. 5 | St. 6 | St. 7 | St. 8 | St. 9 | St. 10 | St. 11 |
|---|---|---|---|---|---|---|---|---|---|---|---|
| Achnanthidiaceae | 0 | 1 | 0 | 2 | 1 | 0 | 0 | 0 | 1 | 0 | 0 |
| Amphipleuraceae | 0 | 1 | 0 | 0 | 2 | 0 | 0 | 0 | 0 | 0 | 0 |
| Aulacoseiraceae | 4 | 1 | 1 | 3 | 2 | 0 | 0 | 1 | 1 | 3 | 1 |
| Bacillariaceae | 2 | 1 | 0 | 1 | 0 | 0 | 0 | 5 | 0 | 2 | 2 |
| Brachysiraceae | 0 | 0 | 1 | 1 | 0 | 0 | 0 | 0 | 0 | 0 | 0 |
| Cocconeidaceae | 1 | 0 | 0 | 0 | 0 | 0 | 0 | 0 | 0 | 0 | 0 |
| Cymbellaceae | 1 | 1 | 1 | 0 | 2 | 0 | 0 | 3 | 0 | 0 | 3 |
| Diadesmidaceae | 1 | 3 | 1 | 1 | 0 | 0 | 0 | 0 | 0 | 0 | 2 |
| Diploneidaceae | 0 | 0 | 0 | 0 | 0 | 0 | 0 | 2 | 0 | 0 | 0 |
| Entomoneidaceae | 0 | 0 | 0 | 0 | 0 | 1 | 0 | 0 | 0 | 0 | 0 |
| Eunotiaceae | 0 | 1 | 0 | 0 | 1 | 1 | 0 | 4 | 1 | 3 | 6 |
| Fragilariaceae | 1 | 0 | 0 | 1 | 1 | 4 | 0 | 0 | 3 | 0 | 0 |
| Gomphonemataceae | 4 | 3 | 0 | 0 | 6 | 1 | 0 | 3 | 0 | 0 | 5 |
| Mastogloiaceae | 0 | 1 | 1 | 0 | 0 | 0 | 0 | 0 | 0 | 0 | 0 |
| Naviculaceae | 6 | 1 | 2 | 3 | 3 | 1 | 1 | 2 | 0 | 1 | 2 |
| Neidiaceae | 0 | 0 | 0 | 0 | 0 | 0 | 0 | 6 | 0 | 1 | 0 |
| Pinnulariaceae | 1 | 1 | 0 | 2 | 2 | 0 | 8 | 5 | 0 | 4 | 10 |
| Rhoicospheniaceae | 0 | 0 | 0 | 0 | 0 | 0 | 0 | 0 | 0 | 1 | 0 |
| Rhopalodiaceae | 0 | 0 | 1 | 1 | 1 | 0 | 0 | 0 | 0 | 0 | 0 |
| Sellaphoraceae | 0 | 0 | 0 | 0 | 0 | 0 | 0 | 3 | 1 | 0 | 0 |
| Stauroneidaceae | 1 | 2 | 0 | 1 | 0 | 0 | 0 | 4 | 0 | 1 | 2 |
| Staurosiraceae | 2 | 0 | 0 | 0 | 0 | 0 | 0 | 0 | 0 | 0 | 0 |
| Stephanodiscaceae | 2 | 1 | 0 | 4 | 1 | 1 | 0 | 0 | 1 | 0 | 1 |
| Surirellaceae | 0 | 0 | 0 | 0 | 0 | 0 | 0 | 1 | 0 | 0 | 0 |
| Tabellariaceae | 2 | 0 | 2 | 1 | 0 | 2 | 0 | 2 | 0 | 1 | 0 |
| Ulnariaceae | 0 | 0 | 0 | 1 | 1 | 2 | 0 | 1 | 0 | 1 | 0 |
| No of Species | 28 | 18 | 10 | 22 | 22 | 13 | 9 | 42 | 8 | 18 | 34 |
| No of Family | 13 | 14 | 8 | 13 | 12 | 8 | 1 | 14 | 6 | 10 | 10 |
| Sp/Family | 2.2 | 1.3 | 1.3 | 1.7 | 1.8 | 1.6 | 9.0 | 3.0 | 1.3 | 1.8 | 3.4 |
| Genus | St. 1 | St. 2 | St. 3 | St. 4 | St. 5 | St. 6 | St. 7 | St. 8 | St. 9 | St. 10 | St. 11 |
|---|---|---|---|---|---|---|---|---|---|---|---|
| Achnanthidium | 0 | 1 | 0 | 1 | 0 | 0 | 0 | 0 | 1 | 0 | 0 |
| Amphipleura | 0 | 0 | 0 | 0 | 1 | 0 | 0 | 0 | 0 | 0 | 0 |
| Asterionella | 1 | 0 | 1 | 0 | 0 | 1 | 0 | 0 | 0 | 0 | 0 |
| Aulacoseira | 4 | 1 | 1 | 3 | 2 | 0 | 0 | 1 | 1 | 3 | 1 |
| Boreozonacola | 0 | 0 | 0 | 0 | 0 | 0 | 0 | 1 | 0 | 0 | 0 |
| Brachysira | 0 | 0 | 1 | 1 | 0 | 0 | 0 | 0 | 0 | 0 | 0 |
| Caloneis | 0 | 1 | 0 | 0 | 1 | 0 | 0 | 0 | 0 | 1 | 0 |
| Cocconeis | 1 | 0 | 0 | 0 | 0 | 0 | 0 | 0 | 0 | 0 | 0 |
| Craticula | 0 | 0 | 0 | 0 | 0 | 0 | 0 | 1 | 0 | 0 | 0 |
| Cyclostephanos | 1 | 0 | 0 | 0 | 0 | 0 | 0 | 0 | 0 | 0 | 0 |
| Cyclotella | 0 | 0 | 0 | 1 | 0 | 0 | 0 | 0 | 1 | 0 | 1 |
| Cymbella | 1 | 0 | 1 | 0 | 2 | 0 | 0 | 0 | 0 | 0 | 1 |
| Cymbopleura | 0 | 1 | 0 | 0 | 0 | 0 | 0 | 3 | 0 | 0 | 1 |
| Diploneis | 0 | 0 | 0 | 0 | 0 | 0 | 0 | 2 | 0 | 0 | 0 |
| Discostella | 0 | 0 | 0 | 1 | 0 | 0 | 0 | 0 | 0 | 0 | 0 |
| Encyonema | 0 | 1 | 0 | 0 | 1 | 0 | 0 | 0 | 0 | 0 | 1 |
| Entomoneis | 0 | 0 | 0 | 0 | 0 | 1 | 0 | 0 | 0 | 0 | 0 |
| Epithemia | 0 | 0 | 1 | 1 | 1 | 0 | 0 | 0 | 0 | 0 | 0 |
| Eunotia | 0 | 1 | 0 | 0 | 1 | 1 | 0 | 5 | 1 | 3 | 6 |
| Fragilaria | 1 | 0 | 0 | 1 | 0 | 2 | 0 | 0 | 2 | 0 | 0 |
| Fragilariforma | 0 | 0 | 0 | 0 | 1 | 1 | 0 | 0 | 0 | 0 | 0 |
| Frustulia | 0 | 1 | 0 | 0 | 1 | 0 | 0 | 0 | 0 | 0 | 0 |
| Gomphonema | 3 | 2 | 0 | 0 | 5 | 1 | 0 | 3 | 0 | 0 | 4 |
| Gyrosigma | 0 | 0 | 1 | 1 | 0 | 0 | 0 | 0 | 0 | 0 | 0 |
| Kobayasiella | 0 | 0 | 0 | 0 | 0 | 0 | 1 | 0 | 0 | 0 | 0 |
| Lindavia | 1 | 1 | 0 | 1 | 1 | 0 | 0 | 0 | 0 | 0 | 0 |
| Luticola | 1 | 3 | 1 | 1 | 0 | 0 | 0 | 0 | 0 | 0 | 2 |
| Mastogloia | 0 | 1 | 1 | 0 | 0 | 0 | 0 | 0 | 0 | 0 | 0 |
| Meridion | 0 | 0 | 0 | 0 | 0 | 0 | 0 | 1 | 0 | 0 | 0 |
| Navicula | 6 | 0 | 1 | 2 | 2 | 1 | 0 | 1 | 0 | 0 | 2 |
| Neidium | 0 | 0 | 0 | 0 | 0 | 0 | 0 | 6 | 0 | 1 | 0 |
| Nitzschia | 2 | 1 | 0 | 1 | 0 | 0 | 0 | 5 | 0 | 2 | 2 |
| Odontidium | 0 | 0 | 0 | 0 | 0 | 1 | 0 | 0 | 0 | 0 | 0 |
| Pantocsekiella | 0 | 0 | 0 | 0 | 0 | 1 | 0 | 0 | 0 | 0 | 0 |
| Pinnularia | 1 | 1 | 0 | 2 | 2 | 0 | 8 | 5 | 0 | 4 | 10 |
| Placoneis | 0 | 0 | 0 | 0 | 0 | 0 | 0 | 0 | 0 | 0 | 1 |
| Platessa | 0 | 0 | 0 | 0 | 1 | 0 | 0 | 0 | 0 | 0 | 0 |
| Psammothidium | 0 | 0 | 0 | 1 | 0 | 0 | 0 | 0 | 0 | 0 | 0 |
| Pseudostaurosira | 1 | 0 | 0 | 0 | 0 | 0 | 0 | 0 | 0 | 0 | 0 |
| Punctastriata | 0 | 0 | 0 | 0 | 0 | 0 | 0 | 0 | 1 | 0 | 0 |
| Reimeria | 1 | 0 | 0 | 0 | 0 | 0 | 0 | 0 | 0 | 0 | 0 |
| Rhoicosphenia | 0 | 0 | 0 | 0 | 0 | 0 | 0 | 0 | 0 | 1 | 0 |
| Sellaphora | 0 | 0 | 0 | 0 | 0 | 0 | 0 | 3 | 1 | 0 | 0 |
| Stauroneis | 1 | 2 | 0 | 1 | 0 | 0 | 0 | 3 | 0 | 1 | 2 |
| Staurosira | 1 | 0 | 0 | 0 | 0 | 0 | 0 | 0 | 0 | 0 | 0 |
| Stenopterobia | 0 | 0 | 0 | 0 | 0 | 0 | 0 | 1 | 0 | 0 | 0 |
| Stephanodiscus | 0 | 0 | 0 | 1 | 0 | 0 | 0 | 0 | 0 | 0 | 0 |
| Tabellaria | 1 | 0 | 1 | 1 | 0 | 1 | 0 | 1 | 0 | 1 | 0 |
| Ulnaria | 0 | 0 | 0 | 1 | 1 | 2 | 0 | 1 | 0 | 1 | 0 |
| No of Species | 28 | 18 | 10 | 22 | 22 | 13 | 9 | 42 | 8 | 18 | 34 |
| No of Genus | 17 | 14 | 10 | 18 | 15 | 11 | 2 | 17 | 7 | 10 | 13 |
| Sp/Genus | 1.6 | 1.3 | 1.0 | 1.2 | 1.5 | 1.2 | 4.5 | 2.5 | 1.1 | 1.7 | 2.6 |
| Taxa | HAB | T | OXY | pH | SAL | Index S | SAP | D | AUT-HET | TRO |
|---|---|---|---|---|---|---|---|---|---|---|
| Achnanthidium minutissimum (Kützing) Czarnecki | P-B | eterm | st-str | ind | i | 0.95 | b | es | ate | e |
| Amphipleura pellucida (Kützing) Kützing | P-B | - | st | alf | i | 0.8 | b | sp | ate | om |
| Asterionella formosa Hassall | P | temp | st-str | alf | i | 1.35 | b | sx | ate | me |
| Aulacoseira ambigua (Grunow) Simonsen | P | temp | st-str | alf | i | 1.7 | b-o | sp | ate | om |
| Aulacoseira alpigena (Grunow) Krammer | P-B | temp | st-str | alf | i | 0.8 | x-b | sp | ate | ot |
| Aulacoseira islandica (O.Müller) Simonsen | P-B | cool | st-str | ind | i | 2.0 | b | es | ate | o-e |
| Aulacoseira italica (Ehrenberg) Simonsen | P-B | cool | st-str | ind | i | 1.45 | b | es | ate | me |
| Aulacoseira pusilla (F.Meister) A.Tuji & A.Houki | P | - | - | alf | i | - | - | - | - | - |
| Aulacoseira subarctica (O.Müller) E.Y.Haworth | P | temp | st-str | alf | i | 1.7 | b-o | - | ats | om |
| Aulacoseira valida (Grunow) Krammer | P-B | - | - | alf | i | 1.3 | o | es | ate | om |
| Boreozonacola hustedtii Lange-Bertalot, Kulikovskiy & Witkowski | P-B | - | - | ind | i | - | - | - | - | - |
| Brachysira brebissonii R.Ross | P-B | temp | st-str | acf | hb | 0.4 | o | sx | ats | ot |
| Caloneis silicula var. elliptica (Frenguelli) Frenguelli | - | - | - | - | - | - | - | - | - | - |
| Caloneis placentula Ehrenberg | - | - | - | - | - | - | - | - | - | - |
| Cocconeis lineata Ehrenberg | P-B | temp | st-str | alf | i | 1.2 | b | sx | ate | e |
| Craticula ambigua (Ehrenberg) D.G.Mann | B | temp | st | alf | i | 2.3 | b | es | - | me |
| Cyclostephanos dubius (Hustedt) Round | P-B | temp | st-str | alf | hl | 2.0 | a | es | ate | e |
| Cyclotella distinguenda Hustedt | P | - | str | alf | hl | 1.3 | o | - | - | om |
| Cymbella neogena (Grunow) Krammer | - | - | - | - | - | - | - | - | - | - |
| Cymbella cymbiformis C.Agardh | B | temp | st-str | alf | i | 2.0 | b | sx | ats | om |
| Cymbella sp. | - | - | - | - | - | - | - | - | - | - |
| Cymbopleura fluminea (R.M.Patrick & Freese) Lange-Bertalot & Krammer ex Lange-Bertalot & Genkal | - | - | - | - | - | - | - | - | - | - |
| Cymbopleura apiculata Krammer | B | - | - | ind | - | 1.0 | o | es | ats | ot |
| Cymbopleura subcuspidata (Krammer) Krammer | P-B | - | str | acf | i | 1.0 | o | sx | ats | om |
| Cymbopleura tynnii (Krammer) Krammer | B | - | - | - | - | - | - | - | - | - |
| Diploneis cf. fontanella Lange-Bertalot | B | - | - | - | - | - | - | - | - | - |
| Diploneis ovalis (Hilse) Cleve | B | - | st-str | alf | i | 0.9 | x-b | - | ate | m |
| Discostella stelligera (Cleve & Grunow) Houk & Klee | P-B | temp | st-str | ind | i | - | - | - | - | - |
| Encyonema silesiacum (Bleisch) D.G.Mann | B | temp | st-str | ind | i | - | - | - | - | - |
| Encyonema minutum (Hilse) D.G.Mann | B | temp | st-str | ind | i | 1.5 | o-b | sx | ats | - |
| Encyonema cf. leibleinii (C.Agardh) W.J.Silva, R.Jahn, T.A.V.Ludwig & M.Menezes | P-B | - | str | alb | i | 2.4 | b-a | sx | - | me |
| Entomoneis ornata (Bailey) Reimer | B | - | st-str | alf | i | 2.0 | b | - | hne | - |
| Eunotia pectinalis (Kützing) Rabenhorst | B | - | st-str | acf | i | 0.5 | x-o | sx | - | ot |
| Eunotia bidens Ehrenberg | P-B,aer | cool | st-str | acf | hb | 1.0 | o | - | - | ot |
| Eunotia bilunaris (Ehrenberg) Schaarschmidt | B | temp | st-str | acf | i | - | - | - | - | - |
| Eunotia boreotenuis Nörpel-Schempp & Lange-Bertalot | B | - | - | - | hb | 1.0 | o | - | - | ot |
| Eunotia curtagrunowii Nörpel-Schempp & Lange-Bertalot | P-B | - | - | acf | hb | 0.4 | x-o | - | ats | ot |
| Eunotia genuflexa Nörpel-Schempp | - | - | - | - | - | - | - | - | - | - |
| Eunotia mucophila (Lange-Bertalot, Nörpel-Schempp & Alles) Lange-Bertalot | P-B | temp | st-str | acf | hb | - | - | - | - | - |
| Eunotia praerupta Ehrenberg | P-B | cool | st-str | acf | hb | 0.3 | x | - | - | - |
| Eunotia scandiorussica Kulikovskiy, Lange-Bertalot, Genkal & Witkowski | - | - | - | - | - | - | - | - | - | - |
| Eunotia septentrionalis Østrup | P-B | - | str | acf | hb | 1.0 | o | - | - | ot |
| Eunotia superbidens Lange-Bertalot | - | - | - | - | - | - | - | - | - | - |
| Fragilaria radians (Kützing) D.M.Williams & Round | P-B | warm | st-str | alf | i | - | - | - | - | - |
| Fragilaria aequalis Heiberg | - | - | - | - | - | - | - | - | - | - |
| Fragilariforma mesolepta (Rabenhorst) Kharitonov | P-B | - | st-str | alf | i | 1.0 | o | - | - | ot |
| Fragilaria rumpens (Kützing) G.W.F.Carlson | P-B | eterm | st-str | ind | i | 2.0 | b | - | ats | e |
| Fragilaris sp. | - | - | - | - | - | - | - | - | - | - |
| Frustulia crassinervia (Brébisson ex W.Smith) Lange-Bertalot & Krammer | B | - | str | acf | hb | 0.5 | x-o | sx | ats | ot |
| Gomphonema naviculoides W.Smith | - | - | - | - | - | - | - | - | - | - |
| Gomphonema acuminatum Ehrenberg | B | temp | st-str | ind | i | 0.8 | x-b | - | - | - |
| Gomphonema angusticephalum E.Reichardt & Lange-Bertalot | - | - | - | - | - | - | - | - | - | - |
| Gomphonema brebissonii Kützing | B | - | st | ind | i | - | - | - | - | m |
| Gomphonema micropus Kützing | B | temp | st-str | ind | i | 1.1 | - | - | - | - |
| Gomphonema pala E.Reichardt | B | - | - | - | - | 1.0 | o | - | - | - |
| Gomphonema pelisteriense Levkov, Mitic-Kopanja & E.Reichardt | - | - | - | - | - | - | - | - | - | - |
| Gomphonema truncatum Ehrenberg | B | temp | st-str | ind | i | 2.0 | b | - | - | - |
| Gomphonema sp. | - | - | - | - | - | - | - | - | - | - |
| Gyrosigma acuminatum (Kützing) Rabenhorst | B | temp | st-str | alf | i | - | - | - | - | - |
| Lindavia comta (Kützing) T.Nakov & al. | - | - | - | - | - | - | - | - | - | - |
| Kobayasiella parasubtilissima (H.Kobayasi & T.Nagumo) Lange-Bertalot | B | temp | str | acb | hb | 1.5 | o-b | - | - | - |
| Luticola goeppertiana (Bleisch) D.G.Mann ex Rarick, S.Wu, S.S.Lee & Edlund | B | temp | st | ind | i | - | - | - | - | - |
| Luticola acidoclinata Lange-Bertalot | - | - | - | - | - | - | - | - | - | - |
| Luticola permuticopsis Kopalová & Van de Vijver | - | - | - | - | - | - | - | - | - | - |
| Luticola sp. | - | - | - | - | - | - | - | - | - | - |
| Mastogloia sp. | - | - | - | - | - | - | - | - | - | - |
| Meridion circulare (Greville) C.Agardh | P-B | temp | st-str | ind | i | - | - | - | - | - |
| Navicula salinicola Hustedt | B | - | - | - | mh | - | - | - | - | - |
| Navicula antonii Lange-Bertalot | B | temp | - | alf | oh | - | - | es | - | - |
| Navicula capitatoradiata H.Germain ex Gasse | P-B | temp | st-str | alf | mh | - | - | - | - | - |
| Navicula cryptocephala Kützing | P-B | temp | st-str | ind | i | 2.4 | b-a | - | - | - |
| Cymbella lanceolata C.Agardh | B | temp | st-str | alf | i | 2.5 | b-a | es | ate | e |
| Navicula moenofranconica Lange-Bertalot | - | - | - | - | - | - | - | - | - | - |
| Navicula radiosa Kützing | B | temp | st-str | ind | i | - | - | sx | - | - |
| Navicula rostellata Kützing | B | - | st-str | alf | i | 0.7 | o-x | - | ate | ot |
| Navicula semenicula Kulikovskiy, Lange-Bertalot & Metzeltin | - | - | - | - | - | - | - | - | - | - |
| Navicula sp. | - | - | - | - | - | - | - | - | - | - |
| Neidium hercynicum Ant.Mayer | B | - | - | acf | i | - | - | - | - | - |
| Neidium affine (Ehrenberg) Pfitzer | B | temp | st-str | ind | i | - | - | - | - | - |
| Neidium ampliatum (Ehrenberg) Krammer | B | temp | st | ind | i | - | - | - | - | - |
| Neidium bisulcatum (Lagerstedt) Cleve | B | - | st-str | ind | i | 1.0 | o | - | - | - |
| Neidium longiceps (W.Gregory) R.Ross | B | temp | str | ind | i | - | - | - | - | - |
| Neidium sp. | - | - | - | - | - | - | - | - | - | - |
| Nitzschia acidoclinata Lange-Bertalot | B | temp | str | ind | hb | 3.6 | a-b | - | ate | e |
| Nitzschia alpina Hustedt | P-B | temp | str | acf | i | 1.0 | o | - | - | - |
| Nitzschia archibaldii Lange-Bertalot | B | temp | st-str | ind | i | - | - | - | - | - |
| Nitzschia bacillum Hustedt | B | - | - | alf | i | 2.0 | b | - | - | - |
| Nitzschia inconspicua Grunow | B | temp | st-str | alf | hl | - | - | - | - | - |
| Nitzschia perminuta Grunow | P-B | temp | str | alf | hl | - | - | - | - | - |
| Nitzschia vermicularis (Kützing) Hantzsch | P-B | temp | st-str | alf | i | - | - | - | - | - |
| Nitzschia sp. | - | - | - | - | - | - | - | - | - | - |
| Odontidium mesodon (Ehrenberg) Kützing | B | cool | st-str | ind | hb | 0.9 | x-b | - | - | - |
| Pantocsekiella sp. | - | - | - | - | - | - | - | - | - | - |
| Pinnularia cf. globiceps var. linearis Krammer | - | - | - | - | - | - | - | - | - | - |
| Pinnularia acrosphaeria W.Smith | B | warm | st-str | ind | i | - | - | - | - | - |
| Pinnularia anglica Krammer | B | - | - | acf | - | 2.3 | b | es | - | e |
| Pinnularia borealis var. scalaris (Ehrenberg) Rabenhorst | B | - | - | - | i | - | - | sx | - | - |
| Pinnularia crucifera A.Cleve | - | - | - | - | - | - | - | - | - | - |
| Pinnularia eifeliana (Krammer) Krammer | B | - | - | - | - | 1.0 | o | - | - | - |
| Pinnularia flexuosa Cleve | B | - | - | - | i | 1.0 | o | - | - | m |
| Pinnularia ilkaschoenfelderae Krammer | - | - | - | - | - | - | - | - | - | - |
| Pinnularia isselana Krammer | - | - | - | - | - | 1.0 | o | es | - | ot |
| Pinnularia lailaensis Foged | - | - | - | - | - | - | - | - | - | - |
| Pinnularia neomajor Krammer | B | - | - | ind | i | - | - | - | - | - |
| Pinnularia obscura Krasske | B,aer | - | st-str,aer | ind | i | 0.5 | x-o | - | ats | ot |
| Pinnularia ovata Krammer | B | - | - | - | - | - | - | - | - | - |
| Pinnularia pisciculus Ehrenberg | - | - | - | - | - | - | - | - | - | - |
| Pinnularia sinistra Krammer | B | - | - | - | - | - | - | - | - | - |
| Pinnularia spitsbergensis Cleve | B | - | - | ind | hb | - | - | - | ats | ot |
| Pinnularia stomatophora (Grunow) Cleve | B | - | st-str | acf | i | - | - | - | - | - |
| Pinnularia subgibba var. sublinearis Krammer | - | - | - | - | - | - | - | - | - | - |
| Pinnularia subrostrata (A.Cleve) A.Cleve | B | - | - | acf | hb | 1.0 | o | - | - | - |
| Pinnularia undula (Schumann) Krammer | B | - | - | ind | i | 1.0 | o | - | - | - |
| Pinnularia viridis (Nitzsch) Ehrenberg | P-B | temp | st-str | ind | i | 0.9 | x-b | - | - | ot |
| Pinnularia sp. | - | - | - | - | - | - | - | - | - | - |
| Placoneis symmetrica (Hustedt) Lange-Bertalot | B | - | - | - | hb | 2.0 | b | - | - | - |
| Platessa conspicua (Ant.Mayer) Lange-Bertalot | B | temp | st-str | alf | i | - | - | - | - | - |
| Psammothidium subatomoides (Hustedt) Bukhtiyarova & Round | P-B | temp | str | acf | hb | 2.0 | b | sx | ats | me |
| Pseudostaurosira linearis (Pantocsek) E.A.Morales, Buczkó & Ector | - | - | - | - | - | - | - | - | - | - |
| Punctastriata subalpina C.E.Wetzel & Ector | - | - | - | - | - | - | - | - | - | - |
| Reimeria sinuata (W.Gregory) Kociolek & Stoermer | P-B, aer | temp | st-str | ind | i | - | - | - | - | - |
| Rhoicosphenia abbreviata (C.Agardh) Lange-Bertalot | B | temp | st-str | alf | i | 1.9 | o-a | es | ate | me |
| Epithemia gibba (Ehrenberg) Kützing | P-B | temp | st-str | alf | i | 1.4 | x-o | es | ate | om |
| Sellaphora pseudopupula (Krasske) Lange-Bertalot | - | - | - | - | - | 1.9 | o-a | - | - | - |
| Sellaphora parapupula Lange-Bertalot | B | - | st | ind | i | 1.0 | o | - | ate | m |
| Sellaphora laevissima (Kützing) D.G.Mann | B | - | st-str | ind | i | 2.0 | b | - | ats | om |
| Stauroneis amphicephala Kützing | - | - | - | - | - | - | - | - | - | - |
| Stauroneis agrestis J.B.Petersen | B | - | aer | ind | i | - | - | - | - | - |
| Stauroneis anceps Ehrenberg | P-B | temp | st-str | ind | i | 1.3 | o | sx | ats | om |
| Stauroneis kuelbsii Lange-Bertalot | - | - | - | - | - | - | - | - | - | - |
| Stauroneis phoenicenteron (Nitzsch) Ehrenberg | P-B | temp | st-str | ind | i | - | - | - | - | - |
| Staurosira venter (Ehrenberg) Cleve & J.D.Möller | P-B | temp | st-str | alf | i | 1.0 | o | - | - | ot |
| Stenopterobia anceps (F.W.Lewis) Brébisson ex Van Heurck | - | - | - | - | - | - | - | - | - | - |
| Stephanodiscus hantzschii Grunow | P | temp | st-str | alf | i | - | - | sx | - | - |
| Tabellaria flocculosa (Roth) Kützing | P-B | eterm | st-str | acf | i | 3.0 | a | - | - | - |
| Ulnaria acus (Kützing) Aboal | P-B | warm | st-str | alf | i | 1.85 | o-a | es | ate | me |
| Ulnaria ulna (Nitzsch) Compère | P-B | temp | st-str | alf | i | 2.4 | b-a | es | ate | e |
| Variable | St. 1 | St. 2 | St. 3 | St. 4 | St. 5 | St. 6 | St. 7 | St. 8 | St. 9 | St. 10 | St. 11 |
|---|---|---|---|---|---|---|---|---|---|---|---|
| Habitat | |||||||||||
| B | 5 | 6 | 4 | 3 | 12 | 3 | 7 | 19 | 2 | 6 | 11 |
| P-B | 12 | 6 | 4 | 10 | 6 | 5 | 1 | 11 | 1 | 7 | 8 |
| P | 3 | 0 | 1 | 4 | 0 | 1 | 0 | 1 | 2 | 2 | 1 |
| Temperature | |||||||||||
| cool | 1 | 1 | 0 | 1 | 1 | 1 | 0 | 2 | 0 | 0 | 1 |
| temp | 13 | 5 | 8 | 10 | 9 | 3 | 2 | 12 | 1 | 8 | 10 |
| eterm | 2 | 1 | 1 | 2 | 0 | 1 | 0 | 1 | 1 | 1 | 0 |
| warm | 0 | 0 | 0 | 2 | 0 | 1 | 0 | 1 | 0 | 1 | 0 |
| Oxygen | |||||||||||
| aer | 0 | 1 | 0 | 0 | 0 | 0 | 0 | 0 | 0 | 0 | 0 |
| str | 1 | 4 | 0 | 2 | 1 | 0 | 1 | 3 | 1 | 2 | 3 |
| st-str | 15 | 5 | 8 | 13 | 11 | 9 | 1 | 16 | 2 | 10 | 11 |
| st | 0 | 1 | 1 | 1 | 2 | 0 | 0 | 3 | 1 | 0 | 1 |
| Salinity | |||||||||||
| hb | 0 | 3 | 1 | 2 | 1 | 1 | 3 | 5 | 0 | 2 | 4 |
| i | 17 | 8 | 8 | 13 | 16 | 7 | 3 | 22 | 4 | 11 | 12 |
| hl | 1 | 0 | 0 | 1 | 0 | 0 | 0 | 1 | 1 | 1 | 2 |
| mh | 1 | 0 | 0 | 1 | 0 | 1 | 0 | 0 | 0 | 0 | 0 |
| pH | |||||||||||
| acb | 0 | 0 | 0 | 0 | 0 | 0 | 1 | 0 | 0 | 0 | 0 |
| acf | 2 | 3 | 2 | 3 | 2 | 2 | 1 | 7 | 1 | 3 | 5 |
| ind | 6 | 6 | 2 | 4 | 7 | 1 | 3 | 17 | 2 | 4 | 8 |
| alf | 11 | 1 | 5 | 9 | 8 | 6 | 0 | 5 | 2 | 6 | 4 |
| alb | 0 | 1 | 0 | 0 | 0 | 0 | 0 | 0 | 0 | 0 | 0 |
| Watanabe | |||||||||||
| sx | 4 | 3 | 4 | 3 | 4 | 2 | 0 | 1 | 0 | 0 | 2 |
| es | 3 | 1 | 1 | 4 | 5 | 2 | 0 | 4 | 1 | 2 | 2 |
| sp | 1 | 1 | 1 | 1 | 1 | 0 | 0 | 0 | 0 | 2 | 1 |
| Autotrophy-Heterotrophy | |||||||||||
| ats | 3 | 2 | 2 | 3 | 2 | 0 | 1 | 4 | 0 | 0 | 2 |
| ate | 6 | 3 | 3 | 5 | 5 | 3 | 0 | 4 | 2 | 4 | 2 |
| hne | 0 | 0 | 0 | 0 | 0 | 1 | 0 | 0 | 0 | 0 | 0 |
| Trophy | |||||||||||
| ot | 3 | 3 | 2 | 1 | 3 | 2 | 2 | 5 | 0 | 4 | 5 |
| om | 2 | 1 | 2 | 4 | 4 | 0 | 0 | 2 | 1 | 1 | 1 |
| m | 0 | 0 | 0 | 0 | 1 | 0 | 1 | 2 | 1 | 0 | 1 |
| me | 1 | 1 | 1 | 2 | 1 | 2 | 0 | 1 | 0 | 2 | 0 |
| e | 3 | 2 | 0 | 1 | 1 | 1 | 0 | 2 | 1 | 0 | 2 |
| o-e | 1 | 0 | 0 | 1 | 0 | 0 | 0 | 0 | 0 | 0 | 0 |
| Class of Water Quality | |||||||||||
| Class 1 | 0 | 1 | 1 | 1 | 2 | 1 | 0 | 2 | 0 | 0 | 1 |
| Class 2 | 8 | 6 | 3 | 3 | 7 | 3 | 4 | 9 | 3 | 3 | 6 |
| Class 3 | 5 | 0 | 1 | 5 | 3 | 3 | 0 | 5 | 0 | 0 | 4 |
| Class 4 | 1 | 1 | 0 | 1 | 0 | 1 | 0 | 1 | 0 | 1 | 0 |
| Class 5 | 0 | 0 | 0 | 0 | 0 | 0 | 0 | 1 | 0 | 0 | 0 |
References
- Yakovleva, N.; Alabaster, T.; Petrova, P.G. Natural resource use in the Russian North: A case study of diamond mining in the Republic of Sakha. Environ. Manag. Health 2000, 11, 318–336. [Google Scholar] [CrossRef]
- Mendelssohn, I.A.; Andersen, G.L.; Baltz, D.M.; Caffey, R.H.; Carman, K.R.; Fleeger, J.W.; Joye, S.B.; Lin, Q.; Maltby, E.; Overton, E.B.; et al. Oil Impacts on Coastal Wetlands: Implications for the Mississippi River Delta Ecosystem after the Deepwater Horizon Oil Spill. BioScience 2012, 62, 562–574. [Google Scholar] [CrossRef]
- Entrekin, S.; Evans-White, M.; Johnson, B.; Hagenbuch, E. Rapid expansion of natural gas development poses a threat to surface waters. Front. Ecol. Environ. 2011, 9, 503–511. [Google Scholar] [CrossRef]
- Kirakosyan, D.V.; Molchanova, Y.P. Analysis of first consequences of the oil spill in Norilsk. Uspekhi V Khimii I Khimicheskikh Tekhnologiyakh 2021, XXXV, 43–46. (In Russian) [Google Scholar]
- Nikolaeva, N.A.; Kopyrina, L.I. Evaluation of some aspects of the state of rivers and landscapes in Western Yakutia under anthropogenic impact. Uspekhi Sovrem. Yestestvoznaniya 2023, 6, 59–64. (In Russian) [Google Scholar] [CrossRef]
- Systerova, A.V. River’s algoflora of Perm Krai oil fields. In Proceedings of the All-Russian Conference Ecological Safety in Conditions of Anthropogenic Transformation of the Natural Environment, Perm, Russia, 20–21 April 2023; pp. 494–496. (In Russian). [Google Scholar]
- Volpert, Y.L. Transformation of land ecosystems as a result of diamond mining industry influence. Uspekhi Sovrem. Estestvozn. 2012, 11, 80–82. (In Russian) [Google Scholar]
- Skorobogatova, O.; Yumagulova, E.; Storchak, T.; Barinova, S. Bioindication of the Influence of Oil Production on Sphagnum Bogs in the Khanty-Mansiysk Autonomous Okrug–Yugra, Russia. Diversity 2019, 11, 207. [Google Scholar] [CrossRef]
- Nõges, P.; Poikane, S.; Cardoso, A.C.; van de Bund, W. Water Framework Directive the Way to Water Ecosystems Sustainability in Europe. LakeLine 2006, 21, 36–43. [Google Scholar]
- Kelly, M.; Bennion, H.; Burgess, A.; Ellis, J.; Juggins, S.; Guthrie, R.; Jamieson, J.; Adriaenssens, V.; Yallop, M. Uncertainty in Ecological Status Assessments of Lakes and Rivers Using Diatoms. Hydrobiologia 2009, 633, 5–15. [Google Scholar] [CrossRef]
- Poikane, S.; Kelly, M.; Cantonati, M. Benthic Algal Assessment of Ecological Status in European Lakes and Rivers: Challenges and Opportunities. Sci. Total Environ. 2016, 568, 603–613. [Google Scholar] [CrossRef] [PubMed]
- Bennion, H.; Sayer, C.D.; Tibby, J.; Carrick, H.J. Diatoms as Indicators of Environmental Change in Shallow Lakes. In The Diatoms: Applications for the Environmental and Earth Sciences; Cambridge University Press: Cambridge, UK, 2010; p. 686. [Google Scholar]
- Hofmann, G.; Werum, M.; Lange-Bertalot, H.; Lange-Bertalot, H. Diatomeen im Süßwasser-Benthos von Mitteleuropa: Bestimmungs-Flora Kieselalgen für die Ökologische Praxis. Über 700 der Häufigsten Arten und Ihre Ökologie; Gantner: Ruggell, Liechtenstein, 2011; p. 908. (In German) [Google Scholar]
- Charles, D.F.; Kelly, M.G.; Stevenson, R.J.; Poikane, S.; Theroux, S.; Zgrundo, A.; Cantonati, M. Benthic Algae Assessments in the EU and the US: Striving for Consistency in the Face of Great Ecological Diversity. Ecol. Indic. 2021, 121, 107082. [Google Scholar] [CrossRef]
- Van Dam, H.; Mertens, A.; Sinkeldam, J. A coded checklist and ecological indicator values of freshwater diatoms from The Netherlands. Neth. J. Aquat. Ecol. 1994, 28, 117–133. [Google Scholar]
- Izyumenko, S.A. (Ed.) Climate of the Yakut Autonomous Soviet Socialist Republic (Atlas); Gidrometeoizdat: Leningrad, USSR, 1968; 33p. (In Russian) [Google Scholar]
- Semenov, A.D. Guidance on the Chemical Analysis of Surface Waters of the Land; Gidrometeoizdat: Leningrad, USSR, 1977; p. 541. (In Russian) [Google Scholar]
- Balonov, I.M. Preparation of diatoms and golden algae for electron microscopy. In Methods for the Study of Biogeocenoses of Inland Waterbodies; Nauka: Moscow, USSR, 1975; pp. 87–89. (In Russian) [Google Scholar]
- Lange-Bertalot, H.; Moser, G. Brachysira: Monographie der Gattung; wichtige indicator-species für das Gewässer-Monitoring und Naviculadicta nov. gen.; ein Lösungsvorschlag zu dem Problem Navicula sensu lato onhe Navicula sensu stricto. Bibl. Diatomol. 1994, 29, 1–212. [Google Scholar]
- Krammer, K. Die cymbelloiden Diatomeen. Teil 1. Allgemeines und Encyonema part. Bibl. Diatomol. 1997, 36, 1–382. [Google Scholar]
- Krammer, K. Die cymbelloiden Diatomeen. Teil 2. Encyonema part. Encyonopsis und Cymbellopsis. Bibl. Diatomol. 1997, 7, 1–469. [Google Scholar]
- Krammer, K. Pinnularia. In Diatoms of Europe; Lange-Bertalot, H., Ed.; Gustav Fisher Verlag: Ruggell, Liechtenstein, 2000; Volume 1, pp. 1–703. [Google Scholar]
- Krammer, K. Cymbella. In Diatoms of Europe; Lange-Bertalot, H., Ed.; Gustav Fisher Verlag: Ruggell, Liechtenstein, 2002; Volume 3, pp. 1–584. [Google Scholar]
- Krammer, K. Cymbopleura. Delicata. Navicymbula. Gomphocymbellopsis. Afrocymbella. In Diatoms of Europe; Lange-Bertalot, H., Ed.; Gustav Fisher Verlag: Ruggell, Liechtenstein, 2003; Volume 4, pp. 1–530. [Google Scholar]
- Krammer, K.; Lange-Bertalot, H. Bacillariophyceae. Teil 1. Naviculaceae. In Die Süsswasserflora von Mitteleuropa; Gustav Fisher Verlag: Stuttgart, Germany, 1986; pp. 1–876. [Google Scholar]
- Krammer, K.; Lange-Bertalot, H. Bacillariophyceae. Teil 2. Epithemiaceae. Bacillariaceae. Surirellaceae. In Die Süsswasserflora von Mitteleuropa; Gustav Fisher Verlag: Stuttgart, Germany, 1988; pp. 1–536. [Google Scholar]
- Krammer, K.; Lange-Bertalot, H. Bacillariophyceae. Teil 3. Centrales. Fragilariaceae. Eunotiaceae. In Die Süsswasserflora von Mitteleuropa; Ettl, J., Gerloff, H., Eds.; Gustav Fisher Verlag: Stuttgart, Germany, 1991; pp. 1–576. [Google Scholar]
- Krammer, K.; Lange-Bertalot, H. Bacillariophyceae. Teil. 4. Achnanthaceae. Kritische Erganzungen zu Navicula (Lineolatae) und Gomphonema. In Die Süsswasserflora von Mitteleuropa; Gustav Fisher Verlag: Stuttgart, Germany, 1991; pp. 1–437. [Google Scholar]
- Lange-Bertalot, H.; Genkal, S.I. Diatoms of Siberia. I. Iconogr. Diatomol. 1999, 6, 7–272. [Google Scholar]
- Reichardt, E. Zur revision der gattung Gomphonema. Iconogr. Diatomol. 1999, 8, 1–203. [Google Scholar]
- Lange-Bertalot, H. Navicula sensu stricto. 10 genera separated from Navicula sensu lato Frustulia. In Diatoms of Europe; Lange-Bertalot, H., Ed.; A.R.G. Gantner Verlag K.-G.: Ruggell, Liechtenstein, 2001; Volume 2, pp. 1–526. [Google Scholar]
- Werum, M.; Lange-Bertalot, H. Diatoms in springs from Central Europe and elsewhere under the influence of hydrogeology and anthropogenic impacts. Iconogr. Diatomol. 2004, 13, 1–417. [Google Scholar]
- Levkov, Z. Amphora sensu lato. In Diatoms of Europe; Lange-Bertalot, H., Ed.; A.R.G. Gantner Verlag K.-G.: Ruggell, Liechtenstein, 2009; Volume 5, pp. 1–916. [Google Scholar]
- Genkal, S.I.; Bondarenko, N.A.; Shchur, L.A. Diatoms of Lakes in the South and North of Eastern Siberia; Publisher OAO “Rybinsk Press House”: Rybinsk, Russia, 2011; p. 72. [Google Scholar]
- Lange-Bertalot, H.; Bak, M.; Witkowski, A. Eunotia and some related genera. In Diatoms of Europe; A.R.G. Gantner Verlag K.-G.: Ruggell, Liechtenstein, 2011; Volume 6, pp. 1–747. [Google Scholar]
- Kharitonov, V.G.; Genkal, S.I. Diatoms of Lake Elgygytgyn and Its Environs (Chukotka); NESC FEB RAS: Magadan, Russia, 2012; p. 402. (In Russian) [Google Scholar]
- Levkov, Z.; Metzeltin, D.; Pavlov, A. Luticola. Luticolopsis. In Diatoms of Europe; Lange-Bertalot, H., Ed.; A.R.G. Gantner Verlag K.-G.: Ruggell, Liechtenstein, 2013; Volume 7, pp. 1–697. [Google Scholar]
- Levkov, Z.; Mitić-Kopanja, D.; Reichardt, E. The diatom genus Gomphonema from the Republik of Macedonia. In Diatoms of Europe; Lange-Bertalot, H., Ed.; A.R.G. Gantner Verlag K.-G.: Ruggell, Liechtenstein, 2016; Volume 8, pp. 1–552. [Google Scholar]
- Kulikovskiy, M.S.; Glushchtnko, A.M.; Genkal, S.I.; Kuznetsova, I.V. Identification Book of Diatoms from Russia; Filigran: Yaroslavl, Russia, 2016; p. 804. [Google Scholar]
- Lange-Bertalot, H.; Hofmann, G.; Werum, M.; Cantonati, M. Freshwater benthic diatoms of Central Europe; Koeltz Botanical Books: Schmitten-Oberreifenberg, Germany, 2017; p. 942. [Google Scholar]
- Beauger, A.; Allain, E.; Voldoire, O.; Blavignac, C.; Rossi, S.; Wetzel, C.; Ector, L. Gomphosphenia vallei (Bacillariophyta), a new diatom species from a stream in the “Réserve Naturelle Nationale de la Vallée de Chaudefour”, Massif Central (France). Phytotaxa 2022, 542, 167–179. [Google Scholar] [CrossRef]
- Guiry, M.D.; Guiry, G.M. AlgaeBase World-Wide Electronic Publication. National University of Ireland, Galway. Available online: http://www.algaebase.org (accessed on 24 May 2024).
- Barinova, S. Essential and practical bioindication methods and systems for the water quality assessment. Int. J. Environ. Sci. Nat. Resour. 2017, 2, 1–11. [Google Scholar] [CrossRef]
- Barinova, S.S.; Medvedeva, L.A.; Anissimova, O.V. Diversity of Algal Indicators in Environmental Assessment; Pilies Studio Publisher: Tel Aviv, Israel, 2006; p. 498. (In Russian) [Google Scholar]
- McAleece, N.; Gage, J.D.G.; Lambshead, P.J.D.; Paterson, G.L.J. BioDiversity Professional Statistics Analysis Software; The Scottish Association for Marine Science: Oban, UK; Natural History Museum: London, UK, 1997. [Google Scholar]
- Love, J.; Selker, R.; Marsman, M.; Jamil, T.; Dropmann, D.; Verhagen, J.A.; Ly, A.; Gronau, F.Q.; Smira, M.; Epskamp, S.; et al. JASP: Graphical statistical software for common statistical designs. J. Stat. Softw. 2019, 88, 1–17. [Google Scholar] [CrossRef]
- Ter Braak, C.J.F.; Šmilauer, P. CANOCO Reference Manual and CanoDraw for Windows User’s Guide: Software for Canonical Community Ordination (Version 4.5); Microcomputer Power Press: Ithaca, NY, USA, 2002; p. 500. [Google Scholar]
- Watanabe, T.; Asai, K.; Houki, A. Numerical estimation of organic pollution of flowing water by using the epilithic diatom assemblage—Diatom Assemblage Index (DAIpo). Sci. Total Environ. 1986, 55, 209–218. [Google Scholar] [CrossRef]
- Al-Robai, H.A.; Jasim, D.J.; Jassam, S.A.; Jasim, H.M.; Ameen, H.F.M.; Al-Rubaye, A.H. Petroleum’s Influence on the Aquatic Environment. In IOP Conference Series: Earth and Environmental Science; IOP Publishing: Bristol, UK, 2023; Volume 1262, p. 022025. [Google Scholar] [CrossRef]
- Bănăduc, D.; Curtean-Bănăduc, A.; Barinova, S.; Lozano, V.L.; Afanasyev, S.; Leite, T.; Branco, P.; Gomez Isaza, D.F.; Geist, J.; Tegos, A.; et al. Multi-Interacting Natural and Anthropogenic Stressors on Freshwater Ecosystems: Their Current Status and Future Prospects for 21st Century. Water 2024, 16, 1483. [Google Scholar] [CrossRef]
- Esterhuyse, S.; Redelinghuys, N.; Charvet, P.; Fearnside, P.; Daga, V.; Braga, R.; Okello, W.; Vitule, J.; Verheyen, E.; van Steenberge, M. Effects of Hydrocarbon Extraction on Freshwaters. In Encyclopedia of Inland Waters, 2nd ed.; Mehner, T., Tockner, K., Eds.; Elsevier: Amsterdam, The Netherlands, 2022; Volume 3, pp. 189–209. [Google Scholar] [CrossRef]
- Anhalt, E.M.; Dobrodomova, L.A.; Ryabinina, Z.N. Environmental and economic assessment of the impact of oil and gas production on the state of landscape and botanical complexes in the Urals. IOP Conf. Ser. Mater. Sci. Eng. 2020, 962, 042011. [Google Scholar] [CrossRef]
- Ko, J.Y.; Day, J.W. A review of ecological impacts of oil and gas development on coastal ecosystems in the Mississippi Delta. Ocean. Coast. Manag. 2004, 47, 597–623. [Google Scholar] [CrossRef]
- Kotova, E.I.; Netsvetaeva, O.P.; Reshetnyak, O.S. Impact of the Lomonosov diamond deposit exploitation on the Zolotitsa River ecosystem. Arkt. Ekol. Ekon. 2022, 12, 191–199. (In Russian) [Google Scholar] [CrossRef]
- Barinova, S.; Gabyshev, V.; Genkal, S.; Gabysheva, O. Diatoms of Small Water Bodies as Bioindicators in the Assessment of Climatic and Anthropogenic Impacts on the Coast of Tiksi Bay, Russian Arctic. Water 2023, 15, 1533. [Google Scholar] [CrossRef]
- Barinova, S.; Gabyshev, V.; Genkal, S. Diversity of Diatom Algae in the Lena Delta Nature Reserve and the Adjacent Territory in the Specific Ecological Factors of the Arctic. Diversity 2023, 15, 802. [Google Scholar] [CrossRef]
- Soininen, J. A quantitative analysis of species sorting across organisms and ecosystems. Ecology 2014, 95, 3284–3292. [Google Scholar] [CrossRef]
- MacArthur, R.H.; Wilson, E.O. The Theory of Island Biogeography; Princeton University Press: Princeton, NJ, USA, 1967; p. 203. [Google Scholar]
- Pérez-Burillo, J.; Jamoneau, A.; Passy, S.I.; Tison-Rosebery, J.; Blanco, S.; Borrini, A.; Boutry, S.; Budnick, W.R.; Cantonati, M.; Valente, A.C.; et al. Stream diatom community assembly processes in islands and continents: A global perspective. J. Biogeogr. 2024, 51, 382–393. [Google Scholar] [CrossRef]
- Gurrieri, J.T. Distribution of metals in water and sediment and effects on aquatic biota in the upper Stillwater River basin, Montana. J. Geochem. Explor. 1998, 64, 83–100. [Google Scholar] [CrossRef]
- Helgen, S.O.; Moore, J.N. Natural background determination and impact quantification in trace metal-contaminated river sediments. Environ. Sci. Technol. 1996, 30, 129–135. [Google Scholar] [CrossRef]
- Pirrie, D.; Power, M.R.; Wheeler, P.D.; Cundy, A.; Bridges, C.; Davey, G. Geochemical signature of historical mining: Fowey Estuary, Cornwall, UK. J. Geochem. Explor. 2002, 76, 31–43. [Google Scholar] [CrossRef]
- Pirrie, D.; Camm, G.S.; Sear, L.G.; Hughes, S.H. Mineralogical and geochemical signature of mine waste contamination, Tresillian River, Fal Estuary, Cornwall, UK. Environ. Geol. 1997, 29, 58–65. [Google Scholar] [CrossRef]
- Barinova, S.; Gabyshev, V.; Gabysheva, O. Phytoplankton in the Ecological Assessment of the Mining Facilities Influence on the Anabar River in the Permafrost Zone of the Arctic, Eastern Siberia, Russia. Land 2023, 12, 1775. [Google Scholar] [CrossRef]
- Gerhardt, A.; Janssens de Bisthoven, L.; Guhr, K.; Soares, A.M.V.M.; Pereira, M.J. Phytoassessment of Acid Mine Drainage: Combining Lemna gibba bioassay and Diatom community structure. Ecotoxicology 2008, 17, 7–58. [Google Scholar] [CrossRef] [PubMed]
- Bănăduc, D.; Barinova, S.; Cianfaglione, K.; Curtean-Bănăduc, A. Editorial: Multiple freshwater stressors—Key drivers for the future of freshwater environments. Front. Environ. Sci. 2023, 11, 1143706. [Google Scholar] [CrossRef]
- Hustedt, F. Die Diatomeenflora des Flußsystems der Weser im Gebiet der Hansestadt Bremen. Abh. Naturwissenschaftlichen Ver. Brem. 1957, 34, 181–440. [Google Scholar]
- Hustedt, F. Systematisch und Ökologische Untersuchungen über die Diatomeenflora von Java, Bali und Sumatra. Arch. Für Hydrobiol. Suppl. 1938, 15, 131–177, 393–506, 638–790, Erratum in Archiv. Hydrobiol. Suppl. 1939, 16, 1–155, 274–394. [Google Scholar]
- Sládeček, V. Diatoms as indicators of organic pollution. Acta Hydrochim. Hydrobiol. 1986, 14, 555–566. [Google Scholar] [CrossRef]
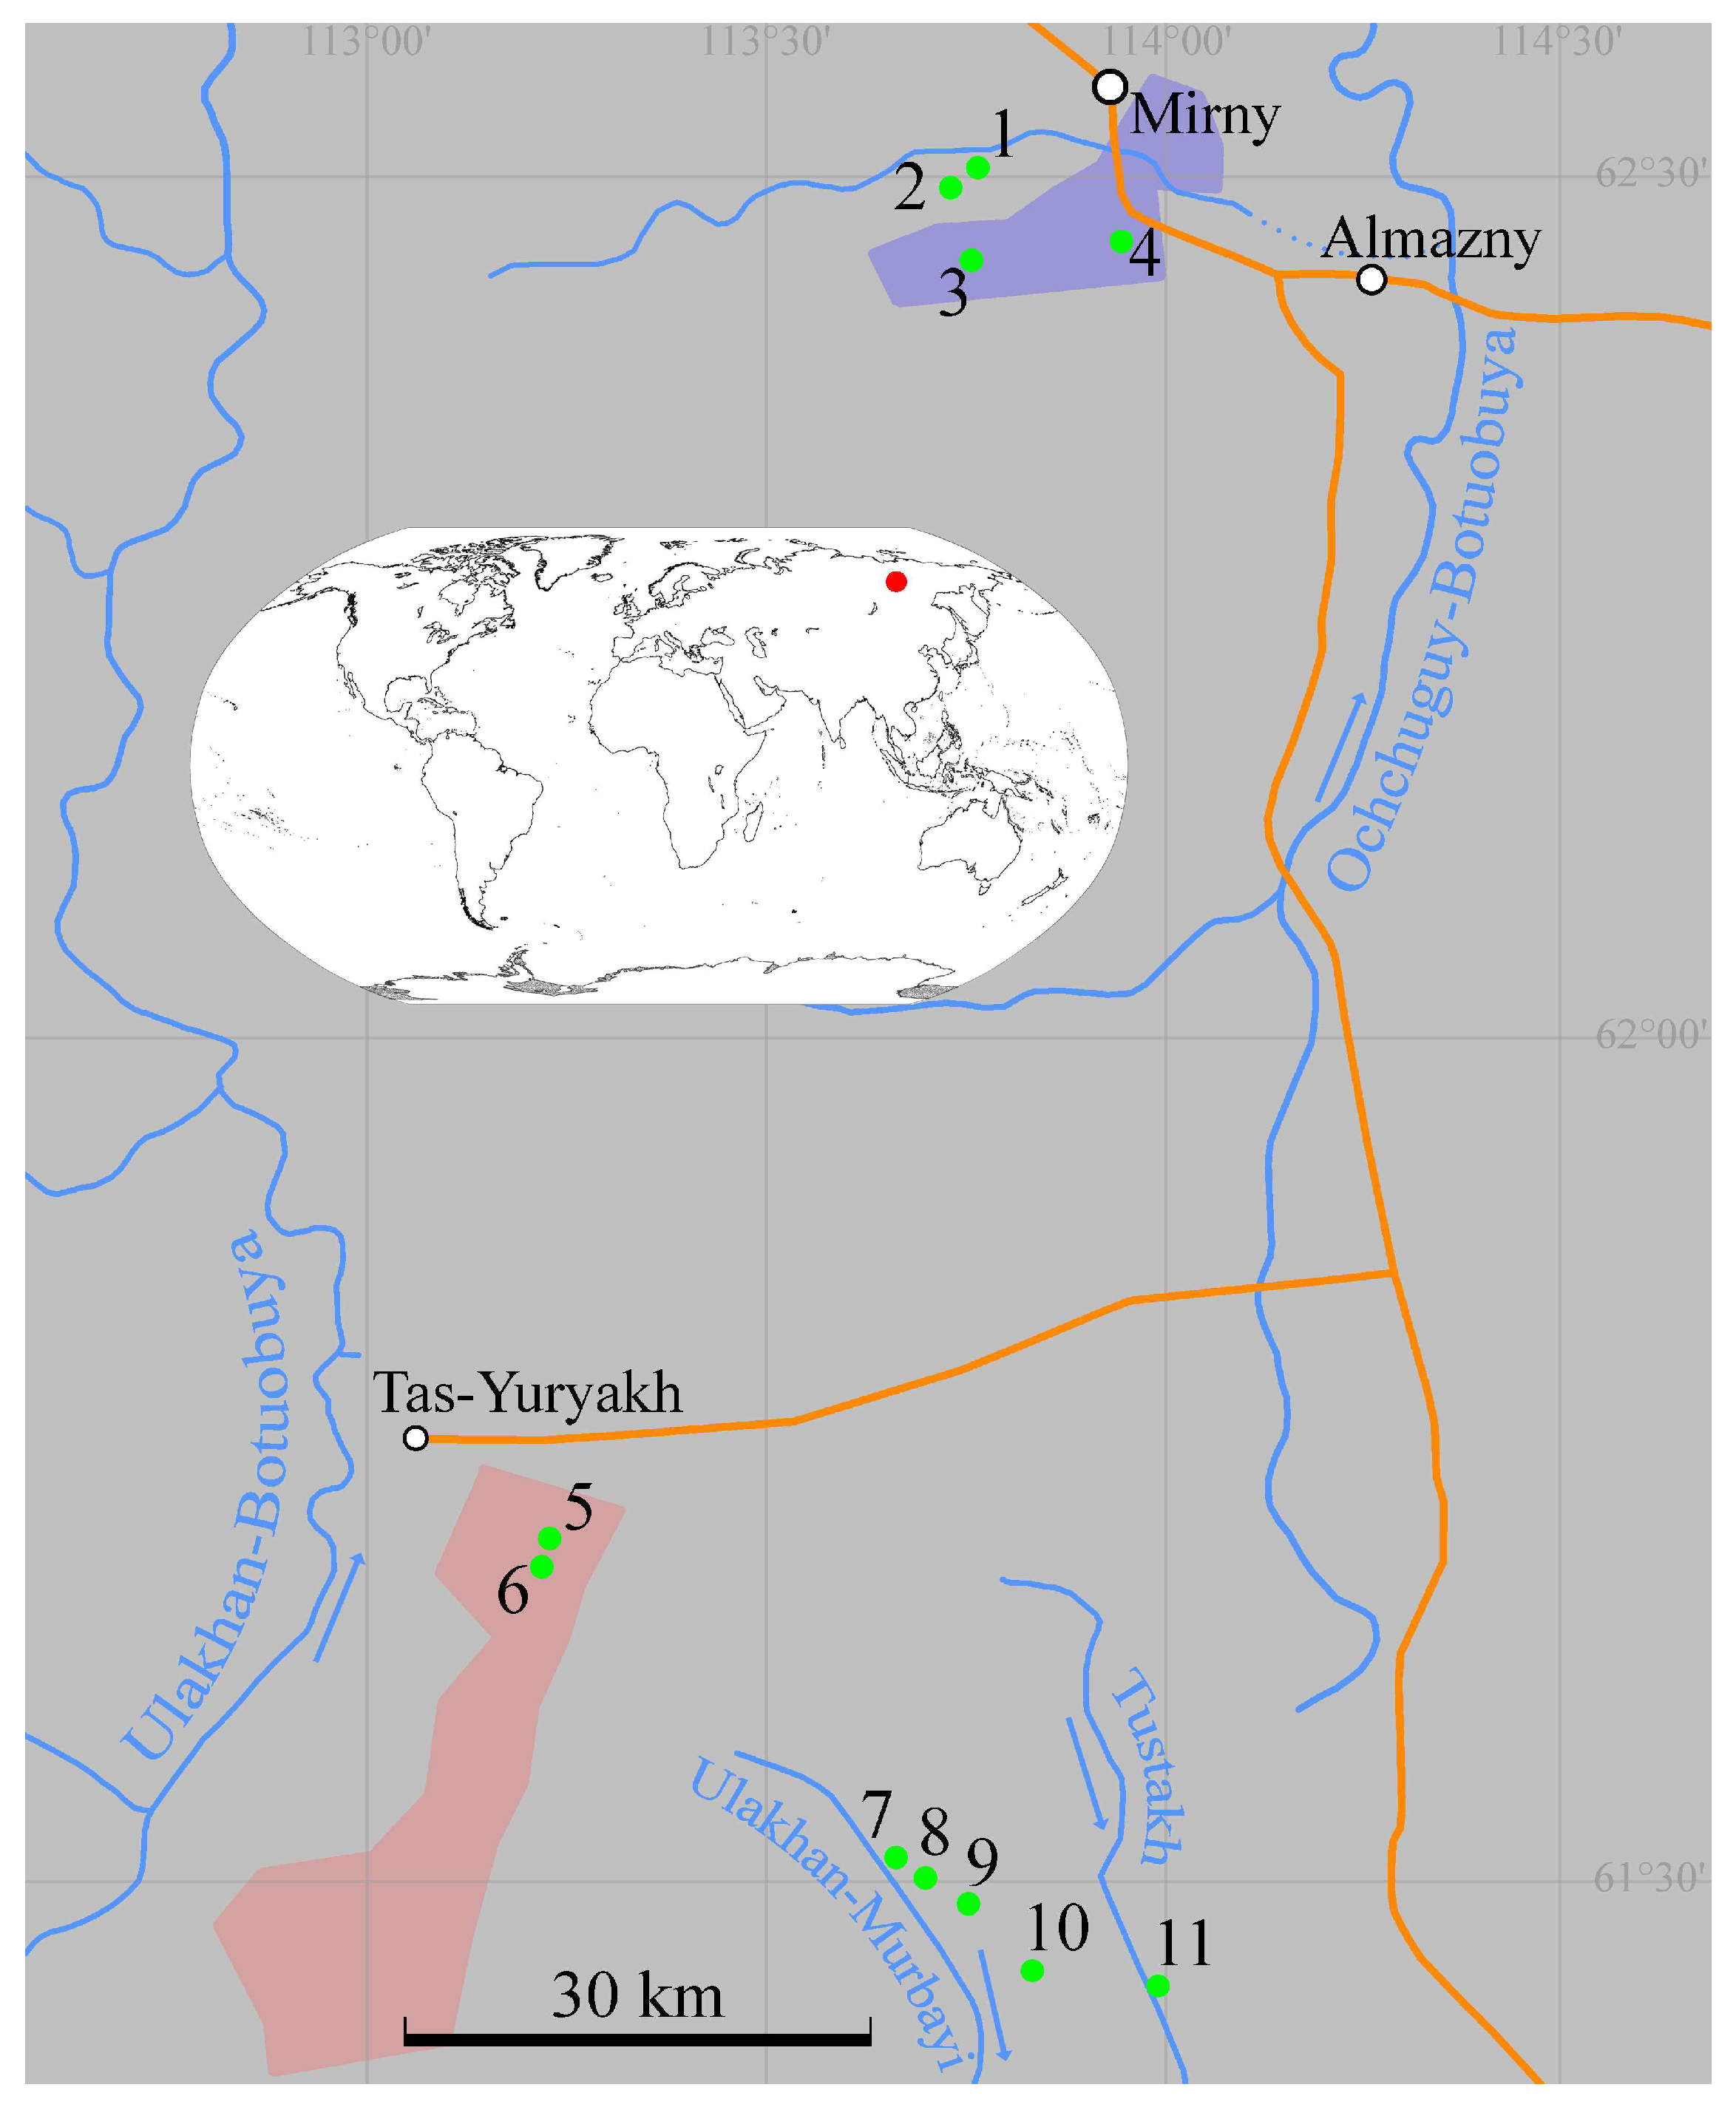


| No of Station | Waterbody | Sampling Date | Altitude, m a.s.l. | Latitude, N | Longitude, E |
|---|---|---|---|---|---|
| 1 | Puddle | 8 September 2022 | 329 | 62°30′12.7″ | 113°45′05.2″ |
| 2 | Puddle | 8 September 2022 | 349 | 62°30′04.1″ | 113°45′05.0″ |
| 3 | Diamond quarry named after XXIII Party Congress | 8 September 2022 | 400 | 62°27′10.9″ | 113°46′00.5″ |
| 4 | Nameless diamond quarry | 8 September 2022 | 311 | 62°27′56.4″ | 113°57′10.6″ |
| 5 | Lake | 3 September 2022 | 322 | 61°41′59.2″ | 113°13′44.4″ |
| 6 | Water reservoir | 5 September 2022 | 321 | 61°41′33.0″ | 113°13′36.8″ |
| 7 | Swamp | 5 September 2022 | 346 | 61°30′18.3″ | 113°39′55.7″ |
| 8 | Stream | 5 September 2022 | 362 | 61°30′02.4″ | 113°42′34.0″ |
| 9 | Swamp | 5 September 2022 | 370 | 61°29′05.2″ | 113°45′33.8″ |
| 10 | Swamp | 5 September 2022 | 355 | 61°26′41.1″ | 113°50′49.3″ |
| 11 | Stream | 4 September 2022 | 306 | 61°25′59.8″ | 113°59′58.2″ |
| Variables/Station | St. 1 | St. 2 | St. 3 | St. 4 | St. 5 | St. 6 | St. 7 | St. 8 | St. 9 | St. 10 | St. 11 |
|---|---|---|---|---|---|---|---|---|---|---|---|
| Water temperature, °C | 4.50 | 10.10 | 11.10 | 10.70 | 8.50 | 11.10 | 5.10 | 6.60 | 8.30 | 7.10 | 6.90 |
| pH | 6.25 | 6.29 | 8.57 | 8.39 | 7.42 | 7.34 | 6.11 | 6.28 | 5.86 | 6.23 | 6.31 |
| TDS, mg L−1 | 108.26 | 112.10 | 1565.91 | 522.94 | 107.79 | 109.39 | 126.32 | 77.65 | 122.69 | 114.84 | 71.14 |
| Hardness, mmol. L−1 | 1.35 | 1.38 | 5.98 | 6.98 | 1.38 | 1.42 | 1.81 | 1.05 | 1.76 | 1.40 | 0.96 |
| Ca, mg L−1 | 18.05 | 19.50 | 62.12 | 100.20 | 19.20 | 19.24 | 24.40 | 14.00 | 22.44 | 20.04 | 13.63 |
| Mg, mg L−1 | 5.46 | 4.95 | 34.99 | 24.06 | 5.13 | 5.59 | 7.20 | 4.27 | 7.78 | 4.86 | 3.40 |
| Na, mg L−1 | 1.52 | 1.65 | 422.00 | 12.70 | 3.11 | 2.50 | 0.81 | 1.09 | 0.73 | 1.78 | 1.01 |
| K, mg L−1 | 0.21 | 0.18 | 11.80 | 3.78 | 0.69 | 0.66 | 0.77 | 0.12 | 0.73 | 0.18 | 0.10 |
| HCO3, mg L−1 | 74.50 | 78.70 | 336.00 | 226.00 | 38.48 | 42.60 | 58.36 | 39.80 | 57.00 | 82.00 | 35.00 |
| Cl, mg L−1 | 3.21 | 2.57 | 620.00 | 90.00 | 6.14 | 5.40 | 25.00 | 9.02 | 24.00 | 1.96 | 8.79 |
| SO4, mg L−1 | 5.31 | 4.55 | 79.00 | 66.20 | 35.04 | 33.40 | 9.78 | 9.35 | 10.00 | 4.02 | 9.21 |
| N-NH4, mg L−1 | 0.25 | 0.27 | 0.57 | 0.28 | 0.29 | 0.28 | 0.28 | 0.21 | 0.30 | 0.23 | 0.22 |
| N-NO2, mg L−1 | 0.07 | 0.05 | 0.01 | 0.02 | 0.04 | 0.02 | 0.06 | 0.05 | 0.05 | 0.09 | 0.06 |
| N-NO3, mg L−1 | 0.17 | 0.20 | 0.16 | 0.17 | 0.19 | 0.18 | 0.19 | 0.19 | 0.20 | 0.19 | 0.19 |
| P-PO4, mg L−1 | 0.04 | 0.05 | 0.04 | 0.04 | 0.04 | 0.04 | 0.19 | 0.04 | 0.23 | 0.04 | 0.05 |
| Ptot, mg L−1 | 0.09 | 0.11 | 0.05 | 0.05 | 0.05 | 0.06 | 0.22 | 0.07 | 0.24 | 0.10 | 0.08 |
| Porg, mg L−1 | 0.05 | 0.06 | 0.01 | 0.01 | 0.01 | 0.02 | 0.03 | 0.03 | 0.01 | 0.06 | 0.03 |
| Fetot, mg L−1 | 1.11 | 1.18 | 0.12 | 0.24 | 0.61 | 0.67 | 0.75 | 0.64 | 0.78 | 1.24 | 0.62 |
| Si, mg L−1 | 1.10 | 1.40 | 0.60 | 1.77 | 3.42 | 3.68 | 1.65 | 3.72 | 1.56 | 1.20 | 3.94 |
| Pt-Co units | 96.00 | 94.00 | 55 | 14 | 54.00 | 49 | 91.00 | 92.00 | 88 | 98 | 89 |
| Petrochemicals, mg L−1 | 0.0050 | 0.0050 | 0.0050 | 0.0050 | 0.0050 | 0.0050 | 0.0050 | 0.0050 | 0.0050 | 0.0051 | 0.0050 |
| Mn, mg L−1 | 0.0010 | 0.0010 | 0.0010 | 0.0010 | 0.0010 | 0.0010 | 0.7430 | 0.0010 | 0.1020 | 0.0010 | 0.0010 |
| Ni, mg L−1 | 0.0841 | 0.0792 | 0.0720 | 0.0747 | 0.0897 | 0.0958 | 0.0274 | 0.0343 | 0.0328 | 0.0888 | 0.0358 |
| Cu, mg L−1 | 0.0070 | 0.0050 | 0.0130 | 0.0110 | 0.0160 | 0.0170 | 0.0060 | 0.0060 | 0.0060 | 0.0070 | 0.0050 |
| Zn, mg L−1 | 0.0010 | 0.0010 | 0.0054 | 0.0010 | 0.0182 | 0.0196 | 0.0018 | 0.0010 | 0.0033 | 0.0010 | 0.0010 |
Disclaimer/Publisher’s Note: The statements, opinions and data contained in all publications are solely those of the individual author(s) and contributor(s) and not of MDPI and/or the editor(s). MDPI and/or the editor(s) disclaim responsibility for any injury to people or property resulting from any ideas, methods, instructions or products referred to in the content. |
© 2024 by the authors. Licensee MDPI, Basel, Switzerland. This article is an open access article distributed under the terms and conditions of the Creative Commons Attribution (CC BY) license (https://creativecommons.org/licenses/by/4.0/).
Share and Cite
Barinova, S.; Gabyshev, V.; Genkal, S.; Gabysheva, O. Diatoms’ Diversity in the Assessment of the Impact of Diamond and Oil and Gas Mining on Aquatic Ecosystems of the Central Yakut Plain (Eastern Siberia, Yakutia) Using Bioindication and Statistical Mapping Methods. Diversity 2024, 16, 440. https://doi.org/10.3390/d16080440
Barinova S, Gabyshev V, Genkal S, Gabysheva O. Diatoms’ Diversity in the Assessment of the Impact of Diamond and Oil and Gas Mining on Aquatic Ecosystems of the Central Yakut Plain (Eastern Siberia, Yakutia) Using Bioindication and Statistical Mapping Methods. Diversity. 2024; 16(8):440. https://doi.org/10.3390/d16080440
Chicago/Turabian StyleBarinova, Sophia, Viktor Gabyshev, Sergey Genkal, and Olga Gabysheva. 2024. "Diatoms’ Diversity in the Assessment of the Impact of Diamond and Oil and Gas Mining on Aquatic Ecosystems of the Central Yakut Plain (Eastern Siberia, Yakutia) Using Bioindication and Statistical Mapping Methods" Diversity 16, no. 8: 440. https://doi.org/10.3390/d16080440