Article

Oxygen Concentration and Its Implications for Microbial Structure and Metabolism: A Case Study in a Deep Tropical Reservoir

by
Alessandro Del’Duca
1,
Amanda Meirelles de Sá Janiques
2,
Raiza dos Santos Azevedo
3,
Fábio Roland
2 and
Dionéia Evangelista Cesar
2,*
1
Department of Education and Sciences, IF Sudeste MG, Campus Juiz de Fora, Juiz de Fora 36080-001, MG, Brazil
2
Graduate Program in Biodiversity and Nature Conservation, Department of Biology, Federal University of Juiz de Fora, Juiz de Fora 36036-330, MG, Brazil
3
LEGENE—Research Group in Genetic Engineering and Biotechnology, Laboratory of Molecular Biology, Institute of Biological Sciences, Federal University of Rio Grande (FURG), Rio Grande 96203-900, RS, Brazil
*
Author to whom correspondence should be addressed.
Diversity 2024, 16(8), 444; https://doi.org/10.3390/d16080444
Submission received: 30 May 2024 / Revised: 19 July 2024 / Accepted: 22 July 2024 / Published: 26 July 2024

Abstract

:
The vertical stratification of oxygen concentration in deep reservoirs impacts nutrient cycling and ecosystem biodiversity. The Serra da Mesa reservoir, the largest in Brazil, was studied to evaluate the structure and production of the prokaryote community at five depths. Using 3H leucine incorporation and fluorescent in situ hybridization (FISH), the study focused on different depths near the dam, particularly within the euphotic zone. The water column was characterized into oxic, transitional, and hypoxic layers based on dissolved oxygen concentration. The highest densities and biomasses of prokaryotes were found at the euphotic zone’s depth limit, where bacterial production was low, suggesting inactive or slow-growing bacteria. Cell size differences and filamentous bacteria presence near the surface were observed, likely due to varying predation pressures. Prokaryote community composition differed across depths. At the subsurface level, with high dissolved organic carbon, alphaproteobacteria, betaproteobacteria, and Cytophaga–Flavobacter had similar densities, but the lowest bacterial biomass was recorded. The highest dissolved oxygen concentration depth had the lowest bacterial density, dominated by alphaproteobacteria and gammaproteobacteria. The study revealed that prokaryotic community structure and production vary with depth, indicating that microbial participation in layer dynamics is differentiated, with variations in abundance and distribution linked to oxygen concentrations.

1. Introduction

As climate and land use change continue to increase the prevalence of anoxia in lakes and reservoirs globally, it is likely that anoxia will have major effects on freshwater carbon, nitrogen, and phosphorus budgets as well as water quality and ecosystem functioning. Carey et al. [1] have shown that anoxia leads to elevated concentrations of carbon, nitrogen, and phosphorus in lakes. This alteration in elemental stoichiometry transforms water bodies from nutrient sinks into nutrient sources. Additionally, Hounshell et al. [2] discovered that anoxic conditions result in elevated methane concentrations and greater global warming potential in hypolimnia. Particularly in hydroelectric reservoirs, the filling process, from the removal of plant biomass to its duration, can promote chemical stratification, especially in the early stages. Stratification due to the difference in oxygen concentration can form totally different layers metabolically. The nutrient gradient occurs due to chemical stratification and directly influences the distribution of the microbial community in the water column. Different microbial groups utilize nutrients differently, which directly impacts species distribution [3]. Thus, the flooding process and the age at which reservoirs are impounded are important in determining the conditions of the matter to be decomposed by microorganisms [4,5]. Heterotrophic bacteria, including alphaproteobacteria, betaproteobacteria, gammaproteobacteria, and Cytophaga–Flavobacter, are directly involved in the degradation of dissolved organic matter in aquatic environments [6,7].
Heterotrophic and autotrophic bacteria are essential in the process of oxidizing and reducing compounds, for example in the process of oxidizing ammoniacal nitrogen to nitrate via nitrite. In this process, oxygen is absorbed from the system. In the reverse process, the reduction of these nitrogen compounds occurs with the release of oxygen into the environment [8,9,10]. The decrease in the concentration of dissolved oxygen in the water with the differentiation into oxic and anoxic layers can be observed mainly in reservoirs with great depths. The metabolism and structure of microbial communities differ in these layers [11]. In addition, in stratified systems, the phylogenetic composition of microorganisms is distinct when comparing the oxic and anoxic layers, with greater bacterial diversity even being found in samples from deeper waters compared to the more superficial layers [12,13]. A high microbial diversity is observed in anoxic degradation, due to the varied pool of organic matter present in these regions. Similar rates of organic matter degradation in oxic and anoxic conditions can be explained by the quality of the organic matter, regardless of which electron acceptor is used [14,15].
Yue et al. [3] emphasize the relevance of the oxygen minimum zone (OMZ) in two reservoirs along the Wuijiang River. The absolute abundance of nitrifiers and denitrifiers in the water played a crucial role in the observed vertical stratification within the water column of the studied reservoirs. The processes of nitrification and denitrification demonstrate a synergistic interaction in the water column, influencing not only the vertical distribution of oxygen, but also nutrients cycling. These findings highlight the complexity of biogeochemical processes in reservoirs that can have serious consequences for primary productivity. Futhermore, they highlight the pressing need for an integrated approach to understanding and managing the effects of OMZs on water quality and health of aquatic ecosystems. The prokaryotic community is affected by the lack of oxygen in aquatic environments, leading to significant modifications in both structure and function. This impact directly influences biogeochemical cycles and the carbon balance. The expansion of OMZs in aquatic environments represents a growing threat to the health of ecosystems and the global climate [16]. The decrease in oxygen leads to the loss of fixed nitrogen and the production of greenhouse gases such as methane and nitrous oxide by microorganisms [17].
Nitrifying bacteria have a slower growth strategy and are stimulated by the addition of ammonia. They comprise two functional groups: those that oxidize ammonia to nitrite (betaproteobacteria and gammaproteobacteria) and others that oxidize nitrite to nitrate (alphaproteobacteria, betaproteobacteria, and gammaproteobacteria). Some bacteria in the alphaproteobacteria group grow more slowly and are adapted to low nitrite and oxygen concentrations, while others in the same group grow more quickly. Bacteria that oxidize ammonia are capable of oxidizing methane and vice versa (betaproteobacteria and gammaproteobacteria), showing physiological and phylogenetic similarities [18]. Although the greatest diversity and abundance is related to bacteria, archaea are also important in the functioning and structure of reservoir environments [19,20,21]. The community structure of ammonia-oxidizing archaea and novel nitrifiers, including Nitrospira inopinata, correlates with nitrification in full scale [22]. The discovery of Nitrospira species that encode all the enzymes necessary for ammonia oxidation to nitrate, and indeed completely oxidize ammonium to nitrate, challenges the traditional division of labor between ammonia-oxidizing and nitrite-oxidizing bacteria [23,24].
A scientometric review found that research on greenhouse gas (GHG) emissions from hydroelectric reservoirs is interdisciplinary [25]. Furthermore, these authors found that field investigations focused mainly on CO2, CH4, and N2O emissions and their spatiotemporal characteristics. This is due to the large contributions to the greenhouse effect and heterogeneities in GHG emissions in these reservoirs. They concluded that although great progress has been made in the area, there are still some research challenges. Some studies, in tropical reservoirs, demonstrate the relationship between GHG saturation in the water column and the mineralization of organic matter, primarily carried out by heterotrophic bacteria, thus affecting gas emissions from these reservoirs [26,27]. Among the future research priorities they suggest is improving the assessment of the life cycle of carbon emissions from hydroelectric energy. In addition, they include the need for studies of anthropogenic impacts on GHG emissions from hydroelectric reservoirs to explore the mechanisms of the carbon cycle of reservoirs in a changing environment. In this study, we evaluated the structure of prokaryote communities and bacterial production along a vertical profile in one of the largest reservoirs of Brazil for electricity generation, the Serra da Mesa reservoir. The maximum depth near the dam is over 107 m and anoxia can be observed at great depths at certain times of the year in this reservoir [28,29]. During sampling time, this reservoir had high CO2-Eq. emissions which reflects its young age [30]. Carbon emissions are correlated to reservoir age and latitude, with the highest emission rates from the tropical Amazon region [31].

2. Material and Methods

The study was carried out in the largest reservoir in terms of water volume in Brazil, the Serra da Mesa reservoir. It is located in the Goiás state (13°49′ S; 48°18′ W), in the midwest region of Brazil, with a tropical rainy climate. The reservoir has a flooded area of 1.785 km2 and a volume of 55 km3 [29]. The samples were collected eight years after the reservoir was filled. The collection took place during the period following the rains at the end of summer. Sampling took place at a point near the dam of the reservoir at different depths, using a Van Dorn bottle. Determining the depths took into account the depth of the euphotic zone measured by the radiometer (Li-Cor), so in addition to the subsurface, the bottom (107 m), the limit depth of the euphotic zone (12 m), half of it (6 m), and half of the aphotic zone (47 m) were selected. For each depth, we determined the temperature (measured using a thermometer), the dissolved oxygen concentrations in the water using the specific method described by Roland et al. [32], the dissolved organic carbon (analyzed using the Phoenix 8000/Tekmar-Dohrmann carbon analyzer), and ammonia nitrogen and nitrate levels using the method described by Wetzel and Linkens [33].
Bacterial production was determined by the incorporation of 3H leucine using the centrifugation method [34]. The structure of the prokaryote community was determined using the fluorescent in situ hybridization (FISH) technique. Samples in triplicates were fixed with 20% paraformaldehyde (final concentration 2%), filtered through white 0.2 μm pore polycarbonate filters and kept refrigerated at 4 °C until the hybridization process was carried out [35]. 16S rRNA probes were used to identify alphaproteobacteria, betaproteobacteria, gammaproteobacteria, Cytophaga–Flavobacter, and archaea (Table 1), as well as DAPI to quantify total prokaryotes. A negative control marker (5′-CCTAGTGACGCCGTCGAC-3′), which has no specificity for any bacterial group, was used. Ten random fields were analyzed on each filter using an Olympus IX-71 epifluorescence microscope.
The average total prokaryote biomass was determined from image capture (Evolution VF cooled CCD camera) and analysis of each cell (Image Tool 3.0 software). The volume of the prokaryotic cells was calculated from the area [36] and then the cell biomass was determined [37]. The average cell biomass of the sample was determined and multiplied by the total prokaryote density of the sample, resulting in the average prokaryote biomass of the sample. A similar procedure was used to determine the biomass of prokaryotes in the different groups analyzed. Data on the composition of the prokaryote community were compared at the different depths analyzed by one-way ANOVA, with p-values p < 0.05 considered significant.

3. Results

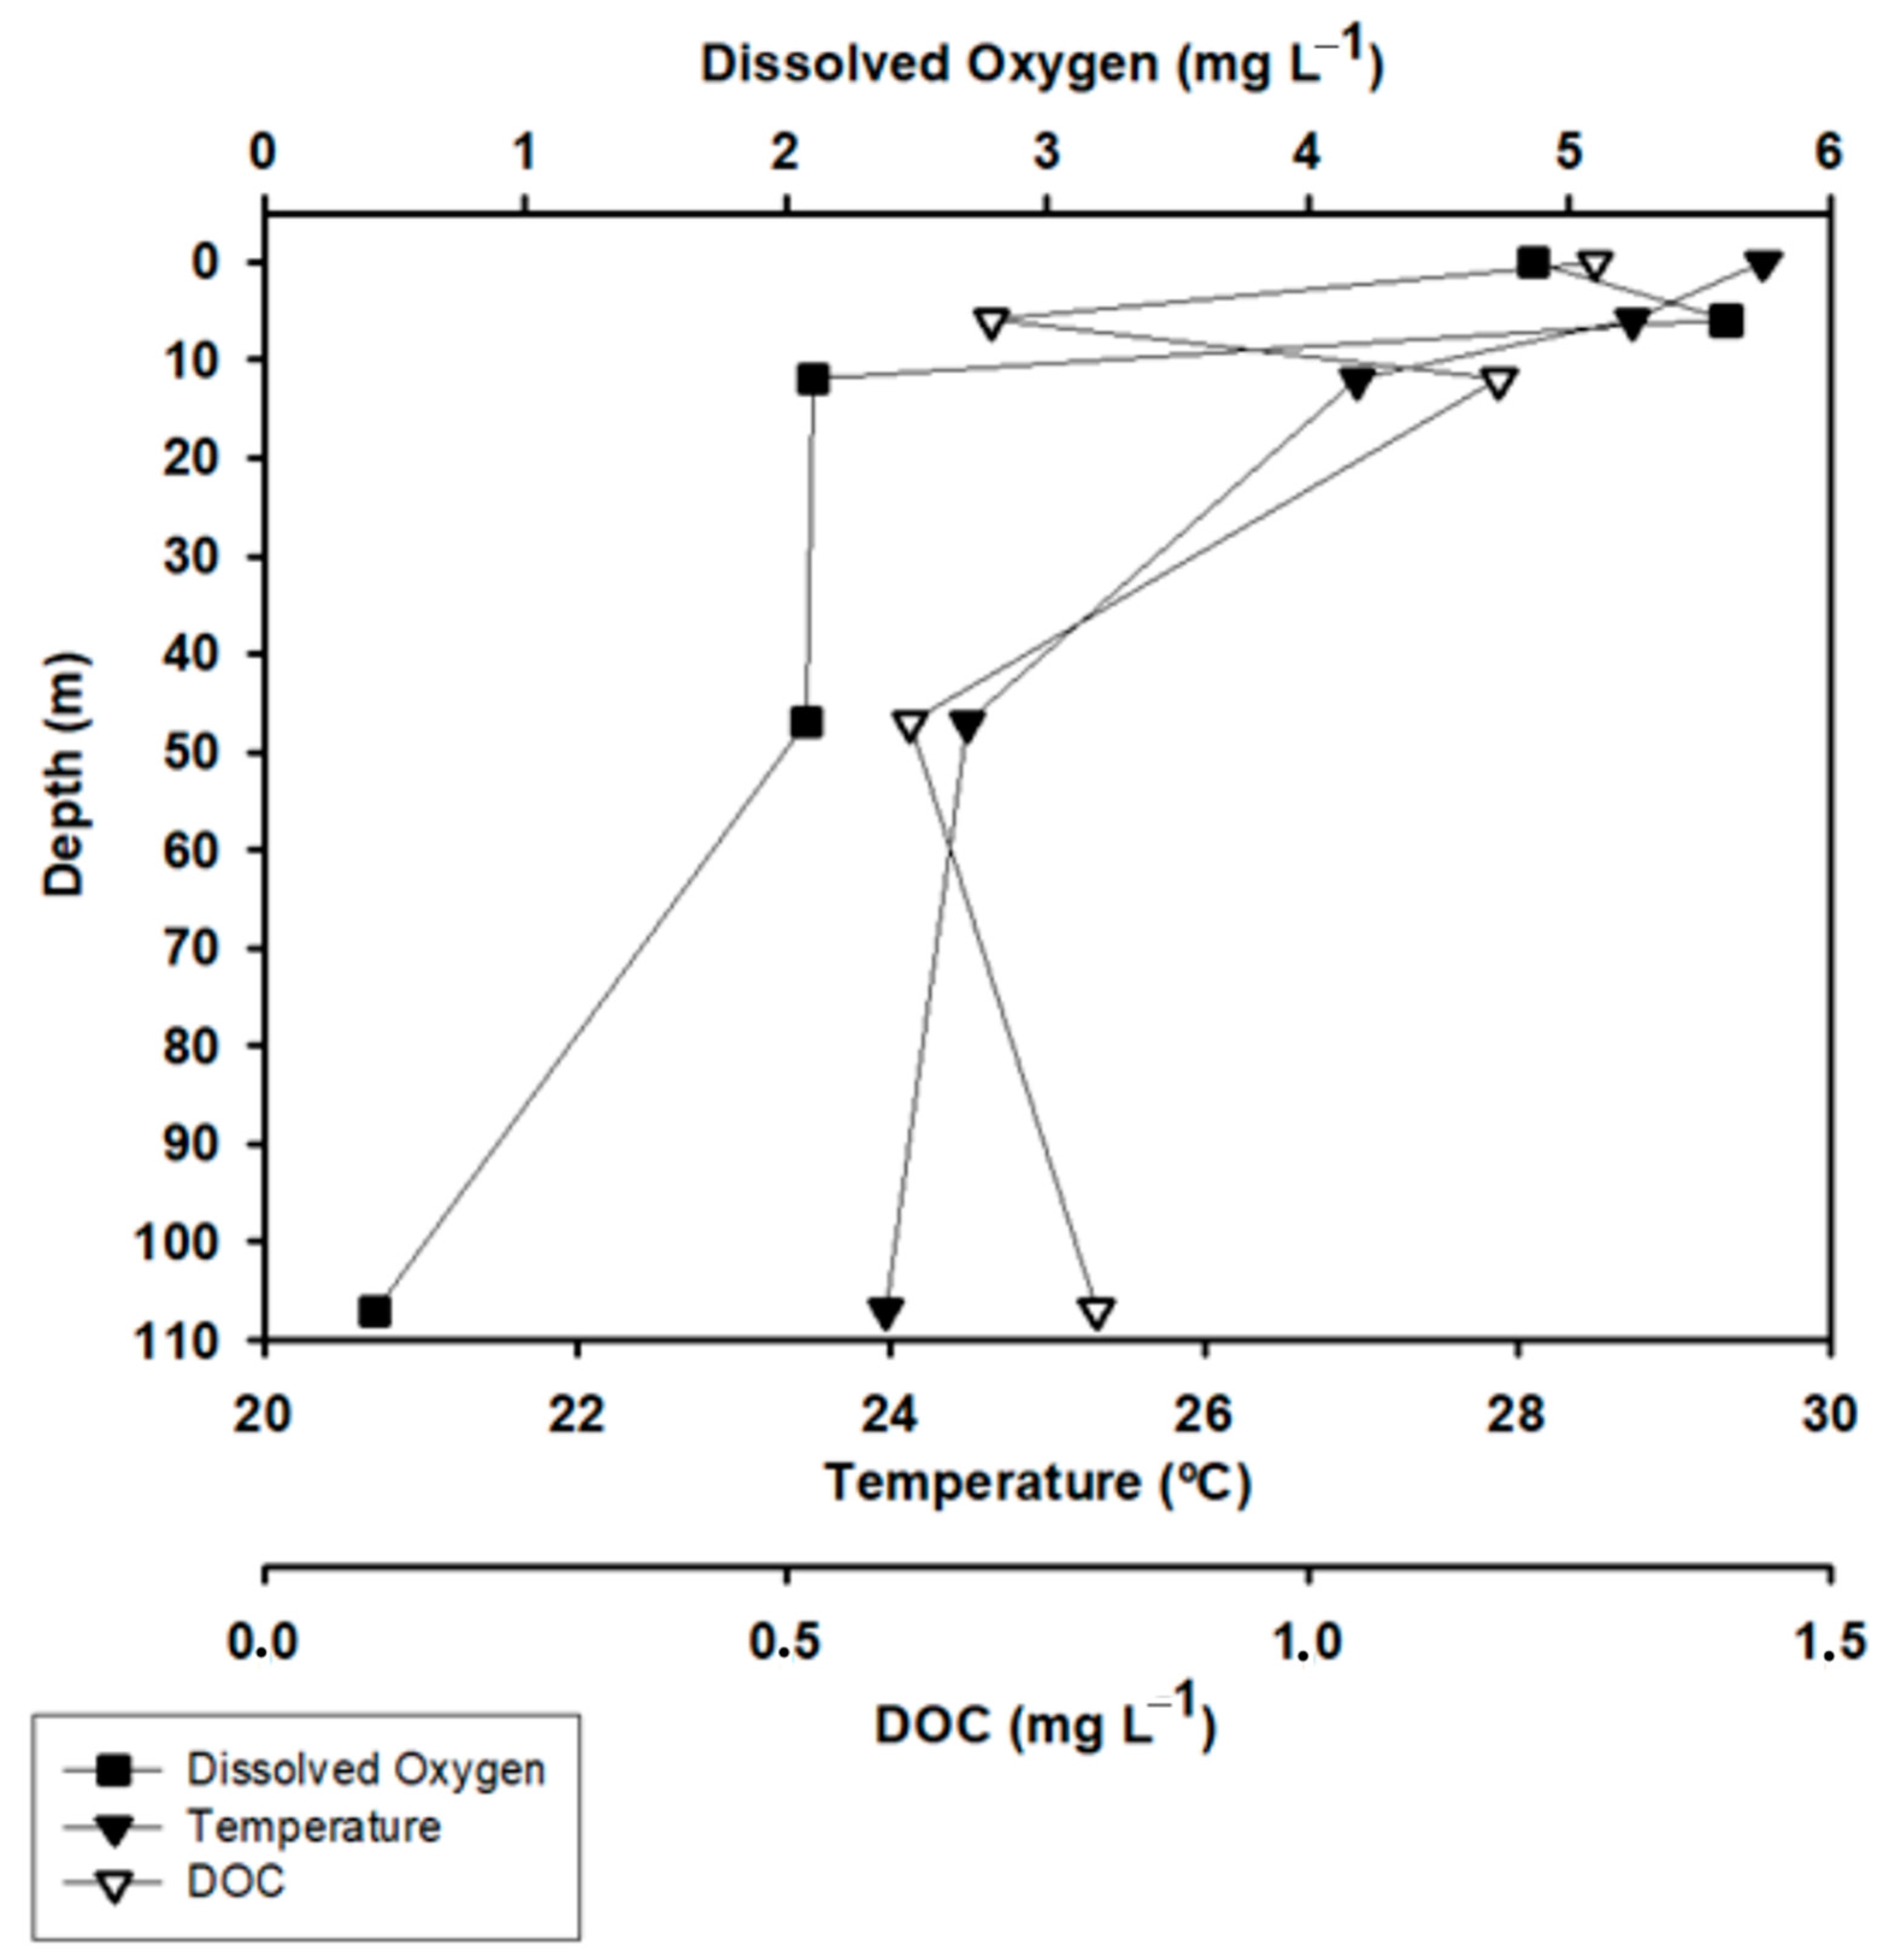
3.1. Oxygen and Temperature Profiles

The data analyzed from the Serra da Mesa reservoir dam profile made it possible to divide the water column into distinct layers in relation to the concentration of dissolved oxygen in the water. The first is an oxic layer (from the surface to 12 m), followed by a hypoxic layer and an anoxic bottom (107 m).
The highest concentration of dissolved oxygen in the water (6.0 mg × L−1) was found in the oxic layer, at a depth of 6 m, and the lowest concentration (0.4 mg × L−1) was found at the anoxic bottom. The limit of the photic zone (depth of 12 m), belonging to the oxic layer, showed a drop in the concentration of oxygen dissolved in the water (2.0 mg × L−1). The temperature decreases along the depth profile with the greatest decreases recorded in the hypoxic layer, in the first 47 m of depth, from 29.5 to 26.9 °C (Figure 1).

3.2. Nutrient Concentrations

Dissolved organic carbon content was highest in the oxic layer subsurface (1.3 mg × L−1) and lowest (0.6 mg × L−1) in the hypoxic layer at the 47 m depth (Figure 1). The highest concentration of ammoniacal nitrogen (190 μg × L−1) was found in the hypoxic layer at a depth of 47 m and the lowest was found in the oxic layer at 6 m (22 μg × L−1). The highest nitrate value (372 μg × L−1) was found in the oxic layer, at the limit of the photic zone (12 m). The concentrations of ammoniacal nitrogen and nitrate are opposite in the oxic layer (depth of 12 m) and the hypoxic layer (depth of 47 m). In the oxic layer until the limit of the photic zone (depth of 12 m), a higher concentration of nitrate was found than ammoniacal nitrogen, and the opposite was true in the hypoxic layer (depth of 47 m) (Figure 2).

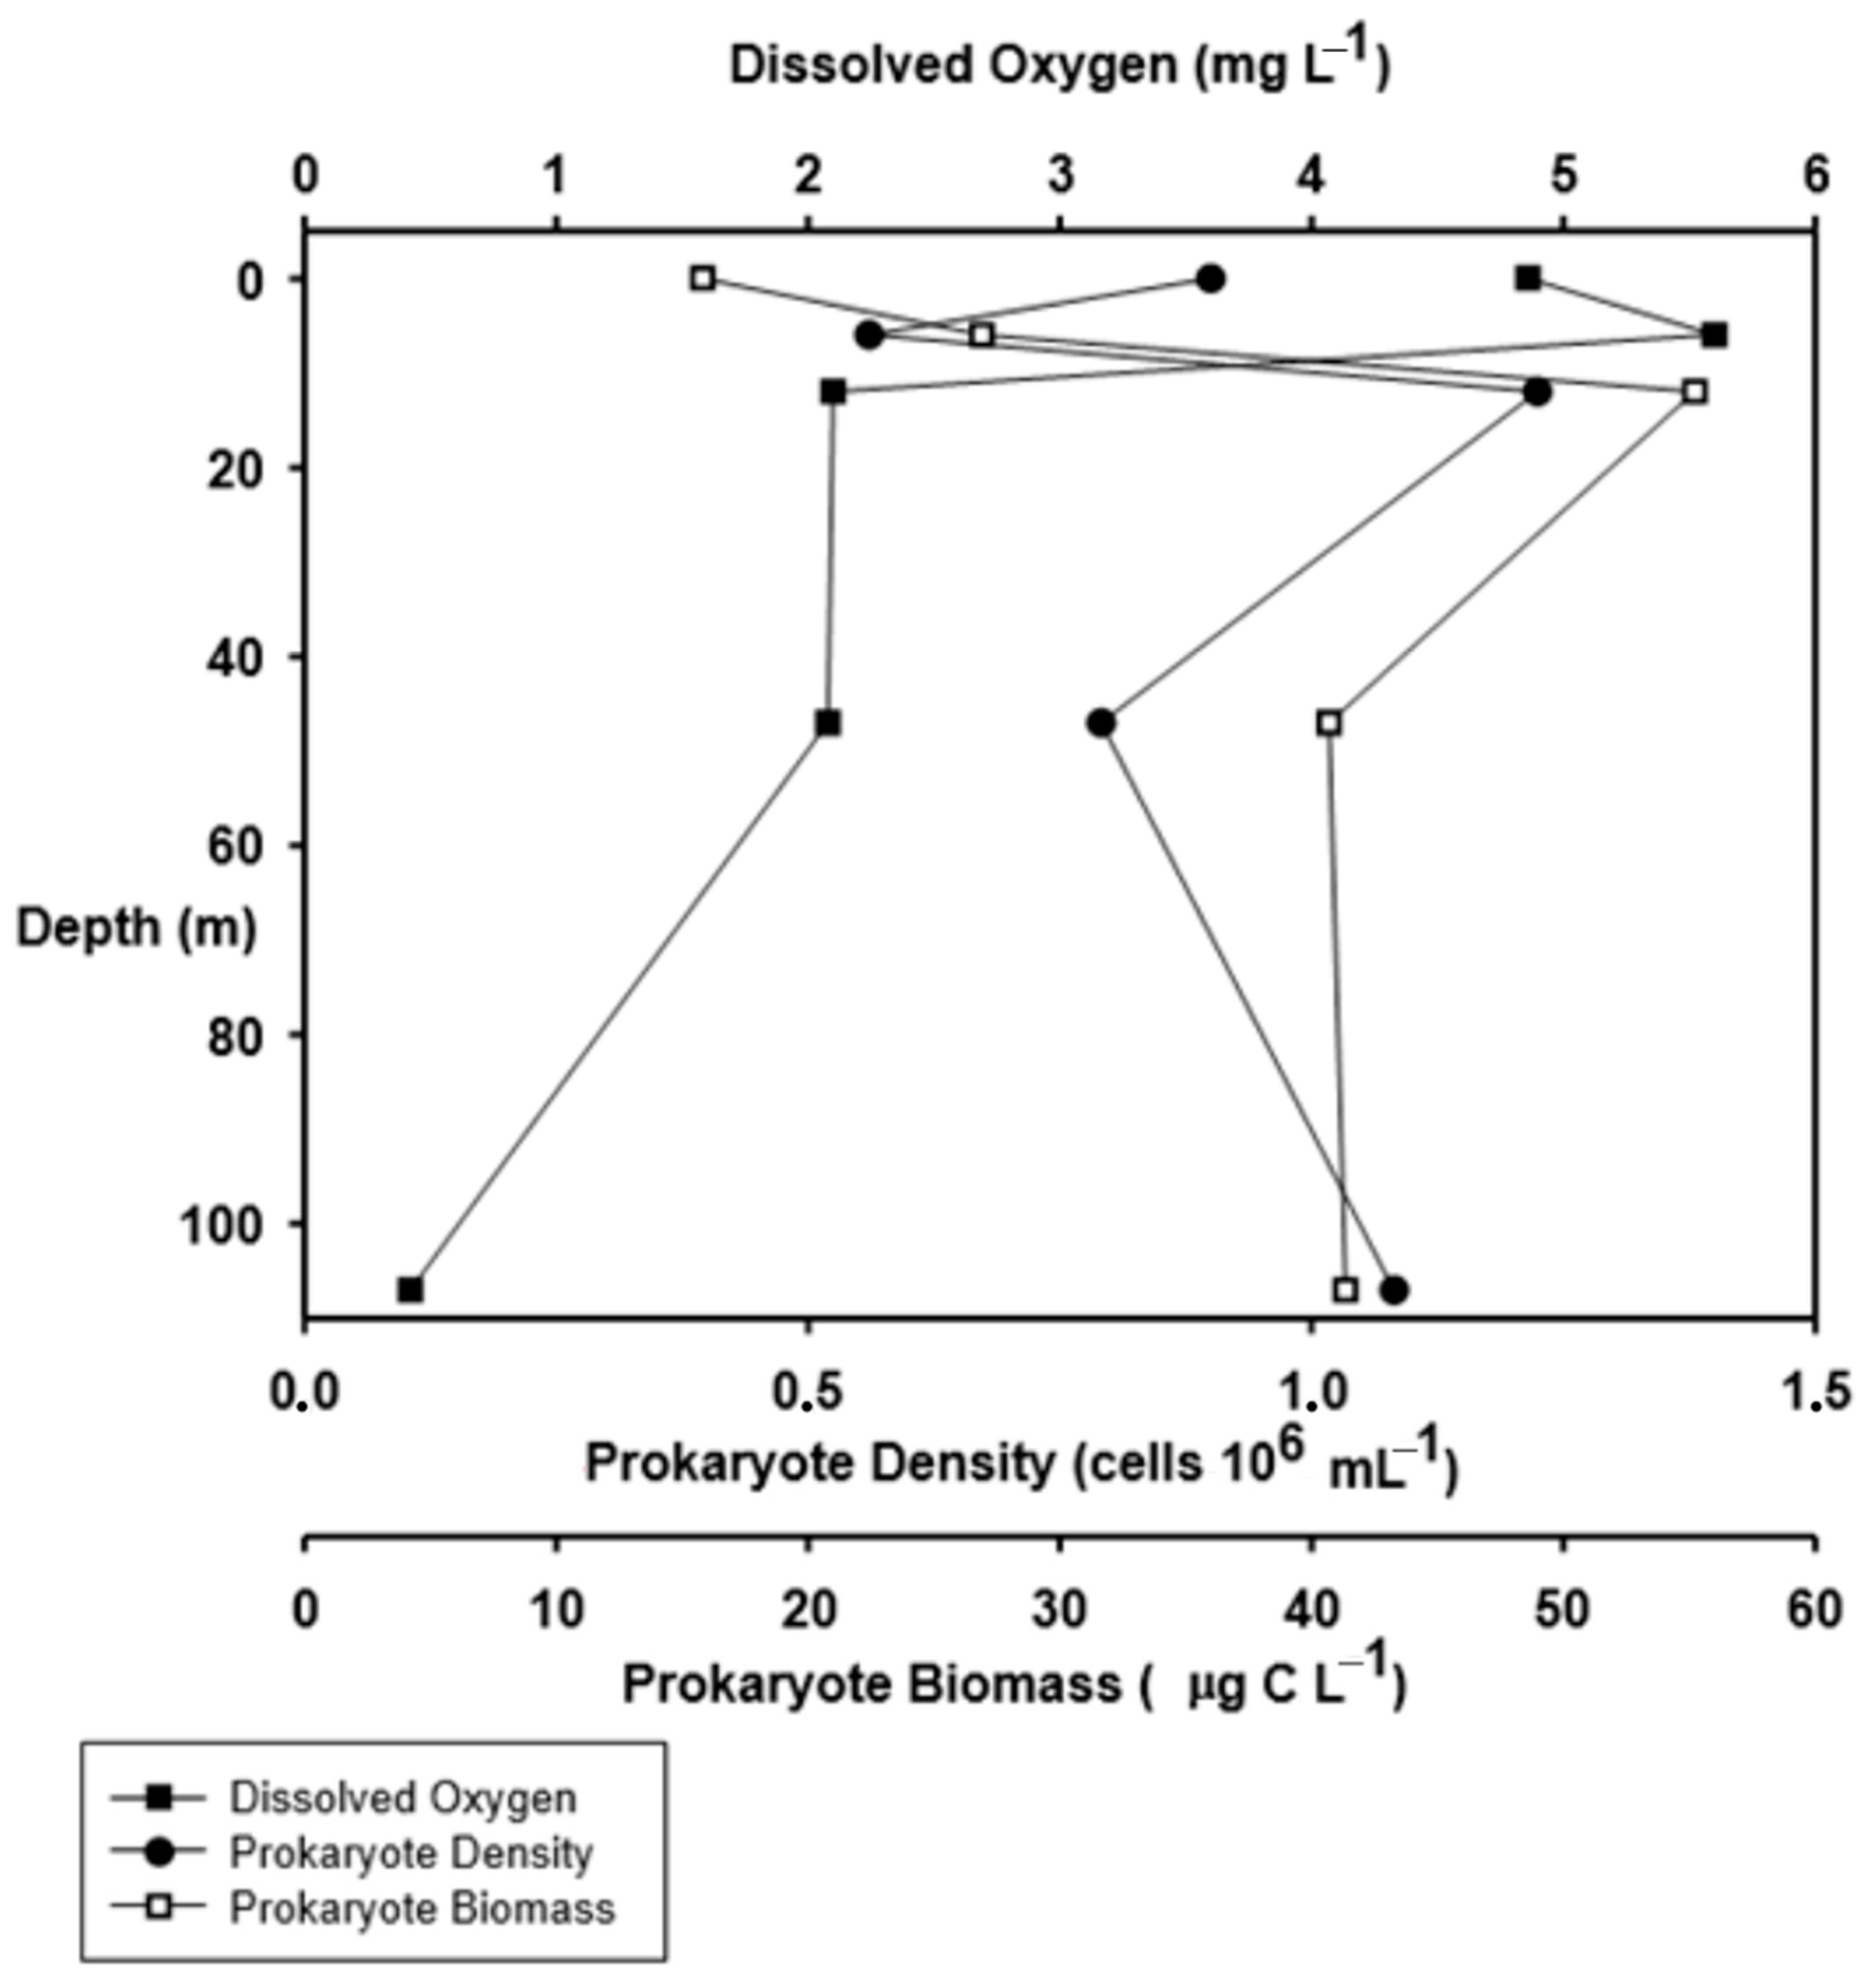
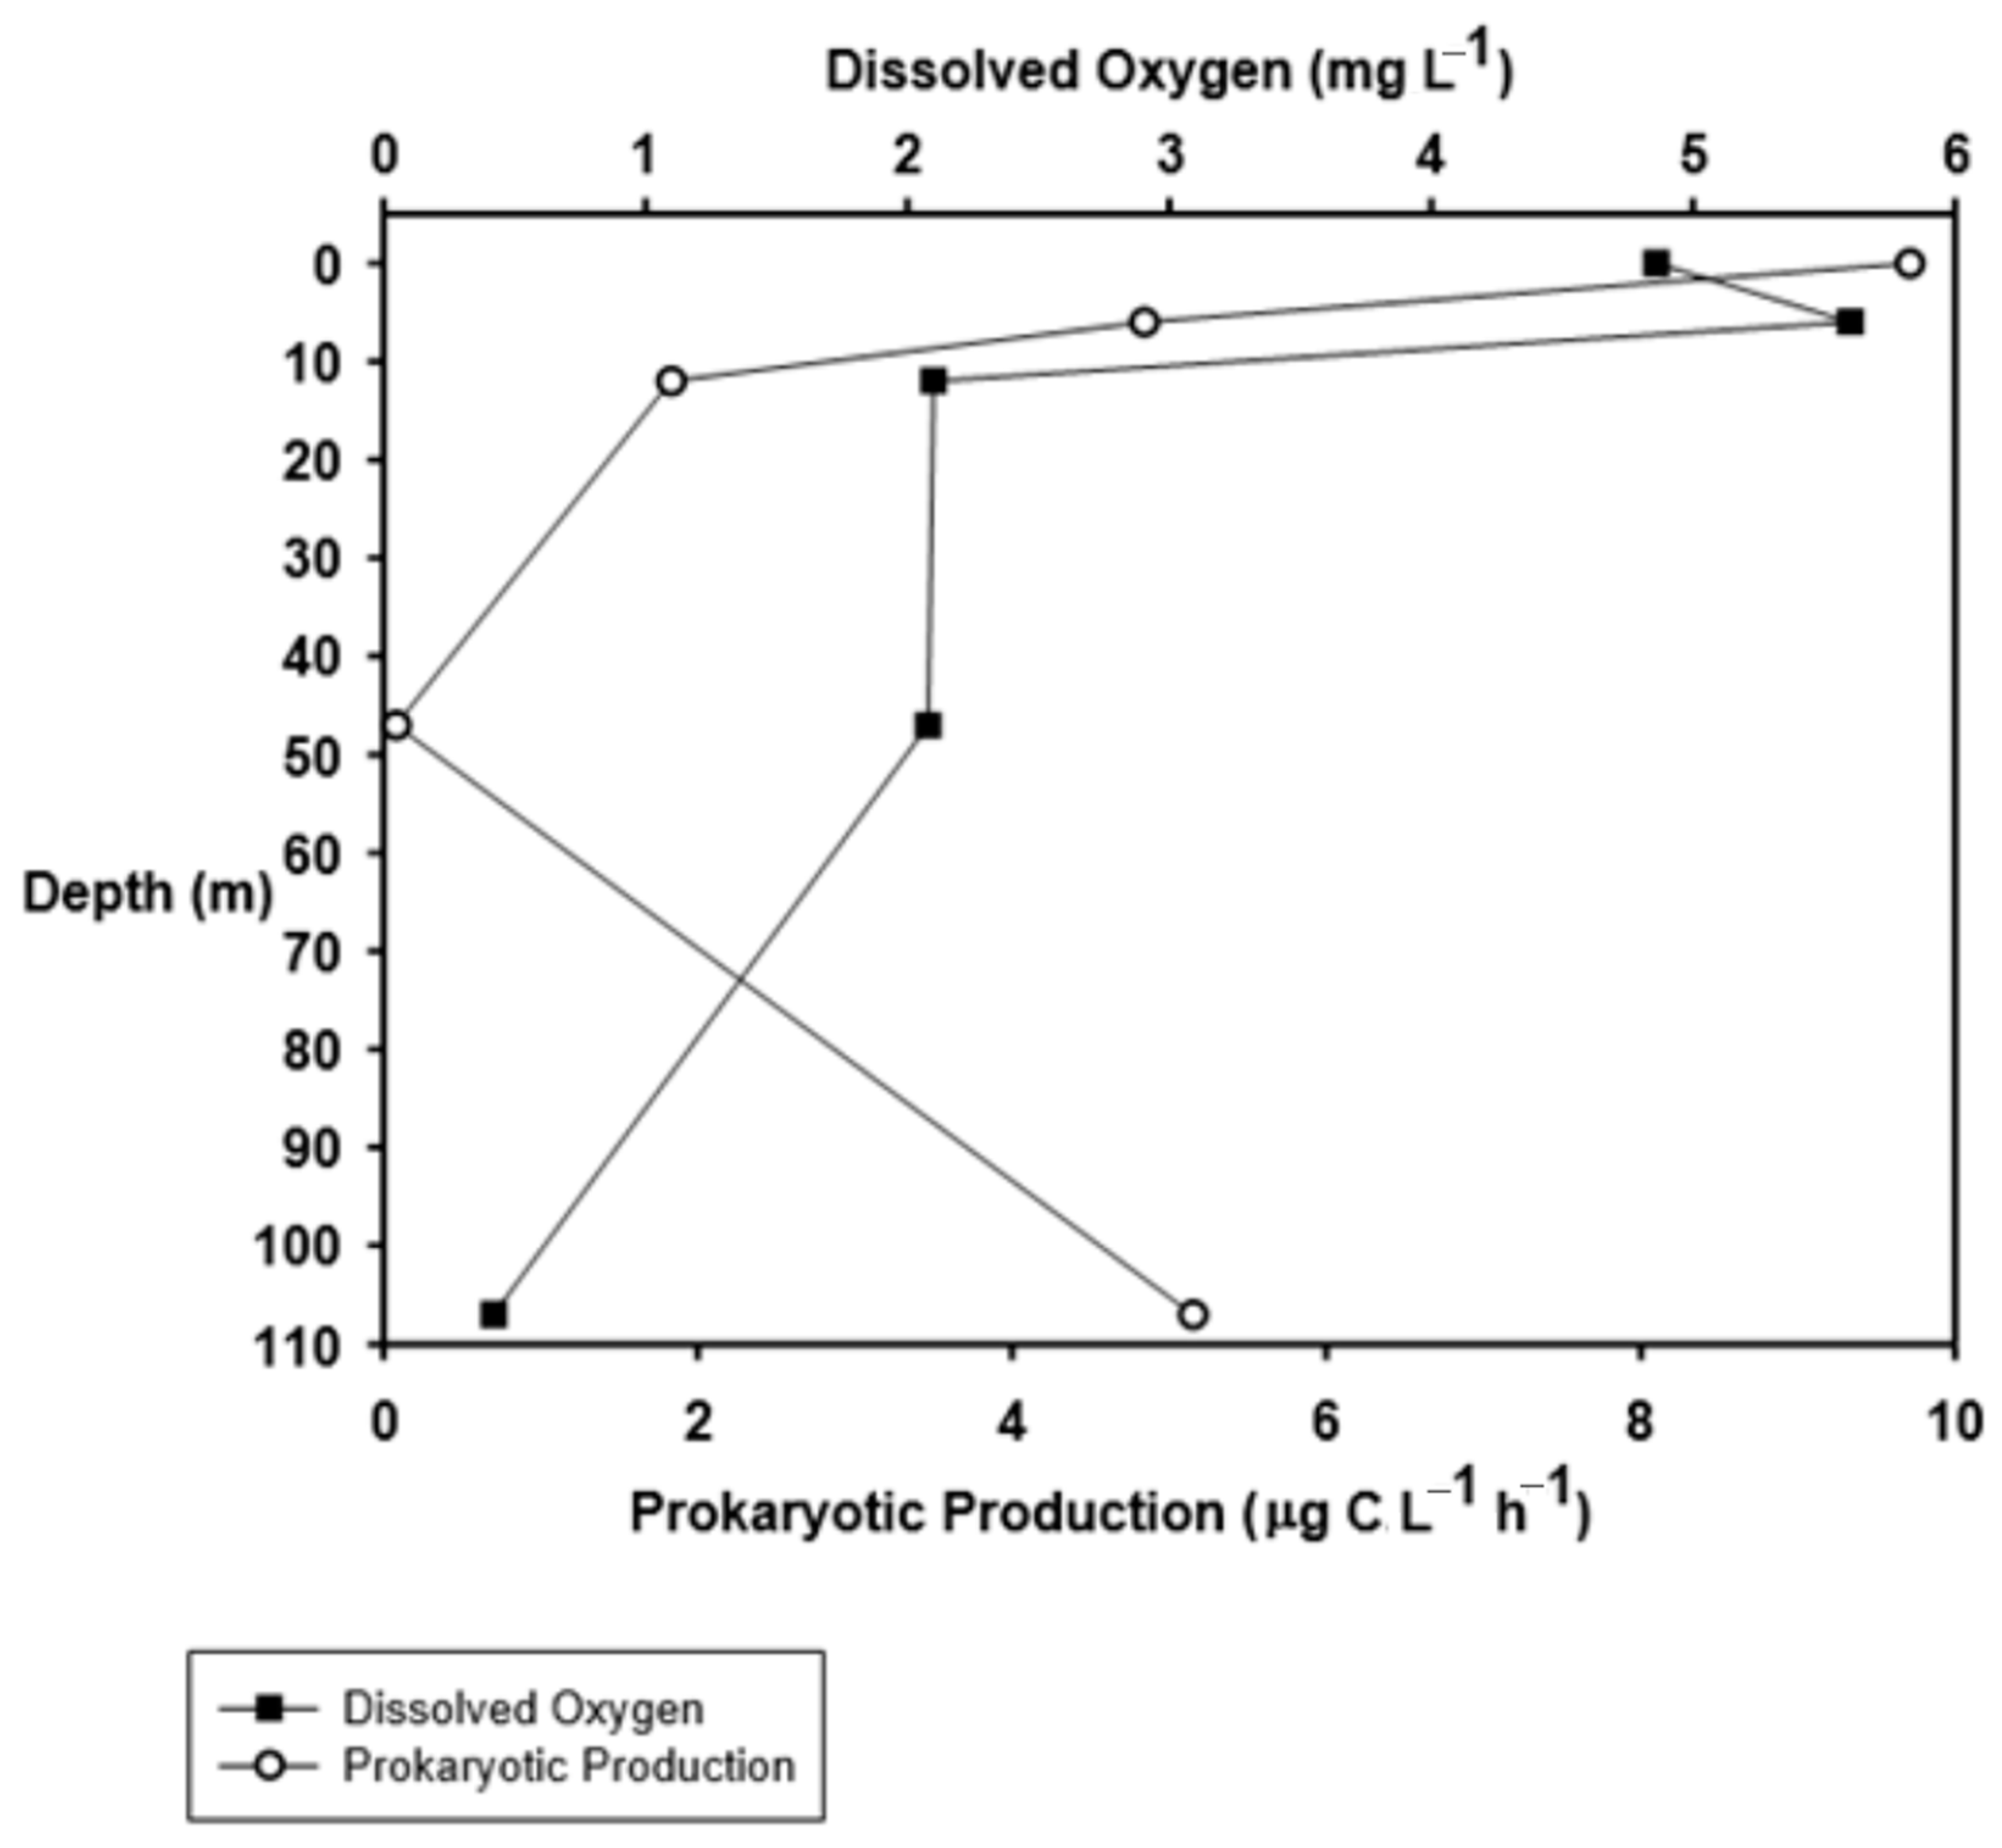
3.3. Density, Biomass, and Production of Prokaryotes

Regarding the density of prokaryotes in the profile analyzed, both the lowest and highest values were found in the oxic layer. At a depth of 6 m, the lowest density was observed (0.6 cells × 106 × mL−1), and the highest density was observed (1.2 cells ×106 × mL−1) at the limit of the photic zone (depth of 12 m). The anoxic bottom (107 m) also presented the same density value found at the limit of the photic zone (12 m).
The biomass of prokaryotes showed higher values from the hypoxic layer, where bacteria with greater volume and less elongation were found. The lowest prokaryote biomass (16 μg C × L−1) was found in the oxic layer subsurface (Figure 3 and Figure 4). Integrating the biomass of prokaryotes in this profile (4.5 mg C mm2), we see that more than half of this biomass is found in the hypoxic layer (2.5 mg C mm2). The highest prokaryote production rates were observed in the oxic layer subsurface (9.7 μg C × L−1 × h−1) and the anoxic bottom (5.1 μg C × L−1 × h−1) of this profile. Looking at the hypoxic layer (depth of 47 m) and anoxic bottom (depth of 107 m), there is a reversal in oxygen concentrations and prokaryote production rates.
The lowest production (0.1 μg C × L−1 × h−1) was measured at the hypoxic layer (depth of 47 m), where the highest concentration of ammonia nitrogen was found, as well as the lowest concentrations of nitrate and dissolved organic carbon (Figure 1, Figure 2 and Figure 5). Comparing the oxic layer surface and anoxic bottom, different situations were observed. Analyzing the oxic layer, the surface showed lower density and biomass, but with a higher production. The opposite happened in the oxic layer at the limit of the photic zone (depth of 12 m). At the anoxic bottom, similar to the limit of the photic zone, higher density and biomass values were found. However, the anoxic bottom showed greater production (Figure 3 and Figure 5). With regard to morphological characteristics, the determination of elongation and biovolume indicates the presence of filamentous bacteria in the oxic layer subsurface. In this region, they showed greater elongation and lower biovolume compared to the prokaryotes from the other depths (Figure 4).

3.4. Microbial Community Composition

The composition of the archaeal community differed between layers, with a higher relative density at the anoxic bottom and a lower density at the oxic layer at the limit of the photic zone (depth of 12 m) (Table 2). The composition of the bacterial community on the anoxic bottom (depth of 107 m) differed significantly from the composition found at the oxic layer (depth of 6 m) and hypoxic layer (depth of 47 m).
The same proportions (10%) of bacteria from the alphaproteobacteria, betaproteobacteria, and Cytophaga–Flavobacter groups were found in the oxic layer subsurface. In this layer, the proportion of the gammaproteobacteria group was below the proportion limit accepted for the negative control (<0.1%). At the oxic layer (depth of 6 m), with the highest oxygen concentration and lowest total density of prokaryotes, bacteria from the alphaproteobacteria and gammaproteobacteria groups were proportionally the largest representatives (9%) and bacteria from the Cytophaga–Flavobacter type the smallest (3%) of the groups evaluated.
In the oxic layer, at the limit of the photic zone (depth of 12 m), the highest density of prokaryotes was found, and this community was mainly represented by Cytophaga–Flavobacter bacteria (12%). In the hypoxic layer, at 47 m depth, where the lowest rate of bacterial production was found, more than 80% of the prokaryotes did not belong to any of the groups assessed in this study. Of the groups evaluated, betaproteobacteria was the most representative (6%) at this layer. Unlike the previous layer, at the anoxic bottom (depth of 107 m), half of the prokaryotes belonged to the bacterial groups evaluated, with the largest number of representatives from the alphaproteobacteria group (Table 2).
Analyzing the biomass of the most-studied groups at each layer, we have the highest proportion of archaeal biomass at the oxic layer at the limit of the euphotic zone (55%), and the lowest in the same layer, but at depths of 6 and 12 m (2.2%). The biomass of bacteria from the alphaproteobacteria group in the oxic layer (6 m), hypoxic layer (47 m), and anoxic bottom (107 m) was 9, 7, and 23%, respectively. The proportion of biomass of the betaproteobacteria group was similar to the proportion of biomass of the alphaproteobacteria in the oxic layer at the 6 m depth. The biomass of this group was also representative in the oxic layer subsurface (15%).
However, the betaproteobacteria were the least representative in terms of biomass in the oxic layer (depth of 12 m) and in the anoxic bottom (depth of 107 m). The biomass of the gammaproteobacteria group was found in lower proportions compared to the other bacterial subclasses analyzed, at the oxic layer surface and hypoxic layer (depth of 47 m). The biomass of bacteria of the type Cytophaga–Flavobacter was representative in the oxic layer subsurface, along with the biomass of betaproteobacteria, and at the oxic layer at the limit of the euphotic zone (depth of 12 m) (Table 3).

4. Discussion

The oxygen concentration was highest from the surface to 12 m (photic zone), gradually decreasing as the depth increased and the light intensity decreased, reaching the lowest values at the bottom (107 m) where there was no presence of light (zones aphotic). These differences in the concentration of oxygen dissolved in the water made it possible to characterize this profile of the water column into oxic, hypoxic, and anoxic layers. O’Boyle and Nolan [38] demonstrated a strong correlation exists between oxic layer oxygen under-saturation and stratification, enabling the development of predictive models and estimation of oxygen consumption rates. At this layer, the highest concentration of nitrate and one of the highest concentrations of dissolved organic carbon were also found. The concentration of ammonia nitrogen was higher in the hypoxic layer that corresponds to the middle of the aphotic zone. Water column oxygenation significantly impacts nutrient recycling [39]. Oxygen scarcity alters the structure and function of microbial communities and consequently alters nutrient cycles and carbon balance [40,41,42]. Pajares et al. [43] suggest a biogeographic structure of the bacterioplankton in marine OMZs with limited community mixing across water masses, except in upwelling events, and little dispersion of the community by currents in the euphotic zone. Oxygen production and consumption by aerobic processes are linked to oxygen production within the anoxic zone [44]. Bacterioplankton in the oxygenated hypolimnion are reportedly dominated by specific members that are distinct from those in the epilimnion in a deep mesotrophic lake [45].
The Serra da Mesa reservoir had the highest primary production rates and is characterized by low turbidity and nutrient levels above those considered limiting to phytoplankton growth. Yet, it has a high GHG emission profile; however, this is a high-energy producing system. The hydropower emissions and energy produced by reservoirs, when compared to fossil fuel electricity production, can be categorized as a low emission renewable energy source [30]. Dams and reservoirs have significant impacts on local climate change and seasonal variation by altering precipitation and evaporation patterns [5,46]. Moreover, they significantly modify ecological conditions, affecting bacterioplankton structure and function [47]. Additionally, dams play a crucial role in shaping microbial community assembly and nitrogen transformation processes [48]. The observed low concentrations of nitrate in the oxic layer surface can be attributed to phytoplankton’s utilization of this nitrogenous compound. Consequently, nitrate accumulates in regions where phytoplankton density is lower. Furthermore, ammoniacal nitrogen from the surface of the oxic layer, corresponding to the photic zone, can be assimilated by phytoplankton before undergoing nitrification by bacteria [49,50]. Another significant impact of dams, as described by [51], is the decrease in flow velocity induced by dams. This reduction is a critical factor in transitioning riverine systems from heterotrophic to autotrophic, thereby altering microbial food web dynamics.
Metrics of functional and trait dispersion indicated that microbial communities are phylogenetically and functionally more overdispersed in oxic waters, but clustered within the OMZ [52]. The maximum density of prokaryotes in our study occurred at 12 m depth, corresponding to the oxic layer at the limit of the euphotic zone. Meanwhile, higher prokaryote production values and lower biomass were found on the oxic layer surface. The number of active bacteria could be more variable than the total number of bacteria. The oxic layer at the limit of the euphotic zone (depth of 12 m) showed the highest density and biomass of prokaryotes and a low bacterial production. This suggests that these bacteria grow more slowly in this transition zone or are inactive. Although some recent studies have shown inconsistencies in measuring prokaryotic production using leucine incorporation [53,54], it is important to emphasize that these measurements can indicate comparative effects between layers, allowing us to infer the greater or lesser activities of prokaryotic groups. The difference in the production of prokaryotes in the layers may be related to the different control mechanisms over it in the layers, as this favors certain groups that have different growth strategies [55]. In addition, bacterial communities in tropical inland aquatic ecosystems had higher metabolic rates and lower bacterial growth efficiency than temperate ecosystems [56].
Microorganisms can occupy different metabolic niches in oxygen minimum zones [57]. Yang et al. [58] used synthetic microbial ecology approaches to evaluate the niche differentiation, coexistence, and interactions among comammox (Nitrospira inopinata) and other metabolically distinct nitrifiers. Yang et al. [59] shed light on the pivotal role played by multi-trophic microbiota in nitrogen cycling processes within dam-induced systems. Meanwhile, Shi et al. [60] delved into the spatiotemporal dynamics of microbial communities within the Xiaowan Reservoir (China), uncovering distinct patterns in water columns and sediments driven by environmental factors. Another study by Nie et al. [61] demonstrates niche differentiation among nitrite-dependent anaerobic methane oxidation bacteria, based on nitrite affinity and inhibition thresholds. Additionally, Samad et al. [62] explore the impact of temperature on zooplankton-associated, particle-associated, and free-living microbes in artificially warmed lakes, revealing significant differences in diversity and composition across these ecological niches. In our study, in the oxic layer up to the depth limit of the euphotic zone (12 m), the Cytophaga–Flavobacter group was the most representative and the betaproteobacteria the least representative when compared to the other groups analyzed. This last group has bacteria responsible for oxidizing nitrite to nitrate. However, the highest concentration of nitrate was found at this depth, suggesting that bacteria from other groups capable of oxidizing nitrite to nitrate are at work. Competition or synergism relationships between nitrifying prokaryotes can lead to better assimilation of nutrients, increased density of these microrganisms, and modification of biodiversity [18,52].
Ecological processes of element cycling and large dam disturbances are important in driving the assemblages of river bacterioplankton communities [63]. In aquatic environments, the quantity and availability of certain nutrients, as well as some physical factors (such as ultraviolet radiation) and biological factors (such as predation pressure) can determine the structure and production of the bacterial community. Prokaryote production tends to be higher at oxic layer depths close to the surface or on the anoxic bottom. However, variations in bacterial activity are not necessarily related to changes in community structure. [64]. The superficial oxic layer, 6 m depth of the oxic layer, and anoxic bottom (107 m) showed the highest production rates, showing that there is an aerobic microbial community producing in the euphotic zone distinct from the anaerobic bottom community observed. Langenheder et al. [65] found that vertical changes in the composition of the bacterial community coincided with variations in the production of dissolved inorganic carbon, oxygen consumption, and bacterial production, suggesting a relationship between the composition of the bacterial community and its function in each layer studied.
The taxonomic and predicted functional communities of bacterioplankton exhibit divergent responses to the impoundment in reservoirs [66]. For example, damming caused a pronounced decline in betaproteobacteria, gammaproteobacteria, and bacteroidetes from upstream to downstream sites in a large river dam [67]. The profile analyzed in the tropical reservoir studied showed variations in the density and biomass of the groups analyzed. Differences in the composition of the prokaryote community comparing the layers were found according to the concentration of dissolved oxygen in the water. In the oxic layer subsurface, for example, where the highest concentration of dissolved organic carbon was found, the alphaproteobacterial, betaproteobacteria, and Cytophaga–Flavobacter groups had similar densities, although the highest biomasses were related to the last two groups. The dissolved organic carbon that remains resistant to rapid microbial decomposition has the ability to accumulate in the surface layers of the water, generating vertical gradients in dissolved organic carbon, and can be altered into recalcitrant compounds by heterotrophic microorganisms [68,69,70,71]. At the hypoxic layer (depth of 47 m), which had the lowest concentration of dissolved organic carbon and the lowest rate of bacterial production, the main group found in density was the betaproteobacteria, although the main biomass at this depth was related to the alphaproteobacteria. Although biomass measurements were not divided by microbial groups, considering that biomass calculation was based on biovolume measurements, it is likely that alphaproteobacteria had a larger biovolume than betaproteobacteria. The same trend was observed in prokaryotic production at the different layers. Thus, all these data suggest that different bacterial groups were in different growth phases.
Pierangeli et al. [21] determined environmental variables that influenced abundant and rare microbial communities in reservoir sediments, highlighting the layers of the water column and pollution indicators as factors affecting the communities. Most of the abundant bacteria and archaea comprised microorganisms that had not yet been cultivated or classified. Also, they pointed out the depth of the water column as an influencing factor on the microbial community, being negatively correlated with the relative abundance of Proteobacteria in sediment samples from a reservoir; however, the phylum was dominant in all samples [72]. This group of bacteria is also the most common at all depths in marine environments, including the OMZ [73]. Within the group of gammaproteobacteria there are species that are responsible for oxidizing nitrite to nitrate. It is known that bacteria that oxidize nitrite are more sensitive to light than those that oxidize ammonia [10,74]. This may explain the low density of gammaproteobacteria found on the oxic layer surface. However, in this profile, this group showed one of the highest densities in the oxic layer at a depth of 6 m, where the highest oxygen concentration was observed. This may be related to phylogenetic differences within the group itself.
High bacterial densities are found in deep regions, and microorganisms from the archaea are mainly found at these greater depths, where the metabolism is anoxic [75,76]. The abundance of both Thaumarcheota and Eryarcheota were elevated in the suboxic bottom water in Devil’s Hole, Bermuda [77]. Lentini et al. [78] compared the vertical distribution of microorganisms from the Archaea and Bacteria domains in a meromictic lake by fluorescent in situ hybridization. These authors found a greater quantity of components from the Bacteria domain in the surface waters and from the Archaea domain in the deep layers. Species uniformity was higher in the oxic layer, while species richness was higher in the anoxic bottom. In the study by Humayoun et al. [79], the bacterial community found on the anoxic bottom showed greater diversity compared to the oxic samples, suggesting a greater opportunity for this community in the deep water niches compared to the surface waters. The bacterial community was more sensitive than the archaeal community to changes in the spatial characteristics of the tidal reach in the Yangtze River [80].
Prokaryotic cell size and shape could be useful to the ecosystem [81]. The different controls on the bacterial community at the different layers mean that the structure of the bacterial community is also different and thus morphological differences are found in the bacterial cells from one layer of the water column to another [82]. The prokaryotic cells in this study showed variations in their volume and shape at the different layers analyzed. The greatest elongations of the prokaryotic cells were found in the most superficial oxic layers where lower bacterial biomass was found. This variation could be due to the difference in predation pressure. Protist predation in anoxic waters is lower than in oxygenated ones and the interface microhabitat supports high grazer biomass [83].

5. Conclusions

In the transition and hypoxic zones, higher prokaryote density and biomass were observed. However, the structure and production of the prokaryote community varied significantly with the analyzed depths. Not all microorganisms play an equal role in the layer dynamics, and their abundance and distribution are not uniform across these layers. Further studies are needed to explore oxygen minimum zones (OMZs) in reservoirs with significant depth (Supplementary Table S1).

Supplementary Materials

The following supporting information can be downloaded at: https://www.mdpi.com/article/10.3390/d16080444/s1. Supplementary Table S1: Summary of microbial groups influenced by different oxygen levels [84].

Author Contributions

Conceptualization: A.D., F.R. and D.E.C.; methodology: A.D.; data curation: A.D., F.R. and D.E.C.; formal analysis: A.D.; investigation: A.D., F.R. and D.E.C.; writing—original draft: A.D., A.M.d.S.J., R.d.S.A., F.R. and D.E.C.; writing—review and editing: A.D., A.M.d.S.J., R.d.S.A., F.R. and D.E.C.; visualization: A.D., A.M.d.S.J., R.d.S.A. and D.E.C. All authors have read and agreed to the published version of the manuscript.

Funding

This research was funded and logistically supported by FURNAS Centrais Elétricas S.A.

Institutional Review Board Statement

Not applicable.

Data Availability Statement

The datasets used and/or analyzed during the current study are available from the corresponding authors on reasonable request.

Acknowledgments

We would like to thank Paulo César Abreu (in memoriam) for their collaboration in discussing this article.

Conflicts of Interest

The authors declare no conflicts of interest. The authors declare that this study received funding from FURNAS Centrais Elétricas S.A. The funder was not involved in the study design, collection, analysis, interpretation of data, the writing of this article or the decision to submit it for publication.

References

  1. Carey, C.C.; Hanson, P.C.; Thomas, R.Q.; Gerling, A.B.; Hounshell, A.G.; Lewis, A.S.L.; Lofton, M.E.; McClure, R.P.; Wander, H.L.; Woelmer, W.M.; et al. Anoxia Decreases the Magnitude of the Carbon, Nitrogen, and Phosphorus Sink in Freshwaters. Glob. Chang. Biol. 2022, 28, 4861–4881. [Google Scholar] [CrossRef] [PubMed]
  2. Hounshell, A.G.; McClure, R.P.; Lofton, M.E.; Carey, C.C. Whole-ecosystem Oxygenation Experiments Reveal Substantially Greater Hypolimnetic Methane Concentrations in Reservoirs during Anoxia. Limnol. Oceanogr. Lett. 2021, 6, 33–42. [Google Scholar] [CrossRef]
  3. Yue, Y.; Cai, L.; Tang, Y.; Zhang, Y.; Yang, M.; Wang, F. Vertical Distribution of Bacterial Community in Water Columns of Reservoirs With Different Trophic Conditions During Thermal Stratification. Front. Environ. Sci. 2021, 9, 632089. [Google Scholar] [CrossRef]
  4. Luo, X.; Xiang, X.; Huang, G.; Song, X.; Wang, P.; Fu, K. Bacterial Abundance and Physicochemical Characteristics of Water and Sediment Associated with Hydroelectric Dam on the Lancang River China. Int. J. Environ. Res. Public Health 2019, 16, 2031. [Google Scholar] [CrossRef] [PubMed]
  5. Li, Y.; Kasahara, T.; Chiwa, M.; Fujimoto, N. Effects of Dams and Reservoirs on Organic Matter Decomposition in Forested Mountain Streams in Western Japan. River Res. Apps 2020, 36, 1257–1266. [Google Scholar] [CrossRef]
  6. Kirchman, D.L. The Ecology of Cytophaga–Flavobacteria in Aquatic Environments. FEMS Microbiol. Ecol. 2002, 39, 91–100. [Google Scholar] [CrossRef] [PubMed]
  7. Amaral, V.; Graeber, D.; Calliari, D.; Alonso, C. Strong Linkages between DOM Optical Properties and Main Clades of Aquatic Bacteria. Limnol. Oceanogr. 2016, 61, 906–918. [Google Scholar] [CrossRef]
  8. Palatinszky, M.; Herbold, C.; Jehmlich, N.; Pogoda, M.; Han, P.; Von Bergen, M.; Lagkouvardos, I.; Karst, S.M.; Galushko, A.; Koch, H.; et al. Cyanate as an Energy Source for Nitrifiers. Nature 2015, 524, 105–108. [Google Scholar] [CrossRef] [PubMed]
  9. Lehtovirta-Morley, L.E. Ammonia Oxidation: Ecology, Physiology, Biochemistry and Why They Must All Come Together. FEMS Microbiol. Lett. 2018, 365, fny058. [Google Scholar] [CrossRef]
  10. Lu, S.; Liu, X.; Liu, C.; Cheng, G.; Shen, H. Influence of Photoinhibition on Nitrification by Ammonia-Oxidizing Microorganisms in Aquatic Ecosystems. Rev. Environ. Sci. Biotechnol. 2020, 19, 531–542. [Google Scholar] [CrossRef]
  11. Freixa, A.; Rubol, S.; Carles-Brangarí, A.; Fernàndez-Garcia, D.; Butturini, A.; Sanchez-Vila, X.; Romaní, A.M. The Effects of Sediment Depth and Oxygen Concentration on the Use of Organic Matter: An Experimental Study Using an Infiltration Sediment Tank. Sci. Total Environ. 2016, 540, 20–31. [Google Scholar] [CrossRef] [PubMed]
  12. Toneatti, D.M.; Albarracín, V.H.; Flores, M.R.; Polerecky, L.; Farías, M.E. Stratified Bacterial Diversity along Physico-Chemical Gradients in High-Altitude Modern Stromatolites. Front. Microbiol. 2017, 8, 646. [Google Scholar] [CrossRef] [PubMed]
  13. Baricz, A.; Chiriac, C.M.; Andrei, A.; Bulzu, P.; Levei, E.A.; Cadar, O.; Battes, K.P.; Cîmpean, M.; Șenilă, M.; Cristea, A.; et al. Spatio-temporal Insights into Microbiology of the Freshwater-to-hypersaline, Oxic-hypoxic-euxinic Waters of Ursu Lake. Environ. Microbiol. 2021, 23, 3523–3540. [Google Scholar] [CrossRef]
  14. Lau, M.P.; Hupfer, M.; Grossart, H. Reduction-oxidation Cycles of Organic Matter Increase Bacterial Activity in the Pelagic Oxycline. Environ. Microbiol. Rep. 2017, 9, 257–267. [Google Scholar] [CrossRef]
  15. Suominen, S.; Dombrowski, N.; Sinninghe Damsté, J.S.; Villanueva, L. A Diverse Uncultivated Microbial Community Is Responsible for Organic Matter Degradation in the Black Sea Sulphidic Zone. Environ. Microbiol. 2021, 23, 2709–2728. [Google Scholar] [CrossRef] [PubMed]
  16. Wright, J.J.; Konwar, K.M.; Hallam, S.J. Microbial Ecology of Expanding Oxygen Minimum Zones. Nat. Rev. Microbiol. 2012, 10, 381–394. [Google Scholar] [CrossRef]
  17. Pajares, S.; Soto-Jiménez, M.F.; Merino-Ibarra, M. Molecular and Isotopic Evidence of the Distribution of Nitrogen-Cycling Microbial Communities in the Oxygen Minimum Zone of the Tropical Mexican Pacific. FEMS Microbiol. Ecol. 2019, 95, fiz143. [Google Scholar] [CrossRef] [PubMed]
  18. Cai, M.; Ng, S.-K.; Lim, C.K.; Lu, H.; Jia, Y.; Lee, P.K.H. Physiological and Metagenomic Characterizations of the Synergistic Relationships between Ammonia- and Nitrite-Oxidizing Bacteria in Freshwater Nitrification. Front. Microbiol. 2018, 9, 280. [Google Scholar] [CrossRef] [PubMed]
  19. Röske, K.; Sachse, R.; Scheerer, C.; Röske, I. Microbial Diversity and Composition of the Sediment in the Drinking Water Reservoir Saidenbach (Saxonia, Germany). Syst. Appl. Microbiol. 2012, 35, 35–44. [Google Scholar] [CrossRef]
  20. Soares, L.A.; Santos, A.C.A.D.; Duarte, I.C.S.; Romagnoli, E.M.; Calijuri, M.D.C. Distribution of Archaeal and Bacterial Communities in a Subtropical Reservoir. Acta Limnol. Bras. 2015, 27, 411–420. [Google Scholar] [CrossRef]
  21. Pierangeli, G.M.F.; Domingues, M.R.; Choueri, R.B.; Hanisch, W.S.; Gregoracci, G.B.; Benassi, R.F. Spatial Variation and Environmental Parameters Affecting the Abundant and Rare Communities of Bacteria and Archaea in the Sediments of Tropical Urban Reservoirs. Microb. Ecol. 2023, 86, 297–310. [Google Scholar] [CrossRef] [PubMed]
  22. Park, J.-G.; Lee, B.; Heo, T.-Y.; Cheon, A.-I.; Jun, H.-B. Metagenomics Approach and Canonical Correspondence Analysis of Novel Nitrifiers and Ammonia-Oxidizing Archaea in Full Scale Anaerobic-Anoxic-Oxic (A2/O) and Oxidation Ditch Processes. Bioresour. Technol. 2021, 319, 124205. [Google Scholar] [CrossRef] [PubMed]
  23. Van Kessel, M.A.H.J.; Speth, D.R.; Albertsen, M.; Nielsen, P.H.; Op Den Camp, H.J.M.; Kartal, B.; Jetten, M.S.M.; Lücker, S. Complete Nitrification by a Single Microorganism. Nature 2015, 528, 555–559. [Google Scholar] [CrossRef] [PubMed]
  24. Santoro, A.E. The Do-It-All Nitrifier. Science 2016, 351, 342–343. [Google Scholar] [CrossRef] [PubMed]
  25. Ai, Y.; Huang, T.; Duan, C.; Huang, D.; Gong, Y.; Cheng, H. Knowledge Domain of Greenhouse Gas Emissions from Hydropower Reservoirs: Hotspots, Frontiers and Future Perspectives. Front. Environ. Sci. 2022, 10, 1055891. [Google Scholar] [CrossRef]
  26. Roland, F.; Cimbleris, A.C.P.; Lobão, L.M.; Vidal, L.O. Bacterioplankton Metabolism in Hydroelectric Reservoirs. Oecologia Aust. 2011, 15, 605–617. [Google Scholar] [CrossRef]
  27. Cardoso, S.J.; Vidal, L.O.; Mendonça, R.F.; Tranvik, L.J.; Sobek, S.; Fábio, R. Spatial Variation of Sediment Mineralization Supports Differential CO2 Emissions from a Tropical Hydroelectric Reservoir. Front. Microbiol. 2013, 4, 101. [Google Scholar] [CrossRef] [PubMed]
  28. De Filippo, R.; Gomes, E.L.; Lenz-César, J.; Soares, C.B.P.; Menezes, C.F.S. As Alterações Na Qualidade Da Água Durante o Enchimento Do Reservatório de UHE Serra Da Mesa—GO. In Ecologia de Reservatórios: Estrutura, Função e Aspectos Sociais; Henry, R., Ed.; Fapesp–Fundibio: Botucatu, Brazil, 1999; pp. 323–345. [Google Scholar]
  29. De Souza Dias, V.; Pereira Da Luz, M.; Medero, G.; Tarley Ferreira Nascimento, D. An Overview of Hydropower Reservoirs in Brazil: Current Situation, Future Perspectives and Impacts of Climate Change. Water 2018, 10, 592. [Google Scholar] [CrossRef]
  30. Ometto, J.P.H.B.; Pacheco, F.S.; Cimbleris, A.C.P.; Stech, J.L.; Lorenzzetti, J.; Assireu, A.T.; Santos, M.A.; Matvienko, B.; Rosa, L.P.; Sadigisgalli, C.; et al. Carbon Dynamic and Emissions in Brazilian Hydropower Reservoirs. In Energy Resources: Development, Distribution and Exploitation; Alcantara, E., Ed.; Nova Science Publishers: Hauppauge, NY, USA, 2011; pp. 155–188. [Google Scholar]
  31. Barros, N.; Cole, J.J.; Tranvik, L.J.; Prairie, Y.T.; Bastviken, D.; Huszar, V.L.M.; Del Giorgio, P.; Roland, F. Carbon Emission from Hydroelectric Reservoirs Linked to Reservoir Age and Latitude. Nat. Geosci. 2011, 4, 593–596. [Google Scholar] [CrossRef]
  32. Roland, F.; Caraco, N.F.; Cole, J.J.; Del Giorgio, P. Rapid and Precise Determination of Dissolved Oxygen by Spectrophotometry: Evaluation of Interference from Color and Turbidity. Limnol. Oceanogr. 1999, 44, 1148–1154. [Google Scholar] [CrossRef]
  33. Wetzel, R.G.; Likens, G.E. Limnological Analyses; Springer: New York, NY, USA, 2000; ISBN 978-1-4419-3186-3. [Google Scholar]
  34. Kirchman, D. Measuring Bacterial Biomass Production and Growth Rates from Leucine Incorporation in Natural Aquatic Environments. In Methods in Microbiology; Elsevier Inc.: Amsterdam, The Netherlands, 2001; Volume 30, pp. 227–237. ISBN 978-0-12-521530-5. [Google Scholar]
  35. Cottrell, M.T.; Kirchman, D.L. Community Composition of Marine Bacterioplankton Determined by 16S rRNA Gene Clone Libraries and Fluorescence In Situ Hybridization. Appl. Environ. Microbiol. 2000, 66, 5116–5122. [Google Scholar] [CrossRef] [PubMed]
  36. Massana, R.; Gasol, J.M.; Bjørnsen, P.K.; Blackburn, N.; Hagström, Å.; Hietanen, S.; Hygum, B.H.; Kuparinen, J.; Pedrós-Alió, C. Measurement of Bacterial Size via Analysis of Epifluorescence Preparations: Description of an Inexpensive System and Solutions to Some of the Most Common Problems. Sci. Mar. 1997, 61, 397–407. [Google Scholar]
  37. Norland, S. The Relationship between Biomass and Volume of Bacteria. In Handbook of Methods in Aquatic Microbial Ecology; Kemp, P., Sherr, B., Sherr, E., Cole, J., Eds.; CRC Press: Boca Raton, FL, USA, 1993; pp. 303–307, 525. [Google Scholar]
  38. O’Boyle, S.; Nolan, G. The Influence of Water Column Stratification on Dissolved Oxygen Levels in Coastal and Shelf Waters Around Ireland. Biol. Environ. Proc. R. Ir. Acad. 2011, 110, 195–209. [Google Scholar] [CrossRef]
  39. Gautreau, E.; Volatier, L.; Nogaro, G.; Gouze, E.; Mermillod-Blondin, F. The Influence of Bioturbation and Water Column Oxygenation on Nutrient Recycling in Reservoir Sediments. Hydrobiologia 2020, 847, 1027–1040. [Google Scholar] [CrossRef]
  40. Bush, T.; Diao, M.; Allen, R.J.; Sinnige, R.; Muyzer, G.; Huisman, J. Oxic-Anoxic Regime Shifts Mediated by Feedbacks between Biogeochemical Processes and Microbial Community Dynamics. Nat. Commun. 2017, 8, 789. [Google Scholar] [CrossRef] [PubMed]
  41. Spietz, R.L.; Williams, C.M.; Rocap, G.; Horner-Devine, M.C. A Dissolved Oxygen Threshold for Shifts in Bacterial Community Structure in a Seasonally Hypoxic Estuary. PLoS ONE 2015, 10, e0135731. [Google Scholar] [CrossRef] [PubMed]
  42. Yu, S.; He, R.; Song, A.; Huang, Y.; Jin, Z.; Liang, Y.; Li, Q.; Wang, X.; Müller, W.E.G.; Cao, J. Spatial and Temporal Dynamics of Bacterioplankton Community Composition in a Subtropical Dammed Karst River of Southwestern China. MicrobiologyOpen 2019, 8, e00849. [Google Scholar] [CrossRef] [PubMed]
  43. Pajares, S.; Varona-Cordero, F.; Hernández-Becerril, D.U. Spatial Distribution Patterns of Bacterioplankton in the Oxygen Minimum Zone of the Tropical Mexican Pacific. Microb. Ecol. 2020, 80, 519–536. [Google Scholar] [CrossRef] [PubMed]
  44. Garcia-Robledo, E.; Padilla, C.C.; Aldunate, M.; Stewart, F.J.; Ulloa, O.; Paulmier, A.; Gregori, G.; Revsbech, N.P. Cryptic Oxygen Cycling in Anoxic Marine Zones. Proc. Natl. Acad. Sci. USA 2017, 114, 8319–8324. [Google Scholar] [CrossRef]
  45. Okazaki, Y.; Nakano, S. Vertical Partitioning of Freshwater Bacterioplankton Community in a Deep Mesotrophic Lake with a Fully Oxygenated Hypolimnion (Lake Biwa, Japan). Environ. Microbiol. Rep. 2016, 8, 780–788. [Google Scholar] [CrossRef]
  46. Zhao, Y.; Liu, S.; Shi, H. Impacts of Dams and Reservoirs on Local Climate Change: A Global Perspective. Environ. Res. Lett. 2021, 16, 104043. [Google Scholar] [CrossRef]
  47. Yan, Q.; Bi, Y.; Deng, Y.; He, Z.; Wu, L.; Van Nostrand, J.D.; Shi, Z.; Li, J.; Wang, X.; Hu, Z.; et al. Impacts of the Three Gorges Dam on Microbial Structure and Potential Function. Sci. Rep. 2015, 5, 8605. [Google Scholar] [CrossRef] [PubMed]
  48. Gao, Y.; Zhang, W.; Li, Y.; Wu, H.; Yang, N.; Hui, C. Dams Shift Microbial Community Assembly and Imprint Nitrogen Transformation along the Yangtze River. Water Res. 2021, 189, 116579. [Google Scholar] [CrossRef] [PubMed]
  49. Smith, J.M.; Chavez, F.P.; Francis, C.A. Ammonium Uptake by Phytoplankton Regulates Nitrification in the Sunlit Ocean. PLoS ONE 2014, 9, e108173. [Google Scholar] [CrossRef] [PubMed]
  50. Wan, X.S.; Sheng, H.-X.; Dai, M.; Zhang, Y.; Shi, D.; Trull, T.W.; Zhu, Y.; Lomas, M.W.; Kao, S.-J. Ambient Nitrate Switches the Ammonium Consumption Pathway in the Euphotic Ocean. Nat. Commun. 2018, 9, 915. [Google Scholar] [CrossRef] [PubMed]
  51. Yang, N.; Zhang, C.; Wang, L.; Li, Y.; Zhang, W.; Niu, L.; Zhang, H.; Wang, L. Nitrogen Cycling Processes and the Role of Multi-Trophic Microbiota in Dam-Induced River-Reservoir Systems. Water Res. 2021, 206, 117730. [Google Scholar] [CrossRef] [PubMed]
  52. Bryant, J.A.; Stewart, F.J.; Eppley, J.M.; DeLong, E.F. Microbial Community Phylogenetic and Trait Diversity Declines with Depth in a Marine Oxygen Minimum Zone. Ecology 2012, 93, 1659–1673. [Google Scholar] [CrossRef] [PubMed]
  53. Giering, S.L.C.; Evans, C. Overestimation of Prokaryotic Production by Leucine Incorporation—And How to Avoid It. Limnol. Oceanogr. 2022, 67, 726–738. [Google Scholar] [CrossRef]
  54. Landry, M.R.; Rivera, S.R.; Stukel, M.R.; Selph, K.E. Comparison of Bacterial Carbon Production Estimates from Dilution and 3H-leucine Methods across a Strong Gradient in Ocean Productivity. Limnol. Ocean. Methods 2023, 21, 295–306. [Google Scholar] [CrossRef]
  55. Lau, M.P.; Del Giorgio, P. Reactivity, Fate and Functional Roles of Dissolved Organic Matter in Anoxic Inland Waters. Biol. Lett. 2020, 16, 20190694. [Google Scholar] [CrossRef]
  56. Amado, A.M.; Meirelles-Pereira, F.; Vidal, L.O.; Sarmento, H.; Suhett, A.L.; Farjalla, V.F.; Cotner, J.B.; Roland, F. Tropical Freshwater Ecosystems Have Lower Bacterial Growth Efficiency than Temperate Ones. Front. Microbiol. 2013, 4, 167. [Google Scholar] [CrossRef] [PubMed]
  57. Bertagnolli, A.D.; Stewart, F.J. Microbial Niches in Marine Oxygen Minimum Zones. Nat. Rev. Microbiol. 2018, 16, 723–729. [Google Scholar] [CrossRef] [PubMed]
  58. Yang, X.; Yu, X.; He, Q.; Deng, T.; Guan, X.; Lian, Y.; Xu, K.; Shu, L.; Wang, C.; Yan, Q.; et al. Niche Differentiation among Comammox (Nitrospira Inopinata) and Other Metabolically Distinct Nitrifiers. Front. Microbiol. 2022, 13, 956860. [Google Scholar] [CrossRef] [PubMed]
  59. Yang, N.; Li, Y.; Lin, L.; Zhang, W.; Wang, L.; Niu, L.; Zhang, H. Dam-Induced Flow Velocity Decrease Leads to the Transition from Heterotrophic to Autotrophic System through Modifying Microbial Food Web Dynamics. Environ. Res. 2022, 212, 113568. [Google Scholar] [CrossRef] [PubMed]
  60. Shi, J.; Zhang, B.; Liu, J.; Fang, Y.; Wang, A. Spatiotemporal Dynamics in Microbial Communities Mediating Biogeochemical Cycling of Nutrients across the Xiaowan Reservoir in Lancang River. Sci. Total Environ. 2022, 813, 151862. [Google Scholar] [CrossRef]
  61. Nie, W.-B.; Xie, G.-J.; Tan, X.; Ding, J.; Lu, Y.; Chen, Y.; Yang, C.; He, Q.; Liu, B.-F.; Xing, D.; et al. Microbial Niche Differentiation during Nitrite-Dependent Anaerobic Methane Oxidation. Environ. Sci. Technol. 2023, 57, 7029–7040. [Google Scholar] [CrossRef] [PubMed]
  62. Samad, M.S.; Lee, H.J.; Cerbin, S.; Meima-Franke, M.; Bodelier, P.L.E. Niche Differentiation of Host-Associated Pelagic Microbes and Their Potential Contribution to Biogeochemical Cycling in Artificially Warmed Lakes. Front. Microbiol. 2020, 11, 582. [Google Scholar] [CrossRef] [PubMed]
  63. Li, Z.; Lu, L.; Guo, J.; Yang, J.; Zhang, J.; He, B.; Xu, L. Responses of Spatial-Temporal Dynamics of Bacterioplankton Community to Large-Scale Reservoir Operation: A Case Study in the Three Gorges Reservoir, China. Sci. Rep. 2017, 7, 42469. [Google Scholar] [CrossRef] [PubMed]
  64. Sakami, T. Seasonal and Spatial Variation of Bacterial Community Structure in River-Mouth Areas of Gokasho Bay, Japan. Microb. Environ. 2008, 23, 277–284. [Google Scholar] [CrossRef]
  65. Langenheder, S.; Sobek, S.; Tranvik, L.J. Changes in Bacterial Community Composition along a Solar Radiation Gradient in Humic Waters. Aquat. Sci. 2006, 68, 415–424. [Google Scholar] [CrossRef]
  66. Wang, Y.; Lu, L.; Hong, Y.; Wu, J.; Zhu, G.; Ye, F.; Li, Z. Divergent Responses of Taxonomic and Predicted Functional Profiles of Bacterioplankton to Reservoir Impoundment. Environ. Res. 2020, 182, 109083. [Google Scholar] [CrossRef] [PubMed]
  67. Ruiz-González, C.; Proia, L.; Ferrera, I.; Gasol, J.M.; Sabater, S. Effects of Large River Dam Regulation on Bacterioplankton Community Structure. FEMS Microbiol. Ecol. 2013, 84, 316–331. [Google Scholar] [CrossRef] [PubMed]
  68. Carlson, C.A.; Hansell, D.A. DOM Sources, Sinks, Reactivity, and Budgets. In Biogeochemistry of Marine Dissolved Organic Matter; Elsevier Inc.: Amsterdam, The Netherlands, 2015; pp. 65–126. ISBN 978-0-12-405940-5. [Google Scholar]
  69. Guerrero-Feijóo, E.; Nieto-Cid, M.; Sintes, E.; Dobal-Amador, V.; Hernando-Morales, V.; Álvarez, M.; Balagué, V.; Varela, M.M. Optical Properties of Dissolved Organic Matter Relate to Different Depth-Specific Patterns of Archaeal and Bacterial Community Structure in the North Atlantic Ocean. FEMS Microbiol. Ecol. 2017, 93, fiw224. [Google Scholar] [CrossRef] [PubMed]
  70. Goto, S.; Tada, Y.; Suzuki, K.; Yamashita, Y. Evaluation of the Production of Dissolved Organic Matter by Three Marine Bacterial Strains. Front. Microbiol. 2020, 11, 584419. [Google Scholar] [CrossRef] [PubMed]
  71. Baetge, N.; Bolaños, L.M.; Penna, A.D.; Gaube, P.; Liu, S.; Opalk, K.; Graff, J.R.; Giovannoni, S.J.; Behrenfeld, M.J.; Carlson, C.A. Bacterioplankton Response to Physical Stratification Following Deep Convection. Elem. Sci. Anthr. 2022, 10, 00078. [Google Scholar] [CrossRef]
  72. Chen, Y.; Liu, Y.; Wang, X. Spatiotemporal Variation of Bacterial and Archaeal Communities in Sediments of a Drinking Reservoir, Beijing, China. Appl. Microbiol. Biotechnol. 2017, 101, 3379–3391. [Google Scholar] [CrossRef] [PubMed]
  73. Medina-Silva, R.; De Oliveira, R.R.; Pivel, M.A.G.; Borges, L.G.A.; Simão, T.L.L.; Pereira, L.M.; Trindade, F.J.; Augustin, A.H.; Valdez, F.P.; Eizirik, E.; et al. Microbial Diversity from Chlorophyll Maximum, Oxygen Minimum and Bottom Zones in the Southwestern Atlantic Ocean. J. Mar. Syst. 2018, 178, 52–61. [Google Scholar] [CrossRef]
  74. Vergara, C.; Muñoz, R.; Campos, J.L.; Seeger, M.; Jeison, D. Influence of Light Intensity on Bacterial Nitrifying Activity in Algal-Bacterial Photobioreactors and Its Implications for Microalgae-Based Wastewater Treatment. Int. Biodeterior. Biodegrad. 2016, 114, 116–121. [Google Scholar] [CrossRef]
  75. Lehours, A.-C.; Bardot, C.; Thenot, A.; Debroas, D.; Fonty, G. Anaerobic Microbial Communities in Lake Pavin, a Unique Meromictic Lake in France. Appl. Environ. Microbiol. 2005, 71, 7389–7400. [Google Scholar] [CrossRef]
  76. Lin, X.; Wakeham, S.G.; Putnam, I.F.; Astor, Y.M.; Scranton, M.I.; Chistoserdov, A.Y.; Taylor, G.T. Comparison of Vertical Distributions of Prokaryotic Assemblages in the Anoxic Cariaco Basin and Black Sea by Use of Fluorescence In Situ Hybridization. Appl. Environ. Microbiol. 2006, 72, 2679–2690. [Google Scholar] [CrossRef]
  77. Parsons, R.J.; Nelson, C.E.; Carlson, C.A.; Denman, C.C.; Andersson, A.J.; Kledzik, A.L.; Vergin, K.L.; McNally, S.P.; Treusch, A.H.; Giovannoni, S.J. Marine Bacterioplankton Community Turnover within Seasonally Hypoxic Waters of a Subtropical Sound: D Evil’s H Ole, B Ermuda. Environ. Microbiol. 2015, 17, 3481–3499. [Google Scholar] [CrossRef] [PubMed]
  78. Lentini, V.; Gugliandolo, C.; Maugeri, T.L. Vertical Distribution of Archaea and Bacteria in a Meromictic Lake as Determined by Fluorescent In Situ Hybridization. Curr. Microbiol. 2012, 64, 66–74. [Google Scholar] [CrossRef]
  79. Humayoun, S.B.; Bano, N.; Hollibaugh, J.T. Depth Distribution of Microbial Diversity in Mono Lake, a Meromictic Soda Lake in California. Appl. Environ. Microbiol. 2003, 69, 1030–1042. [Google Scholar] [CrossRef] [PubMed]
  80. Aldunate, M.; De La Iglesia, R.; Bertagnolli, A.D.; Ulloa, O. Oxygen Modulates Bacterial Community Composition in the Coastal Upwelling Waters off Central Chile. Deep. Sea Res. Part II Top. Stud. Oceanogr. 2018, 156, 68–79. [Google Scholar] [CrossRef]
  81. La Ferla, R.; Maimone, G.; Caruso, G.; Azzaro, F.; Azzaro, M.; Decembrini, F.; Cosenza, A.; Leonardi, M.; Paranhos, R. Are Prokaryotic Cell Shape and Size Suitable to Ecosystem Characterization? Hydrobiologia 2014, 726, 65–80. [Google Scholar] [CrossRef]
  82. Pernthaler, J. Freshwater Microbial Communities. In The Prokaryotes; Rosenberg, E., DeLong, E.F., Lory, S., Stackebrandt, E., Thompson, F., Eds.; Springer: Berlin/Heidelberg, Germany, 2013; pp. 97–112. ISBN 978-3-642-30122-3. [Google Scholar]
  83. Oikonomou, A.; Pachiadaki, M.; Stoeck, T. Protistan Grazing in a Meromictic Freshwater Lake with Anoxic Bottom Water. FEMS Microbiol. Ecol. 2014, 87, 691–703. [Google Scholar] [CrossRef]
  84. Nürnberg, G.K. Quantification of Anoxia and Hypoxia in Water Bodies. In Encyclopedia of Water; Maurice, P., Ed.; Wiley: Hoboken, NJ, USA, 2019; pp. 1–9. ISBN 978-1-119-30075-5. [Google Scholar]
Figure 1. Temperature (°C) and water dissolved oxygen (mg L−1) and dissolved organic carbon concentrations (COD—mg L−1) throughout a vertical profile in a point near to the Serra da Mesa reservoir dam.
Diversity 16 00444 g001
Figure 2. Dissolved oxygen (mg L−1), ammonium (μg L−1), and nitrate (μg L−1) concentrations throughout a vertical profile in a point near to the Serra da Mesa reservoir dam.
Diversity 16 00444 g002
Figure 3. Prokaryotic density (cells 106 mL−1), biomass (μg C L−1), and water dissolved oxygen concentration (mg L−1) throughout a vertical profile in a point near to the Serra da Mesa reservoir dam.
Diversity 16 00444 g003
Figure 4. Prokaryotic cells elongation and volume (logarithm scale) at subsurface (A), 6 m (B), 12 m (C), 47 m (D), and 107 m (E) throughout a vertical profile in a point near to the Serra da Mesa reservoir dam.
Diversity 16 00444 g004
Figure 5. Prokaryotic production (μg C L−1 h−1) and water dissolved oxygen concentration (mg L−1) throughout a vertical profile in a point near to the Serra da Mesa reservoir dam.
Diversity 16 00444 g005
Table 1. Specific probes for bacterial community composition analysis by FISH.
ProbesSpecificitySequence (5′-3′)
ARCH915ArchaeaGTG CTC CCC CGC CAA TTC CT
Alf968AlphaproteobacteriaGGT AAG GTT CTG CGC GTT
Bet42aBetaproteobacteriaGCC TTC CCA CAT CGT TT
Gam42aGammaproteobacteriaGCC TTC CCA CAT CGT TT
CF319aCytophaga–FlavobacterTGG TCC GTG TCT CAG TAC
Table 2. Total prokaryotes abundance (cells 106 mL−1), Archaea, alphaproteobacteria, betaproteobacteria, gammaproteobacterial, and Cytophaga–Flavobacter relative abundance (% of total bacterial density) throughout a vertical profile in a point near to Serra da Mesa reservoir dam.
Depth (m)Prokaryotes Abundance
(cells 106 mL−1)
ArchaeaAlphaBetaGammaCytophaga–FlavobacterOther Groups
Proteobacteria
(% of Total Bacterial Abundance)
00.99 ± 2.510 ± 2.210 ± 6.5<0.110 ± 3.461
60.67 ± 0.49 ± 5.64 ± 0.49 ± 9.73 ± 2.068
121.21 ± 0.510 ± 1.82 ± 2.48 ± 5.012 ± 2.067
470.86 ± 4.34 ± 1.06 ± 1.73 ± 1.75 ± 0.676
1071.133 ± 9.016 ± 1.39 ± 1.011 ± 7.814 ± 4.117
Table 3. Total prokaryotes biomass (μg C mL−1), Archaea, alphaproteobacteria, betaproteobacteria, gammaproteobacteria, and Cytophaga–Flavobacter relative biomass (% of total bacterial biomass) throughout a vertical profile in a point near to Serra da Mesa reservoir dam.
Depth (m)Prokaryotes Biomass
(μg C mL−1)
ArchaeaAlphaBetaGammaCytophaga–FlavobacterOther Groups
Proteobacteria
(% of Total Bacterial Biomass)
016211520<0.12024
6272.29.29.24.92.772
12552.29.31.55.51171
47413.47.56.01.54.877
1074124239.1131318
Disclaimer/Publisher’s Note: The statements, opinions and data contained in all publications are solely those of the individual author(s) and contributor(s) and not of MDPI and/or the editor(s). MDPI and/or the editor(s) disclaim responsibility for any injury to people or property resulting from any ideas, methods, instructions or products referred to in the content.

