Article

Annotation and Characterization of the Zacco platypus Genome

1
Department of Marine Science, College of Natural Sciences, Incheon National University, Incheon 22012, Republic of Korea
2
Institute of Korea Eco-Network, Daejeon 34028, Republic of Korea
3
Research Institute of Basic Sciences, Incheon National University, Incheon 22012, Republic of Korea
4
Yellow Sea Research Institute, Incheon 22012, Republic of Korea
*
Author to whom correspondence should be addressed.
Diversity 2024, 16(9), 529; https://doi.org/10.3390/d16090529
Submission received: 2 June 2024 / Revised: 20 August 2024 / Accepted: 22 August 2024 / Published: 1 September 2024
(This article belongs to the Special Issue Genome Sequence and Analysis for Animal Ecology and Evolution)

Abstract

:
The pale chub Zacco platypus (Cypriniformes; Xenocyprididae; Jordan & Evermann, 1902) is widely distributed across freshwater ecosystems in East Asia and has been recognized as a potential model fish species for ecotoxicology and environmental monitoring. Here, a high-quality de novo genome assembly of Z. platypus was constructed through the integration of a combination of long-read Pacific Bioscience (PacBio) sequencing, short-read Illumina sequencing, and Hi-C sequencing technologies. Z. platypus has the smallest genome size compared to other species belonging to the order Cypriniformes. The assembled genome encompasses 41.45% repeat sequences. As shown in other fish, a positive correlation was observed between genome size and the composition of transposable elements (TE) in the genome. Among TEs, a relatively higher rate of DNA transposon was observed, which is a common pattern in the members of the order Cypriniformes. Functional annotation was processed using four representative databases, identifying a core set of 12,907 genes shared among them. Orthologous gene family analysis revealed that Z. platypus has experienced more gene family contraction rather than expansion compared to other Cypriniformes species. Among the uniquely expanded gene families in Z. platypus, detoxification and stress-related gene families were identified, suggesting that this species could represent a promising model for ecotoxicology and environmental monitoring. Taken together, the Z. platypus genome assembly will provide valuable data for omics-based health assessments in aquatic ecosystems, offering further insights into the environmental and ecological facets within this species.

1. Introduction

As fish are diverse worldwide, they can be used to evaluate pollutant effects in local regions and to understand the mechanisms of action underlying unknown toxicity in the field [1,2]. In current ecotoxicological research, especially in freshwater environments, model fish such as zebrafish and Japanese medaka have been extensively utilized [3,4,5]. However, local and sentinel fish species have been used sparingly. The model organisms are not indigenous species, and laboratory experiments rarely reflect natural or real-world settings. Consequently, it is difficult to directly apply the results obtained from model animals to the health and risk assessment of domestic aquatic ecosystems. Freshwater environments globally are threatened by numerous anthropogenic, abiotic, and biotic challenges, including direct or indirect disposals and runoff from land [6,7]. Monitoring and risk assessments of aquatic ecosystems’ health using sentinel fish are crucial to understanding the actual safe and habitable status of these environments [8]. Model fish cannot fully represent the actual environmental status, and chemical characterization of pollutants in water bodies can provide only partial information about ecosystem responses.
The pale chub, Zacco platypus, is one of the indicator species used for assessing water quality [9]. This fish can be easily raised in artificial culture conditions in the laboratory, as it requires environmental conditions similar to those of model fish [3,10]. In addition, the pale chub possesses several crucial characteristics for ecotoxicological studies, such as small size, physiological and phenotypical sensitivity to xenobiotics, the ability to breed and undergo in vitro fertilization under laboratory conditions, and applicability in field-based research [11,12]. These traits make it a sentinel species for freshwater environments. Recently, ecotoxicologists in the freshwater field have shown a growing interest in applying next-generation sequencing (NGS) and third-generation sequencing (TGS) to develop model fish species for omics-based research, which can lead to a better understanding of underlying molecular mechanisms [13]. However, the application of omics platforms is still limited in Z. platypus. One of the most important steps in conducting omics-based ecotoxicological studies is finding an appropriate model organism that can be used to elucidate the underlying molecular mechanisms affected by xenobiotics [14]. This requires comprehensive genomic information. Therefore, in this study, we constructed a genome database of Z. platypus for the health assessment of local aquatic ecosystems, highlighting its potential as a promising sentinel species. In addition, information on the karyotype and genome sequencing of Z. platypus has recently published, reporting a genome size of 815 Mb with 24 pseudochromosomes [15]. Therefore, in this study, we aimed to compare our results with the previous findings and conducted additional analyses for the annotation and characterization of the Z. platypus genome.

2. Materials and Methods

2.1. Sample Collection and DNA Extraction

Zacco platypus individuals were collected from Songpa-gu, Seoul, South Korea (37°31′28.0″ N 127°5′26.0″ E). Muscle tissues were homogenized from a specimen for the extraction of high molecular weight DNA using a conventional cetrimonium bromide (CTAB)-based method [16]. The quality of the DNA was assessed using gel electrophoresis. Species identification was carried out using a primer set (mlcolintF and HCO2198) specifically targeted to amplify the mitochondrial cytochrome c oxidase I (COI) gene region [17,18].

2.2. Genome Sequencing

A de novo genome assembly of Z. platypus was constructed by employing a combination of long–read Pacific Biosciences (PacBio) platform, short–read Illumina platform, and Hi-C sequencing technologies at Phyzen (Gyeonggi, South Korea). Detailed methodologies for the genome sequencing platforms were described in our previous report [19]. Briefly, the genomic DNA library was prepared with the Illumina TruSeq Nano DNA Library preparation kit (Illumina Inc., San Diego, CA, USA) and the PacBio SMRTbell® prep kit 3.0 (Pacific Biosciences, Menlo Park, CA, USA). High-throughput sequencing was performed using an Illumina NovaSeq 6000 platform for genome size estimation and Hi-C scaffolding following the provided protocols for 2 × 150 paired-end sequencing. Reads were trimmed using Trimmomatic v0.3.9 [20] and BBDuk v38.87 from https://jgi.doe.gov/data-and-tools/bbtools (accessed on 16 March 2022) [21]. Genome size was estimated using GenomeScope2.0 [22]. For each single-molecule real-time sequencing (SMRT) bell (SMRT Bell) library cell, 1 × 600 min movies were captured using the Sequel sequencing platform (Pacific Biosciences). For de novo assembly, the Hifiasm assembler (v0.16.1-r375) was used with default parameters [23]. Statistics of raw data are shown in Table S1. Hi-C read pairs were aligned to the draft genome assembly using BWA [24]. Subsequently, mapping of Hi-C data was produced using LACHESIS [25] and Juicebox v2.20.00 to finalize the genome assembly [26]. The final genome structure was visualized with Circos plots [27]. Synteny analysis between our genome assemblies and a recently published one [15] was performed at the chromosome level using minimap2 [28] and visualized as dot plots using the pafr R package [29]. The assembled scaffolds were subjected to BUSCO ver. 5.0 with default parameters [30], using the conservation of a core set of genes from the fish database (actinopterygii_odb10).

2.3. Genomic Repeat Analysis and RNA Profiling

A de novo repeat family was identified using RepeatModeler v1.0.340, which operated with default parameters [31]. The assembled repeat library was then utilized to mask repetitive elements via RepeatMasker v4.1.2 from http://www.repeatmasker.org (accessed on 16 October 2023) [32].
For non-coding RNA annotation, the genome was scanned against the Rfam database using cmscan from the Infernal package version 1.1.5 [33].

2.4. Gene Prediction and Annotation

Total RNA was also extracted from the same tissues using RNeasy Mini Kit (QIAGEN Inc., Hilden, Germany). Detailed methodologies were described in our previous report [19]. Briefly, transcriptome data were obtained with Illumina paired–end sequencing (RNA-Seq; Illumina NovaSeq 6000 platform) and PacBio Sequel II (Iso-Seq; Pacific Biosciences). The complementary DNA (cDNA) library was prepared using TruSeq Stranded mRNA Library preparation kit (Illumina) according to the manufacturer’s instructions. To obtain clean data, raw reads were filtered out by trimming low-quality reads and reads containing adapters. After decontamination with BBDuk, de novo transcriptome assembly was performed using Trinity v2.12.0 with default option [34]. For Iso-Seq library construction, the SMRTbell library was then prepared as per the manufacturer’s protocol. The pooled samples were sequenced using one SMRT cell v3 based on P6-C4 chemistry after standard full-length cDNA (1–3 kb) library preparation, and a total of two SMRT cells were sequenced on a PacBio Sequel system (Pacific Biosciences). Demultiplexing, filtering, quality control, clustering, and polishing of the Iso-Seq sequencing data were performed using SMRT Link (ver. 6.0.0). Gene prediction was performed using MAKER ver. 3.01.03 with default options [35]. Subsequently, filtered evidence genes (AED ≤ 0.25) were used for ab initio gene prediction with GeneMark-ES v4.38 [36], SNAP v2006–07–28 [37], and Augustus v3.3.2 [38]. The first gene prediction result and the ab initio training data set were integrated to predict the gene model, and the EvidenceModeler (EVM) was used to weight by each data. Datasets for gene prediction were prepared de novo transcriptome assemblies from RNA-Seq using Trinity and Iso-Seq data by clustering with 95% identities. The polished isoforms were subjected to secondary sequence clustering using CD-HIT-EST software v4.8.1 [39].

2.5. Functional Gene Annotation

The predicted genes were annotated by aligning them to the NCBI non-redundant protein (nr) databases using BLAST (DIAMOND v2.1.8) with a maximum E-value cut-off of 1 × 10⁻⁵ [40]. To obtain protein domain information, InterProScan 5.34–73.0 [41] was employed for a protein sequence translated from a transcript. Gene Ontology (GO) terms [42] were assigned to the genes using the BLAST2GO ver. 5.2.5 pipeline [43]. Kyoto Encyclopedia of Genes and Genomes (KEGG) pathway annotation was accomplished using the KEGG Automatic Annotation Server (KAAS) ver 2.1 [44].

2.6. Gene Family Identification and Phylogenetic Analysis

Protein sequences from 13 teleost species were obtained, with only the longest transcript variant of each gene being selected for further analysis (Table S2). Orthogroups for 14 teleost species were determined based on protein sequence similarity using OrthoFinder v2.5.5 with default parameters. A phylogenetic tree was constructed using the concatenated protein sequences employing MAFFT v7.475 software [45]. Divergence times were estimated using TimeTree [46]. We then used BEAST2 v2.6.7 [47] to perform Bayesian inference (BI) and the Markov chain Monte Carlo (MCMC) theory approach in BI, running 2,000,000 generations. Gene family expansions and contractions were analyzed using CAFE v4.2.1, with the parameters-p 0.05 and filter.

3. Results and Discussion

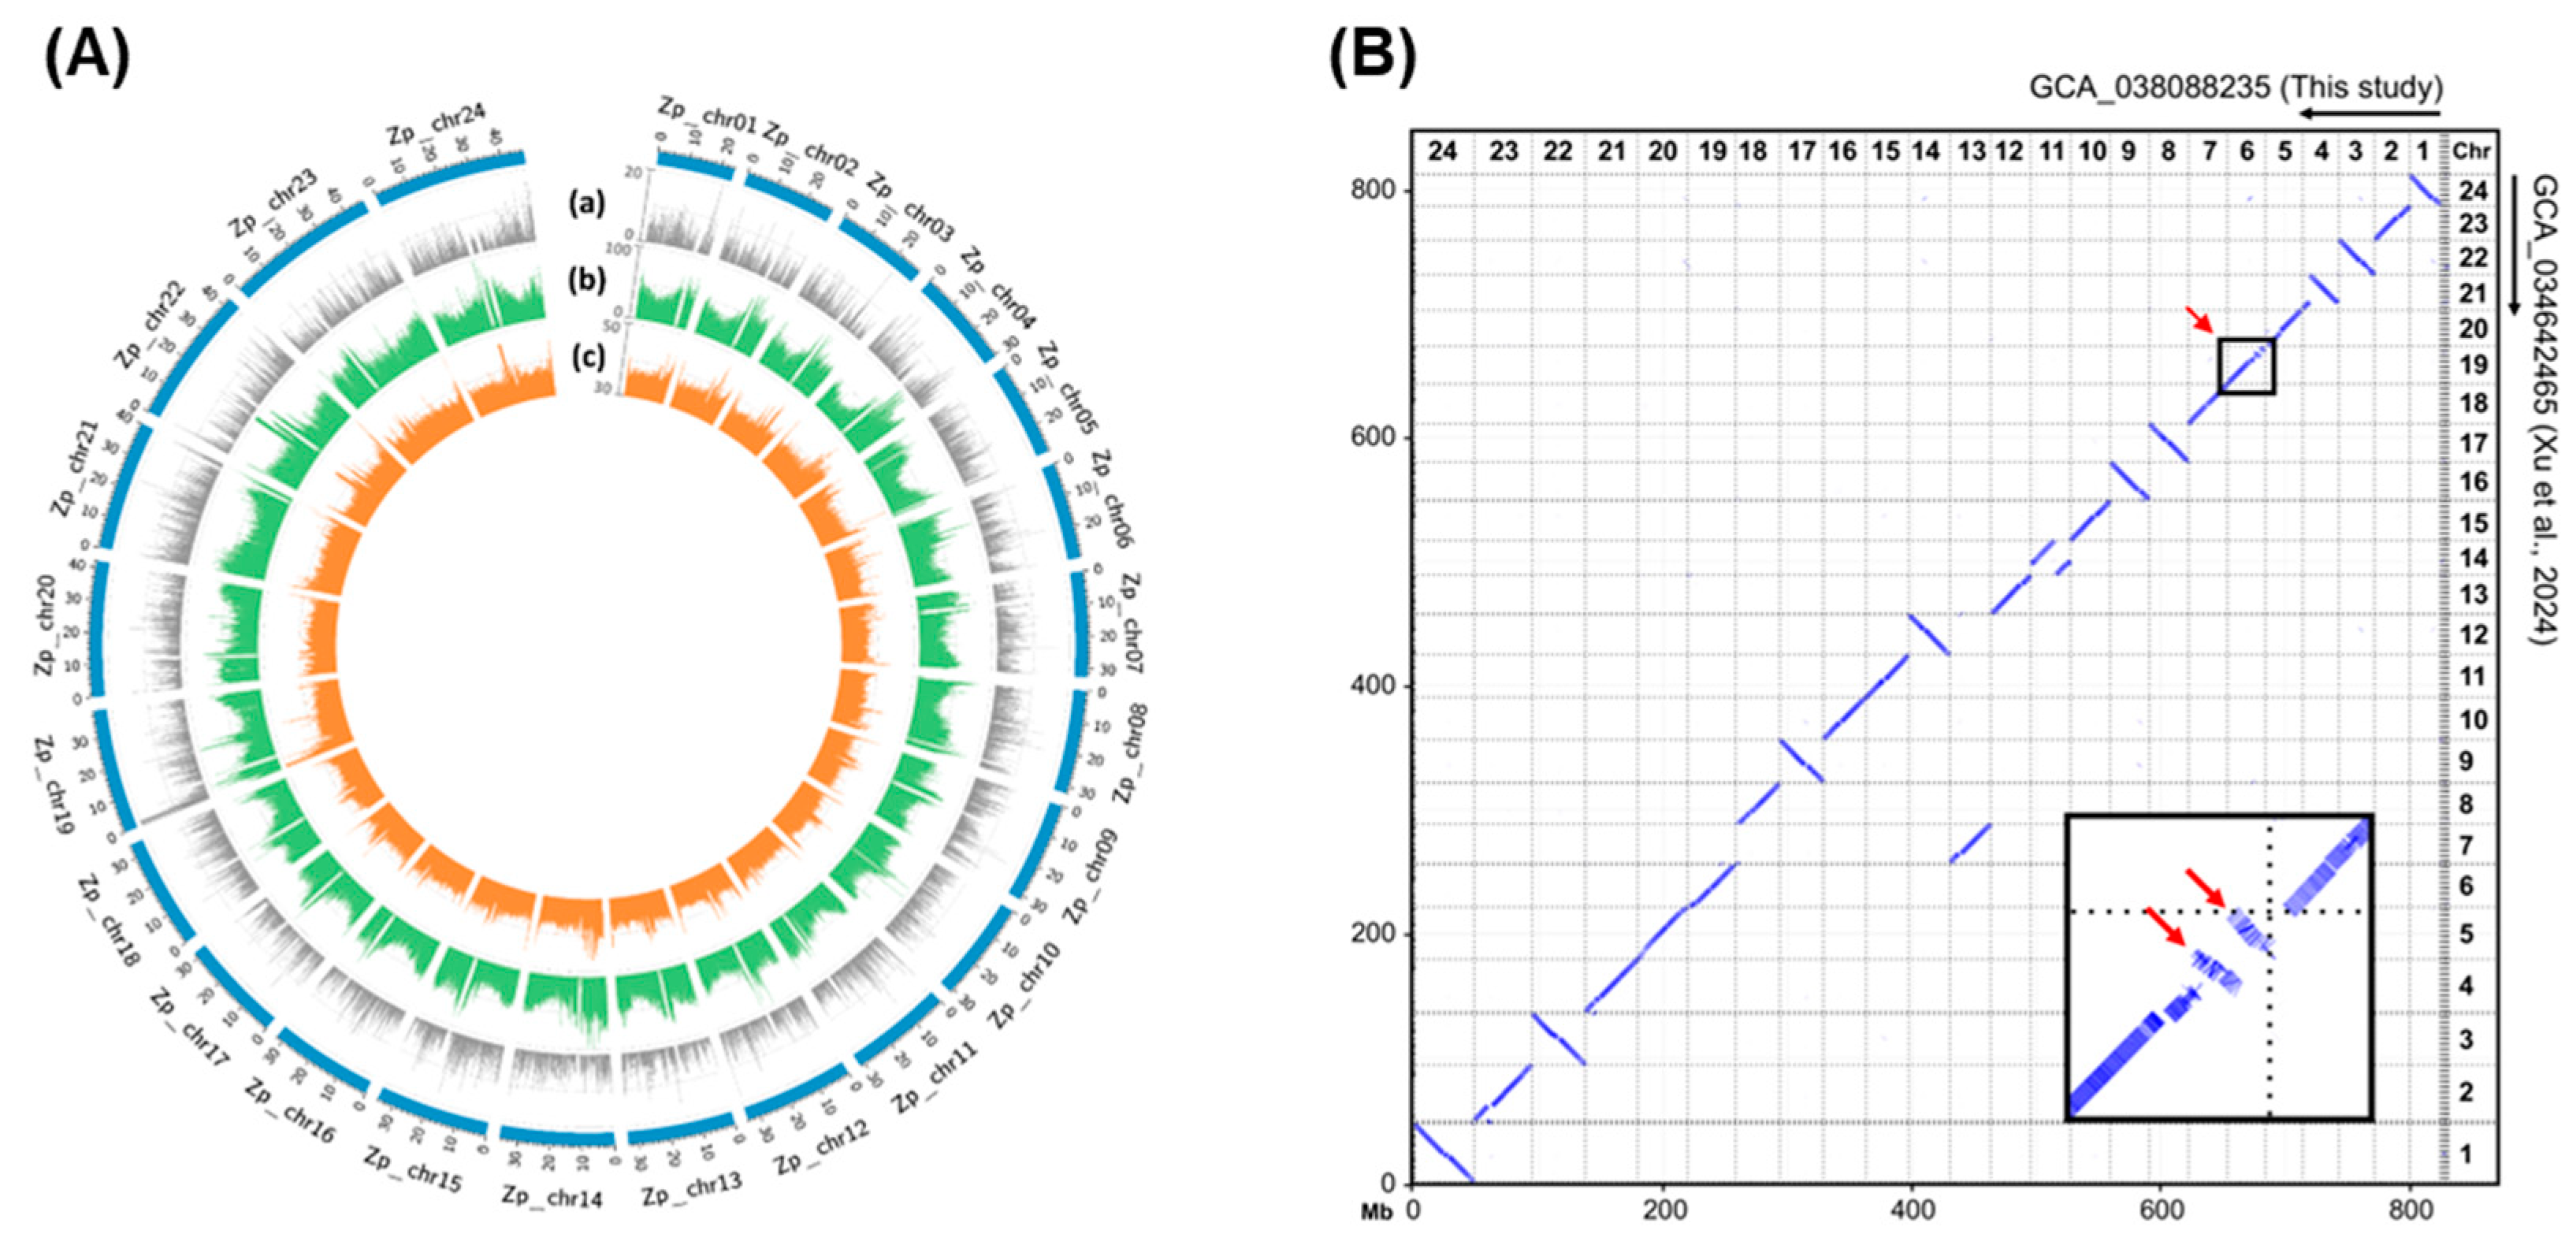
3.1. Genome Sequencing and Assembly

We sequenced 84.8 Gb and 29.7 Gb of genomic data using Illumina and PacBio platform, respectively. Detailed information for the genome assembly was described in a previous report [19]. The estimated genome size by GenomeScope2 analysis was 760.8 Mb (Figure S1). Assembly with Hifiasm resulted in 336 contigs with an N50 length of 31 Mb, and the final genome size was 838.6 Mb (Table 1). The final genome size was larger than the estimated size. Due to structural variation cutoffs or potential contamination, there may be approximately 10% variability in the artificial genome size estimation [48]. The genome size was smaller in other species belonging to order Cypriniformes (Table S2).
For scaffolding to the chromosome level, a total of 250,789,660 Hi-C read pairs, with an aggregate length of approximately 75.2 Gb (Table S1), were aligned to the draft genome assembly. Final Hi-C scaffolding measured approximately 824.4 Mb with a maximum scaffold length of 47.6 Mb. Among 319 Hi-C scaffolds, we identified 24 pseudochromosomes in the Z. platypus genome that exceeded 10 Mb in length (Table 1; Figure 1A). The largest and smallest pseudochromosomes were 47,632,145 and 24,077,739 bp, respectively (Table S4). The Hi-C interaction heatmap demonstrated that the 24 pseudochromosomes can be clearly distinguished and are consistent with a genome assembly of excellent quality (Figure S2).
When we compared our genome assemblies with the recently sequenced one [15], it was revealed that our genome size was slightly larger. However, the number of pseudochromosomes remained the same at 24, with similar scaffold N50 values of 33.3 Mb and 32.3 Mb, respectively (Table S3). Although a detailed analysis is required for clarification, we assume that the differences in genome size and structure may indicate distinct evolutionary paths between the Korean and Chinese populations of Z. platypus.
Notably, despite targeting the same species for genome sequencing, inversions were observed intra-chromosomally when comparing our genome assemblies to the recently sequenced Z. platypus genome assemblies [15] (Figure 1B). There is no detailed information available on the habitat, distribution, and historical separation of Z. platypus between China and Korea. However, we assume that the accumulation of genomic characteristics may be induced by early separation and isolation in different regions, contributing to speciation. Therefore, studies comparing genomic differences and traits from samples collected in various inland regions beyond China and Korea will be crucial for understanding the evolutionary history of Z. platypus in future research.
The completeness of the Z. platypus genome assembly was assessed using BUSCOs against the actinopterygii_odb10 database. BUSCO analysis indicated that 3572 (98.1%) of the expected genes were found in the assembly, with 3521 (96.7%) being single copy and 51 (1.4%) duplicated (Table 2). Our BUSCO value was slightly higher than that of the recently sequenced genome (96.3%) (Table S3). This result suggests that the assembled Z. platypus genome is intact for completing the annotation of protein-coding sequences.

3.2. Comparison of Transposable Elements and Non-Coding RNA Profiling

TEs are major contributors to genome rearrangement and expansion due to their replicative nature [49]. The Z. platypus genome contained 41.45% repetitive sequences. Analysis revealed that the Z. platypus genome comprises 39.22% interspersed sequences, including 14.76% DNA transposons, 0.96% short interspersed nuclear elements (SINEs), 0.16% long interspersed nuclear elements (LINEs), and 4.84% long terminal repeats (LTRs) (Table S5). Approximately 10.29% of TEs were specific unknown repeats. A relatively lower number of LINEs is observed in Z. platypus than in Ctenopharyngodon idella and Megalobrama amblycephala belonging to family Xenocyprididae (Figure 2A). In addition, comparative analyses of Kimura substitution levels indicate that Zacco platypus has experienced higher rate of DNA transposon copies, which is similar to patterns noted in order Cypriniformes (Table S6; Figure 2B). In this study, TE elements were shown to have a positive correlation with genome size (Figure S1). Although the relationship was not very strong, this pattern has been reported in previous studies on teleost genomes [50,51].
In addition, we predicted a total of 24,542 (0.26%) non-coding RNA, including 8779 tRNA, 1132 miRNA, 882 snRNA, 184 snoRNA, 10 scaRNA, and 8446 rRNA genes in the Z. platypus genome (Table S7).

3.3. Gene Prediction and Functional Annotation with Fish Genomes

Datasets for gene prediction were prepared de novo transcriptome assemblies from RNA-Seq using Trinity and Iso-Seq data by clustering with 95% identities. The total number of genes is 34,036, and the complete BUSCO value is 89.4%. Statistics of raw data and final predicated gene annotation are presented in Table 3.
A total of 29,148 Z. platypus genes were annotated using bioinformatics, and these genes aligned with known proteins in public databases (Table S8). Approximately 29,086, 22,617, 16,840, and 19,153 genes were functionally annotated using the BLAST NR database, protein domains, GO, and KEGG ortholog predictions, respectively. Orthologous analysis identified a core set of 12,907 genes shared among the four databases (Figure 3).

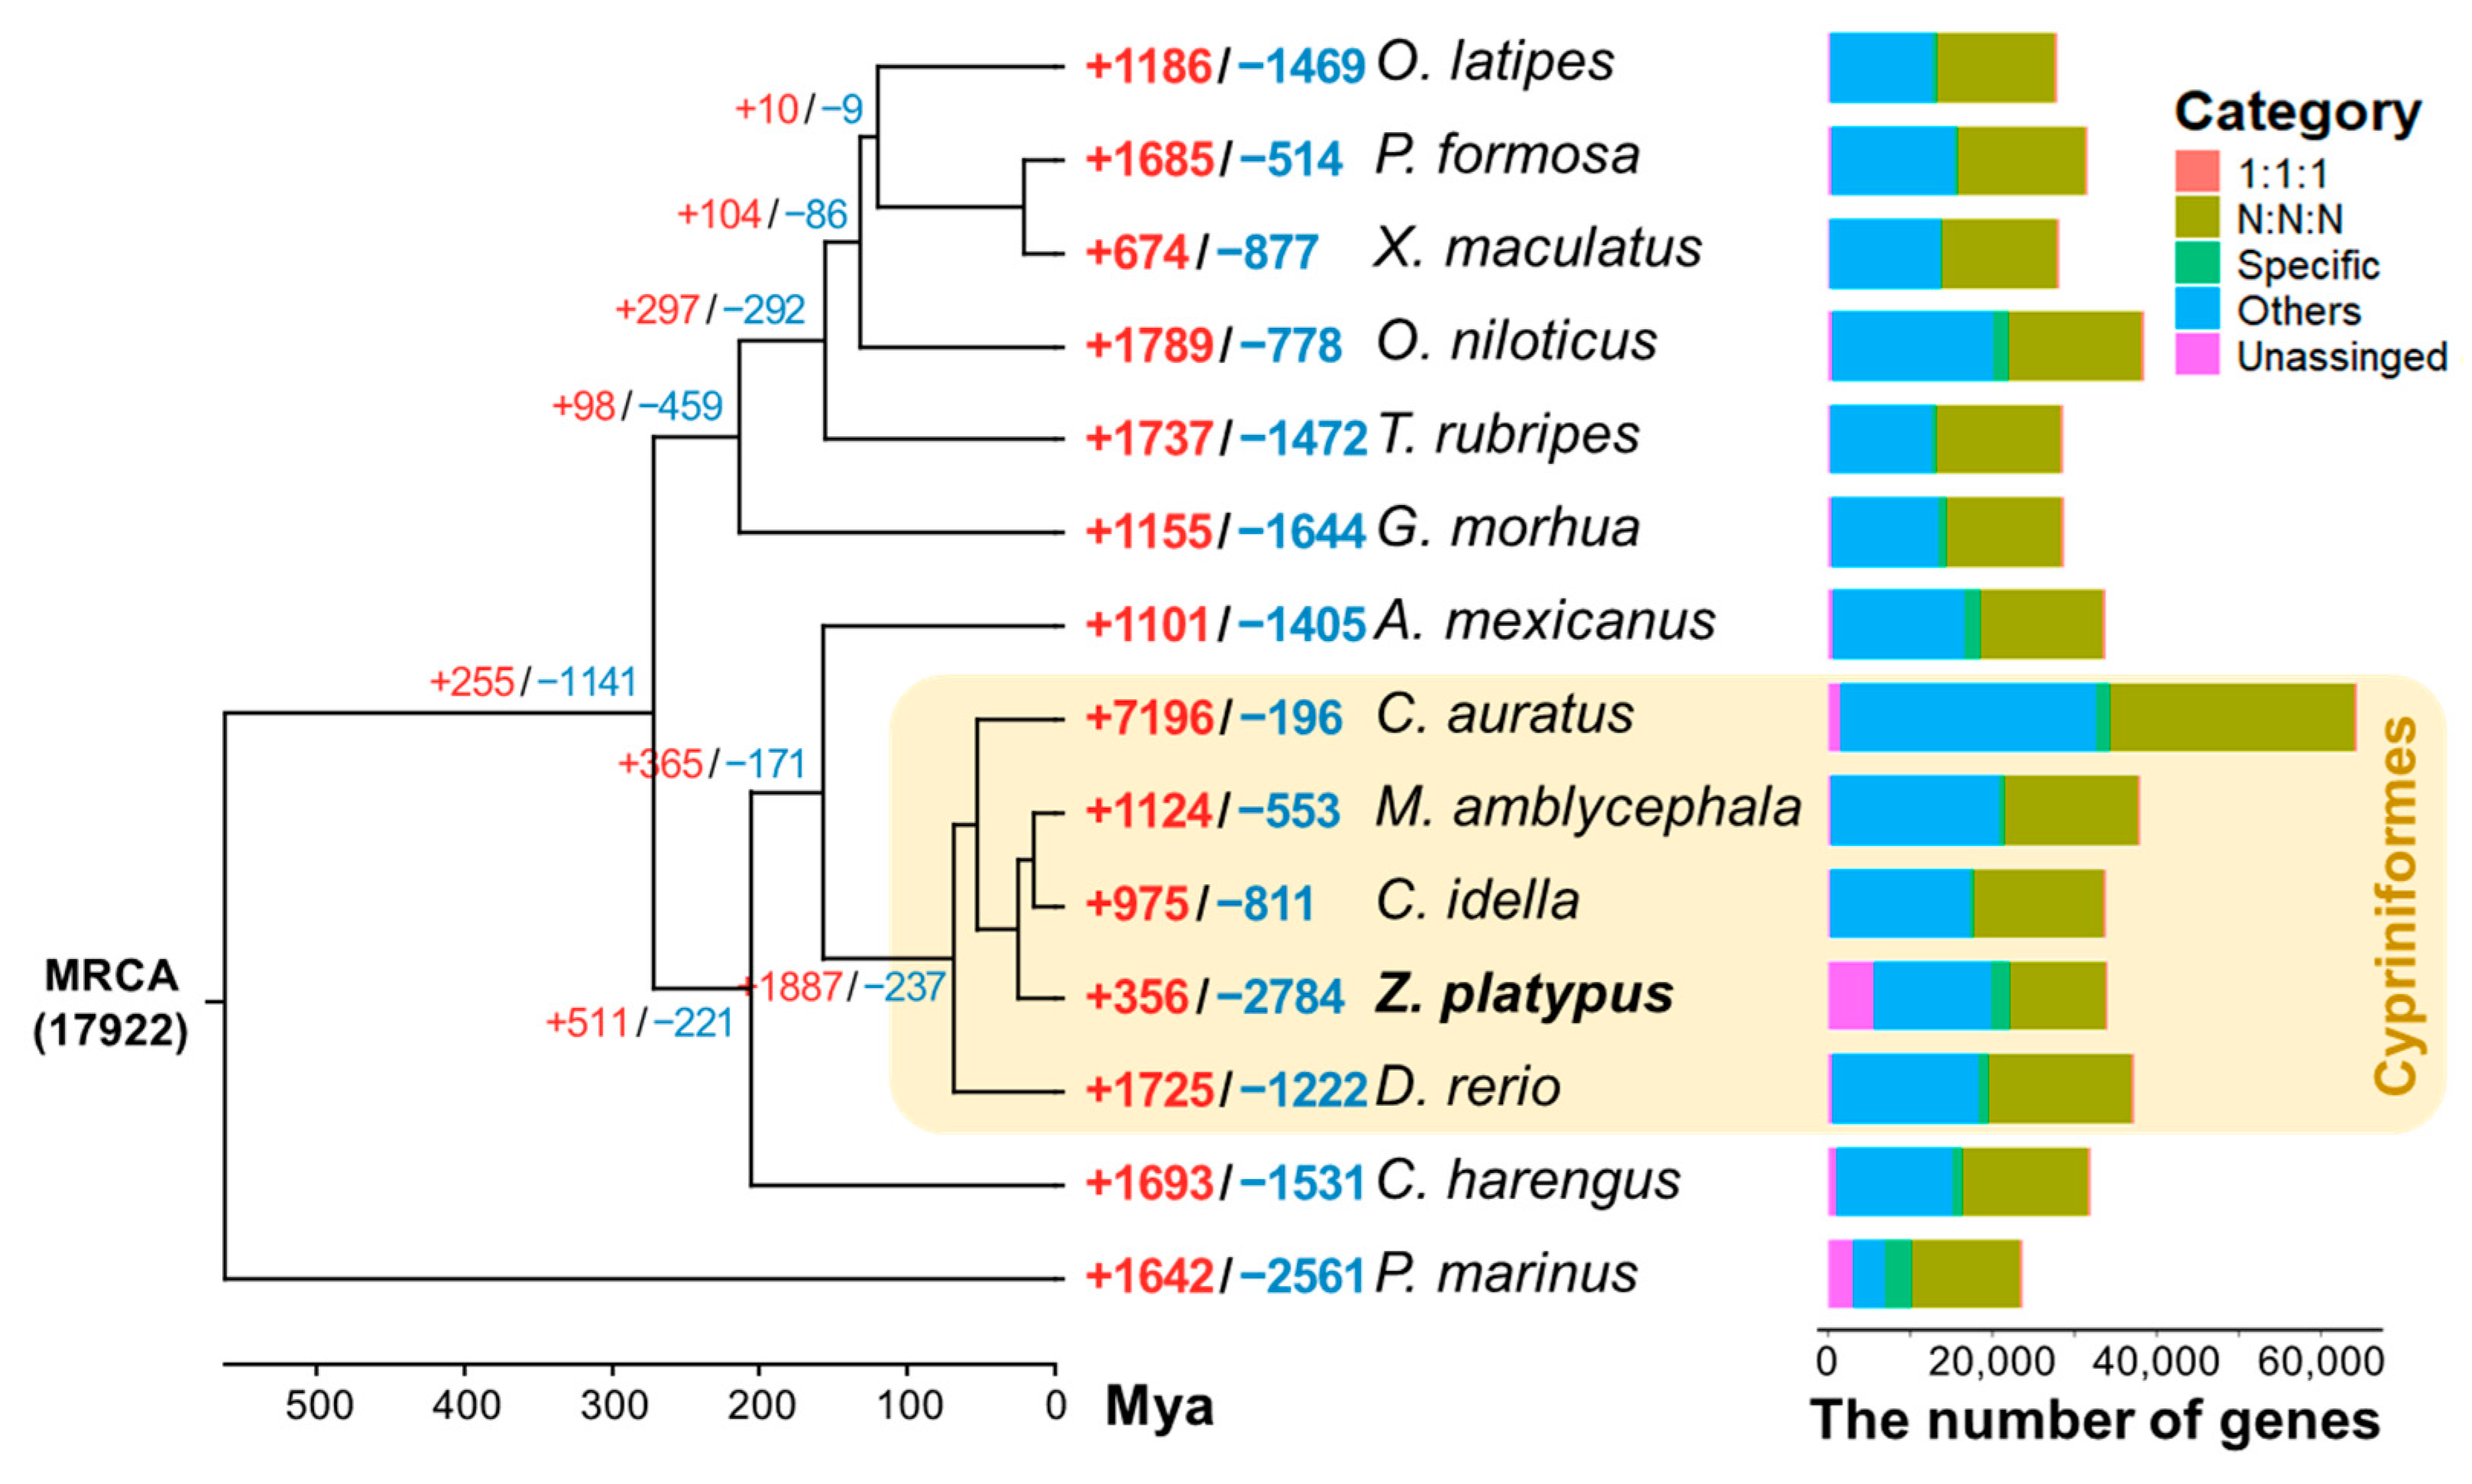
3.4. Gene Family Identification and Phylogenetic Analysis

We identified 24,627 orthogroups across all 14 species. The analysis revealed that 8093 orthogroups were shared among all species, while 452 orthogroups, encompassing 2312 genes, were specific to Z. platypus (Table S9). In the resulting tree, Z. platypus clustered with five other species belonging to order Cypriniformes, diverging from a common ancestor with Petromyzon marinus approximately 563 million years ago. A total of 356 and 2784 gene families significantly expanded and contracted in Z. platypus, respectively (Figure 4).
The comparative analysis of orthologous gene families showed that the proportion of gene contraction in Z. platypus was higher than the proportion of gene expansion when compared to other species belonging to the order Cypriniformes. Except for Carassius auratus, which was previously reported as a tetraploid [52], most teleosts had approximately 20,000 to 40,000 orthologous genes (Table S9; Figure 4). Z. platypus exhibited a relatively high proportion of specific orthologous genes (6.8%) and a low multicopy orthogroups (83.6%) compared to other species in the order Cypriniformes (Table S9).
In fish, genomes generally consist of gene families that undergo expansions or contractions, some of which occur in specific species and reflect adaptive diversification in their environments [53]. This diversification contributes to obtaining novel functions that shape the species-specific evolution of physiologies and phenotypes in fish [54]. In a comparative analysis of orthologs across teleosts, we identified several genes and gene families that are uniquely expanded in Z. platypus. These findings could be valuable for applying genomic information to ecotoxicology and environmental studies. Particularly, genes and gene families associated with the stress response, oxidative stress response, detoxification, and immunity were prominently annotated in the Z. platypus genome assembly, such as glucuronosyltransferase (UGT; OG0019788), cytochrome P450 family 2 subfamily J (CYP2J; OG0023640), phospholipid-hydroperoxide glutathione peroxidase (GPx4; OG0023727), and mitogen-activated protein kinase 4 (MAPK4; OG0023737) (Table S10). UGTs, as a superfamily, primarily function in detoxification by catalyzing the covalent linkage of glucuronic acid to a substrate with a suitable acceptor functional group, a process referred to as glucuronidation [55]. This occurs primarily in the fish liver, which is the major detoxification organ. CYP enzymes play a crucial role in the metabolism of numerous endogenous and exogenous xenobiotics in fish [56,57]. GPx is one of the crucial antioxidant enzymes, functioning as a free radical scavenger by catalyzing the metabolism of hydrogen peroxide and lipid peroxides into water and lipid alcohols, respectively [58]. MAPK4 directly phosphorylates and activates the c-Jun NH2-terminal kinases in response to various cellular stresses and immune modulators [59]. With this information, future research should prioritize understanding the potential roles of these genes in response, resilience, and adaptation, as well as detoxification metabolism against xenobiotics and environmental fluctuations, with the development of multiple biomarkers and a multi-omics approach.
In conclusion, the pale chub genome assembly signifies a significant advancement toward comprehending various metabolic pathways in response to anthropogenic and/or environmental influences in freshwater environments. Despite being one of the most abundant members of freshwater ecosystems in East Asia, these fish have been relatively understudied in terms of omics-based ecotoxicology and environmental research. This high-quality genomic information will serve as a crucial tool in bridging this knowledge gap, enabling studies on population genetics, local habitats, and responses to environmental variation.

Supplementary Materials

The following supporting information can be downloaded at: https://www.mdpi.com/article/10.3390/d16090529/s1, Table S1. Statistics of raw data and pre-processing; Table S2. Genome databases that were used for comparative analysis; Table S3. Comparative genome statistics between two Z. platypus genomes; Table S4. The length of each chromosome in base pairs; Table S5. Repeat elements identified in the Zacco platypus genome; Table S6. Composition of transposable elements between Zacco platypus and other fish species; Table S7. Non-coding RNA profiling; Table S8. Functional annotated genes in Z. platypus; Table S9. Statistics of orthologous gene family analysis between Z. platypus and other fish species. Table S10. KEGG annotated species-specific orthogroups in Z. platypus; Figure S1. Results on genome size estimation of the Zacco platypus assembly obtained by GenomeScope2.0 analysis; Figure S2. Chromosome-level Hi-C interaction heat map for Z. platypus; Figure S3. Correlation analysis between genome size and contents of transposable elements (TE) in 13 teleost genomes.

Author Contributions

Conceptualization, S.-E.N. and J.-S.R.; software, S.-E.N.; formal analysis, S.-E.N.; investigation, S.-E.N. and D.-Y.B.; resources, D.-Y.B.; data curation, S.-E.N.; writing—original draft preparation, S.-E.N.; writing—review and editing, D.-Y.B. and J.-S.R.; visualization, S.-E.N.; supervision and project administration, J.-S.R.; funding acquisition, J.-S.R. All authors have read and agreed to the published version of the manuscript.

Funding

This work was supported by Korea Environment Industry & Technology Institute (KEITI) through Aquatic Ecosystem Conservation Research Program (2022003050001), funded by Korea Ministry of Environment (MOE).

Institutional Review Board Statement

The work meets the ethical requirements for publication in Diversity. Ethical approval of the study was obtained from the Incheon National University Faculty of Experimental Animals Ethics Committee (Decision No: INU-ANIM-2023-13).

Data Availability Statement

The final genome assembly of Zacco platypus has been deposited at NCBI under GenBank, BioProject, and BioSample with accession numbers JBBHEA000000000, PRJNA1088288, and SAMN40466320, respectively. The Illumina (SRR28903499 and SRR28903496), PacBio (SRR28903500), Hi-C (SRR28903498), and Iso-seq (SRR28903497) reads have been deposited in the NCBI Sequence Read Archive (SRA) database under the study accession number of SRP505804.

Conflicts of Interest

The authors declare no conflicts of interest.

References

  1. Van der Oost, R.; Beyer, J.; Vermeulen, N.P. Fish bioaccumulation and biomarkers in environmental risk assessment: A review. Environ. Toxicol. Pharmacol. 2003, 13, 57–149. [Google Scholar] [CrossRef]
  2. Piña, B.; Barata, C. A genomic and ecotoxicological perspective of DNA array studies in aquatic environmental risk assessment. Aquat. Toxicol. 2011, 105, 40–49. [Google Scholar] [CrossRef]
  3. Lieschke, G.J.; Currie, P.D. Animal models of human disease: Zebrafish swim into view. Nat. Rev. Genet. 2007, 8, 353–367. [Google Scholar] [CrossRef]
  4. Kasahara, M.; Naruse, K.; Sasaki, S.; Nakatani, Y.; Qu, W.; Ahsan, B.; Yamada, T.; Nagayasu, Y.; Doi, K.; Kasai, Y.; et al. The medaka draft genome and insights into vertebrate genome evolution. Nature 2007, 447, 714–719. [Google Scholar] [CrossRef]
  5. Howe, K.; Clark, M.D.; Torroja, C.F.; Torrance, J.; Berthelot, C.; Muffato, M.; Collins, J.E.; Humphray, S.; McLaren, K.; Matthews, L.; et al. The zebrafish reference genome sequence and its relationship to the human genome. Nature 2013, 496, 498–503. [Google Scholar] [CrossRef]
  6. Leprieur, F.; Beauchard, O.; Blanchet, S.; Oberdorff, T.; Brosse, S. Fish invasions in the world’s river systems: When natural processes are blurred by human activities. PLoS Biol. 2008, 6, e28. [Google Scholar]
  7. Vorosmarty, C.J.; Green, P.; Salisbury, J.; Lammers, R.B. Global water resources: Vulnerability from climate change and population growth. Science 2000, 289, 284–288. [Google Scholar] [CrossRef]
  8. Klemm, D.J. Fish Field and Laboratory Methods for Evaluating the Biological Integrity of Surface Waters; Environmental Monitoring Systems Laboratory-Cincinnati, Office of Modeling, Monitoring Systems, and Quality Assurance, Office of Research and Development, U.S. Environmental Protection Agency: Cincinnati, OH, USA, 1993.
  9. Kim, J.-H.; Yeom, D.-H.; Kim, W.-K.; An, K.-G. Regional ecological health or risk assessments of stream ecosystems using biomarkers and bioindicators of target species (Pale Chub). Water Air Soil Pollut. 2016, 227, 469. [Google Scholar] [CrossRef]
  10. Dai, Y.-J.; Jia, Y.-F.; Chen, N.; Bian, W.-P.; Li, Q.-K.; Ma, Y.-B.; Chen, Y.-L.; Pei, D.-S. Zebrafish as a model system to study toxicology. Environ. Toxicol. Chem. 2014, 33, 11–17. [Google Scholar] [CrossRef]
  11. Kim, W.-S.; Park, K.; Park, J.-W.; Lee, S.-H.; Kim, J.-H.; Kim, Y.-J.; Oh, G.-H.; Ko, B.-S.; Park, J.-W.; Hong, C.; et al. Transcriptional responses of stress-related genes in pale chub (Zacco platypus) inhabiting different aquatic environments: Application for biomonitoring aquatic ecosystems. Int. J. Environ. Res. Public Health 2022, 19, 11471. [Google Scholar] [CrossRef]
  12. Kim, W.-K.; Jung, J. In situ impact assessment of wastewater effluents by integrating multi-level biomarker responses in the pale chub (Zacco platypus). Ecotoxicol. Environ. Saf. 2016, 128, 246–251. [Google Scholar] [CrossRef]
  13. Canzler, S.; Schor, J.; Busch, W.; Schubert, K.; Rolle-Kampczyk, U.E.; Seitz, H.; Kamp, H.; von Bergen, M.; Buesen, R.; Hackermüller, J. Prospects and challenges of multi-omics data integration in toxicology. Arch. Toxicol. 2020, 94, 371–388. [Google Scholar] [CrossRef] [PubMed]
  14. Nam, S.-E.; Bae, D.-Y.; Ki, J.-S.; Ahn, C.-Y.; Rhee, J.-S. The importance of multi-omics approaches for the health assessment of freshwater ecosystems. Mol. Cell. Toxicol. 2023, 19, 3–11. [Google Scholar] [CrossRef]
  15. Xu, X.; Chen, J.; Guan, W.; Niu, B.; Yi, S.; Lou, B. A chromosome-level genome assembly of East Asia endemic minnow Zacco platypus. Sci. Data 2024, 11, 317. [Google Scholar] [CrossRef]
  16. Allen, G.C.; Flores-Vergara, M.; Krasynanski, S.; Kumar, S.; Thompson, W. A modified protocol for rapid DNA isolation from plant tissues using cetyltrimethylammonium bromide. Nat. Protoc. 2006, 1, 2320–2325. [Google Scholar] [CrossRef]
  17. Folmer, O.; Black, M.; Hoeh, W.; Lutz, R.; Vrijenhoek, R. DNA primers for amplification of mitochondrial cytochrome c oxidase subunit I from diverse metazoan invertebrates. Mol. Mar. Biol. Biotechnol. 1994, 3, 294–299. [Google Scholar] [PubMed]
  18. Brandon-Mong, G.-J.; Gan, H.-M.; Sing, K.-W.; Lee, P.-S.; Lim, P.-E.; Wilson, J.-J. DNA metabarcoding of insects and allies: An evaluation of primers and pipelines. Bull. Entomol. Res. 2015, 105, 717–727. [Google Scholar] [CrossRef]
  19. Nam, S.-E.; Rhee, J.-S. Chromosomal-level genome assembly data from the pale chub, Zacco platypus (Jordan & Evermann, 1902). Data Brief 2024, 55, 110596. [Google Scholar]
  20. Bolger, A.; Lohse, M.; Usadel, B. Trimmomatic: A flexible trimmer for Illumina sequence data. Bioinformatics 2014, 30, 2114–2120. [Google Scholar] [CrossRef]
  21. Bushnell, B.; Rood, J.; Singer, E. BBMerge–accurate paired shotgun read merging via overlap. PLoS ONE 2017, 12, e0185056. [Google Scholar] [CrossRef]
  22. Ranallo-Benavidez, T.R.; Jaron, K.S.; Schatz, M.C. GenomeScope 2.0 and Smudgeplot for reference-free profiling of polyploid genomes. Nat. Commun. 2020, 11, 1432. [Google Scholar] [CrossRef] [PubMed]
  23. Cheng, H.; Concepcion, G.T.; Feng, X.; Zhang, H.; Li, H. Haplotype-resolved de novo assembly using phased assembly graphs with hifiasm. Nat. Methods 2021, 18, 170–175. [Google Scholar] [CrossRef] [PubMed]
  24. Li, H.; Durbin, R. Fast and accurate long-read alignment with Burrows–Wheeler transform. Bioinformatics 2010, 26, 589–595. [Google Scholar] [CrossRef]
  25. Burton, J.N.; Adey, A.; Patwardhan, R.P.; Qiu, R.; Kitzman, J.O.; Shendure, J. Chromosome-scale scaffolding of de novo genome assemblies based on chromatin interactions. Nat. Biotechnol. 2013, 31, 1119–1125. [Google Scholar] [CrossRef]
  26. Durand, N.C.; Robinson, J.T.; Shamim, M.S.; Machol, I.; Mesirov, J.P.; Lander, E.S.; Aiden, E.L. Juicebox provides a visualization system for Hi-C contact maps with unlimited zoom. Cell Syst. 2016, 3, 99–101. [Google Scholar] [CrossRef] [PubMed]
  27. Krzywinski, M.; Schein, J.; Birol, I.; Connors, J.; Gascoyne, R.; Horsman, D.; Jones, S.J.; Marra, M.A. Circos: An information aesthetic for comparative genomics. Genome Res. 2009, 19, 1639–1645. [Google Scholar] [CrossRef]
  28. Li, H. Minimap2: Pairwise alignment for nucleotide sequences. Bioinformatics 2018, 34, 3094–3100. [Google Scholar] [CrossRef]
  29. Winter, D.; Lee, K.; Cox, M. Pafr: Read, Manipulate and Visualize Pairwise mApping Format. 2020. Available online: https://dwinter.github.io/pafr/ (accessed on 3 July 2024).
  30. Simão, F.A.; Waterhouse, R.M.; Ioannidis, P.; Kriventseva, E.V.; Zdobnov, E.M. BUSCO: Assessing genome assembly and annotation completeness with single-copy orthologs. Bioinformatics 2015, 31, 3210–3212. [Google Scholar] [CrossRef]
  31. Bao, Z.; Eddy, S.R. Automated de novo identification of repeat sequence families in sequenced genomes. Genome Res. 2002, 12, 1269–1276. [Google Scholar] [CrossRef]
  32. Flynn, J.M.; Hubley, R.; Goubert, C.; Rosen, J.; Clark, A.G.; Feschotte, C.; Smit, A.F. RepeatModeler2 for automated genomic discovery of transposable element families. Proc. Natl. Acad. Sci. USA 2020, 117, 9451–9457. [Google Scholar] [CrossRef]
  33. Nawrocki, E.P.; Eddy, S.R. Infernal 1.1: 100-fold faster RNA homology searches. Bioinformatics 2013, 29, 2933–2935. [Google Scholar] [CrossRef]
  34. Haas, B.J.; Papanicolaou, A.; Yassour, M.; Grabherr, M.; Blood, P.D.; Bowden, J.; Couger, M.B.; Eccles, D.; Li, B.; Lieber, M.; et al. De novo transcript sequence reconstruction from RNA-seq using the Trinity platform for reference generation and analysis. Nat. Protoc. 2013, 8, 1494–1512. [Google Scholar] [CrossRef] [PubMed]
  35. Holt, C.; Yandell, M. MAKER2: An annotation pipeline and genome-database management tool for second-generation genome projects. BMC Bioinform. 2011, 12, 491. [Google Scholar] [CrossRef] [PubMed]
  36. Ter-Hovhannisyan, V.; Lomsadze, A.; Chernoff, Y.O.; Borodovsky, M. Gene prediction in novel fungal genomes using an ab initio algorithm with unsupervised training. Genome Res. 2008, 18, 1979–1990. [Google Scholar] [CrossRef]
  37. Korf, I. Gene finding in novel genomes. BMC Bioinform. 2004, 5, 59. [Google Scholar] [CrossRef]
  38. Stanke, M.; Schöffmann, O.; Morgenstern, B.; Waack, S. Gene prediction in eukaryotes with a generalized hidden Markov model that uses hints from external sources. BMC Bioinform. 2006, 7, 62. [Google Scholar] [CrossRef]
  39. Li, W.; Godzik, A. Cd-hit: A fast program for clustering and comparing large sets of protein or nucleotide sequences. Bioinformatics 2006, 22, 1658–1659. [Google Scholar] [CrossRef] [PubMed]
  40. Buchfink, B.; Reuter, K.; Drost, H.-G. Sensitive protein alignments at tree-of-life scale using DIAMOND. Nat. Methods 2021, 18, 366–368. [Google Scholar] [CrossRef]
  41. Jones, P.; Binns, D.; Chang, H.-Y.; Fraser, M.; Li, W.; McAnulla, C.; McWilliam, H.; Maslen, J.; Mitchell, A.; Nuka, G.; et al. InterProScan 5: Genome-scale protein function classification. Bioinformatics 2014, 30, 1236–1240. [Google Scholar] [CrossRef]
  42. Ashburner, M.; Ball, C.A.; Blake, J.A.; Botstein, D.; Butler, H.; Cherry, J.M.; Davis, A.P.; Dolinski, K.; Dwight, S.S.; Eppig, J.T.; et al. Gene ontology: Tool for the unification of biology. Nat. Genet. 2000, 25, 25–29. [Google Scholar] [CrossRef]
  43. Götz, S.; Garcia-Gomez, J.M.; Terol, J.; Williams, T.D.; Nagaraj, S.H.; Nueda, M.J.; Robles, M.; Talón, M.; Dopazo, J.; Conesa, A. High-throughput functional annotation and data mining with the Blast2GO suite. Nucleic Acids Res. 2008, 36, 3420–3435. [Google Scholar] [CrossRef] [PubMed]
  44. Moriya, Y.; Itoh, M.; Okuda, S.; Yoshizawa, A.C.; Kanehisa, M. KAAS: An automatic genome annotation and pathway reconstruction server. Nucleic Acids Res. 2007, 35, W182–W185. [Google Scholar] [CrossRef] [PubMed]
  45. Katoh, K.; Standley, D.M. MAFFT multiple sequence alignment software version 7: Improvements in performance and usability. Mol. Biol. Evol. 2013, 30, 772–780. [Google Scholar] [CrossRef] [PubMed]
  46. Hedges, S.B.; Dudley, J.; Kumar, S. TimeTree: A public knowledge-base of divergence times among organisms. Bioinformatics 2006, 22, 2971–2972. [Google Scholar] [CrossRef]
  47. Bouckaert, R.; Vaughan, T.G.; Barido-Sottani, J.; Duchêne, S.; Fourment, M.; Gavryushkina, A.; Heled, J.; Jones, G.; Kühnert, D.; De Maio, N.; et al. BEAST 2.5: An advanced software platform for Bayesian evolutionary analysis. PLoS Comput. Biol. 2019, 15, e1006650. [Google Scholar] [CrossRef]
  48. Vurture, G.W.; Sedlazeck, F.J.; Nattestad, M.; Underwood, C.J.; Fang, H.; Gurtowski, J.; Schatz, M.C. GenomeScope: Fast reference-free genome profiling from short reads. Bioinformatics 2017, 33, 2202–2204. [Google Scholar] [CrossRef]
  49. Kidwell, M.G. Transposable elements and the evolution of genome size in eukaryotes. Genetica 2002, 115, 49–63. [Google Scholar] [CrossRef]
  50. Chalopin, D.; Naville, M.; Plard, F.; Galiana, D.; Volff, J.N. Comparative analysis of transposable elements highlights mobilome diversity and evolution in vertebrates. Genome Biolol. Evol. 2015, 7, 567–580. [Google Scholar] [CrossRef]
  51. Shao, F.; Han, M.; Peng, Z. Evolution and diversity of transposable elements in fish genomes. Sci. Rep. 2019, 9, 15399. [Google Scholar] [CrossRef]
  52. Risinger, C.; Larhammar, D. Multiple loci for synapse protein SNAP-25 in the tetraploid goldfish. Proc. Natl. Acad. Sci. USA 1993, 90, 10598–10602. [Google Scholar] [CrossRef]
  53. Meyer, A.; Schartl, M. Gene and genome duplications in vertebrates: The one-to-four (-to-eight in fish) rule and the evolution of novel gene functions. Curr. Opin. Cell Biol. 1999, 11, 699–704. [Google Scholar] [CrossRef]
  54. Robinson-Rechavi, M.; Marchand, O.; Escriva, H.; Bardet, P.L.; Zelus, D.; Hughes, S.; Laudet, V. Euteleost fish genomes are characterized by expansion of gene families. Genome Res. 2001, 11, 781–788. [Google Scholar] [CrossRef]
  55. Rowland, A.; Miners, J.O.; Mackenzie, P.I. The UDP-glucuronosyltransferases: Their role in drug metabolism and detoxification. Int. J. Biochem. Cell Biol. 2013, 45, 1121–1132. [Google Scholar] [CrossRef]
  56. Guengerich, F.P. Common and uncommon cytochrome P450 reactions related to metabolism and chemical toxicity. Chem. Res. Toxicol. 2001, 14, 611–650. [Google Scholar] [CrossRef]
  57. Rhee, J.-S.; Kim, B.-M.; Choi, B.-S.; Choi, I.-Y.; Wu, R.S.S.; Nelson, D.R.; Lee, J.-S. Whole spectrum of cytochrome P450 genes and molecular responses to water-accommodated fractions exposure in the marine medaka. Environ. Sci. Technol. 2013, 47, 4804–4812. [Google Scholar] [CrossRef]
  58. Margis, R.; Dunand, C.; Teixeira, F.K.; Margis-Pinheiro, M. Glutathione peroxidase family—An evolutionary overview. FEBS J. 2008, 275, 3959–3970. [Google Scholar] [CrossRef]
  59. Cuenda, A. Mitogen-activated protein kinase kinase 4 (MKK4). Int. J. Biochem. Cell Biol. 2000, 32, 581–587. [Google Scholar] [CrossRef]
Figure 1. (A) Circos genome landscape of Z. platypus. Each block on the circle represents one of all 24 chromosomes. The colored peak plots indicate the following: (a) gene distribution (grey), (b) repeat distribution (green), and (c) GC contents (orange). (B) Results on synteny analysis between two Z. platypus genome assemblies. In the dot plot, the x-axis represents the chromosomes assembled in this study, and the y-axis represents those from the recently sequenced assembly [15]. Blue lines sloping downwards (\) indicate reversed sequences in chromosomes. Gaps between lines denote insertions or deletions. The box in the graph indicates inversion regions, and red arrows denote intra-chromosomal inversions.
Diversity 16 00529 g001
Figure 2. (A) Comparison of repetitive components in teleost genomes. Each transposable element (TE) was listed in Table S6. (B) Kimura distance-based copy divergence analysis of TE in Z. platypus genomes. Graphs represent genome coverage (Y-axis) for each type of TE (DNA transposons, SINE, LINE, and LTR retrotransposons).
Diversity 16 00529 g002
Figure 3. Venn diagram of functional annotation results for each bioinformatic database.
Diversity 16 00529 g003
Figure 4. Phylogenetic tree with 14 other fish species including Z. platypus. A phylogenetic tree was constructed using Bayesian inference (BI) and the Markov chain Monte Carlo (MCMC) approach. The numbers of expanded gene families (+, red) and contracted gene families (−, blue) are shown for each node and at the right of each species branch. MRCA is the most recent common ancestor. The colored histogram indicates that the genes of each species were categorized into five groups: 1:1:1 (single-copy orthologous genes in common gene families), N:N:N (multiple copy orthologous genes in common gene common gene families), Specific (genes from unique gene families from each species), others (genes that do not belong to any of the above ortholog categories), and unassigned orthologs (genes that were not included into any family).
Diversity 16 00529 g004
Table 1. Statistics of de novo genome assembly and final scaffolding.
De Novo Assembly (HiFi)Final Scaffolding (Hi-C)
Number of sequences336319
Number of scaffolds (pseudomolecule)-24
Number of contigs over 100 kb-40
Number of contigs over 1 Mb-25
Total length (bp)838,569,924824,428,551
Minimum length13,09413,094
Maximum length47,596,78347,632,145
N5031,873,55333,346,874
Table 2. Benchmarking universal single-copy orthologs (BUSCOs) evaluated for the completeness of the Zacco platypus genome assembly.
Actinopterygii_odb10No.%
Complete BUSCOs (%)357298.10%
Complete and single copy352196.70%
Complete and duplicated511.40%
Fragmented180.50%
Missing501.40%
Table 3. Statistics of gene prediction and annotation.
RNA-SeqIso-SeqFinal Predicted Genes
ProcessingTrinity assemblyClustering with 95% identitiesGenes selected with AED 0~0.99
Contigs number211,667201,84934,036
Contigs length (bp)211,578,101302,217,68648,030,879
Min length (bp)18996102
Max length (bp)40,46411,54092,250
Average length (bp)100014971411
GC content (%)48.444.550.3
BUSCOs %C: 82.7%
[S: 34.2%, D: 48.5%],
F: 6.6%, M: 10.7%
C: 84.9%
[S: 40.3%, D: 44.6%],
F: 2.8%, M: 12.3%
C: 89.4%
[S: 87.9%, D: 1.5%],
F: 4.3%, M: 6.3%
Disclaimer/Publisher’s Note: The statements, opinions and data contained in all publications are solely those of the individual author(s) and contributor(s) and not of MDPI and/or the editor(s). MDPI and/or the editor(s) disclaim responsibility for any injury to people or property resulting from any ideas, methods, instructions or products referred to in the content.

