Article

Two-Decade Changes in the Ciliate Assemblage Feeding Pattern Reflect the Reservoir Nutrient Load

1
Grupo de Investigación en Limnología Tropical, FES Iztacala, Universidad Nacional Autónoma de México, Av, de los Barrios 1, Los Reyes Iztacala, Tlalnepantla 54090, Mexico
2
Department of Aquatic Microbial Ecology, Institute of Hydrobiology, Biology Centre CAS, Na Sádkách 7, 370 05 České Budějovice, Czech Republic
3
Department of Ecosystem Biology, Faculty of Science, University of South Bohemia, Branišovská 1760, 370 05 České Budějovice, Czech Republic
4
Department of Hydrochemistry and Ecosystem Modelling, Institute of Hydrobiology, Biology Centre CAS, Na Sádkách 7, 370 05 České Budějovice, Czech Republic
5
Department of Zoology, Fisheries, Hydrobiology and Apiculture, Mendel University in Brno, Zemědělská 1, 613 00 Brno, Czech Republic
*
Author to whom correspondence should be addressed.
Diversity 2024, 16(9), 534; https://doi.org/10.3390/d16090534
Submission received: 15 May 2024 / Revised: 15 August 2024 / Accepted: 19 August 2024 / Published: 1 September 2024
(This article belongs to the Special Issue Diversity, Ecology and Genetics of Ciliates)

Abstract

:
The perception of the importance of ciliate in freshwater has changed dramatically since the “microbial loop” conceptualisation, reflecting methodological attempts. The data from two decades (1994–2018) on the surface (0–3 m) ciliate assemblage in the Slapy reservoir (Vltava River, Czech Republic) during two different nutrient-load defined periods were analysed. We grouped the identified, quantified, and biomass-evaluated ciliates in the quantitative protargol-impregnated preparations according to their feeding behaviour. The sampling median and interquartile range data of the ciliates were plotted; the modelled water age, nutrients, bacteria, heterotrophic nanoflagellates, and Rhodomonas spp. were applied as the main explanatory background variables. We validated the differences between the periods, engaging multivariate analyses. The picoplankton-filtering species dominated the assemblages in an annual mean (halteriids and minute strobilidiids followed by peritrichs). Algae hunting urotrichs, Balanion planctonicum, and nanoplankton filtering tintinnids were significant before the spring phytoplankton peak when a maximum of ciliate biomass reflected mixotrophic nanoplankton filtering pelagostrombidiids. Only there did ciliate biomass tightly follow their quantified prey. Heterotrophic and mixotrophic Askenasia and Lagynophrya were typical raptorial/flagellate-hunting cilates; only Mesodinium spp. reached the maximum during autumn. The observed oligotrophication of the reservoir increased the ciliate assemblage biomass in the surface layer during stratification in concordance with the Plankton Ecology Group (PEG) model.

1. Introduction

The perception of ciliate importance in the lotic environment has been changing dramatically since the 1980s when the improved microscopic-plankton study methods were introduced, as summarised in a revised plankton ecology paradigm of the Plankton Ecology Group (PEG) model [1]. However, the pilot methods already used in experimental works were only slowly replacing the traditional ones, e.g., in monitoring programs using the same method for long periods.
The application of epifluorescence methods based on both the autofluorescence of photosynthetic pigments and direct staining of microorganisms, namely with DAPI [2], has led to the conceptualisation of the ciliates’ role in a microbial loop [3], now better defined as a network within the planktonic food web ([4,5] and references therein). Numerous articles quantified in situ feeding rates of the heterotrophic, autotrophic, and/or mixotrophic ciliates based on the direct methods enumerating either fluorescent particles mimicking edible food or fluorescently stained genuine prey [6]. Since then, the importance of ciliates has been proven, and the boom of studies emerged, highlighting significant correlations between the abundance and activity of ciliates, their prey (mainly bacteria), or predators (mainly copepods) in different layers of the water column of aquatic ecosystems [7,8,9].
On the other hand, a routine ciliate counting method for bulk samples of ciliates has not been widely approved for a long time since the re-description of a valuable combination of Lugol iodine and Utermöhl’s methods for ciliates [10]; it was followed by the eventual decolourising of the sample with thiosulphate and formalin for its investigation in an epifluorescence microscope [11,12]. It became the first reliable method for studying pelagic ciliates used so far [13,14,15,16,17], including the most complete ciliate monitoring programme in Lake Constance [18,19]. Other groups preferred an application of DAPI staining for the ciliate quantification [20,21,22,23]. However, another methodological improvement was needed for a parallel satisfactory identification of the specimens. Quantitative Protargol Stain (QPS [24,25,26]) enabled the direct application of protargol impregnation to samples concentrated on membrane filters. The method has been routinely applied since the original publication [5,21,27,28,29,30] and has become worthy by combining with modern molecular methods [31,32].
Even though the vertical distribution of ciliates is well known in small water bodies [33], we still lack detailed information on the whole-year stratification of ciliates from deep water bodies (compare [10,13,30,34,35]). The sampling strategy following such information usually looked for the layers with the maximum ciliate occurrence in the water column (such as the lower metalimnion limit, chlorophyll or deep-chlorophyll maxima, oxycline, or a limit of anoxia). It was frequently employed in short-term studies [5,21,22,23].
However, only ciliate samples from the surface layer or shallow epilimnion have been processed frequently because such layers were typically sampled for monitoring; moreover, due to the change in ciliate analysis to molecular methods, the possible number of processed samples has decreased (recently, [36]). Molecular biology attempts, e.g., high-throughput sequencing-based network analyses, have already improved our knowledge of the microbial interactions within the plankton food webs, which is not showing everytime looping ([37] vs. [35]). However, adding ciliate analysis to zooplankton and/or phytoplankton-based sampling programs without a proper design would be inappropriate [4].
Undoubtedly, the database of ciliates from Lake Constance produced between 1987 and 1998 is the biggest analysed one and integrates almost all layers of the comparatively deep epilimnion [18,38]. This database is still exploited to model ciliate dynamics [19,39,40,41]. In addition, the numerous articles on ciliates mentioned above, publications of long-term studies in stratified lakes covering more than three seasons do not exist, even though microbial–ecology groups are working on the problem within the national Long Term Ecological Research (LTER) programmes: Lake Kinneret (Israel) [42], Lake Biwa (Japan) [43,44], Lake Alchichica (Mexico) [45], Římov reservoir (Czechia) [34,46], or Lake Pavin (France) [47].
Our study aims to analyse two decades of ciliate monitoring in the 3 m surface/epilimnion layer of the eutrophic dimictic/monomictic reservoir Slapy (Czechia). The presented data series is the longest among those published on ciliates, which apply the same sampling and analysis method without any change. It covers the period with essential changes in nutrient load and the climate, which we divided into two segments, each spanning a decade. Such a long data series allows us to consider the most straightforward statistical methods in evaluating the annual ciliate cycle and changes in the ciliate assemblage upon changing environmental conditions.

2. Materials and Methods

2.1. Study Site

The Slapy reservoir is a narrow, canyon-type reservoir approx. 43 km long, with a maximum depth of 58 m, a volume of 2.70 × 10⁸ m3, and a mean retention time < 40 days [48,49,50,51]. The limnological regime of the Slapy reservoir is controlled by the temperature and water quality of the hypolimnetic discharge from the Orlík reservoir (max. depth 74 m, mean water residence time of 89 days) located only 9 km upstream of the Slapy reservoir; all water was discharged through the upper outlets only between August 2002 and June 2003. In the cold season, the Orlík water warms the reservoir; consequently, the water column often circulates from autumn to spring [51]. The studied Slapy reservoir has recently behaved as a warm monomictic lake [52] instead of a naturally dimictic water body [48]. Since the 1990s, the reservoir has undergone remarkable changes in limnological variables due to socioeconomic changes in the watershed and climate change [49,50,53]. A gradual increase in total phosphorus (TP) concentration continued during the first decade of our study (1994–2004), but the trend has reverted since 2004, followed by reduced primary production. Dissolved inorganic nitrogen (DIN) concentrations were dominated by nitrate, while ammonium and nitrite were negligible. A gradual decline in nitrate concentration since the 1990s reflected reduced atmospheric deposition, de-intensification and greening of agricultural production, and improvements in wastewater treatment. The effect of regional climate change results in earlier thermal stratification of the water column, which causes primary production in the epilimnion to start earlier and last longer [50]. On the other hand, early destratification in September stops the summer growth of phytoplankton.

2.2. Limnology Variables, Sampling, and Plankton Analysis

The basic physical–chemical properties were analysed in the surface samples taken at 0.5 m as described by Kopáček et al. [50]. The water quality and hydrodynamic model CE-QUAL-W2 v. 4.0 (Portland State University, Portland, OR, USA; [54]) was used to calculate the seasonal stratification period with the defined epilimnion. A water age was a model variable used to describe the time that water parcels have spent in the reservoir since entering from inflows and is calculated as a time accumulation at a rate of 1/d for all new water entering the reservoir [55].
We obtained the integrated sample of the epilimnion (0–3 m) with a plankton tube sampler at 3-week intervals at five points across a transversal profile, collecting a total of 45 L of sample.
Chlorophyll a (Chl a) was determined spectrophotometrically after acetone extraction, according to Lorenzen [56]. Bacteria and heterotrophic nanoflagellates (HNF) were formalin-fixed (2%), filtered onto black polycarbonate membranes (0.2 and 1.0 μm pore-sized, respectively), DAPI stained [2], and counted using an epifluorescence microscope (Olympus, Japan; Nikon, Japan). Fresh phytoplankton samples were investigated for species composition and those fixed with acid Lugol iodine were counted in sedimentation chambers (Utermöhl method) using an inverted Olympus microscope equipped with objectives 20× and 40×; in this study, we used only the numbers of minute cryptomonads of the genus Rhodomonas (Rhodomonas pusilla (Bachmann) Javornický 1967 syn. R. minuta Skuja 1948, R. lacustris var. nannoplanctica (Skuja) Javornický syn. Plagioselmis nannoplanctica (Skuja) G.Novarino, I.A.N.Lucas and Morrall 1994, and R. lacustris syn. Plagioselmis lacustris (Pascher and Ruttner) Javornický [57,58] as possible prey of algivorous ciliates [19,59].

2.3. Ciliates

From April 1994 to January 2018, the integrated samples were fixed with acid Lugol’s iodine on the boat; in the laboratory, they were post-fixed with a Bouin’s fixative (to 7%) according to the modified QPS protocol [24,25,26]. Ciliates were harvested by a soft pressure filtration of 5 to 20 mL of the sample onto a mixed cellulose ester membrane filter with a gridded surface (pore size 1.2 μm; Millipore, Cork, Ireland). The filtered volume was decided from the ciliate abundances but during phytoplankton blooms of Staurastrum planctonicum or Fragilaria crotonensis, which limited it.
The concentrated sample was agar mounted and formalin fixed to permit the impregnation at ~60 °C. The processed and thiosulfate-stabilised preparations were passed through ethanol, carbol-xylol (phenol and xylene), and xylene dehydration series to be mounted in neutral Canada balsam [21]. The whole surface of the membranes was inspected using the microscopes equipped for the eventual application of Nomarski (DIC) contrast using oil immersion objectives 40× and 100× (Olympus BH2, Japan or Nikon Eclipse E200, Japan with respective remote-controlled film cameras; Leica DMLB, Germany, with a mounted Canon S-45 digital camera). We repeated the impregnation and counting of the sample to obtain approx. 10% of error in the sum of ciliates. In some cases, however, a single specimen represented the taxon, particularly in the case of large ciliates.
The ciliate biomass was calculated using simple shape models based on dimensions measured in the images taken in the protargol preparations, which were periodically actualised due to their seasonal variation. The cell volume was converted to organic carbon biomass by multiplying it by 0.368 pg C/μm3 [60]. Foissner and Lynn publications [61,62,63] and the keys mentioned therein were used for ciliate identification at the genus level (on some occasions, species were identified). We applied higher taxa classification according to Adl et al. [64].
Even though we obtained data on the taxonomic composition of the ciliate assemblage, we focused the result analysis on the distribution of feeding-behaviour groups of ciliates derived from the classification of Macek et al. [29] presented in Table 1. The large ciliates such as Stentor sp., haptorids (dileptids, lacrymarias), or pelagic colonial peritrichs were quantified, showing acceptable abundance standard deviation. However, their biomass standard deviations could be the same as those of the total assemblage biomass. Thus, we did not use the data in all analyses, as explained below.

2.4. Data Treatment

Almost without any exception, the sampling interval was 21 days, but the sampling week varied during this study. Every year, sampling started between 2 and 13 January, i.e., the shift of sampling Julian day was <11 days, but in 1996 (<17 days), we pooled the data to the scale starting Julian day 6 (median). Graphs were constructed using Microsoft Excel or GraphPad Prism version 10.2.3 for Windows (“Graphing error bars computed from replicates” GraphPad Software, Inc. https://www.graphpad.com/guides/prism/latest/user-guide/graphing-error-bars-computed-f.htm?q=plot+median+and+interquartile, accessed on 1 January 2024) [65].
We followed the findings of Straškrábová et al. [66], who normalised the annual microbial-loop component growth in the reservoir using criteria of Chl a > 5 μg/L, <7 μg/L and <10 μg/L to define the spring phytoplankton peak, clear-water phase, and the end of summer phytoplankton peak, respectively. However, a stratification criterion was applied to normalise the microbial-loop growth, as described above.
The evaluated period was divided into two segments, according to the findings of Kopáček et al. [50], who defined the total phosphorus increasing trend breakpoint in 2004, while nitrogen had already decreased. Throughout the text, we assigned the analysed periods 1994–2003 and 2004–2018 as periods A and B, respectively, and named the calculated period of a stable stratification as “stratification”.
The programme Prism 10 automatic plot of medians with the interquartile range (IQR) based on raw data was applied to construct a representative seasonal curve of the ciliates and limnology variables [66,67]. Non-metric multidimensional scaling (NMDS) with the Bray–Curtis distance measure was used to find a configuration of years in the ordination space, where distances between years correspond to dissimilarity within the explanatory variables or ciliate composition; Canoco 5.15 was used [68]. Analysis of similarity (ANOSIM) provided a non-parametric multivariate test that found potential differences between periods A and B. ANOSIM is based on test statistic R, which compares distances between groups with distances within groups. The Bray–Curtis distance measure was used similarly to NMDS. ANOSIM was computed using PAST 4.17 [69].
A special treatment had to be applied to large-cell but low-abundance species (LCLA) because of their very high biomass interquartile range but having the median value of zero; we excluded them from the analyses of the assemblage behaviour based on the mean values such as multivariate analyses and from the seasonal growth plots (marked as “(corrected)”). Throughout the text, we comment on the differences in the analysis without and incorporating large-species data (Figures S6 and S8–S11).

3. Results

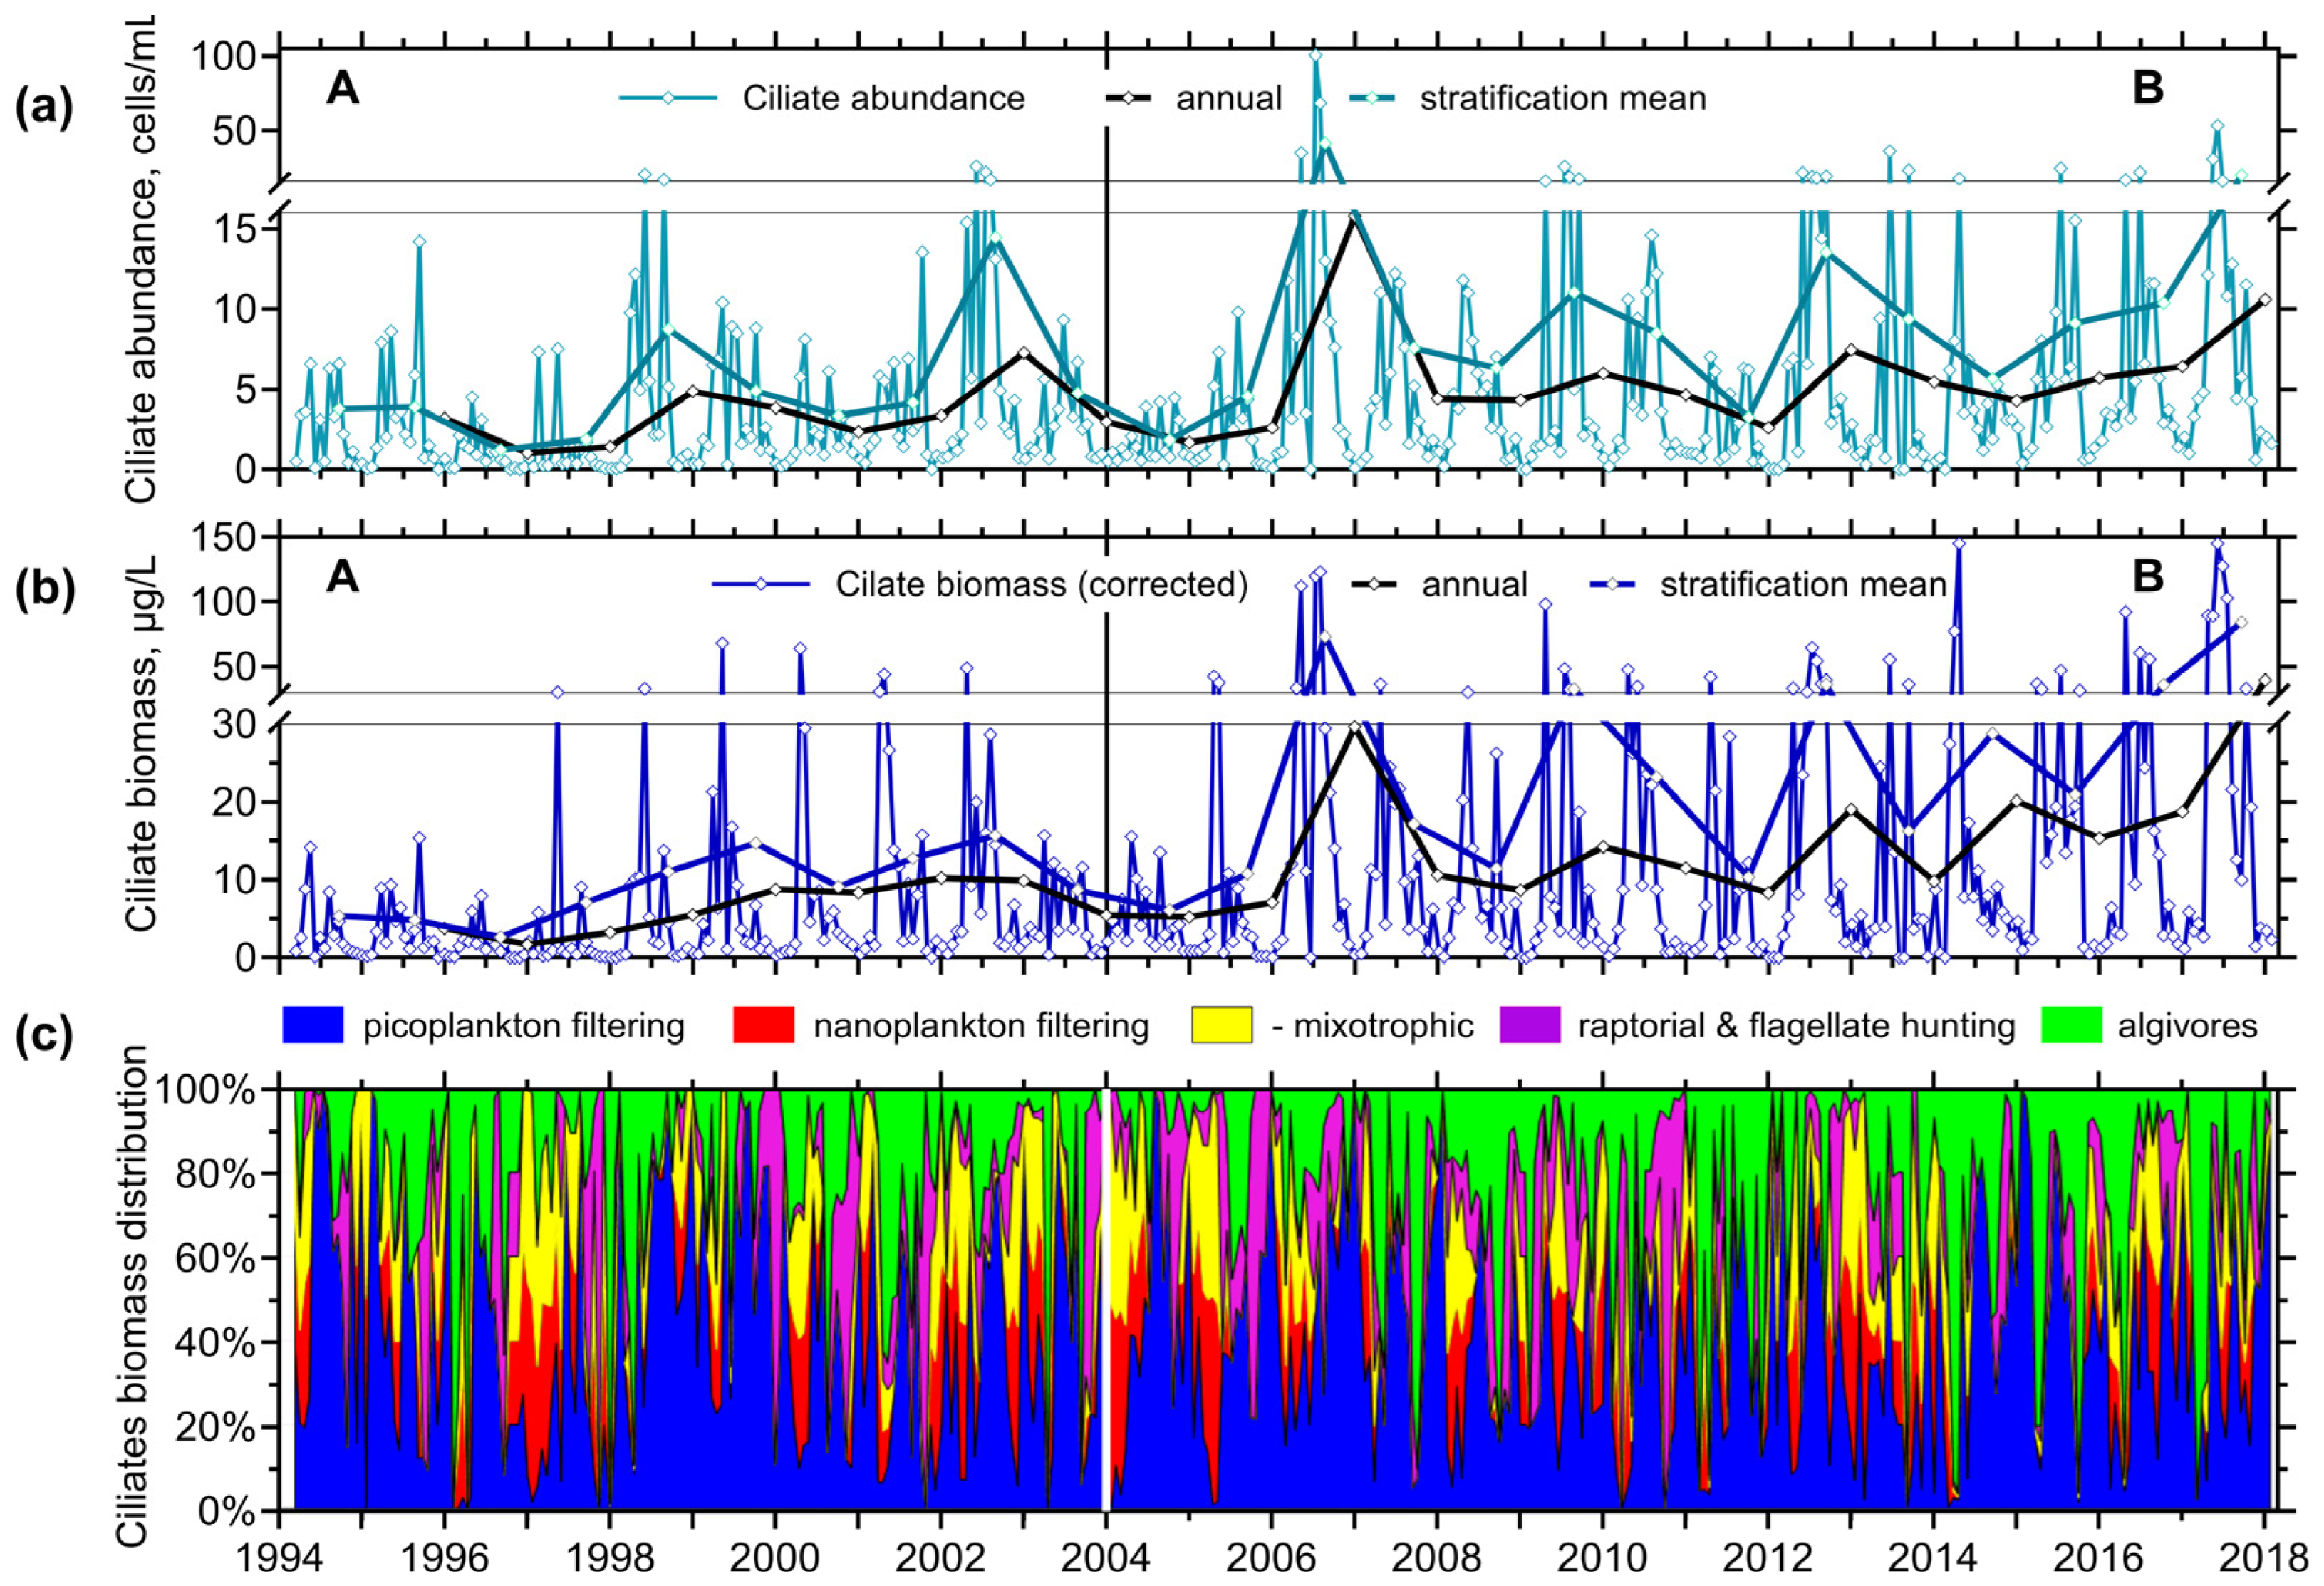
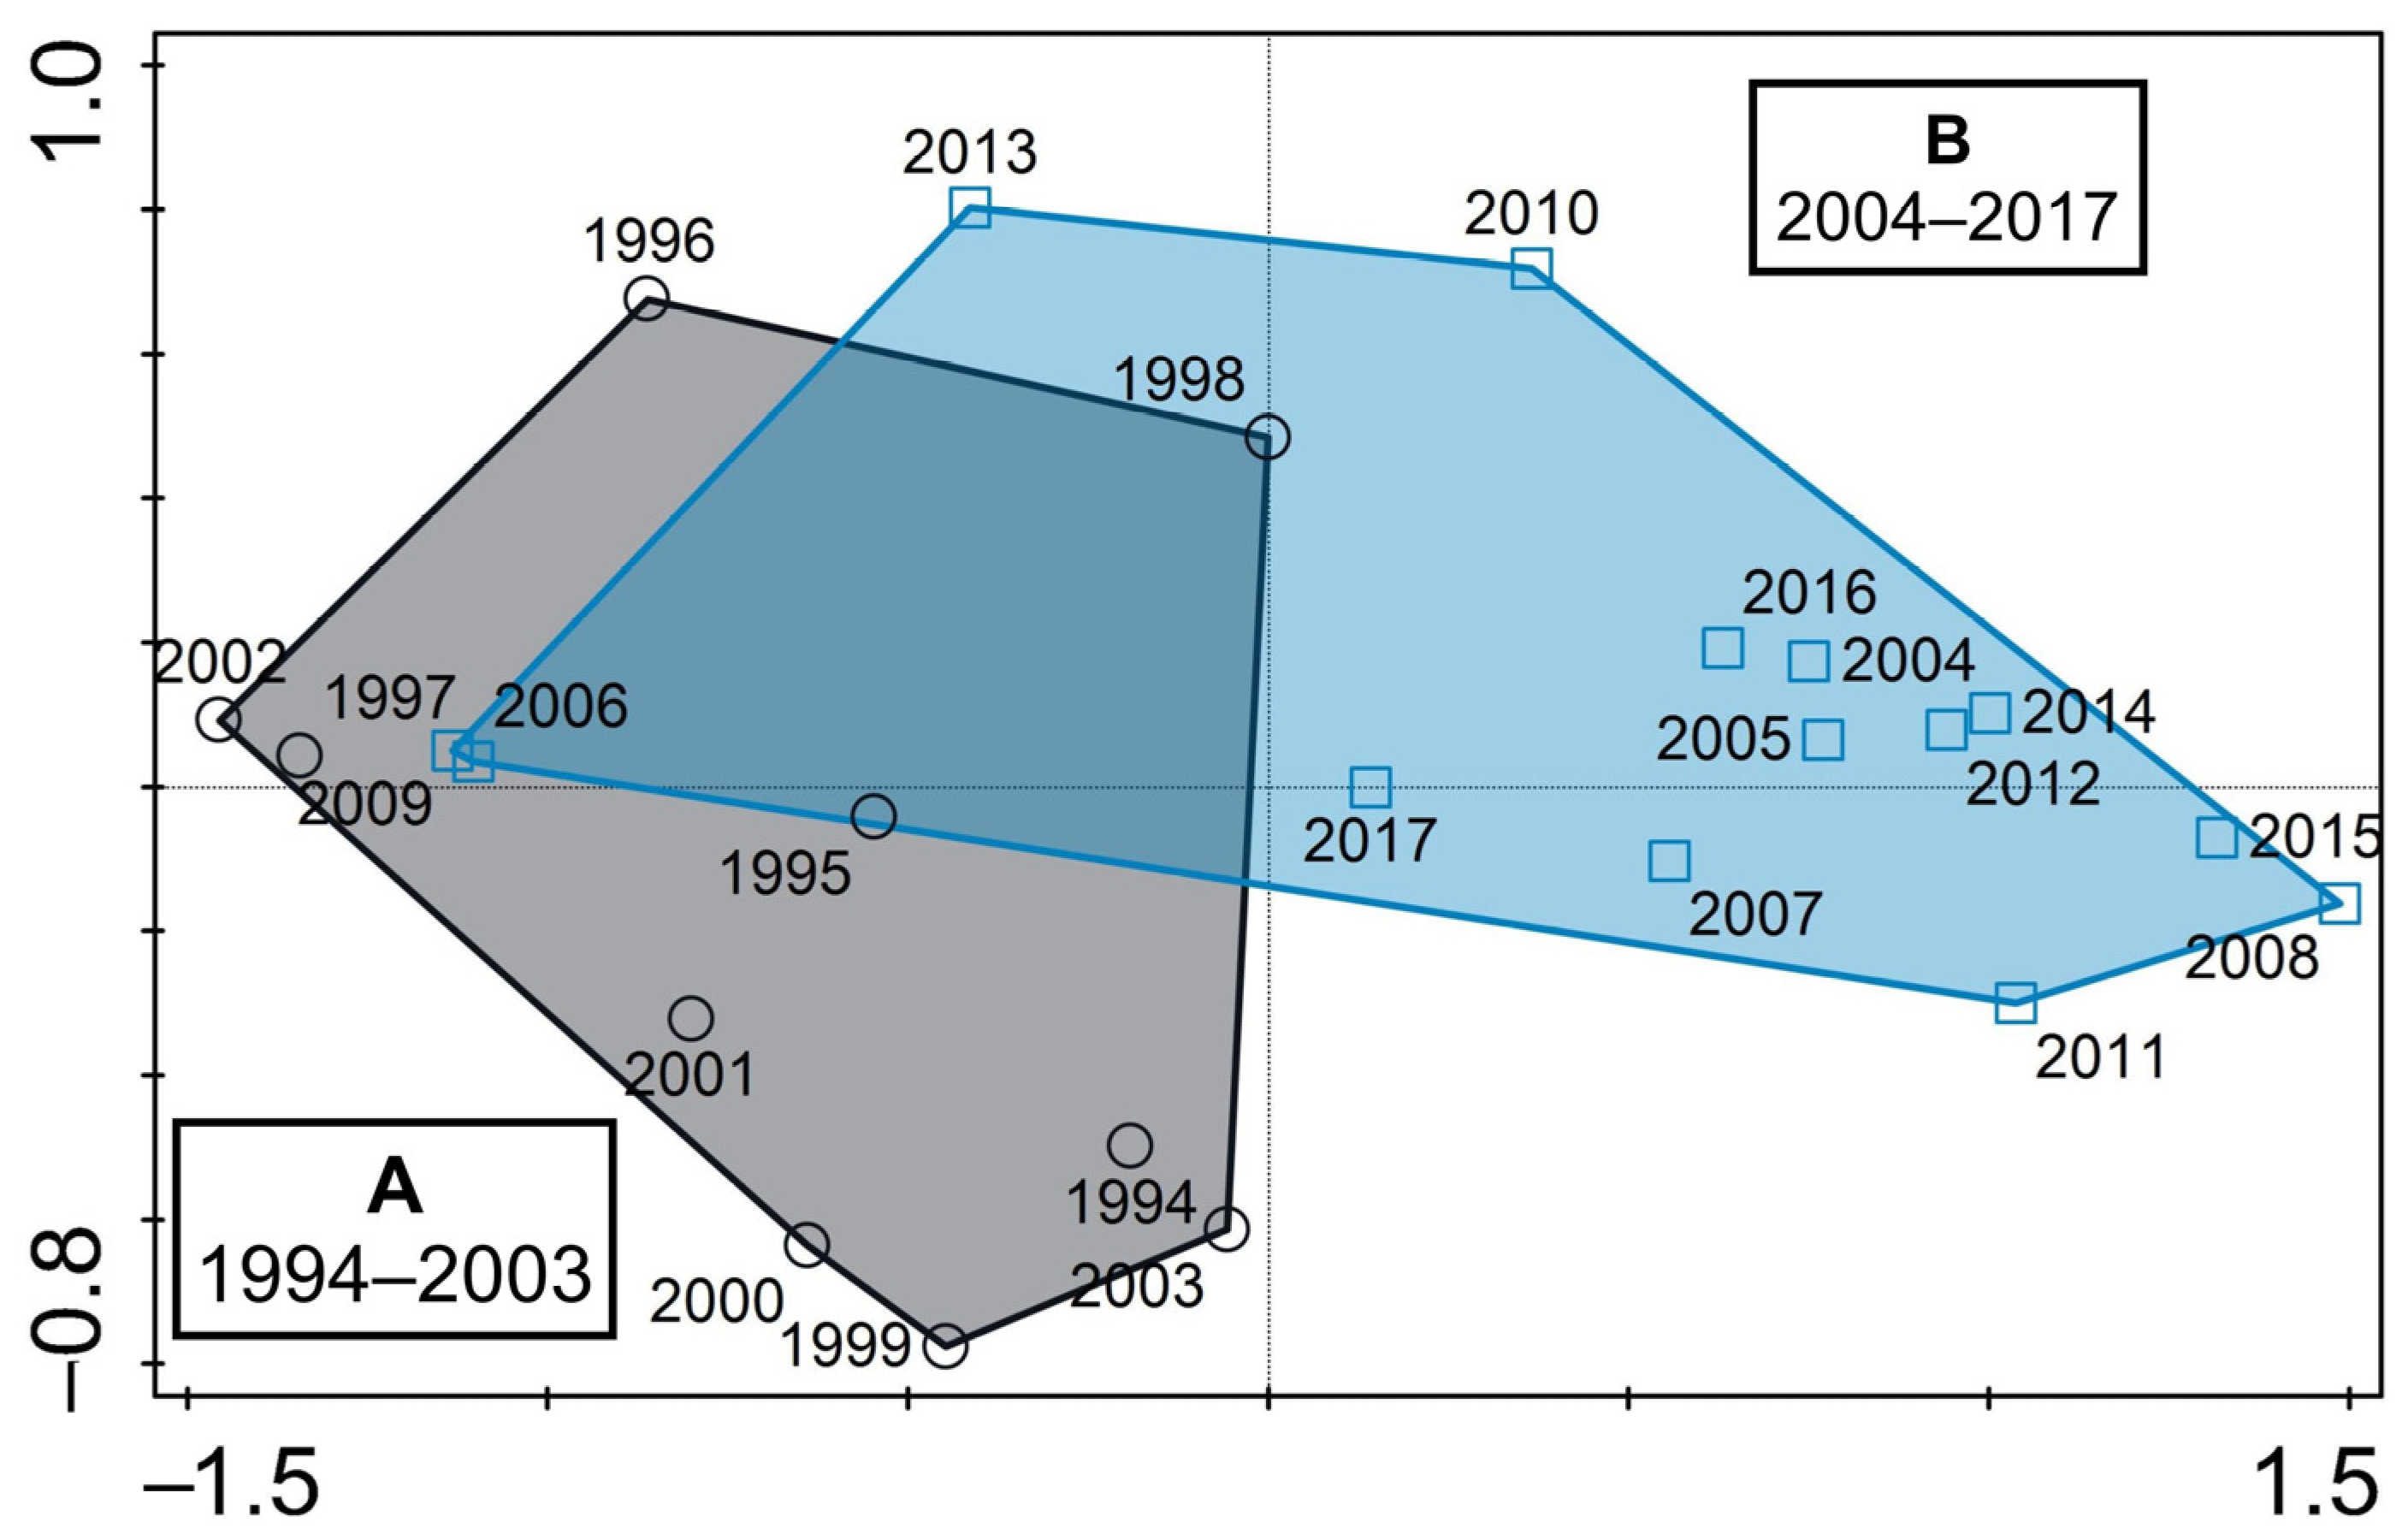
3.1. Long-Term Trends in the Reservoir

3.1.1. Physical–Chemical Variables

The mean annual temperature of the surface layer increased from a minimum of 10.9 °C in 1996 to a maximum of 14.1 °C in 2017 (Figure S5). The stratification period means oscillated about 20 °C with a minimum of 18.5 °C and a maximum of 23.0 °C in 2009 and 2003, respectively. The annual means of dissolved oxygen (DO) were near saturation throughout the entire study period. However, at the start of period A, we registered undersaturation. The stratification period means showed oversaturation, except for some years during period A. During period B, DO slightly dropped.
Total phosphorus (including particles <40 µm) annual means were roughly above and below 50 µg/L during periods A and B, respectively, finishing at 34 µg/L in 2017. The stratification means oscillated around 25 µg/L throughout this study. Dissolved inorganic nitrogen (DIN) annual means were slightly lower than those from stratification, between 2 and 4 mg/L and 1.5 and 3 mg/L, during periods A and B, respectively. However, concentrations remained below 2 mg/L for the last 3 years.

3.1.2. Plankton

To define the ciliate role within the plankton food webs, first, we plotted the Chl a concentrations as a proxy of phytoplankton biomass and possible ciliate prey abundances as follows: minute cryptomonads (Rhodomonas spp.), heterotrophic nanoflagellates (HNF), and bacteria (Figure 1).
An apparent drop in annual means of Chl a concentration (from 20 to 10 μg/L) followed a drop in total phosphorus load starting in 2004 [50]. Local Chl a maxima were observed as spring and summer peaks during April–May and August–September, respectively, surpassing 20 μg/L. During period A, they were frequently between 50 and 100 μg/L; during period B, they decreased below 35 μg/L after 2009. This resulted in the annual- and stratification-mean of 14.5 and 27 μg/L, and 7.0 and 29 μg/L, during periods A and B, respectively. The one-sampling-period clear-water phase was observed shortly after the spring peak of chlorophyll (Figure 1d).
Rhodomonas spp. annual abundances had been close to 1 × 10³ cells/mL during period A but dropped down 0.2 × 10³ cells/mL during period B. They increased again from 2015, reaching 0.6 × 10³ cells/mL in 2017. However, we observed the stratification abundances over 1 × 10³ cells/mL until 2010, dropping down 0.3 × 10³ cells/mL in 2014, before increasing again (Figure 1c).
Annual means of HNF numbers were low (<1 × 10³ cells/mL) until 2000, while from 2001 to 2003, they reached their maximum (up to 2.4 × 10³ cells/mL), then dropped < 1.7 × 10³ cells/mL (except for 2012 and 2013 with >1.8 × 10³ cells/mL) again. If their annual mean numbers were higher than the mean, it was due to a broader period of their peaking either during spring or summer/autumn (Figure 1c).
Bacteria varied with no apparent trend. A maximum of 5.2 × 10⁶ was observed in 2009, but then bacteria varied again within a 3 to 4 × 10⁶ cells/mL interval (Figure 1a).
Ciliate numbers and biomass were lower before 2004 (Figure 2); the annual maxima were reached in 2006 (15.8 cells/mL and 29.6 μg/L, respectively). Increasing peaks of ciliate biomass were observed towards 2018 (40 μg/L). Annual ciliate maxima fell typically to April–May, though they remained longer since 2006. Such longer-observed elevated abundances and biomass of ciliates reflected the increasing mean values in the stratification. We did not register an additional summer peak every year.
The picoplankton-filtering (halteriids and minute strobilidiids, scuticociliates and small non-colonial peritrichs) and algae hunting ciliates (prostomes, Histiobalantium spp.) were alternatively biomass dominating during the warmer stratification, and the winter and mixing period, respectively. If we sum both heterotrophs (mainly tintinnids) and mixotrophs (mainly pelagostrombidiids), nanoplankton-filtering ciliates frequently dominated the assemblage biomass at the end of the spring peak of chlorophyll. Among raptorial/flagellate-hunting ciliates, Askenasia, and related genera, both heterotrophic and mixotrophic, and Mesodinium spp., were the most frequent.
In the plot of the ciliate assemblage abundance and biomass (Figure S6), including LCLA and colony-forming species, we can see a higher variation in the biomass and its trend to increase. Among the feeding-behaviour groups, raptorial species (e.g., Pelagodileptus sp., Lacrymaria sp., large Monodinium sp.) became biomass dominating, and a share of nanoplankton-filtering heterotrophs increased (Stentor sp.).

3.2. Seasonality

We characterised the study years using a non-metric multidimensional scaling (NMDS) based on explanatory variables composed of temperature, concentrations of dissolved oxygen, total phosphorus (with particles < 40 µm), DIN, water age, Chl a, and abundances of ciliate prey bacteria, HNF and Rhodomonas spp. (Figure 3). We did not include around-the-year sampling data in the graph, but those covering two principal ciliate peaks as follows: from spring phytoplankton peak related, i.e., two sampling dates before the event of stratification, to the end-of-summer phytoplankton peak with two ciliate local maxima, i.e., to the end of stratification). According to the analysis, the years from periods A and B form well-defined clusters with only minor overlapping (Figure 3). ANOSIM analysis has proven significant differences based on explanatory variables (R = 0.51, p < 0.001). Thus, data from periods A and B were analysed separately in the following text.

3.2.1. Physical–Chemical Variables

Plots of the annual cycles reveal their periodicity with the peaks tightly related to the calculated stratification limits (Figure S7). During period A (1994–2003), stratification started in May without significant variation (median 5 May, interquartile range 7 May to 11) and finished after 6 weeks (median 13 September, interquartile range 29 August to 28 September). During period B, stratification came earlier (median 7 May, interquartile range 23 April to 8 May), but it ended every time in September (median 13 September, interquartile range 8 September to 16).
The temperature (Figure S7e,f) quickly rose just before stratification, where the climax of about 21 °C was reached, dropping gradually from its end. The annual minimum temperature occurred in February (<3 °C). DO was usually oversaturated in the epilimnion and reached its maximum at the start of stratification (Figure S7e,f). DO only dropped to <5 mg/L during October–November.
A hydrodynamic model shows the stability of the sampled 3 m surface layer since the water age during stratification reached 80 days there (Figure S7c,d). In contrast, in the layers below 4 m, it surpassed only 40 days or approached it in periods A and B, respectively. Mixing of the surface with deeper layers occurred frequently after the stratification period, even during winter.
Annual/seasonal nutrient dynamics were related to the mixing–stratification, but their concentrations decreased in period B (Figure S7a,b). We observed the maximum DIN following the start of stratification, which gradually declined. However, TP (including the seston < 40 μm) was the highest during mixing, steeply dropped just before stratification and the lowest during it (for more details, see [50]).

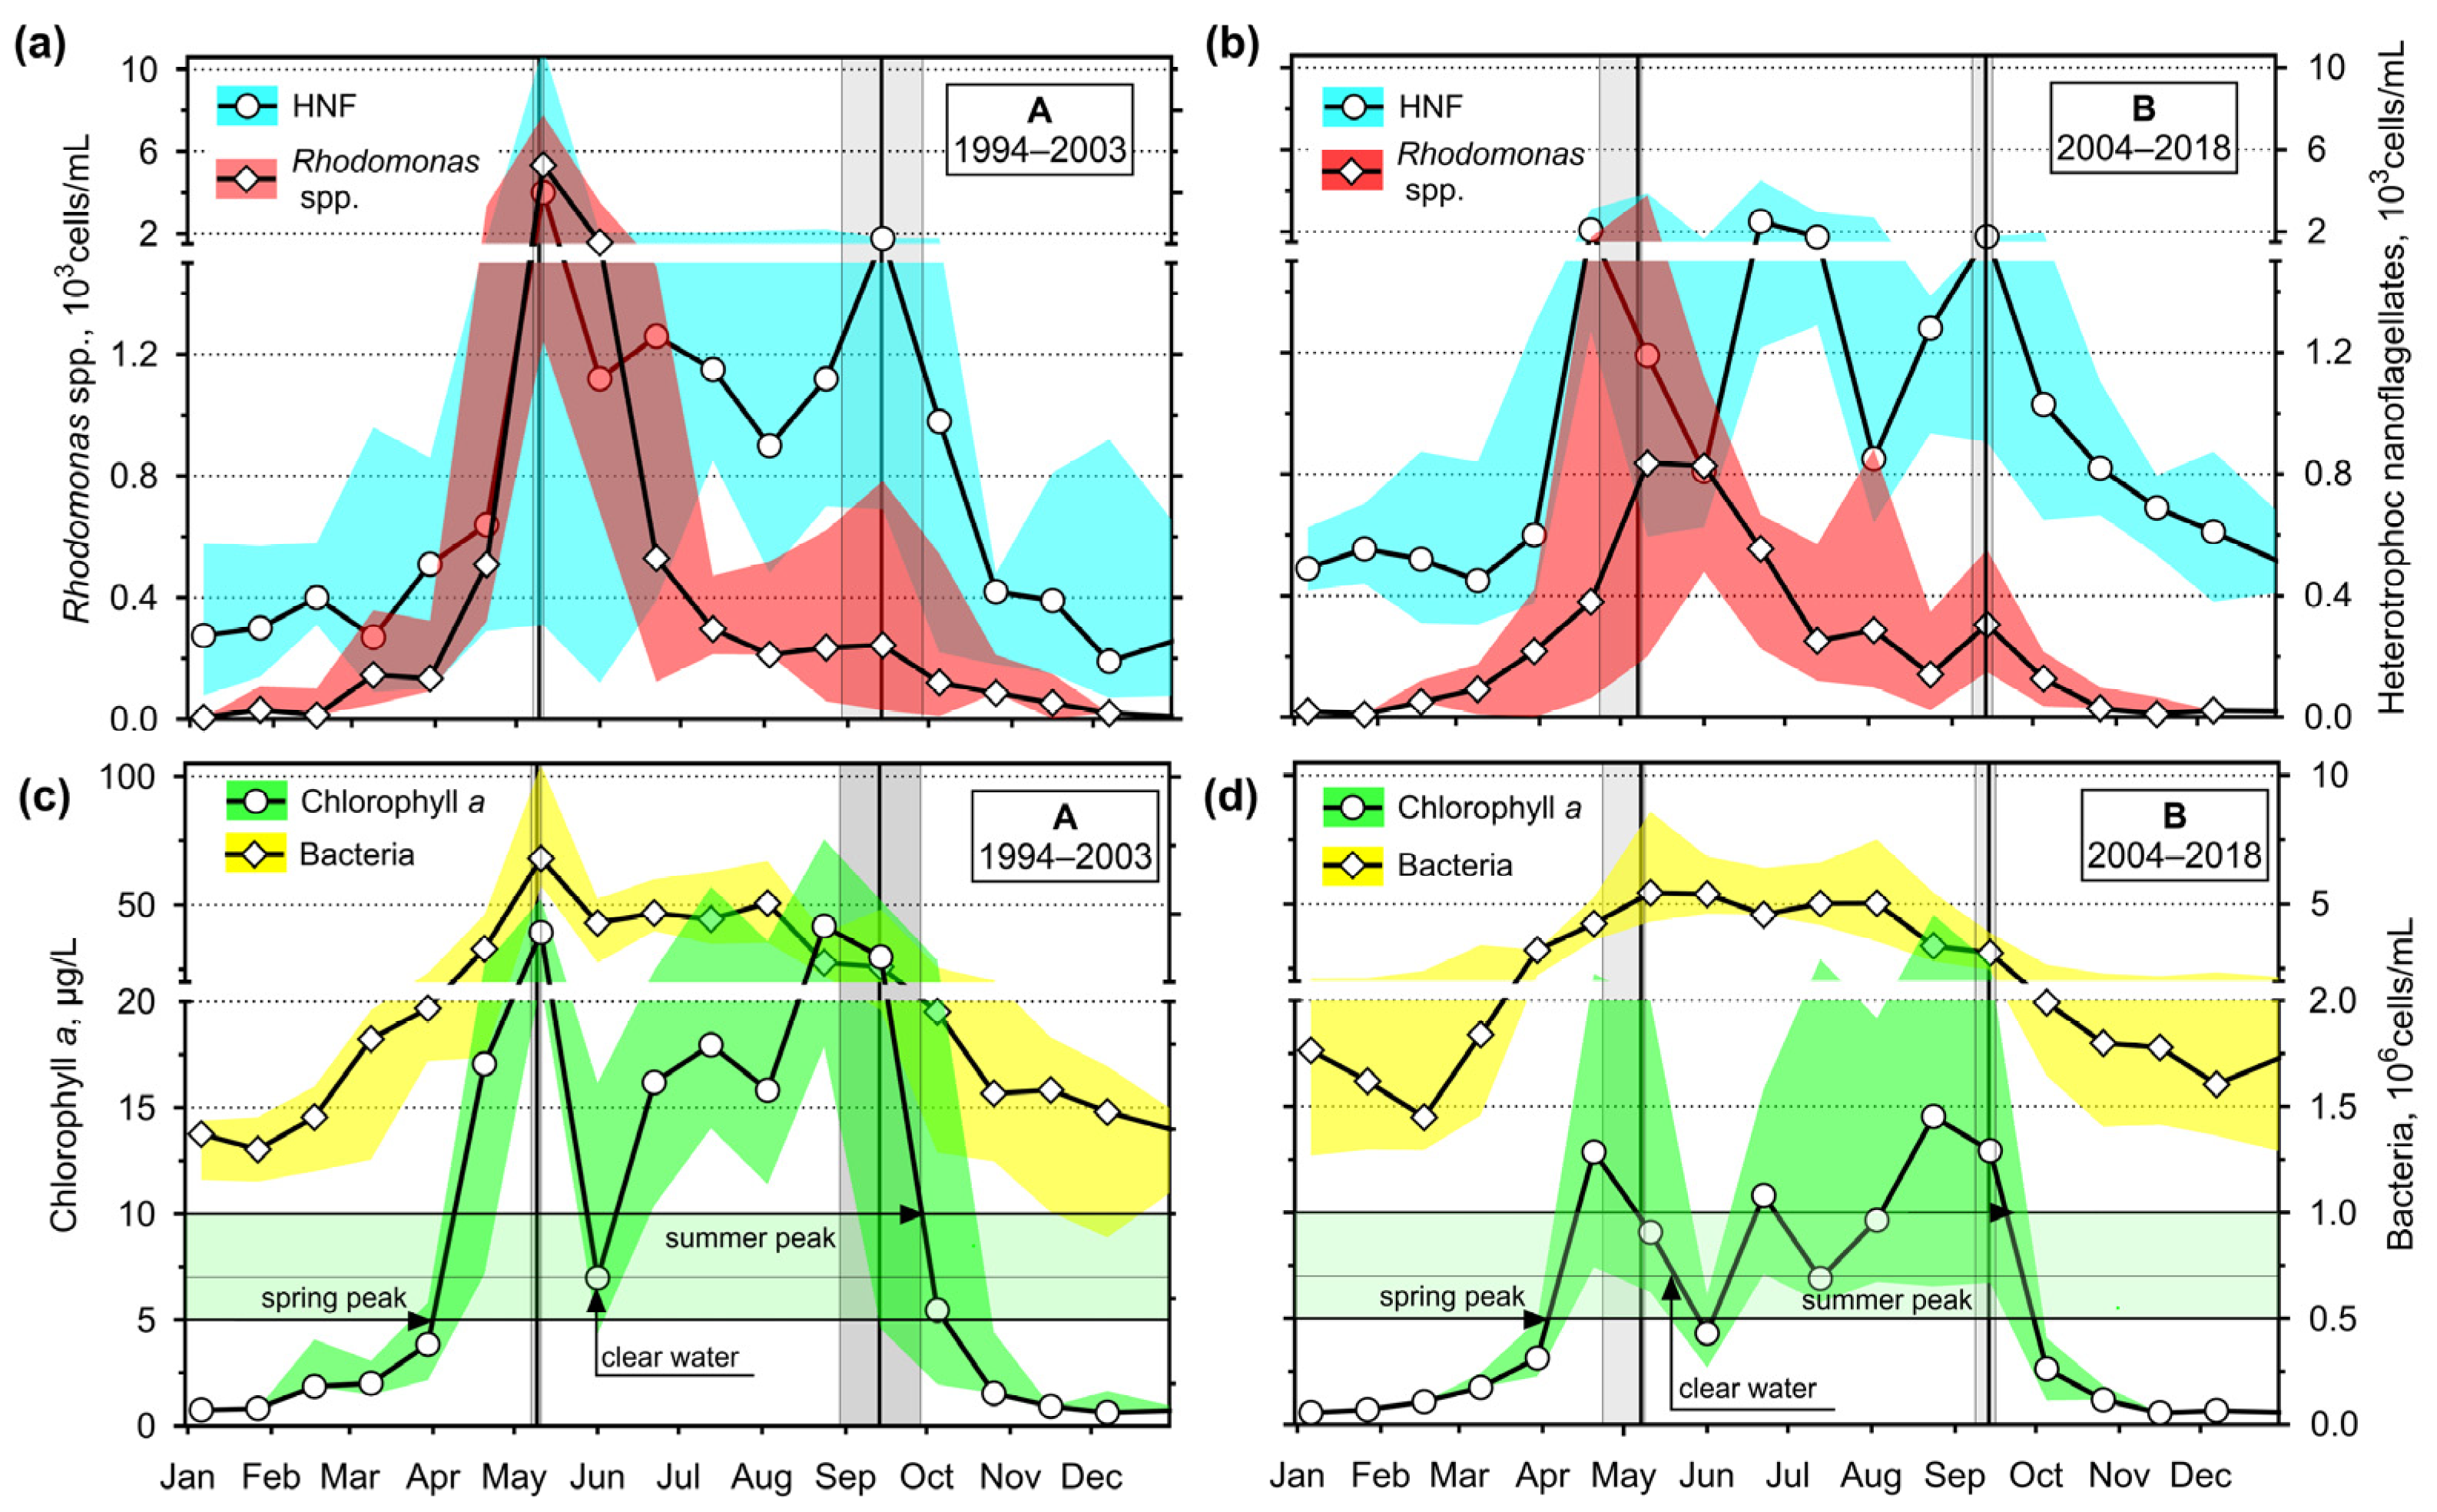
3.2.2. Chlorophyll a, Bacteria, Rhodomonas spp., and Heterotrophic Nanoflagellates

We confirmed two Chl a maxima (Figure 4c,d). Considering the criteria used by Straškrábová et al. [66], the spring phytoplankton peak lasted from the first week of April to the end or the middle of May during periods A and B, respectively, with the maximum median values of 39 μg/L (early May of A) and 12.9 μg/L (late April of B). The clear-water phase did not last more than one sampling period (3 weeks). We observed the summer phytoplankton peak from June, culminating in August, nearly as high as the spring one during both periods (42 and 14.5 μg/L, respectively). While the peak was well pronounced in period A, a percentual variation of Chl a during period B was broader, and the median of the peak was insignificant. However, Chl a always dropped below 5 μg/L after stratification towards October.
We observed a pronounced peak of bacteria (7 × 10⁶ cells/mL) only during period A (Figure 4c,d). During both periods, bacteria maintained a constant abundance (≈5 × 10⁶ cells/mL) throughout stratification.
Rhodomonas spp. (Figure 4a,b) were peaking in spring around the peak of Chl a (4.5 × 10³ cells/mL and 0.8 × 10³ cells/mL during A and B, respectively). During both periods, Rhodomonas spp. dropped during stratification and have been observed in their median abundances from 0.5 × 10³ cells/mL even during the summer Chl a peak.
HNF (Figure 4a,b) reached their maxima with or after those of Rhodomonas spp. in late May (4 × 10³ cells/mL and 2 × 10³ cells/mL during A and B, respectively). On the other hand, they also accompanied the summer Chl a peak (1.8 × 10³ cells/mL), and during period B, another peak of 2.5 × 10³ cells/mL appeared during stratification.

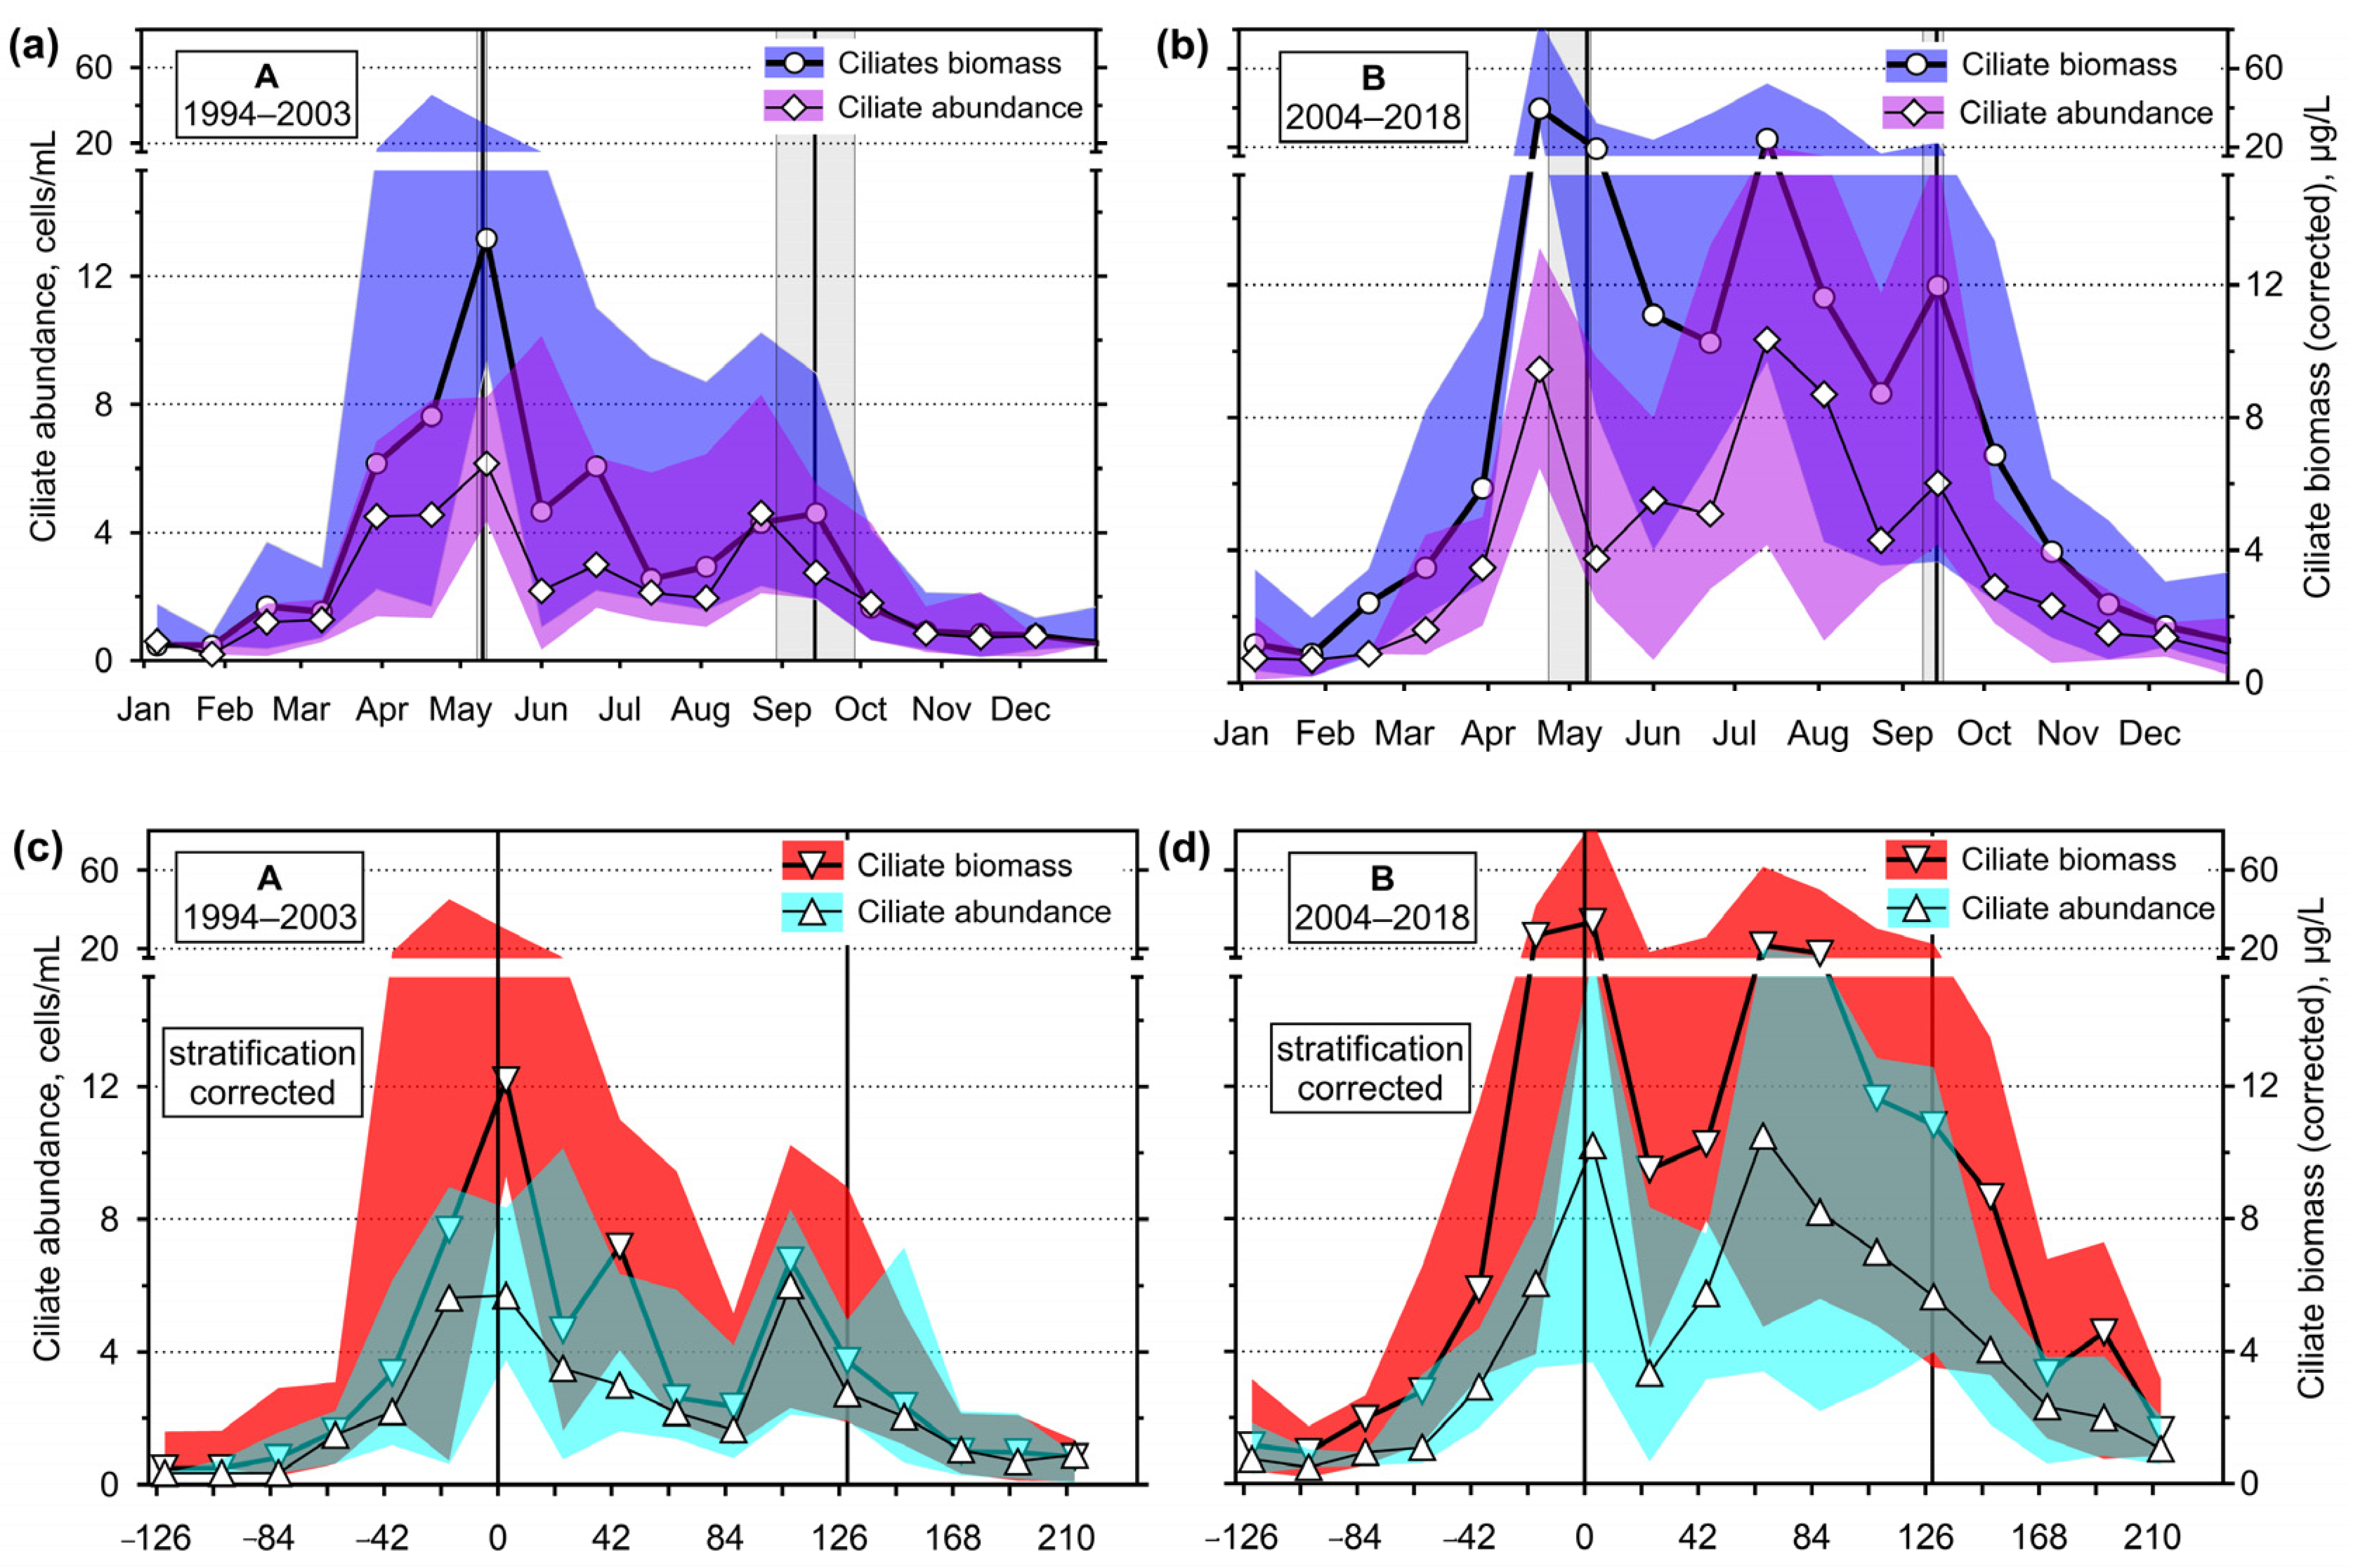
3.2.3. Ciliates’ Assemblage Abundance and Biomass

Analysing the ciliates, first, we plotted medians of the ciliate biomass (corrected, i.e., without large-cell but low-abundance species) and abundances (without correction) throughout the studied periods (Figure 5a,b). The ciliate maximum peak median was observed in the spring about the breakpoint of water column stratification in both periods. Ciliates occurred in abundances of 6.1 and 9.4 cells/mL and biomasses of 13.2 and 39.4 μg/L during periods A and B, respectively. However, the following trend in abundance and biomass was different. A small abundance peak was observed before the end of the stratification period A (4.6 cells/mL) and a biomass peak at the end (4.6 μg/L). During stratification B, the interquartile range upper limit was as high as the spring peak, reaching a pronounced peak in the middle of stratification (10.4 cells/mL and 24.0 μg/L) and another small peak at the end (16.0 cells/mL and 12.0 μg/L).
Since the interval of dates when stratification used to start was more comprehensive for period B and the ciliate maximum values lasted longer, we tried to normalise the data using the every-year stratification first sampling as a referential “0“ (Figure 5c,d).
The sharp annual maximum was observed at the start of stratification in May or late April, and the biomass dropped during the clear-water phase. The ciliate biomass development trend was smoother before the end of stratification.
We do not observe significant changes even in the ciliates’ IQR if we plot the data, including LCLA (Figure S8) and the medians during period A. During period B, the total ciliate biomass did not show a drop, which coincided with the clear-water phase. However, after the event, the stratification corrected plot was better defined, and after the following biomass increase, biomass decreased towards the reservoir mixing.
Analysing both data sets, the transformation could have offered better data interpretation. However, we did not correct plots of the total ciliates and the feeding-behaviour groups’ annual cycles in such a way.
The thermal stratification and limnological variables derived from it controlled the ciliate biomass growth (Figure 6). Apart from mixing the reservoir at temperatures between 5 and 10 °C, we have found maximum biomasses during stratification. Significant ciliate biomasses were not observed in the oxygen-undersaturated layer.

3.2.4. Annual Changes in the Ciliate Feeding-Behaviour Groups

The most biomass-important ciliates in the surface layer of the Slapy reservoir were those of nanoplankton filtering behaviour (traditionally called coarse filter feeders), reaching the median of carbon biomass > 10 μg/L (Figure 7 and Figures S1 and S9c,d). Among them, mixotrophic nanoplankton-filtering (MN) ciliate genera such as Limnostrombidium and Pelagostrombidium (Pelagostrombidiidae), accompanied sometimes by Rimostrombidium velox (Strobilidiidae), dominated the start of stratification. During period A, their biomass rapidly dropped down, but during period B stratification and at its end (>2 μg/L), we registered other biomass peaks (>10 μg/L and >2 μg/L, respectively). The following Heterotrophic nanoplankton feeders (HN) were less important but frequently observed: Tintinnidium spp., Tintinnopsis spp. and Codonella cratera (Tintinniidae), and Rimostrombidium lacustris (Strobiliidae). However, tintinnids were responsible for the peak of the ciliate group preceding stratification.
During both periods, we observed large filtering Stentor sp. (Stentoridae) periodically in the spring phytoplankton bloom (about April) and/or during stratification (from June to August). However, its median abundance was zero. When we included Stentor sp. data (Figure S9c,d), an additional local peak appeared in the middle of stratification during period B.
The second most important ciliate group were the minute picoplankton-filtering (PF), omnivorous (bacteria, picocyanobacteria, picoeukaryotes) ciliates (Figure 8 and Figures S2 and S9a,b); they peaked at the end of mixing or the start of stratification (median biomass > 4 μg/L). Among them, Halteria grandinella and a mixotrophic Pelagohalteria viridis (Halteriidae), Rimostrombidium brachykinetum, R. humile and other similar species, some of them with kleptoplasts (Strobilidiidae), and Vorticella aqua-dulcis complex, Vorticella spp., and Pseudohaplocaulus sp. (Peritrichidae) were the most important.
Halteriids and strobilidiids followed the whole group dynamics before and during stratification, reaching the median biomass > 1.5 μg/L (Figure 8). The maximum of peritrichs was lower (>1 μg/L), but the IQR was more variable. They peaked just before or during stratification during both studied periods. Almost all found species were attached, but we also found free-swimming peritrichs (e.g., Vorticella mayeri, Hastatella sp., Astylozoon sp.) and de-attached ectobionts Trichodina cf. diaptomi.
Pelagic colonial Epistylis spp. were the most common during stratification. Their large colonies were never observed intact, and their segments observed in QPS preparations varied in size and number in repeatedly processed preparations. However, including Epistylis spp. data to the ciliate biomass plot (Figure S9a,b) did not change the median.
Minute picoplankton-feeding scuticociliates formed the third component of picoplanktivorous ciliates (not shown). The genus Cyclidium, mostly C. glaucoma (Cyclidiidae) and Cinetochilum margaritaceum (Cinetochilidae), were the most frequent. We found them repeatedly, even in high abundance, but their biomass median was near zero. On the other hand, their presence increased the ciliate group biomass median at the end of stratification.
Phytoplankton non-filtering ciliates (algae hunting, AH) formed the third most important group (Figure 9 and Figures S3 and S9g,h), reaching a median maximum just before the spring phytoplankton peak, i.e., before stratification (2.4 and 10.8 μg/L during periods A and B, respectively); higher biomass (about 1.5 μg/L) was observed during stratification in period B.
Minute Urotricha sp. with one caudal cilium resembling U. agilis, two caudal cilia U. furcata or U. pseudofurcata, and multiple-caudal cilia U. castalia or U. pelagica (Urotrichidae) were distinguished. The position of Balanion planctonicum (Balanionidae) was uncertain using a median attempt: the ciliate repeatedly reached very high abundances, which was apparent in the group’s total biomass but not in the ciliate median biomass value. A similar data behaviour was observed for the scuticociliates Histiobalantium spp. (Histiobalantiidae), which were not so numerous but of high individual cell biomass while giving a zero median value during period A (i.e., more than 50% of data were zero; not shown in the graph). In the spring chlorophyll peak of period B, the ciliate median was 0.5 μg/L, increasing the total algae hunting ciliates’ biomass during the autumn column mixing (October). Diatom-feeding ciliates Phascolodon vorticella and Trithigmostoma spp. were scarcely observed, too. The total group biomass did not change the observed dynamics, including a LCLA genus Holophrya (Holophryidae) found with ingested algae (Figure S9g,h). At the same time, we included Coleps spp., which were sometimes mixotrophic, within raptorial species.
Raptorial or flagellate-hunting ciliates (RH) reached the lowest biomass among the analysed feeding-behaviour ciliate groups (Figure 10 and Figures S4 and S9e,f), particularly during period A. However, during period B, they presented a constant biomass of about 1 μg/L from March to December.
The genus Askenasia (incertae sedis, CON-threeP) was one of the most important among raptorial ciliates. We observed frequently minute Askenasia spp., the species resembling A. acrostomia, Askenasia volvox, and a mixotrophic A. chlorelligera, to which different cell biomasses were assigned. Rhabdoaskenasia spp. were included, as the species-typical extrusomes were not well recognised during a routine examination of the preparations. During period A, they were unimportant except for the end of stratification and the following autumn mixing. However, during period B, they dominated during the formation and the end of stratification. A minute Mesodinium spp. (incertae sedis, SAL) was very important during the autumn mixing in the A and B periods, though its cell-biomass was very low.
Among other raptorial species were notable Lagynophrya spp. (Trachelophyllidae), both heterotrophic and mixotrophic, Enchelys spp. (Enchelyidae), a minute Monodinium spp. (Didinidae), and Pelagolacrymaria sp. (Lacrymariidae). However, they were observed in much less than 50% of samples.
Among LCLA predatory species excluded from the corrected biomass plot, the most important were dileptids (mostly resembling Pelagodileptus sp., Dileptidae) and a large mixotrophic Monodinium sp. (Didiniidae); they used to appear typically by June. The scarcest but repeatedly observed large ciliate was Lacrymaria sp. (Lacrymariidae) during the spring phytoplankton peak (April). Adding them to the plot of the biomass (Figure S9e,f), the total protist-hunting ciliates’ biomass increased substantially since the spring phytoplankton peak.

3.3. Predator–Prey Relation and the Importance of Different Feeding-Behaviour Patterns within Ciliates

To characterise the study years based on the ciliate assemblage composition, we applied a non-metric multidimensional scaling (NMDS). As explained above, we did not include around-the-year sampling data in the graph but only data from the periods including two principal annual ciliate peaks: before-spring chlorophyll maximum peak and a late summer peak; only a possible winter (February–March) B. planctonicum and autumn (November) Mesodinium spp. maxima were excluded. However, the same procedure with the ciliate data gave a less pronounced grouping than that based on explanatory variables (compare, Figure 3 and Figure 11a,b). ANOSIM analysis supported the clustering and revealed significant differences between periods A and B based on the ciliate functional groups (R = 0.29, p < 0.01).
According to vector directions, the total ciliate biomass was driven in a similar direction as that of total picoplankton-filtering species. Mixotrophic filter-feeding ciliates showed the shortest vector during period A. During period B, AH ciliates were driven in the same direction as MN ciliates, while HN showed a contrasting direction. PF and RH showed a trend similar to the ciliate assemblage biomass (corrected biomass, without LCLA species).
The difference between periods A and B was striking when we analysed the assemblage composition from the view of heterotrophy and mixotrophy (Figure 12), summing species with zoochlorellae or kleptoplasts. During A, a maximum of mixotrophs occurred at the beginning of stratification (4.46 μg/L) but dropped quickly and significantly below the heterotrophic biomass. On the other hand, during period B, heterotrophs reached their maximum during a spring phytoplankton peak (30.6 μg/L). However, mixotrophs were of the same or even higher biomass throughout stratification (maximum of 15.5 μg/L compared to heterotrophs of 8.1 μg/L), illustrating the dynamic shifts in the ciliate populations between these periods. Adding LCLA to the analysis (Figure S10) moved the biomass medians towards higher heterotrophic biomass, but the change was not essential.
We graphically combined the concluding results of the annual growth of ciliate feeding-behaviour groups (Figure 13 and Figure S11). PF ciliates (mainly halteriids, strobilidiids, peritrichs and less important minute scuticociliates) were the most biomass-important from the end of mixing through the end of stratification or throughout the year in periods A and B, respectively. Nanoplankton-filtering heterotrophs’ peak (of tintinnids, Rimostrombidium lacustris) occurred before or about the stable stratification during periods A and B, respectively. Filtering mixotrophs were the most abundant during stratification.
A maximum of AH occurred during a spring phytoplankton peak before the stratification event when mostly urotrichs dominated. Sometimes, a year maximum of B. planctonicum was observed in winter/spring or towards the end of stratification, and that of Histiobalantium spp. However, before stratification and during the autumn mixing, the species’ medians were near zero.
Flagellate-hunting Mesodinium spp. were the only ciliates peaking during autumn mixing. Other RH (mainly of genera Askenasia, Rhabdoaskenasia, Lagynophrya, Enchelys, and minute Monodinium) were essential during the spring peak of phytoplankton and then during stratification, reaching another maximum at the end of it.
When the total ciliate assemblage biomasses including LCLA (Figure S12) were applied, the median of picoplankton-filtering ciliates (including colonial peritrichs such as genus Epistylis) did not vary. However, Stentor sp. changed the median value of nanoplankton heterotrophic feeders before a spring phytoplankton peak during period A, while in B, another peak appeared during stratification. Genera Holophrya or Prorodon did not affect the biomass of algae hunting species. We observed the highest (and statistically non-significant) biomass changes of raptorial and flagellate-hunting ciliates caused by dileptids and lacrymarias.

4. Discussion

4.1. Hydrodynamics of the Surface Layer and a Legacy of Defined Periods A and B

Three-metre samples mostly covered the entire epilimnion and did not penetrate to the metalimnion during stratification of the Slapy reservoir. The same monitoring approach has persisted over the last few decades, focusing on the surface or epilimnion layer despite variations in water bodies worldwide (recently, e.g., [36]). Notably, this method is not universal, particularly in water bodies with shallow epilimnion that do not align perfectly with the euphotic zone. On the other hand, such an approach allowed us to compare long-term trends within the given water layer.
Compared to larger lakes with abundant ciliate data [18,27,28,31,38], the sampled layer depth is shallow in the Slapy reservoir. However, hydrodynamic studies have proven its separation from deeper layers and homogeneity of the epilimnion during stratification periods (Figures S5e and S7c,d). The water age gradually increased until the end of stratification, reaching about 80 days, compared to a maximum of 40 days in the layer below 4 m, like the whole reservoir mean retention time < 40 days (compare, [48,49,51]). The difference in water ages in the layers was more pronounced in period B. Resulting layer separation also means a physical separation of the layers’ ciliate assemblages, which may be completely independent of the metalimnetic processes. We could compare our data with those obtained in the surface layers of shallow but stratified lakes or lakes with shallow epilimnion. In another studied case, the Římov reservoir ciliates’ assemblage composition and activity in the epilimnion were also independent of a separated layer, which the river incorporated [34,70,71].
The general challenge in biological monitoring arises from shifts in a water body’s hydrodynamics and related biological processes, prompting us to employ different analytical approaches due to variations in the onset of stratification. While attempts were made to normalise sampling timing, the resulting projections did not substantially alter the observed curves (Figure 4). In period A, the ciliates presented two pronounced biomass peaks during stratification; a summer phytoplankton peak at the end moved backwards, and the abundance and biomass peaks coincided. During B, the stratification intermediate biomass peak lasted longer but decreased towards the culmination of a summer Chl a peak, which was two-fold lower (Figure 1). Differences might influence the observed changes towards the end of stratification in stratification duration (number of samplings during it). Thus, we did not apply such normalisation to the ciliate feeding-behaviour groups.
Gaedke and Wickham [19] normalised the processes related to a spring peak using the position of the clear-water phase. However, if the Slapy reservoir were sampled once every 3 weeks, we would have only one clear-water sampling. We partly applied the attempt of Straškrábová et al. [66], who normalised timing based on the Chl a concentration marked in the graphs (Figure 3). We found such a helpful criterion for the “ciliate season” covering principle ciliate peaks. The spring phytoplankton peak was put at Chl a > 5 μg/L, i.e., two sampling dates before the event of stratification; clear water was defined by Chl a < 7 μg/L, and the end of summer phytoplankton peak by Chl a < 10 μg/L, i.e., the end of stratification. It covered algae hunting and nanoplankton-feeding ciliate spring peaks and summer ciliate maxima. For example, only the autumn mixing/winter maximum of Mesodinium spp. was excluded from the analysis.
We applied the Chl a criterion to characterise the study years using a non-metric multidimensional scaling (NMDS) based on explanatory variables (T, DO, total phosphorus (with particles < 40 µm), DIN, water age, chlorophyll a, and abundances of bacteria, HNF and Rhodomonas spp.) (Figure 10a). The years from periods A and B form distinct clusters with several exceptions. During period A, the unusual year 1998 presented significant drops in DIN (Figure S5), Chl a, and HNF abundance, but bacteria abundance reached the highest value (Figure 1). Contrary to this, 2006 and 2009 were of the highest DIN, Chl a, and HNF abundance (Figure 1 and Figure S5) during period B, where periodical floods were larger. According to Jeppesen et al. [72], nitrogen has recently become a limited nutrient in various water bodies, sometimes surpassing the limitation of phosphorus. Though a different hydrodynamic separation in periods A and B was proven, chosen through a phosphorus load drop before 2004 [49,50,53], nitrogen limitation is another factor probably controlling the whole plankton growth, including ciliates.

4.2. Environmental Ciliates’ Identification

Throughout the years, one of the critical problems in the quantitative investigations of natural ciliate populations has been the use of fixatives, which altered the results, and the Utermöhl method limited the use of more powerful objectives. In routine monitoring work, formalin-fixed samples underestimate several ciliate taxa; better results are obtained using Lugol’s fixation and postfixation with formalin after decolouration with thiosulphate and DAPI staining [10,15,20,21,22,23]. QPS has solved many of these problems, and according to our literature-supported knowledge, the mentioned direct application of concentrated Bouin’s fluid after Lugol’s iodine gives the optimum results [24,25,26,60,73]; the ciliates remained intact for a long, undefined time. Another possible problem relates to changes in who analysed the preparations; in our study, all the samples were analysed by the same person. However, there are discrepancies between the taxonomists and the specialists on the environmental ciliates’ investigation [62] because of, e.g., a necessity of using less-toxic or degradable fixatives on the boat (such as Lugol) instead of the direct Bouin fixation.
The taxonomy of planktonic ciliates has changed during this study, partly due to QPS application, and the ciliate taxa frequently published from plankton in the nineties “disappeared”, being replaced by other names, sometimes based on an identification priority. In our work, this is the case of urotrichs, where our criteria for evaluating them were again limited to the size distribution (compare, [18,28,73]). The problem cannot be solved simply using molecular methods since such an attempt would describe more cryptic species, which are probably both morphologically and ecologically the same or very similar; only scarce comparative studies between the identification methods were carried out in the environmental samples [5,21,27,28,31,74,75,76]. Also, the minute oligotrich species are challenging to identify according to their morphology in the samples [74,77]
Very similar cases are freshwater mixotrophic oligotrichs, where both genera Pelagostrombidium and Limnostrombidium were put to the same taxon (Pelagostrombidiidae). In theory, distinguishing them is easy, but there are some doubts that their morphology could vary according to the environmental conditions [62]. On the species level of Pelogostrombidium, molecular information on P. fallax and P. mirabile was also obtained using isolates, but the morphological details are challenging to observe in uncultured populations. Commonly, Pelagostrombidium sp. is contrasted to Limnostrombidium sp., but not P. fallax vs. P. mirabile or L. pelagicum vs. L. viride [28,78,79,80,81]. Additionally, one may find significantly different two size categories of the cells within the population (this study).
Within tintinnids, the genera Tintinnidium and Tintinnopsis are well defined [62] based on protargol stain. However, identifying them by routinely counting the plankton samples is nearly impossible, while Codonella cratera and Membranicola could be well distinguished [5]. The same is valid for the genera Askenasia and related Rhabdoaskenasia [27,28,82,83,84,85]. Moreover, possible other species of Askenasia and Rhabdoaskenasia have not been published yet. It is easier to define mixotrophic and heterotrophic species, supposing that they represent Askenasia chlorelligera, and according to the size, Askenasia volvox and the others, which might not always be correct [62,82].

4.3. Ciliate Ecology in the Reservoir

The absolute biomasses of peaking ciliates in our study (interquartile range up to 30 μg/L) are lower than in shallow eutrophic lakes [73,86,87] but comparable with the Lake Constance results [18,19,38,39,88,89]. This aligns with the observed oligotrophication trend in the Slapy reservoir [50]. However, Müller et al. [18,90] did not state generalised conclusions while showing variability between investigated years. It is an earnest attempt because ciliate growth might be so fast and short that we could not register or were unsure if we caught the peak. In our study, the solution to the problem was to calculate medians from two-decade sampling periods, which could avoid overestimating the assemblage behaviour during “atypical years”. There are no other critically revised long-term ciliate monitoring data from stratified freshwater bodies’ epilimnion/surface layer, covering more than 2 years. If data were published (lakes Kinneret, Israel; Pavin, France; Biwa, Japan [42,43,47]), only 1 year or a “representative year” analysis was performed. Articles such as the reconsidered PEG model [1] or book chapters [91] show a general ciliate annual abundance curve, mentioning their importance, but without any supported detailed information.
Recently, a 9-year analysis of the ciliate feeding groups in two subtropical reservoirs was published [36]. The authors found the positive effect of an absence of cyanobacteria blooms on ciliate diversity and discussed the results with up-to-date articles. However, almost only general ciliate biology sources [61,63,64] were consulted to assign the ciliate feeding behaviour to the obtained operational taxonomic units, which needs to be explicitly described. Our long-time study used detailed information on morphologically identified genera or species in QPS preparations, in parallel, combined with an epifluorescence examination of the ciliate vacuole content (Table 1). Additionally, we used fluorescently labelled prey to confirm direct picoplankton ingestion by different ciliates in various water bodies [21,22,23,71,92,93]. The results were cross-checked with publications from other research groups, which specialised in investigating the ciliate role in the microbial loop [7,59,94,95].
Comparing the limnological variables, possible ciliate prey abundances, and the ciliates in the graphical presentation, everything is coupled with the stratification of the reservoir along with a spring Chl a peak (April to May). Generally, phytoplankton and the ciliate growth concurred with the revised PEG model [1] but less with a scenario that Posch et al. [91] proposed because of a weakened summer phytoplankton peak in the Slapy reservoir. However, periods A and B present different patterns, and in particular, apparent relations between the variables might be different throughout the year. During period A, a typical eutrophic pattern was evident [1]. In contrast, period B exhibited characteristics more akin to oligotrophic conditions, similar to those found in Traunsee or Lake Zurich [5,28,31]. However, Pfister et al. [73], based on a well-supported database on fresh- and brackish-water ciliates, stated that the species composition is not significantly different in water bodies of varying phosphorus and chlorophyll concentrations, which control, however, the abundance of ciliates. It could apply to the annual means or medians of the ciliate distribution, but according to our results, it may differ during the yearly growth cycle. Comparative results of our study’s total biomass of different ciliate feeding-behaviour groups including LCLA can be consulted (Figure S10).
On the other hand, Weisse [96] theoretically analysed the possibility of the coexistence of similar behaviour type ciliates in a water body, and he stated that a grouping on such an ordinary level (e.g., picoplankton-filtering ciliates) is not sufficient to define the ciliate assemblage interactions (compare [5,35,36,87]). It explains the absence of a significant correlation between chosen ciliate feeding-behaviour groups and their possible food–bacteria and flagellates. Such a phenomenon was observed in Lake Constance [18,89], though it was partly confirmed during short-term studies (e.g., of phytoplankton peak) [5,38,39]. Comparing past and recent modelling results [19,39,41,88], we noted that the relation has not yet been sufficiently solved.
Our NMDS analysis plays a crucial role in identifying potential causal relations between the study years, using ciliate data that spans all the assemblage annual peaks (for data selection, see Section 3.3; Figure 11). However, the grouping of years from periods A and B did not form as distinct clusters in the graph as in the case of environmental variables and potential ciliate prey. This underscores the complexity of the ciliate dynamics and the need for further investigation.
The analysis identifies similar vector directions of the ciliate assemblage biomass, picoplankton-filtering (PF) and raptorial and flagellate-hunting ciliates (RH). PF were biomass dominating or essential through the whole analysed period. Depending on the species composition, their first peak appeared before or during the stratification event, and the second passed the clear-water phase until the end of stratification. Halteriids (Halteria grandinella, Pelagohalteria viridis) and small strobilidiids (Rimostrombidium humile, R. brachykinetum and other unidentified species) were the most common bacterivores/omnivores of the lake communities [5,18,21,27,28,29,83,85]. On the other hand, the low importance of minute scuticociliates would be surprising if we did not consider the nearly permanent DO oversaturation of the Slapy reservoir surface. At the same time, their optimum layer should be a local DO minimum [21,28,29,30]. Minute scuticociliates (Cyclidium glaucoma, Cinetochilum margaritaceum) were the most critical species; it concurs with the observation of, e.g., Müller [18]. Solitary peritrichs, mainly Vorticella aqua-dulcis and Vorticella sp. colonising diatoms Fragilaria sp., and Pseudohaplocaulus sp. on cyanobacteria Anabaena sp. were the most common within the group [28]. Recently, a new observation confirmed the omnivory of peritrichs and, in the case of pelagic free-swimming vorticellids also, efficient ingestion of nanoplankton, e.g., cryptomonads [97,98]. Adding pelagic colonial Epistylis spp. to the median calculation did not substantially change the result.
Raptorial ciliates (RH) did not reach high biomass (except for scarce, e.g., Pelagodileptus sp., Lacrymaria sp. or large mixotrophic Monodinium sp., excluded from the non-parametric analysis but included in the comparative plot of the ciliate groups’ biomasses) (Figure S9). Their occurrence with their food, e.g., HNF and related bacterioplankton, was expected. As in other water bodies, genera such as Askenasia and Lagynophrya, both heterotrophic and mixotrophic [21,28,62,90], Enchelys, and minute Monodinium were common. Minute Mesodinium spp. biomass replaced other RH during autumn–winter mixing (not included in the NMDS analysis). Though the median from period A was diminutive, it was of the same value as the others with quite a high range in period B. Freshwater mesodinia data are scarce [99].
Heterotrophic nanoplankton-filtering ciliates (HN) presented the vector direction very differently. The group dominated by tintinnids presented the biomass peak before the stratification event. However, their feeding preferences could be like those of mixotrophic nanoplankton-filtering ciliates (MN), which were not found either before the tintinnids, following the melting of snow or ice cover [29,92], or along with them, and reached the maximum later at stratification. Tintinnids were probably entering the surface layer of the Slapy reservoir with the water inlet. In the Římov reservoir, the tintinnid’s peak was localised at the temperature of the inlet river water flow [34,70]. Rimostrombidium lacustris should have the same feeding preferences as MN [59], but the ciliate maximum was observed when Rhodomonas spp. abundances would not support the ciliate growth. The occurrence of Stentor sp. (not included in NMDS) changed the median value of nanoplankton heterotrophic feeders before a spring phytoplankton peak during period A, while in B, another peak appeared during stratification. However, genus Stentor data from stratified oligo-mesotrophic water bodies are scarce, but from Patagonia, Argentina/Chile [92,100,101,102,103,104].
The algae-hunting (AH) ciliates’ vector is almost the same as that of MN. It could be related to their preferred prey, minute photosynthetic cryptomonads, including Rhodomonas spp. [59,90,97,105], but strombidiids use them mainly as a source of kleptoplasts [106,107]. On the other, the feeding group maxima occurred in different periods. AH, winter/spring peaks were composed first of B. planctonicum, which should prefer temperatures below 18 °C [108]. It was followed by Urotricha spp. and, particularly in period B, by Histiobalantium spp. during the spring phytoplankton peak [5,28,31,59] but they were already dropping with the stable stratification when MN reached their maximum.
After a short clear-water phase (periodically observed in one sampling date), both AH and MN could develop again, though Rhodomonas spp. did not support their growth; Müller et al. has already observed this discrepancy [90]. We suppose both groups also fed upon HNF, which were invisible in the feeding vacuoles. Ingestion of bacteria by minute prostomes (urotrichs, B. planctonicum) was negligible [21], and we never observed ingestion of them by Histiobalantium spp., as proven in cultures [90] but not confirmed when suitable flagellate food was present [97,109]. Contrary to the abovementioned experiments, we observed B. planctonicum at water temperatures up to 22 °C during the summer phytoplankton peak.
However, the feeding of strombidiids is not limited to nanophytoplankton, and they are efficient HNF and bacteria feeders [19,62,89,90,107,110], which explains their elevated biomass even in a lack of cryptomonads. On the other hand, though they mainly possess kleptoplasts in their cells (Figure S1), it is not feasible that their biomass contains Chl a significantly apportioning the total Chl a concentration as was observed in Lake Tanganyika [10]. Common mixotrophs with zoochlorellae like PF P. viridis or RH Lagynophrya spp., Askenasia chlorelligera, or Monodinium sp. (large) never reached sufficient biomass.
Medians of the sampling results showing the annual cycle at the level of ciliate feeding-behaviour groups are statistically correct, considering many observed seasons. Also, incorporating LCLA ciliates into the analyses is valid whenever the median attempt was applied because they could change the order within the sampling data. However, they should not be overvalued because they do not necessarily represent the same sampling data for all the groups. Thus, the whole assemblage sampling median may not be the same as the sum of the group medians, and the range of data in any long-term monitored water body is vast due to “unusual years” (Figure 2 and Figure S9). The problem behind such observation relates to the inexistence of “the optimum sampling period”, according to the ciliate generation times vs. monitoring programme possibilities. It was repeatedly shown that significant changes in the ciliate assemblage used to take place within a week [5,21,83,92].
In other short studies carried out by our team, e.g., in the Římov reservoir, we sampled either the surface/epilimnetic layer or the phase limits (thermocline/oxycline) or directly the river body within the reservoir water column [21,71,83]. It was proven that our reservoirs’ ciliate assemblage activity is not located on the surface, in the DO oversaturated layer, and that its importance is in the below-metalimnion layers with frequent DO depletion. On the one hand, it explains a predictable ciliate assemblage growth and observed discrepancies between the ciliates and their supposed prey abundance. The same pattern is known from the water bodies worldwide [13,14,18,23,28,31,33,90,99].

5. Conclusions

The presented results are part of the long-term monitoring of reservoir Slapy, to which the ciliate analysis was added in 1994 and ended in 2018, becoming one of the longest from freshwater bodies. Thanks to two-decade monitoring data, applying the most straightforward statistical approach of median and interquartile range was possible. It confirmed the ciliate role in the updated PEG model, showing two prominent peaks related to spring and less to summer phytoplankton maxima.
This study was divided into two periods, which differed by the reservoir’s nutrient load and were associated with different patterns. In the A period, with higher nutrient loading, the spring peak of ciliate biomass was much higher than the summer one. During the lower nutrient loading B period, two similarly high peaks were observed, consisting mainly of mixotrophic species. If the ciliate biomass data were time-normalised using a calculated day of stratification, a spring peak and a clear-water phase were well defined, which was not observed for a summer peak at the end of stratification with variable duration.
It has been shown that the empirical chlorophyll a concentrations marking the beginning of the spring peak at 5 µg/L and the end of the summer peak at 7 µg/L coincided with the prominent peak of ciliates as follows: the spring peak of algae hunting ciliates (Balanion planctonicum, urotrichs; more recently also Histiobalantium spp.) and heterotrophic nanoplankton filtering tintinnids before stratification, and a peak of mixotrophic nanoplankton-filtering ciliates in the stratification event, which lasted longer during the period of lower nutrient load. However, the ciliates showed a higher biomass before the summer peak of chlorophyll a. Only one ciliate genus, Mesodinium, reached its maximum during the autumn mixing.
Using the hydrodynamic model to calculate the water age in the epilimnion/surface layer proved helpful in understanding ciliate growth there. The layer was well separated, explaining the ciliates’ straightforward behaviour and how the composition assemblage changes with increasing nutrient limitation. On the other hand, no information can be extrapolated about the composition and activity of the ciliate assemblage in other parts of the water column.
By monitoring the ciliate assemblages in the surface layer for so long, we gained valuable insights into their role within the microbial loop of the plankton food web. Our findings revealed annual periodicity and long-term variations at the level of feeding-behaviour groups of ciliates. It is recommended that future monitoring covers additional layers, such as deep chlorophyll a maximum or oxygen local minimum, if present, to capture the complexity of water bodies such as reservoirs or lakes with continuous river flow.

Supplementary Materials

The following supporting information can be downloaded at: https://www.mdpi.com/article/10.3390/d16090534/s1, Figure S1: Nanoplankton-filtering ciliates; Figure S2: Picoplankton-filtering ciliates; Figure S3: Algae-hunting ciliates; Figure S4: Raptorial and flagellate-hunting ciliates; Figure S5: Physical–chemical variables in Slapy reservoir, annual and stratification periods’ means; Figure S6: Three-week interval values, and the annual- and stratification-mean of the ciliates, including large-cell but low-abundance species in the Slapy reservoir; Figure S7: The median and interquartile range of physical and chemical data in the Slapy reservoir; Figure S8: The median and interquartile range of the ciliates, including large-cell but low-abundance species in the Slapy reservoir: abundance and organic carbon biomass. Sampling days and sampling days corrected to the stratification-start day; Figure S9: The ciliate organic carbon biomass median and interquartile range of feeding-behaviour groups, including large-cell but low-abundance species in the Slapy reservoir.; Figure S10: The organic carbon biomass median and interquartile range of heterotrophic and mixotrophic ciliates, including large-cell but low-abundance species in the Slapy reservoir; Figure S11: The ciliate median biomass of feeding-behaviour groups, including large-cell but low-abundance species in the Slapy reservoir; Data set: Slapy 1994–2018 Selected data Macek et al.

Author Contributions

Conceptualization, M.M. and J.V.; methodology, M.M., J.H., K.Š. and K.Ř.; software, J.J., M.M. and M.Š.; validation, M.M., J.H., K.Š. and K.Ř.; formal analysis, M.M., J.J. and M.Š.; investigation, J.V., M.M. and M.Š.; data curation, M.M.; writing—original draft preparation, M.M.; writing—review and editing, J.V., J.H. and K.Ř.; visualisation, M.M. and M.Š.; supervision, we did not receive any; project administration, J.V.; funding acquisition, J.V. and past members of today Institute of Hydrobiology, České Budějovice. All authors have read and agreed to the published version of the manuscript.

Funding

This research was supported by the institutional budget for the long-term reservoir monitoring of IHB BC CAS; the last study period (2015–2017) was granted by the Czech Science Foundation (GA ČR) grant 15-04034S (2015–2017) “Do long-term zooplankton data in the Slapy reservoir reflect land use and/or climate changes in the past 50 years?”, within which J.V., J.H., M.M. and M.Š. were partly engaged.

Institutional Review Board Statement

Not applicable.

Data Availability Statement

The data, including total ciliate assemblage abundance and biomass, are deposited in the IHB BC CAS; the summarised data worksheet is included as Supplementary Material. If collaborative analysis is required, ciliate species data are available on demand from M.M.

Acknowledgments

The research would not be possible without the leadership of Viera Straškrábová, the founder of today’s Dept. Aquatic Microbial Ecology and then director of the Institute. In introducing the modern microbial ecology methods, international events such as the Workshop of the Plankton Ecology Group on “Protozooplankton ecology—methods and seasonal successions”, Mondsee, 1993, Austria were other key factors behind the evaluation of ciliates’ behaviour. M.M. thanks the IHB BC CAS and UNAM México, which made active collaboration possible for a long time, partly supported by the academic exchange programme of CONACYT, México. Additional thanks are directed to the anonymous reviewers and the academic editor of the special issue, who substantially helped to improve the manuscript.

Conflicts of Interest

The authors declare no conflicts of interest. The funders had no role in this study’s design, in the collection, analyses, or interpretation of data, in the writing of the manuscript, or in the decision to publish the results.

References

  1. Sommer, U.; Adrian, R.; De Senerpont Domis, L.; Elser, J.J.; Gaedke, U.; Ibelings, B.; Jeppesen, E.; Lürling, M.; Molinero, J.C.; Mooij, W.M.; et al. Beyond the Plankton Ecology Group (PEG) Model: Mechanisms Driving Plankton Succession. Annu. Rev. Ecol. Evol. Syst. 2012, 43, 429–448. [Google Scholar] [CrossRef]
  2. Porter, K.G.; Feig, Y.S. The Use of DAPI for Identifying and Counting Aquatic Microflora1. Limnol. Oceanogr. 1980, 25, 943–948. [Google Scholar] [CrossRef]
  3. Azam, F.; Fenchel, T.; Field, J.; Gray, J.; Meyer-Reil, L.; Thingstad, F. The Ecological Role of Water-Column Microbes in the Sea. Mar. Ecol. Prog. Ser. 1983, 10, 257–263. [Google Scholar] [CrossRef]
  4. Weisse, T.; Montagnes, D.J.S. Ecology of Planktonic Ciliates in a Changing World: Concepts, Methods, and Challenges. J. Eukaryot. Microbiol. 2022, 69, e12879. [Google Scholar] [CrossRef]
  5. Posch, T.; Eugster, B.; Pomati, F.; Pernthaler, J.; Pitsch, G.; Eckert, E.M. Network of Interactions Between Ciliates and Phytoplankton During Spring. Front. Microbiol. 2015, 6, 1289. [Google Scholar] [CrossRef]
  6. Sherr, E.B.; Sherr, B.F. Protistan Grazing Rates via Uptake of Fluorescently Labeled Prey. In Handbook of Methods on Aquatic Microbial Ecology; Kemp, P.F., Sherr, B.F., Sherr, E.B., Cole, J.J., Eds.; Lewis Publishers: London, UK, 1993; pp. 695–701. [Google Scholar]
  7. Sherr, E.B.; Sherr, B.F.; Berman, T.; Hadas, O. High Abundance of Picoplankton-Ingesting Ciliates during Late Fall in Lake Kinneret, Israel. J. Plankton Res. 1991, 13, 789–799. [Google Scholar] [CrossRef]
  8. Gifford, D.J. Consumption of Protozoa by Copepods Feeding on Natural Microplankton Assemblages. In Handbook of Methods on Aquatic Microbial Ecology; Kemp, P.F., Sherr, B.F., Sherr, E.B., Cole, J.J., Eds.; Lewis Publishers: London, UK, 1993; pp. 723–729. [Google Scholar]
  9. Stoecker, D.; Pierson, J. Predation on Protozoa: Its Importance to Zooplankton Revisited. J. Plankton Res. 2019, 41, 367–373. [Google Scholar] [CrossRef]
  10. Hecky, R.E.; Kling, H.J. The Phytoplankton and Protozooplankton of the Euphotic Zone of Lake Tanganyika: Species Composition, Biomass, Chlorophyll Content, and Spatio-temporal Distribution1. Limnol. Oceanogr. 1981, 26, 548–564. [Google Scholar] [CrossRef]
  11. Stoecker, D.K.; Gifford, D.J.; Putt, M. Preservation of Marine Planktonic Ciliates: Losses and Cell Shrinkage during Fixation. Mar. Ecol. Prog. Ser. 1994, 110, 293–299. [Google Scholar] [CrossRef]
  12. Sherr, E.B.; Sherr, B.F. Preservation and Storage of Samples for Enumeration of Heterotrophic Protists. In Handbook of Methods on Aquatic Microbial Ecology; Kemp, P.F., Sherr, B.F., Sherr, E.B., Cole, J.J., Eds.; Lewis Publishers: London, UK, 1993; pp. 207–212. [Google Scholar]
  13. Taylor, W.D.; Heynen, M.L. Seasonal and Vertical Distribution of Ciliophora in Lake Ontario. Can. J. Fish. Aquat. Sci. 1987, 44, 2185–2191. [Google Scholar] [CrossRef]
  14. Madoni, P. The Ciliated Protozoa of the Monomictic Lake Kinneret (Israel): Species Composition and Distribution during Stratification. Hydrobiologia 1990, 190, 111–120. [Google Scholar] [CrossRef]
  15. Straškrabová, V.; Callieri, C.; Carrillo, P.; Cruz-Pizarro, L.; Fott, J.; Hartman, P.; Macek, M.; Medina-Sánchez, J.M.; Nedoma, J.; Šimek, K. Investigations on Pelagic Food Webs in Mountain Lakes—Aims and Methods. J. Limnol. 1999, 58, 77–87. [Google Scholar] [CrossRef]
  16. Felip, M.; Bartumeus, F.; Halac, S.; Catalan, J. Microbial Plankton Assemblages, Composition and Biomass, during Two Ice-Free Periods in a Deep High Mountain Lake (Estany Redó, Pyrenees). J. Limnol. 1999, 58, 193–202. [Google Scholar] [CrossRef]
  17. Czychewicz, N.; Rychert, K. Seasonal Changes in Ciliate Biomass and Composition of the Ciliate Community in Oligo-Mesotrophic Lake Jasne (Iława Lake District, Poland). Limnol. Rev. 2011, 11, 3–5. [Google Scholar] [CrossRef]
  18. Müller, H. The Relative Importance of Different Ciliate Taxa in the Pelagic Food Web of Lake Constance. Microb. Ecol. 1989, 18, 261–273. [Google Scholar] [CrossRef]
  19. Gaedke, U.; Wickham, S.A. Ciliate Dynamics in Response to Changing Biotic and Abiotic Conditions in a Large, Deep Lake (Lake Constance). Aquat. Microb. Ecol. 2004, 34, 247–261. [Google Scholar] [CrossRef]
  20. Hadas, O.; Berman, T. Seasonal Abundance and Vertical Distribution of Protozoa (Flagellates, Ciliates), and Bacteria in Lake Kinneret, Israel. Aquat. Microb. Ecol. 1998, 14, 161–170. [Google Scholar] [CrossRef]
  21. Šimek, K.; Bobková, J.; Macek, M.; Nedoma, J.; Psenner, R. Ciliategrazing on Picoplankton in a Eutrophic Reservoir during the Summer Phytoplankton Maximum: A Study at the Species and Community Level. Limnol. Oceanogr. 1995, 40, 1077–1090. [Google Scholar] [CrossRef]
  22. Peštová, D.; Macek, M.; Martínez-Pérez, M.E. Ciliates and Their Picophytoplankton-Feeding Activity in a High-Altitude Warm-Monomictic Saline Lake. Eur. J. Protistol. 2008, 44, 13–25. [Google Scholar] [CrossRef]
  23. Bautista-Reyes, F.; Macek, M. Ciliate Food Vacuole Content and Bacterial Community Composition in the Warm-Monomictic Crater Lake Alchichica, México. FEMS Microbiol. Ecol. 2012, 79, 85–97. [Google Scholar] [CrossRef] [PubMed]
  24. Montagnes, D.J.S.; Lynn, D.H. A Quantitative Protargol Stain (QPS) for Ciliates and Other Protists. In Handbook of Methods on Aquatic Microbial Ecology; Kemp, P.F., Sherr, B.F., Sherr, E.B., Cole, J.J., Eds.; Lewis Publishers: London, UK, 1993; pp. 229–240. [Google Scholar]
  25. Skibbe, O. An Improved Quantitative Protargol Stain for Ciliates and Other Planktonic Protists. Arch. Hydrobiol. 1994, 130, 339–347. [Google Scholar] [CrossRef] [PubMed]
  26. Pfister, G.; Sonntag, B.; Posch, T. Comparison of a Direct Live Count and an Improved Quantitative Protargol Stain (QPS) in Determining Abundance and Cell Volumes of Pelagic Freshwater Protozoa. Aquat. Microb. Ecol. 1999, 18, 95–103. [Google Scholar] [CrossRef]
  27. Sonntag, B.; Posch, T.; Klammer, S.; Griebler, C.; Psenner, R. Protozooplankton in the Deep Oligotrophic Traunsee (Austria) Influenced by Discharges of Soda and Salt Industries. Water Air Soil Pollut. Focus 2002, 2, 211–226. [Google Scholar] [CrossRef]
  28. Sonntag, B.; Posch, T.; Klammer, S.; Teubner, K.; Psenner, R. Phagotrophic Ciliates and Flagellates in an Oligotrophic, Deep, Alpine Lake: Contrasting Variability with Seasons and Depths. Aquat. Microb. Ecol. 2006, 43, 193–207. [Google Scholar] [CrossRef]
  29. Macek, M.; Callieri, C.; Šimek, K.; Lugo-Vázquez, A. Seasonal Dynamics, Composition and Feeding Patterns of Ciliate Assemblages in Oligotrophic Lakes Covering a Wide pH Range. Arch. Hydrobiol. 2006, 166, 261–287. [Google Scholar] [CrossRef]
  30. Sánchez Medina, X.; Macek, M.; Bautista-Reyes, F.; Perz, A.; Bonilla Lemus, P.; Chávez Arteaga, M. Inter-Annual Ciliate Distribution Variation within the Late Stratification Oxycline in a Monomictic Lake, Lake Alchichica (Mexico). J. Limnol. 2016, 75, 179–190. [Google Scholar] [CrossRef]
  31. Pitsch, G.; Bruni, E.P.; Forster, D.; Qu, Z.; Sonntag, B.; Stoeck, T.; Posch, T. Seasonality of Planktonic Freshwater Ciliates: Are Analyses Based on V9 Regions of the 18S rRNA Gene Correlated with Morphospecies Counts? Front. Microbiol. 2019, 10, 248. [Google Scholar] [CrossRef] [PubMed]
  32. Dirren-Pitsch, G.; Bühler, D.; Salcher, M.M.; Bassin, B.; Le Moigne, A.; Schuler, M.; Pernthaler, J.; Posch, T. FISHing for Ciliates: Catalyzed Reporter Deposition Fluorescence in Situ Hybridization for the Detection of Planktonic Freshwater Ciliates. Front. Microbiol. 2022, 13, 1070232. [Google Scholar] [CrossRef]
  33. Finlay, B.J.; Esteban, G.F. Planktonic Ciliate Species Diversity as an Integral Component of Ecosystem Function in a Freshwater Pond. Protist 1998, 149, 155–165. [Google Scholar] [CrossRef]
  34. Macek, M. Distribution of Ciliates in the Římov Reservoir. Ergeb. Limnol. 1994, 40, 137–141. [Google Scholar]
  35. Qu, Z.; Forster, D.; Bruni, E.P.; Frantal, D.; Kammerlander, B.; Nachbaur, L.; Pitsch, G.; Posch, T.; Pröschold, T.; Teubner, K.; et al. Aquatic Food Webs in Deep Temperate Lakes: Key Species Establish through Their Autecological Versatility. Mol. Ecol. 2021, 30, 1053–1071. [Google Scholar] [CrossRef] [PubMed]
  36. Abdullah Al, M.; Wang, W.; Jin, L.; Chen, H.; Xue, Y.; Jeppesen, E.; Majaneva, M.; Xu, H.; Yang, J. Planktonic Ciliate Community Driven by Environmental Variables and Cyanobacterial Blooms: A 9-Year Study in Two Subtropical Reservoirs. Sci. Total Environ. 2023, 858, 159866. [Google Scholar] [CrossRef] [PubMed]
  37. D’Alelio, D.; Libralato, S.; Wyatt, T.; Ribera d’Alcalà, M. Ecological-Network Models Link Diversity, Structure and Function in the Plankton Food-Web. Sci. Rep. 2016, 6, 21806. [Google Scholar] [CrossRef] [PubMed]
  38. Weisse, T.; Müller, H.; Pinto-Coelho, R.M.; Schweizer, A.; Springmann, D.; Baldringer, G. Response of the Microbial Loop to the Phytoplankton Spring Bloom in a Large Prealpine Lake. Limnol. Oceanogr. 1990, 35, 781–794. [Google Scholar] [CrossRef]
  39. Tirok, K.; Gaedke, U. Regulation of Planktonic Ciliate Dynamics and Functional Composition during Spring in Lake Constance. Aquat. Microb. Ecol. 2007, 49, 87–100. [Google Scholar] [CrossRef]
  40. Kerimoglu, O.; Straile, D.; Peeters, F. Modeling the Spring Blooms of Ciliates in a Deep Lake. Hydrobiologia 2014, 731, 173–189. [Google Scholar] [CrossRef]
  41. Kath, N.J.; Thomas, M.K.; Gaedke, U. Mysterious Ciliates: Seasonally Recurrent and yet Hard to Predict. J. Plankton Res. 2022, 44, 891–910. [Google Scholar] [CrossRef]
  42. Hadas, O.; Berman, T.; Malinsky-Rushansky, N.; Gal, G. Protozoa (Unicellular Zooplankton): Ciliates and Flagellates. In Lake Kinneret; Zohary, T., Sukenik, A., Berman, T., Nishri, A., Eds.; Springer: Dordrecht, The Netherlands, 2014; pp. 247–258. ISBN 978-94-017-8943-1. [Google Scholar]
  43. Nishino, M. Biodiversity of Lake Biwa. In Lake Biwa: Interactions between Nature and People; Kawanabe, H., Nishino, M., Maehata, M., Eds.; Springer International Publishing: Cham, Switzerland, 2020; pp. 69–257. ISBN 978-3-030-16968-8. [Google Scholar]
  44. Timoshkin, O.; Grygier, M.J.; Wada, E.; Nakai, K.; Nishino, M.; Genkal, S.I.; Biserov, V.I.; Gagarin, V.G.; Semernoy, V.P.; Jankowski, A.W.; et al. Biodiversity of Lake Biwa: New Discoveries and Future Potential. In Annotirovannyi Spisok Fauny Ozera Baikal i Ego Vodosbornogo Basseina [Index of Animal Species Inhabiting Lake Baikal and Its Catchment Area]; Timoshkin, O., Ed.; Nauka: Novosibirsk, Russia, 2009; Volume 1, pp. 1439–1513. [Google Scholar]
  45. Macek, M.; Sánchez-Medina, X.; Vilaclara, G.; Lugo-Vázquez, A.; Bautista-Reyes, F.; Valdespino-Castillo, P.M. Protozooplankton. In Lake Alchichica Limnology; Alcocer, J., Ed.; Springer International Publishing: Cham, Switzerland, 2022; pp. 213–236. ISBN 978-3-030-79095-0. [Google Scholar]
  46. Hejzlar, J.; Vrba, J. Brief History of Long-Term Ecological Research into Aquatic Ecosystems and Their Catchments in the Czech Republic; Znachor, P., Ed.; Biology Centre, Institute of hydrobiology: České Budějovice, Czech Republic, 2016; ISBN 978-80-86668-38-3. [Google Scholar]
  47. Carrias, J.-F.; Amblard, C.; Bourdier, G.; Sime-Ngando, T. The Importance of Phagotrophic Protists in Lake Pavin. In Lake Pavin; Sime-Ngando, T., Boivin, P., Chapron, E., Jezequel, D., Meybeck, M., Eds.; Springer International Publishing: Cham, Switzerland, 2016; pp. 307–314. ISBN 978-3-319-39960-7. [Google Scholar]
  48. Straškraba, M.; Hrbáček, J.; Javornický, P. Effect of an Upstream Reservoir on the Stratification Conditions in Slapy Reservoir. In Hydrobiological Studies 2; Hrbáček, J., Straškraba, M., Eds.; Academia: Prague, Czech Republic, 1973; pp. 7–82. [Google Scholar]
  49. Kopáček, J.; Hejzlar, J.; Porcal, P.; Posch, M. Trends in Riverine Element Fluxes: A Chronicle of Regional Socio-Economic Changes. Water Res. 2017, 125, 374–383. [Google Scholar] [CrossRef]
  50. Kopáček, J.; Hejzlar, J.; Porcal, P.; Znachor, P. Biogeochemical Causes of Sixty-Year Trends and Seasonal Variations of River Water Properties in a Large European Basin. Biogeochemistry 2021, 154, 81–98. [Google Scholar] [CrossRef]
  51. Fott, J.; Nedbalová, L.; Brabec, M.; Kozáková, R.; Řeháková, K.; Hejzlar, J.; Šorf, M.; Vrba, J. Light as a Controlling Factor of Winter Phytoplankton in a Monomictic Reservoir. Limnologica 2022, 95, 125995. [Google Scholar] [CrossRef]
  52. Lewis, W.M., Jr. A Revised Classification of Lakes Based on Mixing. Can. J. Fish. Aquat. Sci. 1983, 40, 1779–1787. [Google Scholar] [CrossRef]
  53. Vystavna, Y.; Hejzlar, J.; Kopáček, J. Long-Term Trends of Phosphorus Concentrations in an Artificial Lake: Socio-Economic and Climate Drivers. PLoS ONE 2017, 12, e0186917. [Google Scholar] [CrossRef] [PubMed]
  54. Cole, T.M.; Wells, S.A. CE-QUAL-W2: A Two-Dimensional, Laterally Averaged, Hydrodynamic and Water Quality Model, version 4.0, Department of Civil and Environmental Engineering, Portland State University, Portland, OR, USA. Available online: https://cee.pdx.edu/w2/ (accessed on 1 April 2024).
  55. Monsen, N.E.; Cloern, J.E.; Lucas, L.V.; Monismith, S.G. A Comment on the Use of Flushing Time, Residence Time, and Age as Transport Time Scales. Limnol. Oceanogr. 2002, 47, 1545–1553. [Google Scholar] [CrossRef]
  56. Lorenzen, C.J. Determination of Chlorophyll and Pheo-Pigments: Spectrophotometric Equations. Limnol. Oceanogr. 1967, 12, 343–346. [Google Scholar] [CrossRef]
  57. Javornický, P. Freshwater Rhodomonads (Cryptophyceae). Arch. Hydrobiol. Algol. Stud. Suppl. Vol. 2001, 102, 93–116. [Google Scholar] [CrossRef]
  58. Javornický, P. Taxonomic Notes on Some Freshwater Planktonic Cryptophyceae Based on Light Microscopy. Hydrobiologia 2003, 502, 271–283. [Google Scholar] [CrossRef]
  59. Müller, H.; Schlegel, A. Responses of Three Freshwater Planktonic Ciliates with Different Feeding Modes to Cryptophyte and Diatom Prey. Aquat. Microb. Ecol. 1999, 17, 49–60. [Google Scholar] [CrossRef]
  60. Jerome, C.A.; Montagnes, D.J.S.; Taylor, F.J.R. The Effect of the Quantitative Protargol Stain and Lugol’s and Bouin’s Fixatives On Cell Size: A More Accurate Estimate of Ciliate Species Biomass. J. Eukaryot. Microbiol. 1993, 40, 254–259. [Google Scholar] [CrossRef]
  61. Foissner, W.; Berger, H. A User-friendly Guide to the Ciliates (Protozoa, Ciliophora) Commonly Used by Hydrobiologists as Bioindicators in Rivers, Lakes, and Waste Waters, with Notes on Their Ecology. Freshw. Biol. 1996, 35, 375–482. [Google Scholar] [CrossRef]
  62. Foissner, W.; Berger, H.; Schaumburg, J. Identification and Ecology of Limnetic Plankton Ciliates; Informationsberichte; Informationberichte des Bayerischen Landesamtes Institut für Wasserwirtschaft: Munich, Germany, 1999; ISBN 978-3-930253-79-1. [Google Scholar]
  63. Lynn, D.H. The Ciliated Protozoa: Characterization, Classification, and Guide to the Literature; Springer: New York, NY, USA, 2008; ISBN 978-1-4020-8238-2. [Google Scholar]
  64. Adl, S.M.; Bass, D.; Lane, C.E.; Lukeš, J.; Schoch, C.L.; Smirnov, A.; Agatha, S.; Berney, C.; Brown, M.W.; Burki, F.; et al. Revisions to the Classification, Nomenclature, and Diversity of Eukaryotes. J. Eukaryot. Microbiol. 2019, 66, 4–119. [Google Scholar] [CrossRef]
  65. Motulsky, H.J. GraphPad Statistics Guide; GraphPad Software, LLC: San Diego, CA, USA, 2016. [Google Scholar]
  66. Straškrábová, V. Long-Term Development of Reservoir Ecosystems—Changes in Pelagic Food Webs and Their Microbial Component. Limnetica 2005, 24, 9–20. [Google Scholar] [CrossRef]
  67. Hyndman, R.J.; Fan, Y. Sample Quantiles in Statistical Packages. Am. Stat. 1996, 50, 361–365. [Google Scholar] [CrossRef]
  68. Ter Braak, C.J.F.; Šmilauer, P. Canoco Reference Manual and User’s Guide: Software for Ordination; Version 5.1x.; Microcomputer Power: Ithaca, NY, USA, 2018. [Google Scholar]
  69. Hammer, Ø.; Harper, D.A.T.; Ryan, P.D. PAST: Paleontological Statistics Software Package for Education and Data Analysis. Palaeontol. Electron. 2001, 4, 4–9. [Google Scholar]
  70. Macek, M.; Jezbera, J.; Sed’a, J.; Straškrábová, V.; Šimek, K.; Han, D. Distribution and Growth Rates of Ciliates along a Longitudinal Profile of the Římov Reservoir. In Proceedings of the Res Lim 2002, 4th International Conference on Reservoir Limnology and Water Quality, České Budějovice, Czech Republic, 12–16 August 2002; Hydrobiological Institute Academy of Sciences of the Czech Republic, Faculty of Biological Sciences University of South Bohemia: České Budějovice, Czech Republic, 2002; pp. 196–199. [Google Scholar]
  71. Jezbera, J.; Nedoma, J.; Šimek, K. Longitudinal Changes in Protistan Bacterivory and Bacterial Production in Two Canyon-Shaped Reservoirs of Different Trophic Status. Hydrobiologia 2003, 504, 115–130. [Google Scholar] [CrossRef]
  72. Jeppesen, E.; Sørensen, P.B.; Johansson, L.S.; Søndergaard, M.; Lauridsen, T.L.; Nielsen, A.; Mejlhede, P. Recovery of Lakes from Eutrophication: Changes in Nitrogen Retention Capacity and the Role of Nitrogen Legacy in 10 Danish Lakes Studied over 30 Years. Hydrobiologia 2024, 710, 95–107. [Google Scholar] [CrossRef]
  73. Pfister, G.; Auer, B.; Arndt, H. Pelagic Ciliates (Protozoa, Ciliophora) of Different Brackish and Freshwater Lakes—A Community Analysis at the Species Level. Limnologica 2002, 32, 147–168. [Google Scholar] [CrossRef]
  74. Krainer, K.-H. Taxonomische Untersuchungen an neuen und wenig be kannten planktischen Ciliaten (Protozoa: Ciliophora) aus Baggerseen in Österreich. Lauterbornia 1995, 21, 39–68. [Google Scholar]
  75. Frantal, D.; Agatha, S.; Beisser, D.; Boenigk, J.; Darienko, T.; Dirren-Pitsch, G.; Filker, S.; Gruber, M.; Kammerlander, B.; Nachbaur, L.; et al. Molecular Data Reveal a Cryptic Diversity in the Genus Urotricha (Alveolata, Ciliophora, Prostomatida), a Key Player in Freshwater Lakes, With Remarks on Morphology, Food Preferences, and Distribution. Front. Microbiol. 2022, 12, 787290. [Google Scholar] [CrossRef]
  76. Sonntag, B.; Frantal, D.; Kammerlander, B.; Darienko, T.; Filker, S.; Stoeck, T.; Gruber, M.; Pröschold, T. Widespread Occurrence of Two Planktonic Ciliate Species (Urotricha, Prostomatida) Originating from High Mountain Lakes. Diversity 2022, 14, 362. [Google Scholar] [CrossRef]
  77. Humby, P.L.; Lynn, D.H. Taxonomic Description of Six Species of Pelagic, Freshwater Ciliates from the Order Choreotrichida Collected from Lake Ontario, Canada. Aquat. Ecosyst. Health Manag. 2020, 23, 45–57. [Google Scholar] [CrossRef]
  78. Krainer, K.-H. Contributions to the Morphology, Infraciliature and Ecology of the Planktonic Ciliates Strombidium pelagicum n.sp., Pelagostrombidium mirabile (Penard, 1916) n.g., n. comb., and Pelagostrombidium fallax (Zacharias, 1896) n.g., n. comb. (Ciliophora, Oligotrichida). Eur. J. Protistol. 1991, 27, 60–70. [Google Scholar] [CrossRef] [PubMed]
  79. Gao, F.; Li, J.; Song, W.; Xu, D.; Warren, A.; Yi, Z.; Gao, S. Multi-Gene-Based Phylogenetic Analysis of Oligotrich Ciliates with Emphasis on Two Dominant Groups: Cyrtostrombidiids and Strombidiids (Protozoa, Ciliophora). Mol. Phylogenet. Evol. 2016, 105, 241–250. [Google Scholar] [CrossRef]
  80. Ganser, M.H.; Santoferrara, L.F.; Agatha, S. Molecular Signature Characters Complement Taxonomic Diagnoses: A Bioinformatic Approach Exemplified by Ciliated Protists (Ciliophora, Oligotrichea). Mol. Phylogenet. Evol. 2022, 170, 107433. [Google Scholar] [CrossRef] [PubMed]
  81. Agatha, S.; Weißenbacher, B.; Kirschner, M.; Ganser, M.H. Trichite Features Contribute to the Revision of the Genus Strombidium (Alveolata, Ciliophora, Spirotricha). J. Eukaryot. Microbiol. 2024, 71, e13001. [Google Scholar] [CrossRef]
  82. Krainer, K.; Foissner, W. Revision of the Genus Askenasia Blochmann, 1895, with Proposal of Two New Species, and Description of Rhabdoaskenasia minima n. g., n. sp. (Ciliophora, Cyclotrichida). J. Protozool. 1990, 37, 414–427. [Google Scholar] [CrossRef]
  83. Macek, M.; Šimek, K.; Pernthaler, J.; Vyhnálek, V.; Psenner, R. Growth Rates of Dominant Planktonic Ciliates in Two Freshwater Bodies of Different Trophic Degree. J. Plankton Res. 1996, 18, 463–481. [Google Scholar] [CrossRef]
  84. Küppers, G.C.; Lopretto, E.C.; Claps, M.C. Morphological Aspects and Seasonal Changes of Some Planktonic Ciliates (Protozoa) from a Temporary Pond in Buenos Aires Province, Argentina. Pan-Am. J. Aquat. Sci. 2006, 1, 74–90. [Google Scholar]
  85. Sommer, F.; Sonntag, B.; Rastl, N.; Summerer, M.; Tartarotti, B. Ciliates in Man-Made Mountain Reservoirs. Front. Environ. Sci. 2022, 10, 903095. [Google Scholar] [CrossRef]
  86. Lischke, B.; Weithoff, G.; Wickham, S.A.; Attermeyer, K.; Grossart, H.-P.; Scharnweber, K.; HIlt, S.; Gaedke, U. Large Biomass of Small Feeders: Ciliates May Dominate Herbivory in Eutrophic Lakes. J. Plankton Res. 2016, 38, 2–15. [Google Scholar] [CrossRef]
  87. Šimek, K.; Grujčić, V.; Nedoma, J.; Jezberová, J.; Šorf, M.; Matoušů, A.; Pechar, L.; Posch, T.; Bruni, E.P.; Vrba, J. Microbial Food Webs in Hypertrophic Fishponds: Omnivorous Ciliate Taxa Are Major Protistan Bacterivores. Limnol. Oceanogr. 2019, 64, 2295–2309. [Google Scholar] [CrossRef]
  88. Tirok, K.; Gaedke, U. Spring Weather Determines the Relative Importance of Ciliates, Rotifers and Crustaceans for the Initiation of the Clear-Water Phase in a Large, Deep Lake. J. Plankton Res. 2006, 28, 361–373. [Google Scholar] [CrossRef]
  89. Cleven, E. Pelagic Ciliates in a Large Mesotrophic Lake: Seasonal Succession and Taxon-Specific Bacterivory in Lake Constance. Int. Rev. Hydrobiol. 2004, 89, 289–304. [Google Scholar] [CrossRef]
  90. Müller, H.; Schöne, A.; Pinto-Coelho, R.M.; Schweizer, A.; Weisse, T. Seasonal Succession of Ciliates in Lake Constance. Microb. Ecol. 1991, 21, 119–138. [Google Scholar] [CrossRef] [PubMed]
  91. Posch, T.; Pitsch, G.; Bruni, E.P. Protists: Ciliates. In Encyclopedia of Inland Waters; Elsevier: Amsterdam, The Netherlands, 2022; pp. 639–649. ISBN 978-0-12-822041-2. [Google Scholar]
  92. Macek, M.; Šimek, K.; Bittl, T. Conspicuous Peak of Oligotrichous Ciliates Following Winter Stratification in a Bog Lake. J. Plankton Res. 2001, 23, 353–363. [Google Scholar] [CrossRef]
  93. Šimek, K.; Macek, M.; Pernthaler, J.; Straškrabová, V.; Psenner, R. Can Freshwater Planktonic Ciliates Survive on a Diet of Picoplankton? J. Plankton Res. 1996, 18, 597–613. [Google Scholar] [CrossRef]
  94. Fenchel, T. Protozoan Filter Feeding. Prog. Protistol. 1986, 1, 65–113. [Google Scholar]
  95. Bernard, C.; Rassoulzadegan, F. Bacteria or Microflagellates as a Major Food Source for Marine Ciliates: Possible Implications for the Microzooplankton. Mar. Ecol. Prog. Ser. 1990, 64, 147–155. [Google Scholar] [CrossRef]
  96. Weisse, T. Functional Diversity of Aquatic Ciliates. Eur. J. Protistol. 2017, 61, 331–358. [Google Scholar] [CrossRef]
  97. Lu, X.; Gao, Y.; Weisse, T. Functional Ecology of Two Contrasting Freshwater Ciliated Protists in Relation to Temperature. J. Eukaryot. Microbiol. 2021, 68, e12823. [Google Scholar] [CrossRef] [PubMed]
  98. Weisse, T.; Jezberová, J.; Moser, M. Picoplankton Feeding by the Ciliate Vorticella similis in Comparison to Other Peritrichs Emphasizes Their Significance in the Water Purification Process. Ecol. Indic. 2021, 121, 106992. [Google Scholar] [CrossRef]
  99. Kammerlander, B.; Koinig, K.A.; Rott, E.; Sommaruga, R.; Tartarotti, B.; Trattner, F.; Sonntag, B. Ciliate Community Structure and Interactions within the Planktonic Food Web in Two Alpine Lakes of Contrasting Transparency. Freshw. Biol. 2016, 61, 1950–1965. [Google Scholar] [CrossRef]
  100. Foissner, W.; Wölfl, S. Revision of the Genus Stentor Oken (Protozoa, Ciliophora) and Description of S. araucanus Nov. Spec, from South American Lakes. J. Plankton Res. 1994, 16, 255–289. [Google Scholar] [CrossRef]
  101. Modenutti, B.E.; Balseiro, E.G.; Moeller, R. Vertical Distribution and Resistance to Ultraviolet Radiation of a Planktonic Ciliate, Stentor araucanus. SIL Proc. 1922-2010 1998, 26, 1636–1640. [Google Scholar] [CrossRef]
  102. Woelfl, S. The Distribution of Large Mixotrophic Ciliates (Stentor) in Deep North Patagonian Lakes (Chile): First Results. Limnologica 2007, 37, 28–36. [Google Scholar] [CrossRef]
  103. Pucciarelli, S.; Buonanno, F.; Pellegrini, G.; Pozzi, S.; Ballarini, P.; Miceli, C. Biomonitoring of Lake Garda: Identification of Ciliate Species and Symbiotic Algae Responsible for the “Black-Spot” Bloom during the Summer of 2004. Environ. Res. 2008, 107, 194–200. [Google Scholar] [CrossRef]
  104. Mašín, M.; Čuperová, Z.; Hojerová, E.; Salka, I.; Grossart, H.; Koblížek, M. Distribution of Aerobic Anoxygenic Phototrophic Bacteria in Glacial Lakes of Northern Europe. Aquat. Microb. Ecol. 2012, 66, 77–86. [Google Scholar] [CrossRef]
  105. Müller, H. Laboratory Study of the Life Cycle of a Freshwater Strombidiid Ciliate. Aquat. Microb. Ecol. 2002, 29, 189–197. [Google Scholar] [CrossRef]
  106. Stoecker, D.K.; Johnson, M.D.; de Vargas, C.; Not, F. Acquired Phototrophy in Aquatic Protists. Aquat. Microb. Ecol. 2009, 57, 279–310. [Google Scholar] [CrossRef]
  107. Schoener, D.; McManus, G. Plastid Retention, Use, and Replacement in a Kleptoplastidic Ciliate. Aquat. Microb. Ecol. 2012, 67, 177–187. [Google Scholar] [CrossRef]
  108. Müller, H.; Geller, W. Maximum Growth Rates of Aquatic Ciliated Protozoa: The Dependence on Body Size and Temperature Reconsidered. Arch. Hydrobiol. 1993, 126, 315–327. [Google Scholar] [CrossRef]
  109. Müller, H.; Weisse, T. Laboratory and Field Observations on the Scuticociliate Histiobalantium from the Pelagic Zone of Lake Constance, FRG. J. Plankton Res. 1994, 16, 391–401. [Google Scholar] [CrossRef]
  110. Chen, W.-L.; Chiang, K.-P.; Tsai, S.-F. Neglect of Presence of Bacteria Leads to Inaccurate Growth Parameters of the Oligotrich Ciliate Strombidium sp. During Grazing Experiments on Nanoflagellates. Front. Mar. Sci. 2020, 7, 569309. [Google Scholar] [CrossRef]
Figure 1. Three-week interval values and the annual- and stratification-mean of biological variables in the Slapy reservoir (the mean points are drawn on the last period day, either at the end of the year or the end of stratification). (a) Bacteria abundance; (b) HNF abundance; (c) Rhodomonas spp. abundance; (d) Chlorophyll a (Chl a) concentration. Vertical lines mark the limit of periods A (1994–2003) and B (2004–2018) with different nutrient (TP) load.
Diversity 16 00534 g001
Figure 2. Three-week interval values, and the annual- and stratification means of (a) ciliate abundance, and (b) corrected ciliate organic carbon biomass (the mean points are drawn on the last period day, either at the end of the year or the end of stratification); (c) the proportion of corrected ciliate biomass of feeding-behaviour groups in the Slapy reservoir. Vertical lines mark the limit of periods A (1994–2003) and B (2004–2018) with different nutrient (TP) load. Note that 1994 was not entirely sampled; thus, the annual mean could not be calculated.
Diversity 16 00534 g002
Figure 3. Results of non-metric multidimensional scaling (NMDS) divided according to periods A (1994–2003, black circles) and B (2004–2017, blue squares) based on explanatory variables (temperature, DO, TP < 40 µm, DIN, water age, Chl a, and ciliate prey abundances—bacteria, HNF and Rhodomonas spp.).
Diversity 16 00534 g003
Figure 4. Median and interquartile range data in the Slapy reservoir during periods A and B. Vertical lines mark the median and interquartile range of sampling days when the transition between mixing and stratification occurs. (a,b) Abundance of Rhodomonas spp. and HNF; (c,d) chlorophyll a concentrations (left axes) and abundances of bacteria (right axes). Criteria of Straškrábová et al. [66] of Chl a >5 μg/L, <7 μg/L, and <10 μg/L for the spring phytoplankton peak, a clear-water phase, and the end of summer phytoplankton peak, respectively, were applied.
Diversity 16 00534 g004
Figure 5. The median and interquartile range of the ciliates in the Slapy reservoir: abundance (left axes) and organic carbon biomass (right axes). (a,b) Sampling days during periods A and B. Vertical lines mark the median and interquartile range of sampling days when the transition between mixing and stratification occurs; (c,d) Sampling days are corrected to the stratification-start day; vertical lines represent the sampling day between mixing and stratification.
Diversity 16 00534 g005
Figure 6. The whole study ciliate carbon biomass plot vs. dissolved oxygen (DO) and temperature (T) during stratification and rest of the season.
Diversity 16 00534 g006
Figure 7. The median and interquartile range of heterotrophic nanoplankton-filtering ciliate organic carbon biomass and that of mixotrophic ones throughout this study. (a) Period A, 1994–2003, and (b) Period B, 2004–2018. Vertical lines mark the median of sampling days when the transition between mixing and stratification occurs.
Diversity 16 00534 g007
Figure 8. (a,b) The median and interquartile range of a sum of picoplankton-filtering ciliate organic carbon biomass throughout this study and that of halteriids with minute strobilidiids and solitary peritrichs. Vertical lines mark the median of sampling days when the transition between mixing and stratification occurs.
Diversity 16 00534 g008
Figure 9. (a,b) The median and interquartile range of a sum of algae hunting organic carbon biomass throughout this study and that of the genus Urotricha and B. planctonicum. Vertical lines define the median of transition sampling between mixing and stratification. Vertical lines mark the median of sampling days when the transition between mixing and stratification occurs.
Diversity 16 00534 g009
Figure 10. (a,b) The median and interquartile range of a corrected sum of raptorial and flagellate-hunting ciliates’ organic carbon biomass throughout this study; a sum of genera Askenasia with Rhabdoaskenasia and Mesodinium sp. Vertical lines mark the median of sampling days when the transition between mixing and stratification occurs.
Diversity 16 00534 g010
Figure 11. Results of non-metric multidimensional scaling (NMDS) divided according to periods (a) A (1994–2003) and (b) B (2004–2017) based on ciliate functional groups (as carbon biomass).
Diversity 16 00534 g011
Figure 12. (a,b) The median and interquartile range of ciliate organic carbon biomass of sums of heterotrophic and mixotrophic species (with zoochlorellae or kleptoplasts) during periods A and B. Vertical lines mark the median of sampling days when the transition between mixing and stratification occurs.
Diversity 16 00534 g012
Figure 13. Median biomass of the analysed groups during periods A and B. (a,b) Ciliates filtering picoplankton (bacterivorous and omnivorous) and nanoplankton (feeding mainly photosynthetic and heterotrophic flagellates), which are heterotrophic and mixotrophic; (c,d) Nanoplankton hunting ciliates, both algae- and flagellate hunting, and other raptorial ciliates. Vertical lines mark the median of sampling days when the transition between mixing and stratification occurs.
Diversity 16 00534 g013
Table 1. Feeding-behaviour grouping of ciliates and their taxonomical position (for images of representative ciliates from the respective groups, see the Supplementary Material section).
Feeding BehaviourFamilyGenus/Species
Heterotrophic nanoplankton filtering
HF
Figure S1
Strobilidiidae Kahl in Doflein and Reichenow 1929Rimostrombidium lacustris (Foissner, Skogstad, and Pratt, 1988)
Tintinnidiidae Kofoid and Campbell 1929Tintinnidium spp.
Codonellidae Kent, 1881Codonella cratera Leidy, 1887
Incertae sedis Tintinnina Kofoid and Campbell 1929Tintinnopsis spp.
Mixotrophic nanoplankton filtering
MF
Figure S1
Pelagostrombidiidae Agatha 2004Pelagostrombidium spp.
Limnostrombidium spp.
Strobilidiidae Kahl in Doflein and Reichenow 1929Rimostrombidium velox (Faurè-Fremiet, 1924)
Picoplankton
filtering
PF
Figure S2
Halteriidae Claparède and Lachmann 1858Halteria grandinella (Müller, 1773)
Halteria—mixotrophic
Pelagohalteria viridis (Fromentel, 1876)—mixotrophic
Strobilidiidae Kahl in Doflein and Reichenow 1929Rimostrombidium brachykinetum Krainer, 1995
Rimostrombidium humile (Penard, 1922)
Rimostrombidium—mixotrophic
Vorticellidae Ehrenberg 1838Vorticella—minute
Vorticella—large
Vorticella aqua-dulcis-complex Stokes, 1887
Vorticella mayeri Faure-Fremiet, 1920
Zoothamniidae Sommer, 1951Pseudohaplocaulus sp.
Astylozoidae Kahl 1935Astylozoon sp.
Hastatella sp.
Trichodinidae Claus 1874Trichodina cf. diaptomi Basson and Van As, 1991
Cinetochilidae Perty 1852Cinetochilum margaritaceum Perty, 1852
Cyclidiidae Ehrenberg 1838Cyclidium spp.
other minute scuticociliates
Algae-hunting
AH
Figure S3
Balanionidae Small and Lynn 1985Balanion planctonicum (Foissner, Oleksiv and Müller, 1990)
Urotrichidae Small and Lynn 1985Urotricha~10 µm
Urotricha globosa Schewiakoff, 1892
Urotricha furcata Schewiakoff, 1892
Urotricha pseudofurcata Krainer 1995
Urotricha pelagica Kahl, 1932
Urotricha castalia Muñoz, Tellez, and Fernandez-Galiano, 1987
Histiobalantiidae de Puytorac and Corliss in Corliss 1979Histiobalantium spp.
Chilodonellidae Deroux 1970Phascolodon vorticella Stein, 1859
Trithigmostoma sp.
Raptorial and
flagellate-hunting
RH
Figure S4
Colepidae Ehrenberg 1838Coleps spp.
Actinobolinidae Kahl 1930Actinobolina spp.
Enchelyidae Ehrenberg 1838Enchelys spp.
Trachelophyllidae Kent 1882Lagynophrya spp.—heterotrophic/mixotrophic
Didiniidae Poche 1913Monodinium spp.—minute
Incertae sedis CON-threePAskenasia chlorelligera Krainer and Foissner, 1990
Askenasia volvox (Penard 1922)
Askenasia spp.—minute
Askenasia spp.—large
Rhabdoaskenasia minima Krainer and Foissner, 1990
Incertae sedis SALMesodinium spp.
Litonotus spp.—minute
Large-cell but low-abundance ciliates
LCLA
Epistylididae Kahl 1933Epistylis spp.—pelagic, colonial
Stentoridae Carus 1863Stentor sp.
Holophryidae Perty 1852Holophrya spp.
Cyclotrichiidae Jankowski 1980Cyclotrichium sp.
Lacrymariidae de Fromentel 1876Lacrymaria spp.
Dileptidae Jankowski 1980Pelagodileptus spp.
Didiniidae Poche 1913Monodinium spp.—large mixotrophic
Disclaimer/Publisher’s Note: The statements, opinions and data contained in all publications are solely those of the individual author(s) and contributor(s) and not of MDPI and/or the editor(s). MDPI and/or the editor(s) disclaim responsibility for any injury to people or property resulting from any ideas, methods, instructions or products referred to in the content.

