
Pan Trapping and Malaise Trapping: A Comparison of Bee Collection Techniques in Subalpine Meadows

 ,
,
Abstract
1. Introduction
2. Materials and Methods
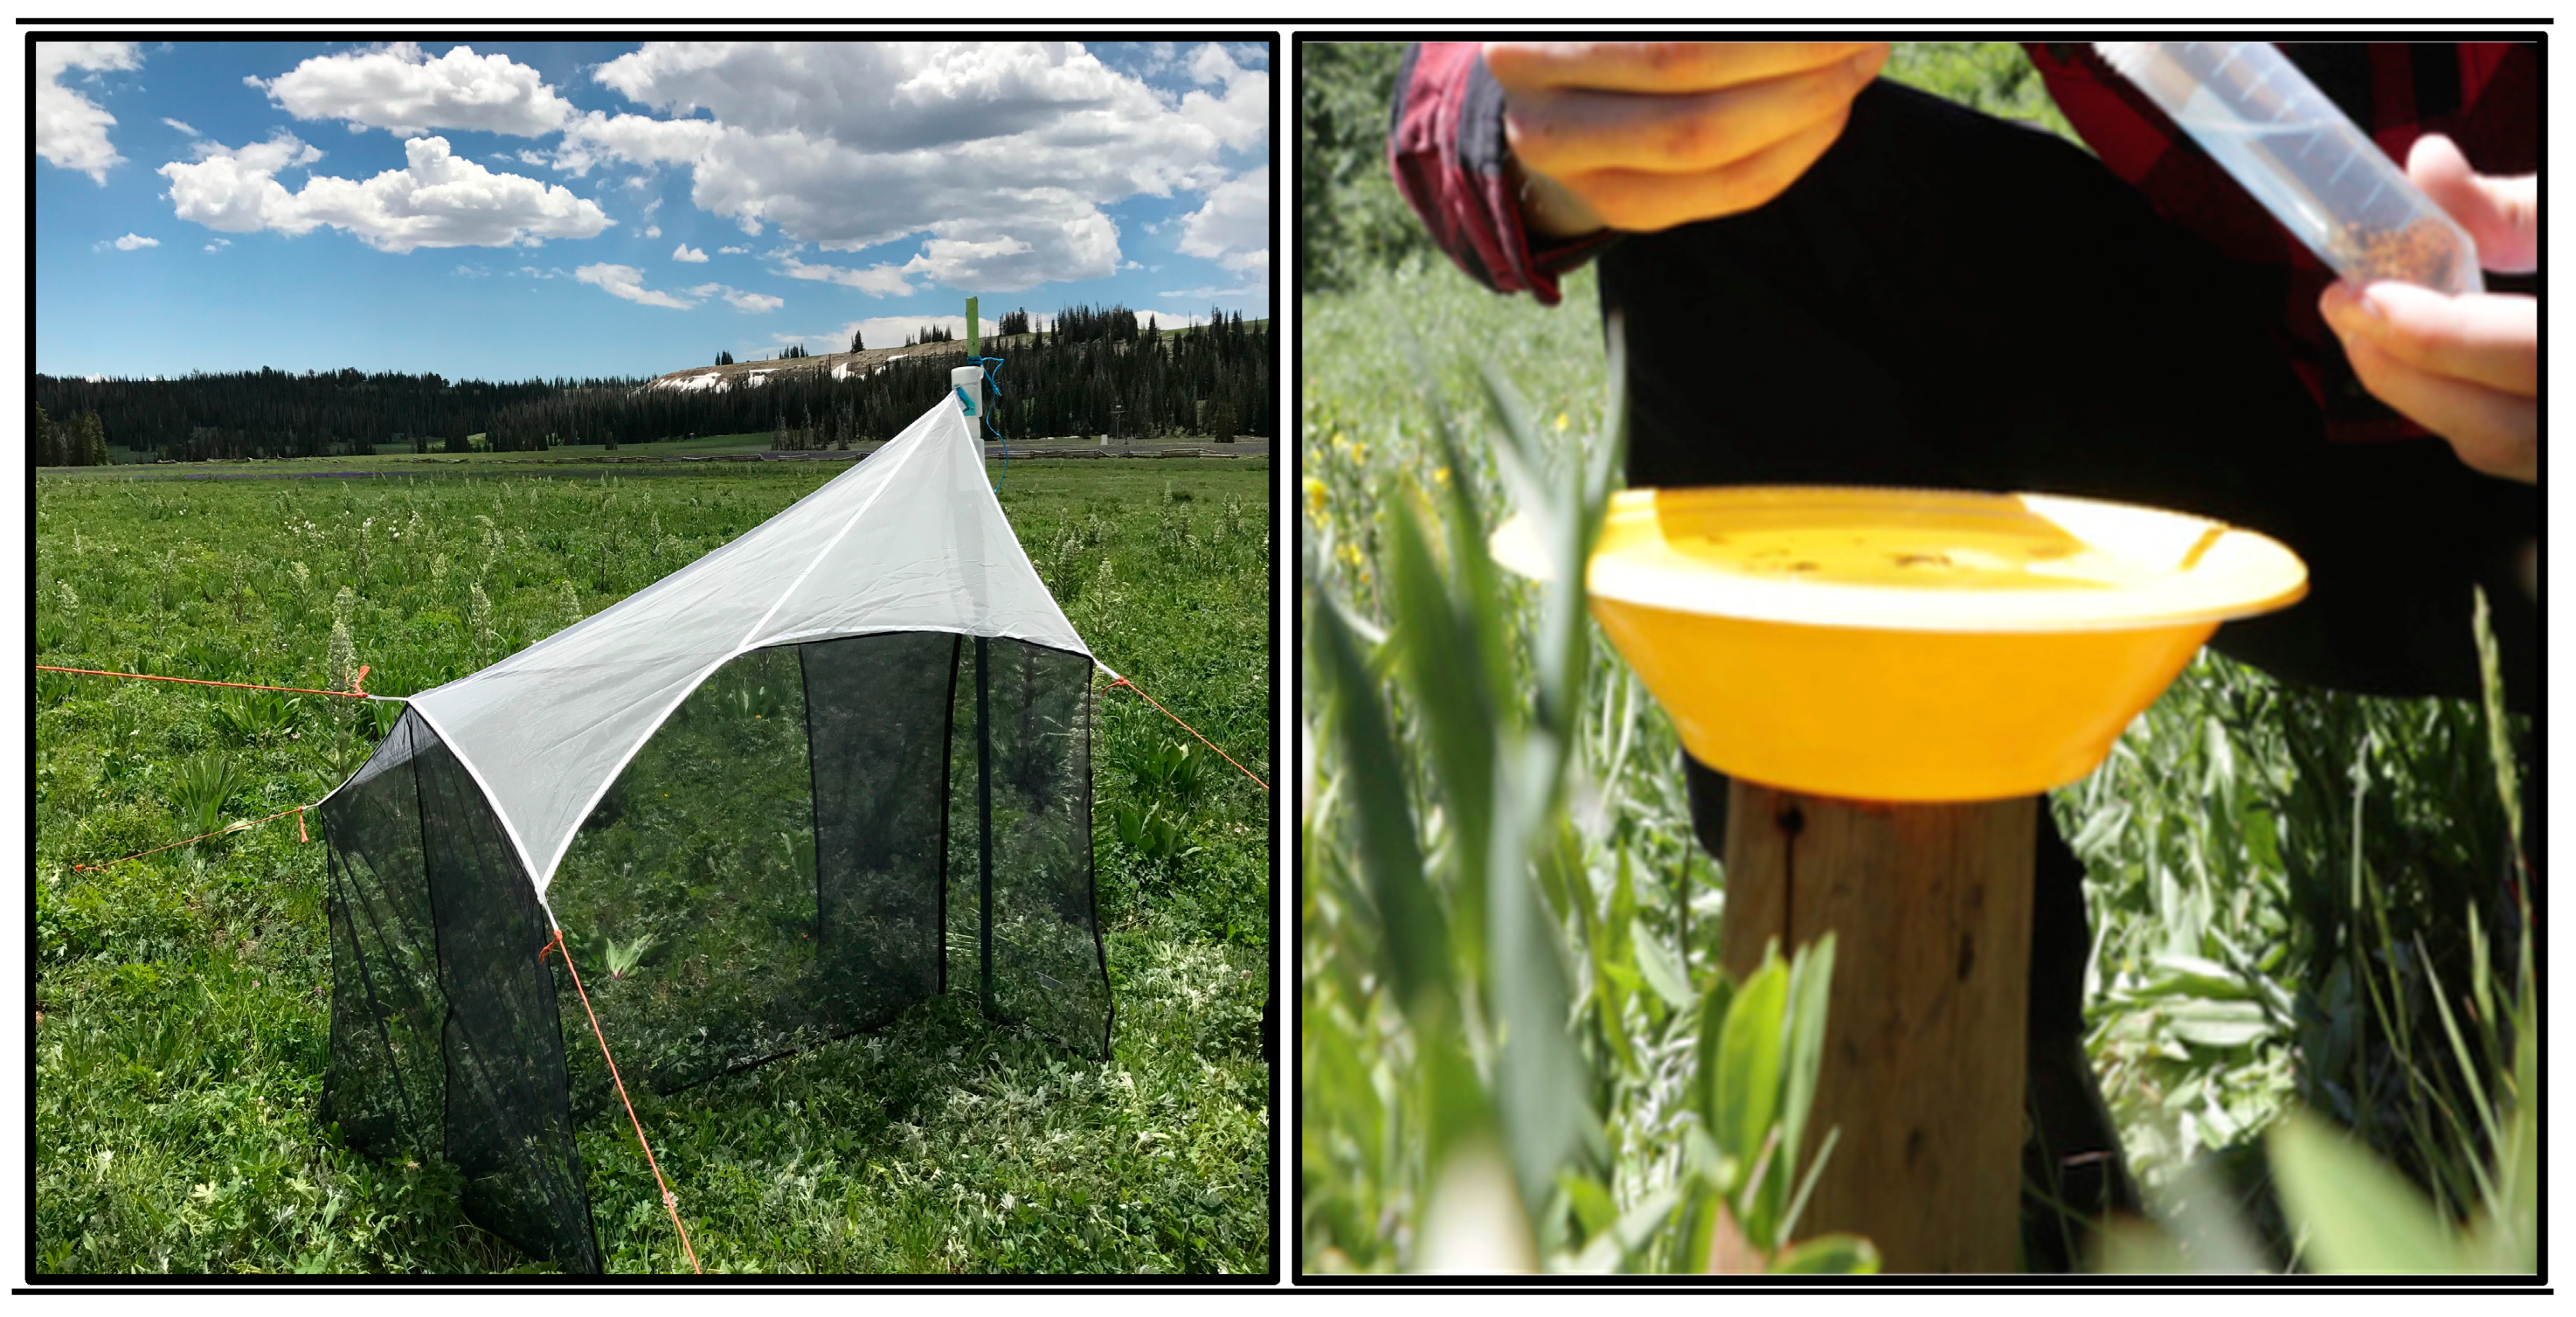
2.1. Study Design
2.2. Identification
2.3. Data Analysis
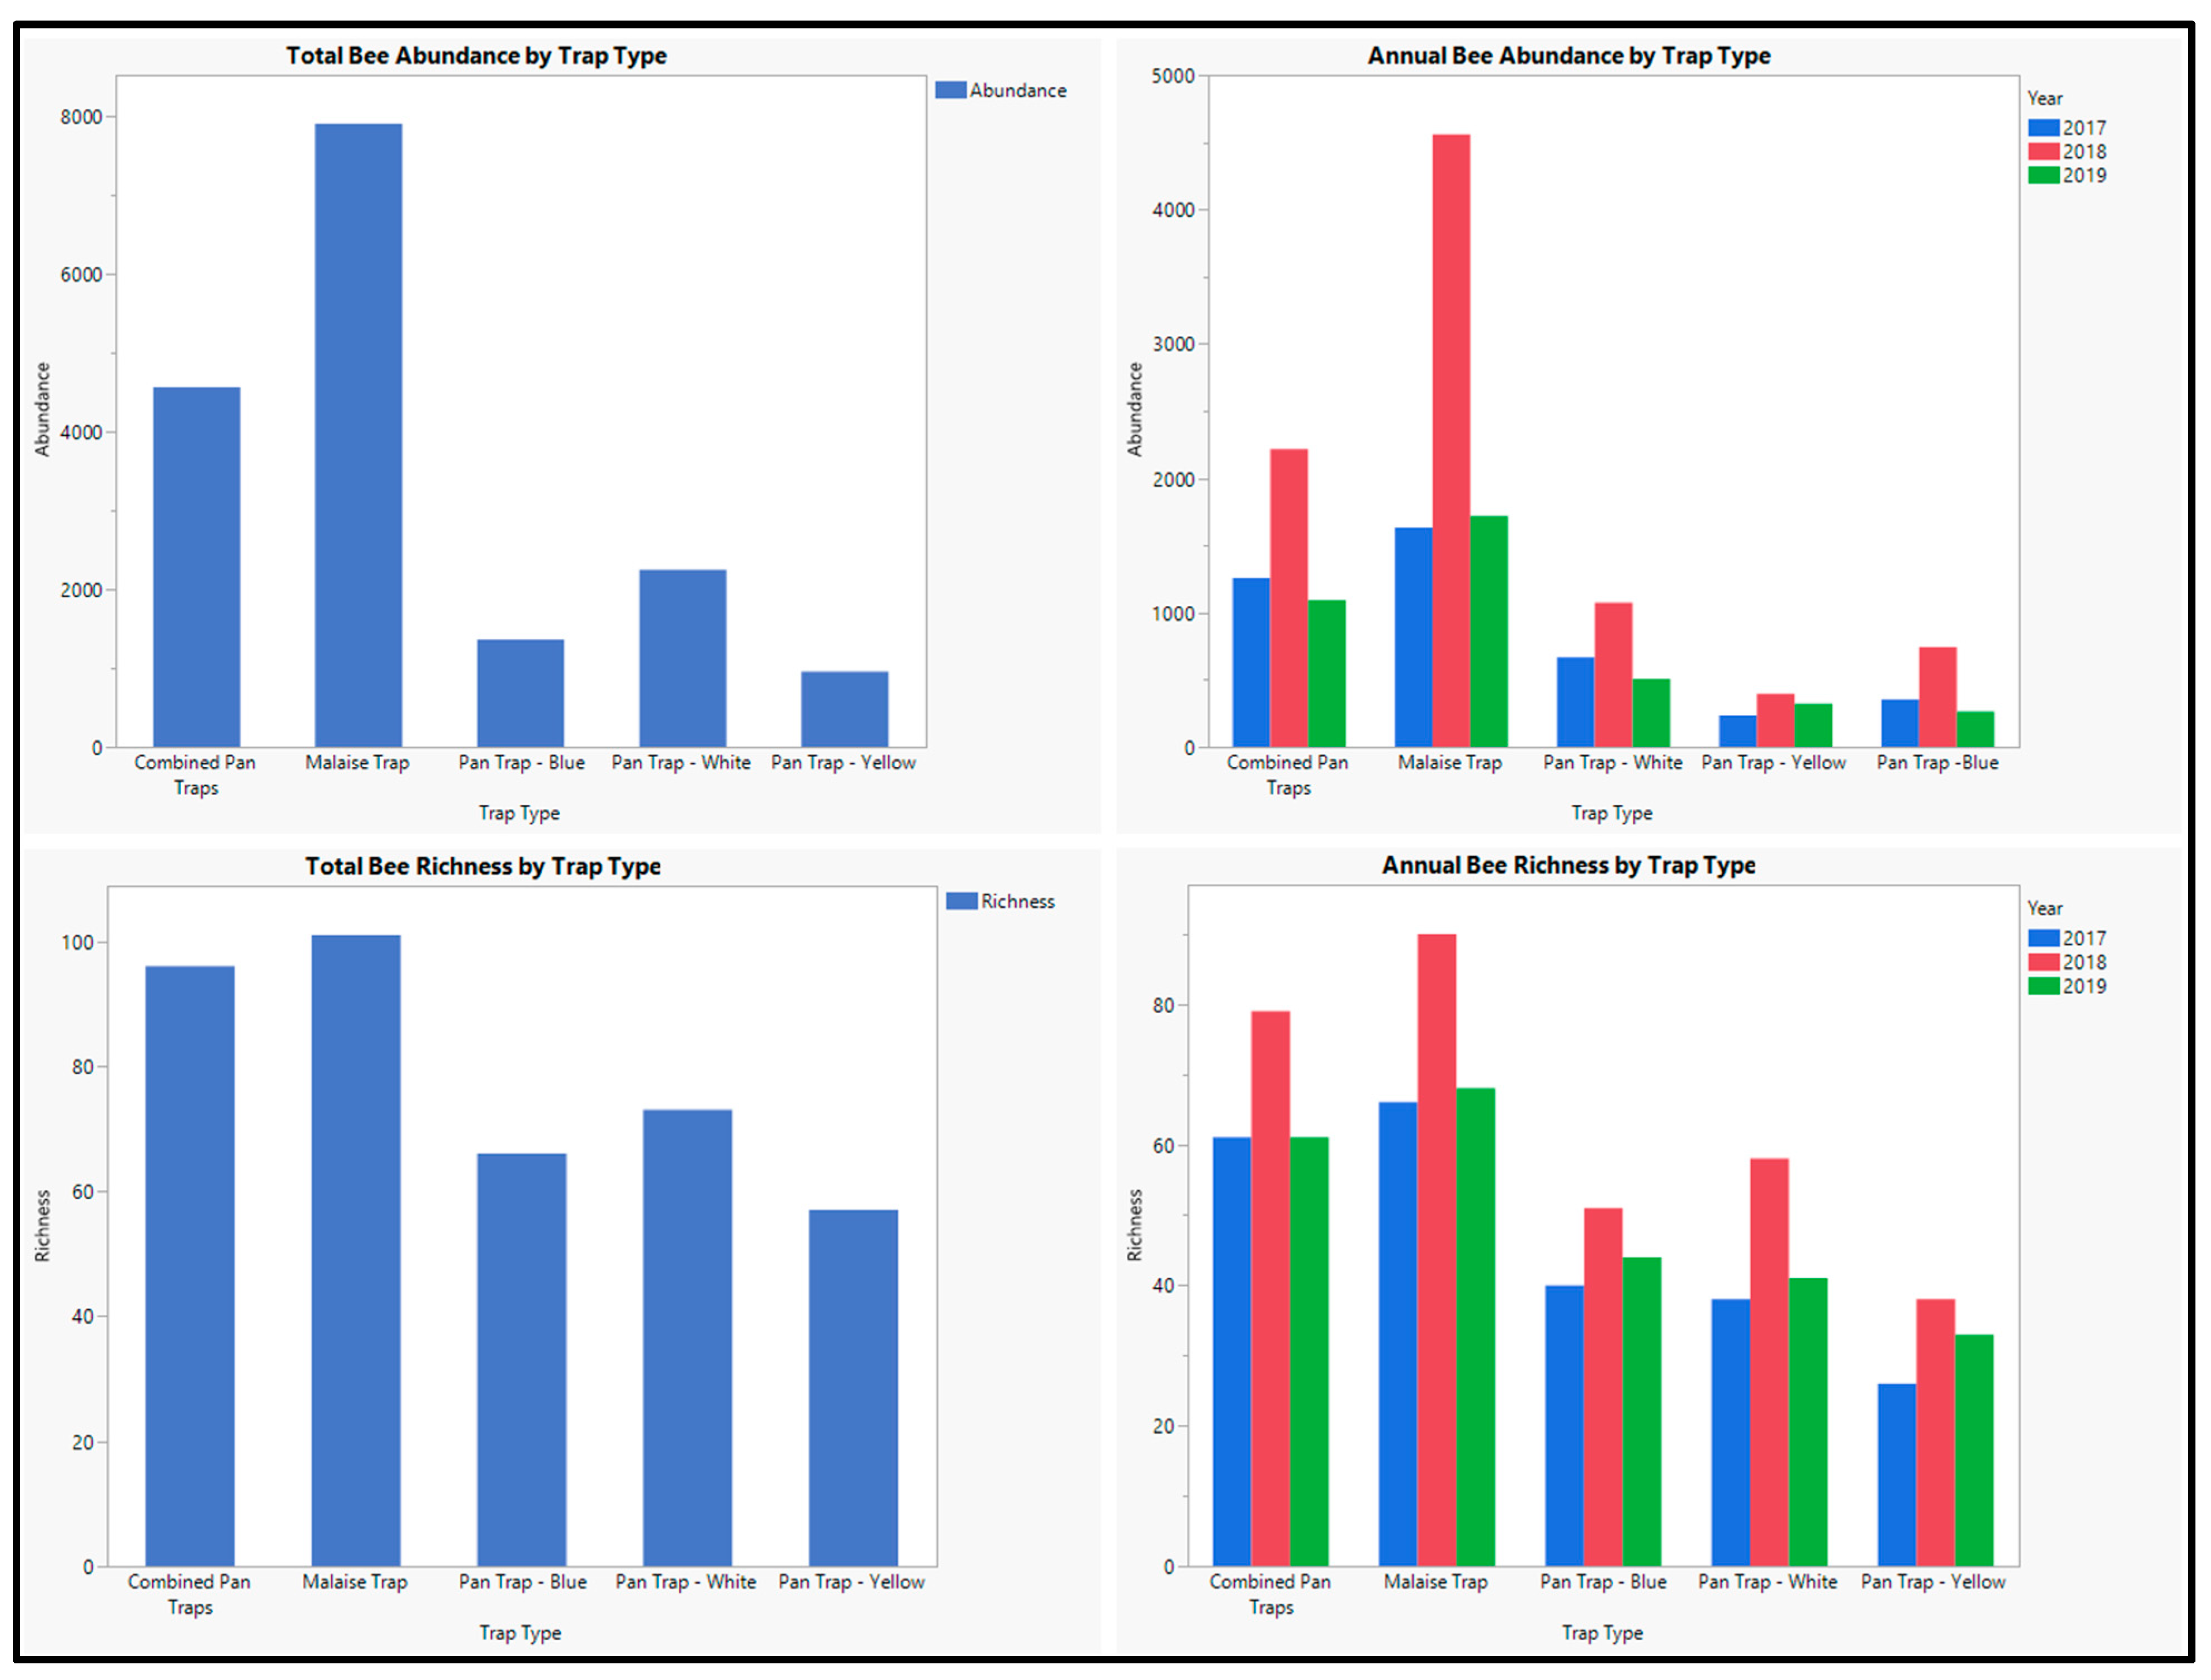
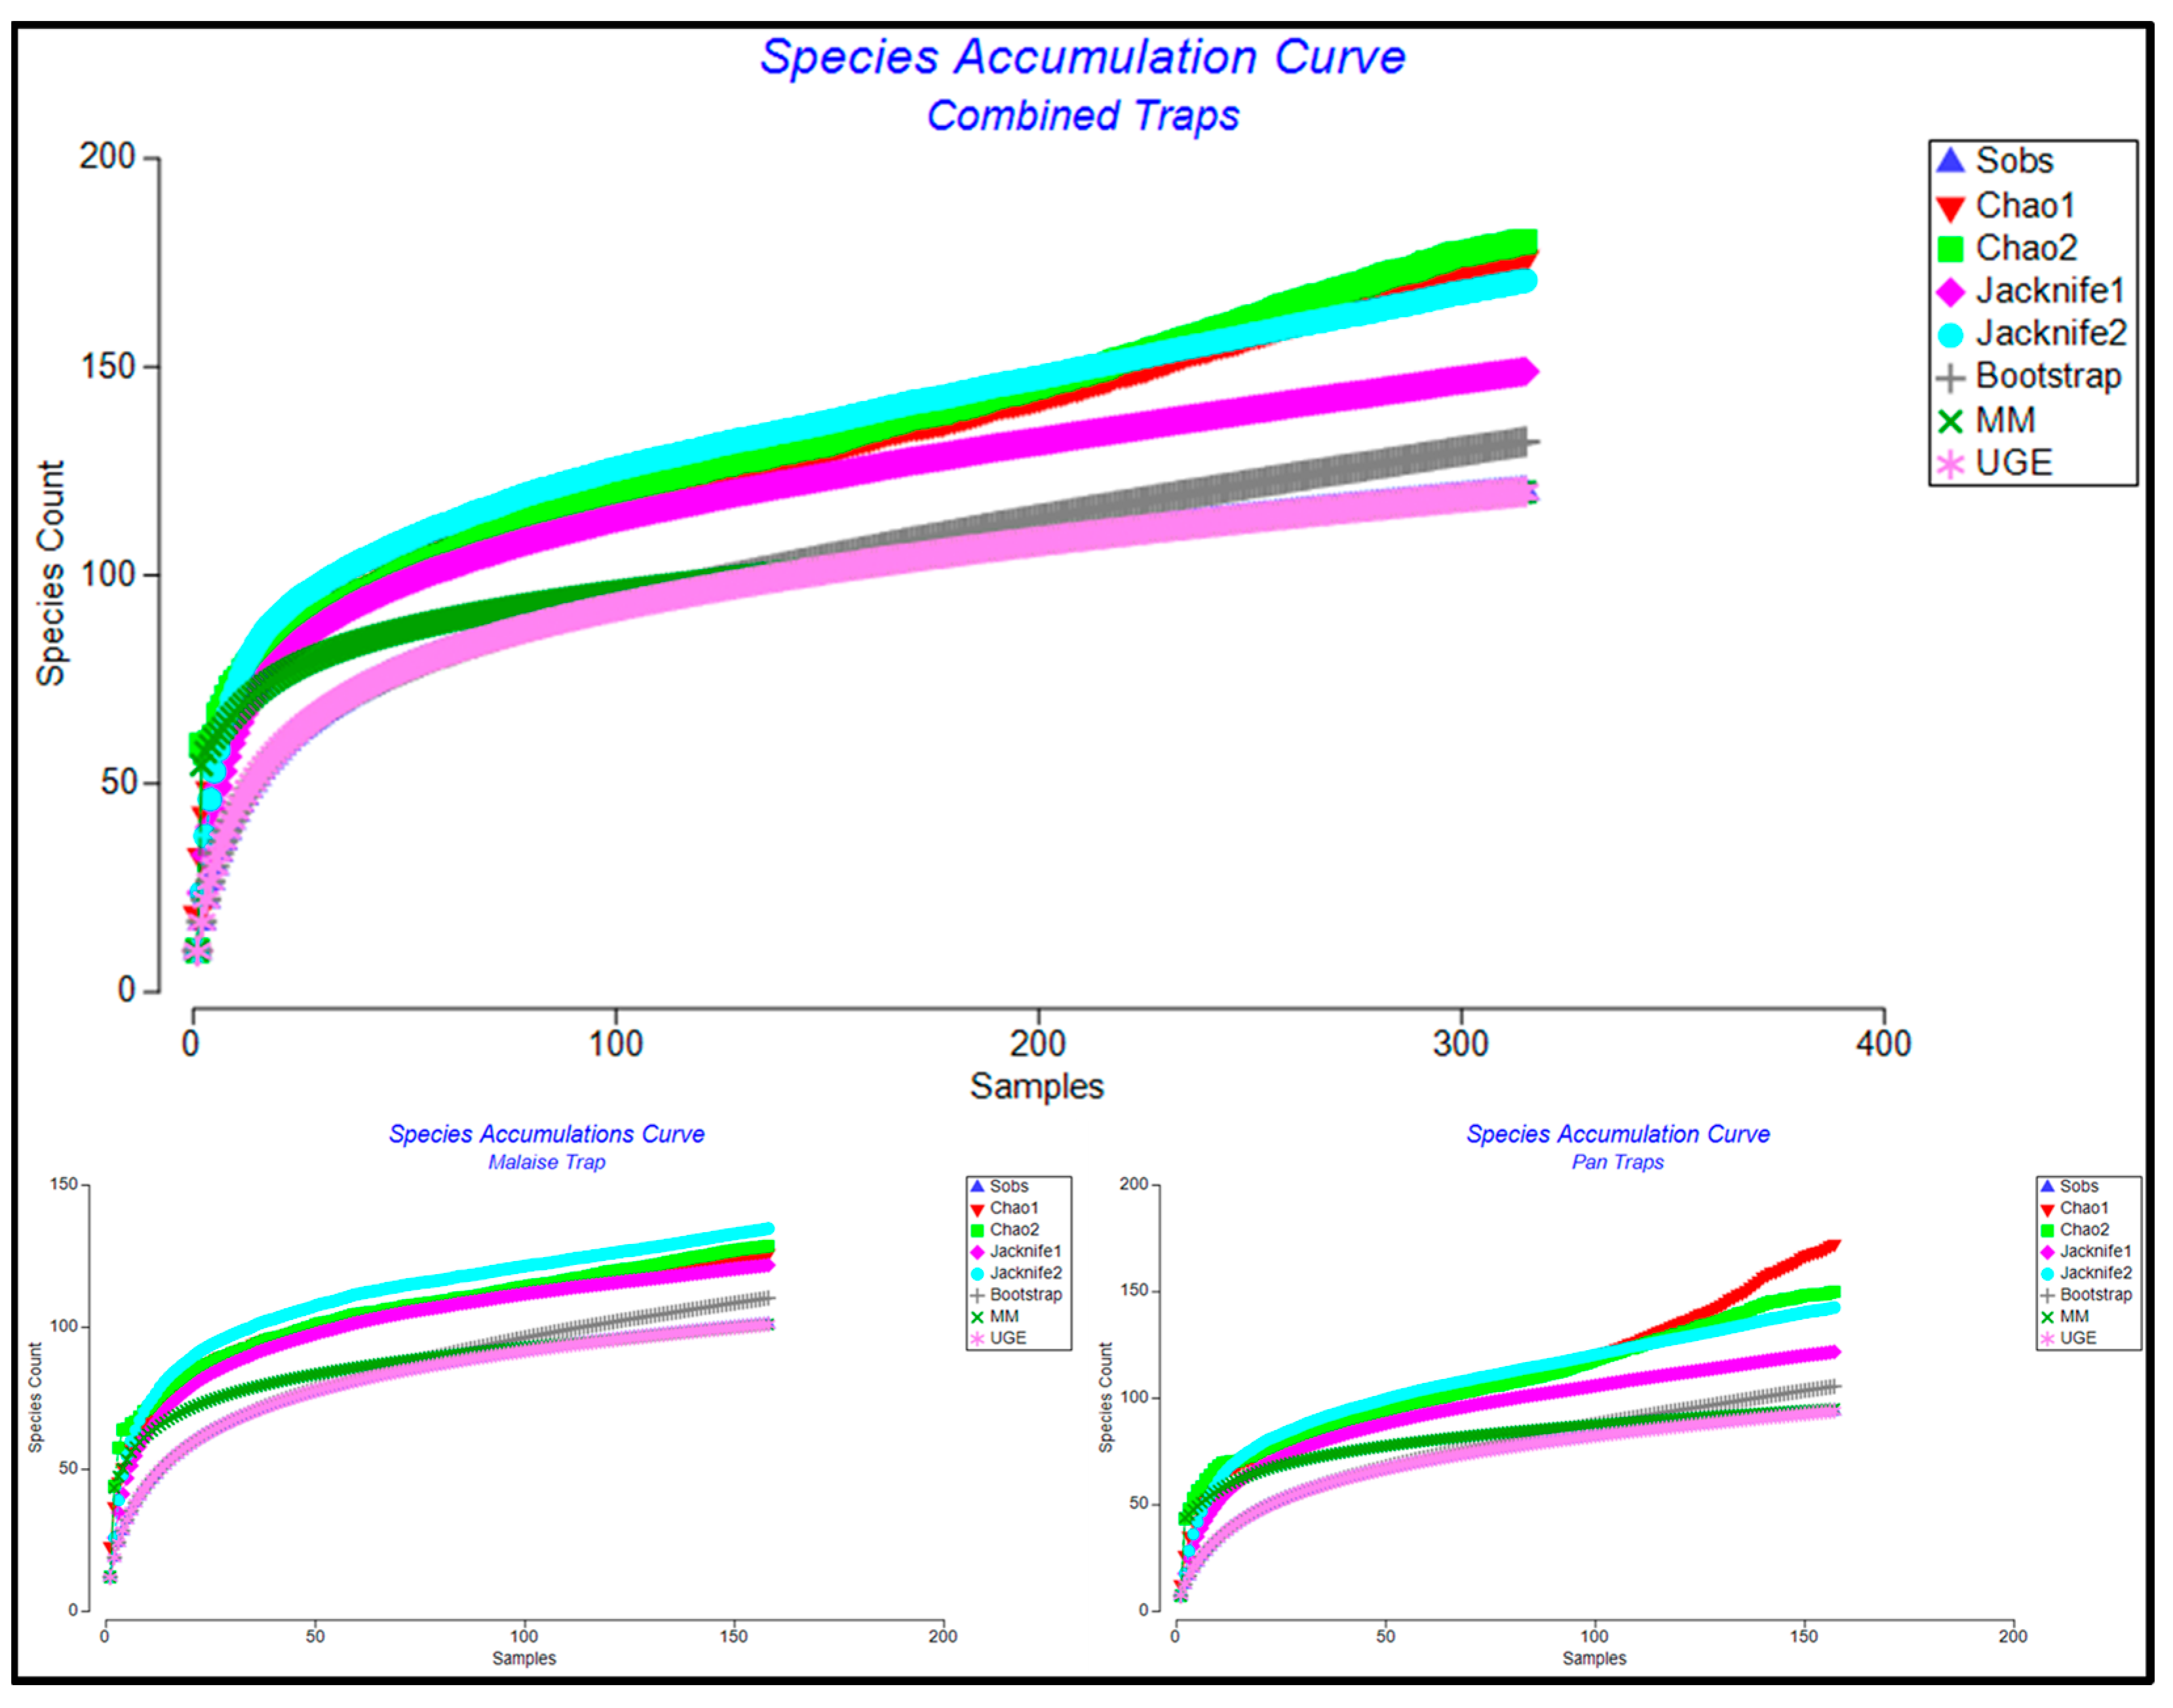
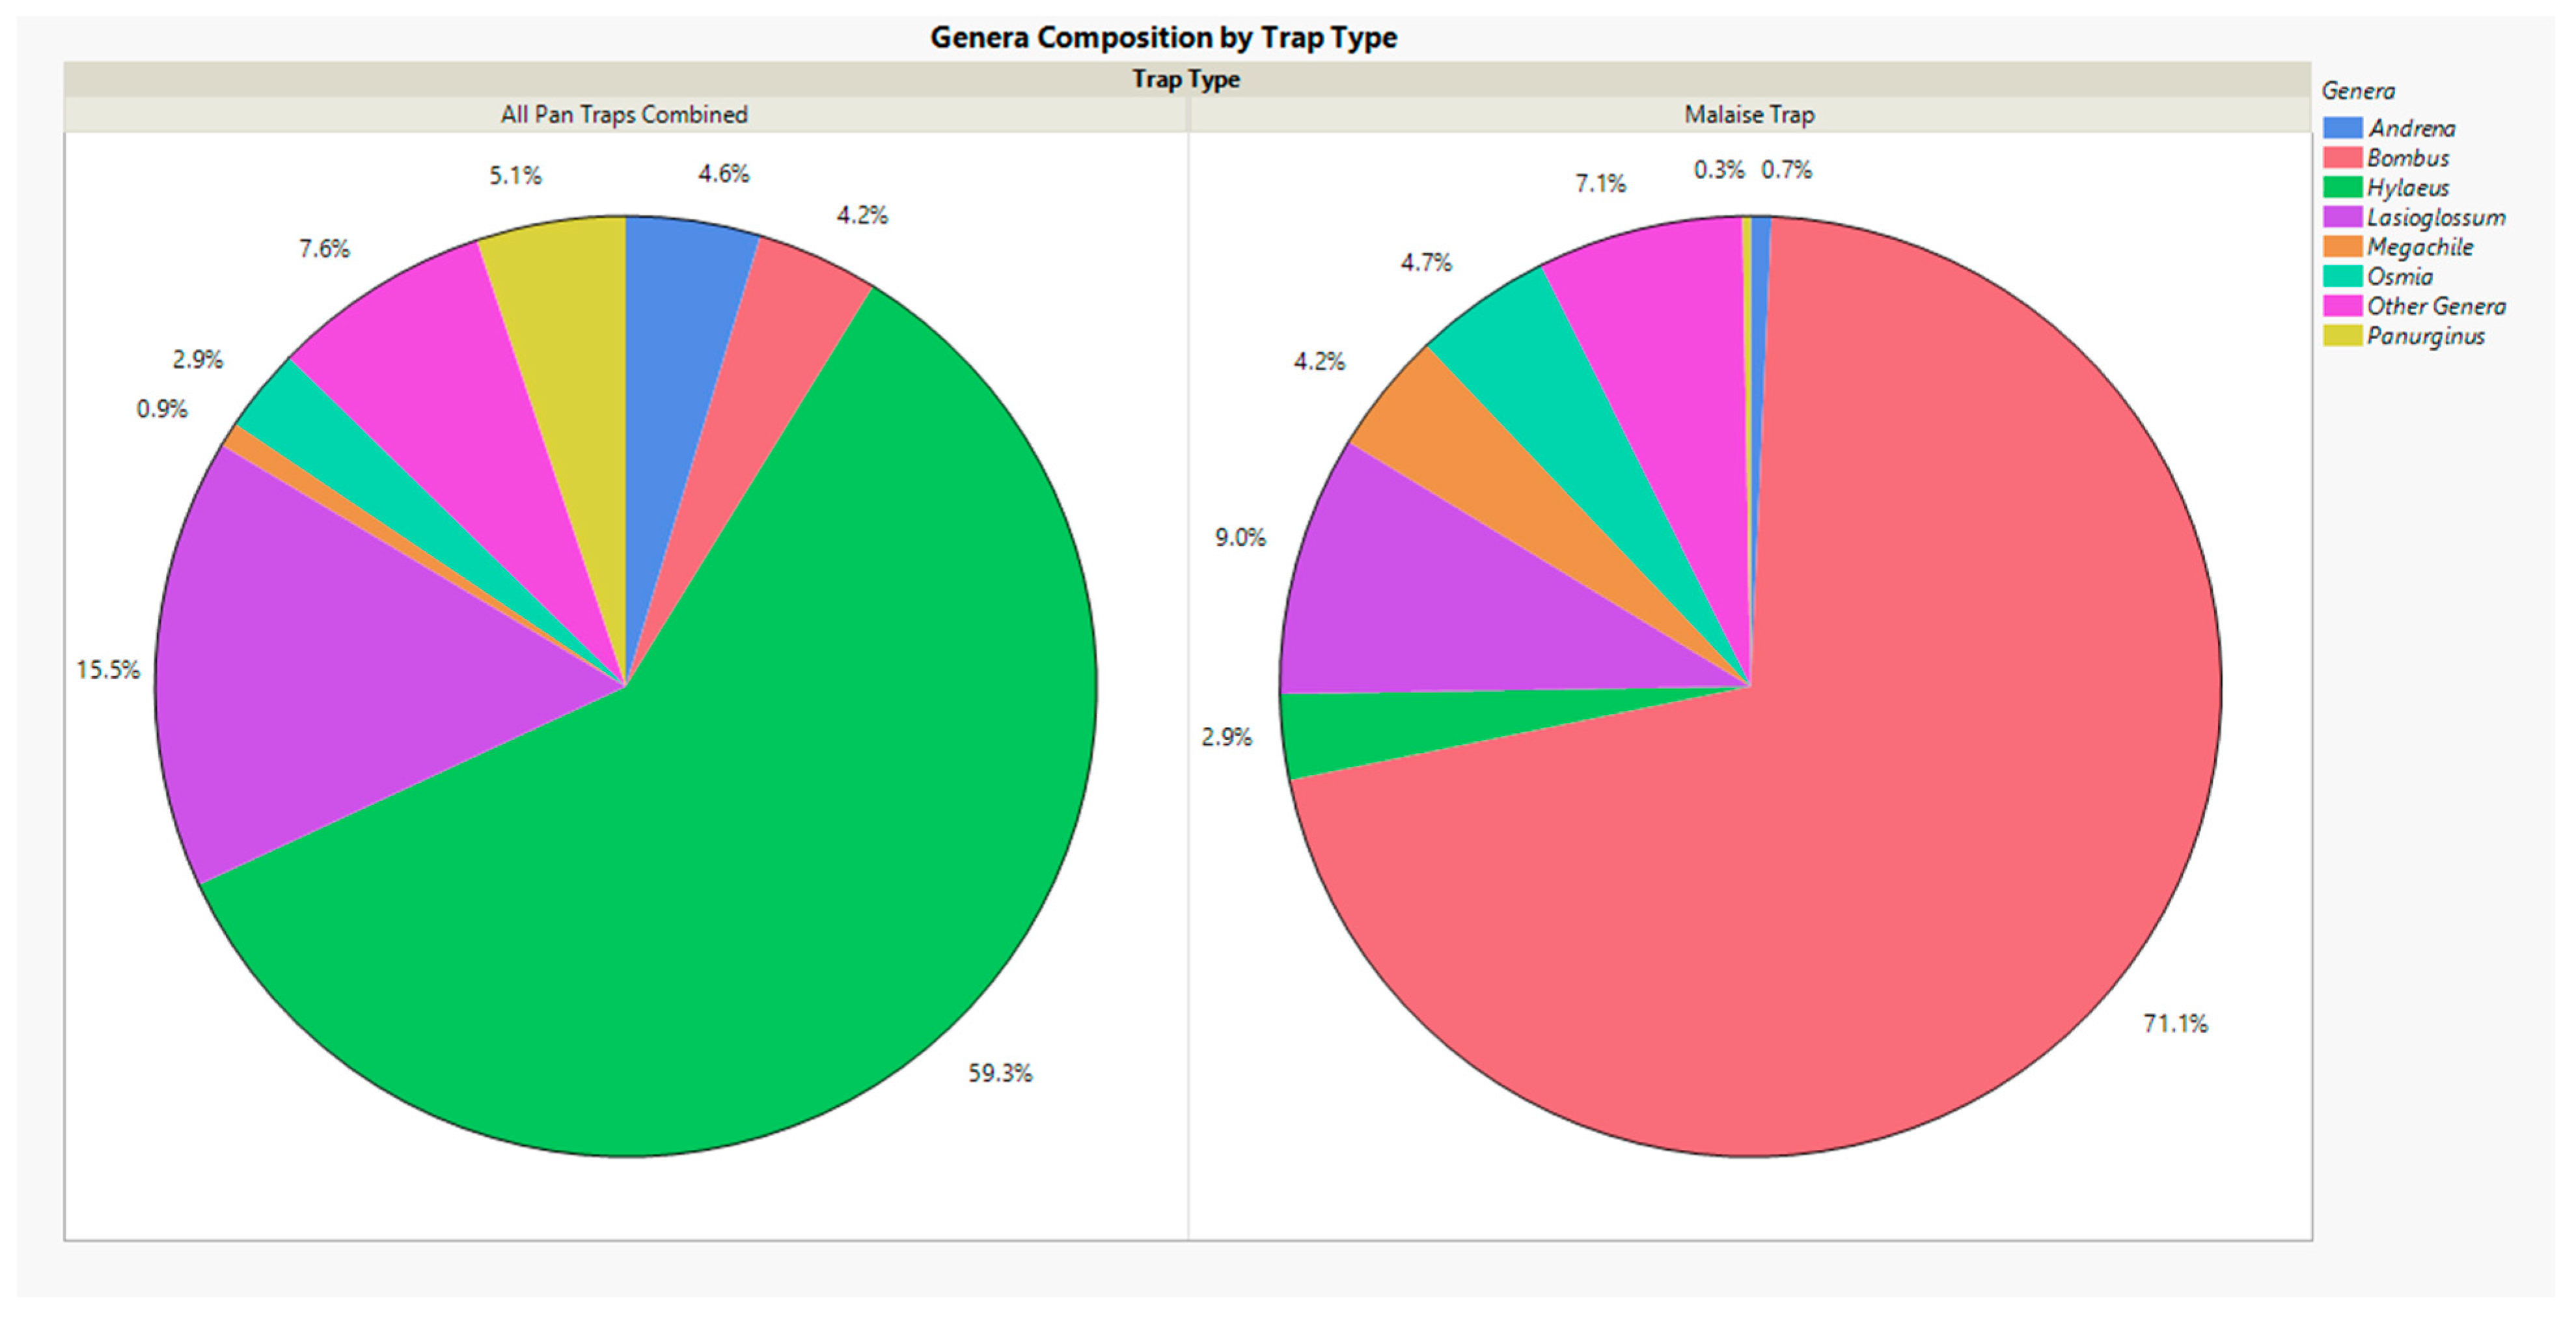
3. Results
4. Discussion
5. Conclusions
Author Contributions
Funding
Data Availability Statement
Acknowledgments
Conflicts of Interest
References
- Goulson, D.; Nicholls, E.; Botías, C.; Rotheray, E.L. Bee declines driven by combined stress from parasites, pesticides, and lack of flowers. Science 2015, 347, 1255957. [Google Scholar] [CrossRef]
- Potts, S.G.; Biesmeijer, J.C.; Kremen, C.; Neumann, P.; Schweiger, O.; Kunin, W.E. Global pollinator declines: Trends, impacts and drivers. Trends Ecol. Evol. 2010, 25, 345–353. [Google Scholar] [CrossRef] [PubMed]
- Drossart, M.; Gérard, M. Beyond the Decline of Wild Bees: Optimizing Conservation Measures and Bringing Together the Actors. Insects 2020, 11, 649. [Google Scholar] [CrossRef]
- Aldercotte, A.H.; Simpson, D.T.; Winfree, R. Crop visitation by wild bees declines over an 8-year time series: A dramatic trend, or just dramatic between-year variation? Insect Conserv. Divers. 2022, 15, 522–533. [Google Scholar] [CrossRef]
- Ulyshen, M.; Horn, S. Declines of bees and butterflies over 15 years in a forested landscape. Curr. Biol. 2023, 33, 1346–1350. [Google Scholar] [CrossRef]
- Graves, T.A.; Janousek, W.M.; Gaulke, S.M.; Nicholas, A.C.; Keinath, D.A.; Bell, C.M.; Cannings, S.; Hatfield, R.G.; Heron, J.M.; Koch, J.B.; et al. Western bumble bee: Declines in the continental United States and range-wide information gaps. Ecosphere 2020, 11, e03141. [Google Scholar] [CrossRef]
- LeBuhn, G.; Vargas Luna, J. Pollinator decline: What do we know about the drivers of solitary bee declines? Curr. Opin. Insect Sci. 2021, 46, 106–111. [Google Scholar] [CrossRef] [PubMed]
- Formentin, G.E. Global bee population decline: A summary of the literature. Air Qual. Clim. Chang. 2022, 56, 42–45. [Google Scholar]
- Hamblin, A.L.; Youngsteadt, E.; Frank, S.D. Wild bee abundance declines with urban warming, regardless of floral density. Urban Ecosyst. 2018, 21, 419–428. [Google Scholar] [CrossRef]
- Pereira, F.W.; Carneiro, L.; Gonçalves, R.B. More losses than gains in ground-nesting bees over 60 years of urbanization. Urban Ecosyst. 2020, 24, 233–242. [Google Scholar] [CrossRef]
- Cane, J.H.; Tepedino, V.J. Causes and extent of declines among native North American invertebrate pollinators: Detection, evidence, and consequences. Conserv. Ecol. 2001, 5, 1–9. [Google Scholar]
- Pollinator Health Task Force. Pollinator Partnership Action Plan. The White House. 2016. Available online: https://obamawhitehouse.archives.gov/sites/whitehouse.gov/files/images/Blog/PPAP_2016.pdf (accessed on 28 June 2019).
- Gibbs, J.; Joshi, N.K.; Wilson, J.K.; Rothwell, N.L.; Powers, K.; Haas, M.; Gut, L.; Biddinger, D.J.; Isaacs, R. Does Passive Sampling Accurately Reflect the Bee (Apoidea: Bee) Communities Pollinating Apple and Sour Cherry Orchards? Environ. Entomol. 2017, 46, 579–588. [Google Scholar] [CrossRef] [PubMed]
- Schlueter, M.A.; Stewart, N.G. Native Bee (Hymenoptera: Apoidea) Abundance and Diversity in North Georgia Apple Orchards Throughout the 2010 Growing Season (March to October). Southeast. Nat. 2015, 14, 721–739. [Google Scholar] [CrossRef]
- Rhoades, P.; Griswold, T.; Waits, L.; Bosque-Pérez, N.A.; Kennedy, C.M.; Eigenbrode, S.D. Sampling technique affects detection of habitat factors influencing wild bee communities. J. Insect Conserv. 2017, 21, 703–714. [Google Scholar] [CrossRef]
- Wheelock, M.J.; O’Neal, M.E. Insect pollinators in Iowa cornfields: Community identification and trapping method analysis. PLoS ONE 2016, 11, e0143479. [Google Scholar] [CrossRef]
- Droege, S.; Tepedino, V.J.; Lebuhn, G.; Link, W.; Minckley, R.L.; Chen, Q.; Conrad, C. Spatial patterns of bee captures in North American bowl trapping surveys. Insect Conserv. Divers. 2010, 3, 15–23. [Google Scholar] [CrossRef]
- Campbell, J.W.; Hanula, J.L. Efficiency of Malaise traps and colored pan traps for collecting flower visiting insects from three forested ecosystems. J. Insect Conserv. 2007, 11, 399–408. [Google Scholar] [CrossRef]
- McCravy, K.W.; Ruholl, J.D. Bee (Hymenoptera: Apoidea) Diversity and Sampling Methodology in a Midwestern USA Deciduous Forest. Insects 2017, 8, 81. [Google Scholar] [CrossRef]
- Templ, B.; Mózes, E.; Templ, M.; Földesi, R.; Szirák, Á.; Báldi, A.; Kovács-Hostyánszki, A. Habitat-dependency of transect walk and pan trap methods for bee sampling in farmlands. J. Apic. Sci. 2019, 63, 93–115. [Google Scholar] [CrossRef]
- Carril, O.M.; Griswold, T.; Haefner, J.; Wilson, J.S. Wild bees of Grand Staircase-Escalante National Monument: Richness, abundance, and spatio-temporal beta-diversity. PeerJ 2018, 6, e5867. [Google Scholar] [CrossRef]
- Krahner, A.; Schmidt, J.; Maixner, M.; Porten, M.; Schmitt, T. Evaluation of four different methods for assessing bee diversity as ecological indicators of agro-ecosystems. Ecol. Indic. 2021, 12, 1075735. [Google Scholar] [CrossRef]
- Lindström, S.; Herbertsson, L.; Rundlöf, M.; Bommarco, R.; Smith, H.G. Experimental evidence that honeybees depress wild insect densities in a flowering crop. Proc. R. Soc. B: Biol. Sci. 2016, 283. [Google Scholar] [CrossRef]
- Townes, H. A light-weight Malaise trap. Entomol. News 1972, 83, 239–247. [Google Scholar]
- Koch, J.; Strange, J.; Williams, P. Bumble Bees of the Western United States; Stritch, L., Adams, L.D., Eds.; Pollinator Partnership: San Francisco, CA, USA, 2012; pp. 1–143. [Google Scholar]
- JMP, Version 17.2.0; SAS Institute Inc.: Cary, NC, USA, 2023.
- R Core Team. R: A Language and Environment for Statistical Computing; R Foundation for Statistical Computing: Vienna, Austria, 2021. [Google Scholar]
- Clarke, K.R.; Gorley, R.N. PRIMER v7: User Manual/Tutorial; PRIMER-E: Plymouth, MA, USA, 2006. [Google Scholar]
- Curtis, J.T. The Vegetation of Wisconsin: An Ordination of Plant Communities; University of Wisconsin Press: Madison, WI, USA, 1959; p. 657. [Google Scholar]
- Geroff, R.K.; Gibbs, J.; McCravy, K.W. Assessing bee (Hymenoptera: Apoidea) diversity of an Illinois restored tallgrass prairie: Methodology and conservation considerations. J. Insect Conserv. 2014, 18, 951–964. [Google Scholar] [CrossRef]
- Bartholomew, C.S.; Prowell, D. Pan Compared to Malaise Trapping for Bees (Hymenoptera: Apoidea) in a Longleaf Pine Savanna. J. Kans. Entomol. Soc. 2005, 78, 390–392. [Google Scholar] [CrossRef]
- Acharya, R.S.; Leslie, T.; Fitting, E.; Burke, J.; Loftin, K.; Joshi, N.K. Color of pan trap influences sampling of bees in livestock pasture ecosystem. Biology 2021, 10, 445. [Google Scholar] [CrossRef]
- Munyuli, M.B.T. Is pan-trapping the most reliable sampling method for measuring and monitoring bee biodiversity in agroforestry systems in sub-Saharan Africa? Int. J. Trop. Insect Sci. 2013, 33, 14–37. [Google Scholar]
- Cane, J.H.; Minckley, R.L.; Kervin, L.J. Sampling Bees (Hymenoptera: Apiformes) for Pollinator Community Studies: Pitfalls of Pan-Trapping. J. Kans. Entomol. Soc. 2000, 73, 225–231. [Google Scholar]
- Zameeroddin; Belavadi, V.V. Efficiency of hand net and Pan trap for collecting pollinators. J. Exp. Zool. India 2020, 23, 1259–1264. [Google Scholar]
- Joshi, N.K.; Leslie, T.; Rajotte, E.G.; Kammerer, M.A.; Otieno, M.; Biddinger, D.J. Comparative trapping efficiency to characterize bee abundance, diversity, and community composition in apple orchards. Ann. Entomol. Soc. Am. 2015, 108, 785–799. [Google Scholar] [CrossRef]
- Westerberg, L.; Berglund, H.; Jonason, D.; Milberg, P. Color pan traps often catch less when there are more flowers around. Ecol. Evol. 2021, 11, 3830–3840. [Google Scholar] [CrossRef]
- Chittka, L.; Raine, N.E. Recognition of flowers by pollinators. Curr. Opin. Plant Biol. 2006, 9, 428–435. [Google Scholar] [CrossRef]
- Hatfield, R.; Jepsen, S.; Vaughn, M.; Black, S.; Lee-Mäder, E. An Overview of the Potential Impacts of Honey Bees to Native Bees, Plant Communities, and Ecosystems in Wild Landscapes: Recommendations for Land Managers; The Xerces Society for Invertebrate Conservation: Portland, OR, USA, 2018; pp. 1–12. [Google Scholar]


| Scientific Name | Common Name |
|---|---|
| Achillea millefolium Linnaeus, 1754 | common yarrow |
| Artemisia ludoviciana Nuttall, 1818 | cudweed sagewort |
| Aster ascendens Lindley, 1834 | Rocky Mountain aster |
| Collomia linearis Nuttall, 1818 | slenderleaf collomia |
| Delphinium nuttallianum Pritzel, 1843 | Nutall’s larkspur |
| Erigeron speciosus (Lindley, 1836) | aspen fleabane |
| Fragaria virginiana Duchesne, 1766 | wild strawberry |
| Geranium viscosissimum Fisher and Myer 1846 | sticky purple geranium |
| Helianthella uniflora Nuttall, 1842 | oneflower helianthella |
| Lathyrus lanszwertii Kellogg, 1861 | Nevada sweet pea |
| Ligusticum porteri Coulter and Rose, 1888 | Indian parsley |
| Lupinus argenteus Pursh, 1814 | silver-stem lupine |
| Mertensia ciliata (James, 1838) | mountain bluebells |
| Orthocarpus tolmiei Hooker and Amot, 1839 | Tolmie’s owl’s-clover |
| Osmorhiza occidentalis (Nuttall, 1859) | western sweet cicely |
| Penstemon rydbergii A. Nelson, 1898 | Rydberg’s penstemon |
| Polemonium foliosissimum A. Gray, 1878 | leafy Jacob’s ladder |
| Potentilla gracilis Douglas, 1830 | slender cinquefoil |
| Rudbeckia occidentalis Nuttall, 1841 | western coneflower |
| Smilacina stellata Linnaeus, 1753 | starry false Solomon’s seal |
| Solidago multiradiata Aiton, 1789 | Rocky Mountain goldenrod |
| Stellaria jamesiana Torrey, 1828 | James’ starwort |
| Taraxacum officinale Weber, 1780 | common dandelion |
| Thalictrum fendleri Engelmann, 1849 | Fendler’s meadow-rue |
| Vicia americana Muhlenberg, 1801 | American vetch |
| Viguiera multiflora (Nuttall, 1848) | showy goldeneye |
| Viola purpurea Kellogg, 1855 | goosefoot violet |
| Bee Species | Total | Malaise Trap | Pan Trap |
|---|---|---|---|
| Agapostemon femoratus Crawford, 1901 | 2 | 1 | 1 |
| Agapostemon texanus Cresson, 1872 | 1 | 1 | 0 |
| Andrena apacheorum Cockerell, 1897 | 23 | 2 | 21 |
| Andrena birtwelli Cockerell, 1901 | 13 | 2 | 11 |
| Andrena cerasifolii Cockerell, 1896 | 1 | 1 | 0 |
| Andrena chlorura Cockerell, 1916 | 42 | 14 | 28 |
| Andrena colletina Cockerell, 1906 | 1 | 0 | 1 |
| Andrena hirticincta Provancher, 1888 | 26 | 10 | 16 |
| Andrena laminibucca Viereck and Cockerell 1914 | 2 | 1 | 1 |
| Andrena miranda Smith, 1879 | 4 | 0 | 4 |
| Andrena surda Cockerell, 1910 | 1 | 1 | 0 |
| Andrena thaspii Graenicher, 1903 | 1 | 1 | 0 |
| Andrena vicinoides Viereck, 1904 | 18 | 7 | 11 |
| Andrena sp. 1 | 3 | 3 | 0 |
| Andrena sp. 2 | 1 | 1 | 0 |
| Andrena sp. 3 | 124 | 12 | 112 |
| Andrena sp. 4 | 1 | 0 | 1 |
| Andrena sp. 5 | 1 | 1 | 0 |
| Andrena sp. 6 | 2 | 0 | 2 |
| Andrena sp. 7 | 1 | 0 | 1 |
| Andrena sp. 8 | 1 | 0 | 1 |
| Anthidium tenuiflorae Cockerell, 1907 | 3 | 3 | 0 |
| Anthophora bomboides Kirby, 1837 | 5 | 5 | 0 |
| Anthophora terminalis Cresson, 1869 | 255 | 165 | 90 |
| Anthophora urbana Cresson, 1878 | 25 | 24 | 1 |
| Apis mellifera Linneaus, 1758 | 36 | 21 | 15 |
| Ashmeadiella bucconis Say, 1837 | 1 | 0 | 1 |
| Ashmeadiella pronitens (Cockerell, 1906) | 5 | 4 | 1 |
| Atoposmia sp. 1 | 1 | 1 | 0 |
| Bombus appositus Cresson, 1878 | 745 | 716 | 29 |
| Bombus bifarius Cresson 1878 | 1637 | 1582 | 55 |
| Bombus californicus Smith 1854 | 69 | 67 | 2 |
| Bombus fernaladae Franklin, 1911 | 50 | 50 | 0 |
| Bombus flavifrons Greene, 1860 | 1898 | 1839 | 59 |
| Bombus huntii Greene, 1860 | 18 | 18 | 0 |
| Bombus insularis Nylander, 1848 | 77 | 74 | 3 |
| Bombus melanopygus Cresson, 1878 | 1 | 1 | 0 |
| Bombus mixtus Cresson, 1878 | 95 | 92 | 3 |
| Bombus morrisoni Cresson, 1874 | 1 | 1 | 0 |
| Bombus nevadensis Cresson, 1878 | 28 | 27 | 1 |
| Bombus occidentalis Greene, 1858 | 40 | 38 | 2 |
| Bombus rufocinctus Cresson, 1863 | 198 | 185 | 13 |
| Bombus sylvicola Kirby, 1837 | 959 | 935 | 24 |
| Ceratina sp. 1 | 1 | 0 | 1 |
| Coelioxys funeraria Smith, 1854 | 1 | 1 | 0 |
| Coelioxys porterae Cockerell, 1900 | 6 | 3 | 3 |
| Coelioxys sp. 1 | 1 | 0 | 1 |
| Colletes fulgidus Swenk, 1904 | 23 | 16 | 7 |
| Colletes hyalinus Provancher, 1888 | 11 | 10 | 1 |
| Colletes kincaidii Cockerell, 1898 | 4 | 4 | 0 |
| Colletes nigrifron Titus, 1900 | 4 | 3 | 1 |
| Colletes paniscus Viereck, 1903 | 90 | 44 | 46 |
| Colletes simulans Cresson, 1868 | 4 | 4 | 0 |
| Diadasia sp. 1 | 1 | 0 | 1 |
| Dufourea harveyi (Cockerell, 1906) | 31 | 4 | 27 |
| Epeolus americanus (Cresson, 1878) | 3 | 2 | 1 |
| Epeolus minimus (Robertson, 1902) | 3 | 3 | 0 |
| Halictus farinosus Smith, 1853 | 5 | 2 | 3 |
| Halictus rubicundus (Christ, 1791) | 23 | 19 | 4 |
| Halictus tripartitus Cockerell, 1895 | 1 | 0 | 1 |
| Halictus virgatellus Cockerell, 1901 | 45 | 17 | 28 |
| Heriades cressoni Michener, 1938 | 13 | 4 | 9 |
| Hoplitis albifrons (Kirby, 1837) | 15 | 14 | 1 |
| Hoplitis clypeata (Sladen, 1916) | 29 | 10 | 19 |
| Hoplitis fulgida (Cresson, 1864) | 53 | 35 | 18 |
| Hoplitis producta (Cresson, 1864) | 15 | 4 | 11 |
| Hylaeus annulatus (Linneaus, 1758) | 2605 | 172 | 2433 |
| Hylaeus basalis (Smith, 1853) | 190 | 42 | 148 |
| Hylaeus coloradensis (Cockerell, 1896) | 63 | 6 | 57 |
| Hylaeus sp. 1 | 40 | 8 | 32 |
| Hylaeus sp. 2 | 6 | 0 | 6 |
| Hylaeus sp. 3 | 30 | 5 | 25 |
| Lasioglossum (Dialictus) spp. | 732 | 554 | 178 |
| Lasioglossum (Evylaeus) spp. | 230 | 82 | 148 |
| Lasioglossum (s. str. sp.) | 1 | 0 | 1 |
| Lasioglossum sp. 1 | 406 | 72 | 334 |
| Lasioglossum sp. 2 | 1 | 0 | 1 |
| Lasioglossum trizonatum (Cresson, 1874) | 2 | 1 | 1 |
| Megachile fidelis Cresson, 1878 | 2 | 1 | 1 |
| Megachile frigida Smith, 1853 | 27 | 25 | 2 |
| Megachile inermis Provancher, 1888 | 23 | 14 | 9 |
| Megachile melanophaea Smith, 1853 | 63 | 59 | 4 |
| Megachile montivaga Cresson, 1878 | 5 | 1 | 4 |
| Megachile nevadensis Cresson, 1879 | 1 | 1 | 0 |
| Megachile perihirta Cockerell, 1898 | 171 | 164 | 7 |
| Megachile pugnata Say, 1837 | 36 | 29 | 7 |
| Megachile relativa Cresson, 1878 | 43 | 38 | 5 |
| Melissodes hymenoxidis Cockerell, 1906 | 9 | 8 | 1 |
| Melissodes sp. 1 | 21 | 17 | 4 |
| Nomada sp. 1 | 1 | 0 | 1 |
| Nomada sp. 2 | 1 | 1 | 0 |
| Osmia albolateralis Cockerell, 1906 | 10 | 8 | 2 |
| Osmia brevis Cresson, 1864 | 11 | 4 | 7 |
| Osmia bucephala Cresson, 1864 | 85 | 55 | 30 |
| Osmia coloradensis Cresson, 1878 | 2 | 2 | 0 |
| Osmia ednae Cockerell, 1897 | 11 | 7 | 4 |
| Osmia montana Cresson, 1864 | 5 | 2 | 3 |
| Osmia paradisica Sandhouse, 1924 | 107 | 85 | 22 |
| Osmia pentstemonis Cockerell, 1906 | 20 | 17 | 3 |
| Osmia proxima Cresson, 1864 | 64 | 53 | 11 |
| Osmia pusilla Cresson, 1864 | 29 | 24 | 5 |
| Osmia raritatis Michener, 1957 | 1 | 0 | 1 |
| Osmia sculleni Sandhouse, 1939 | 112 | 89 | 23 |
| Osmia simillima Smith, 1853 | 12 | 5 | 7 |
| Osmia subaustralis Cockerell, 1900 | 7 | 6 | 1 |
| Osmia trevoris Cockerell, 1897 | 6 | 2 | 4 |
| Osmia tristella Cockerell, 1911 | 23 | 15 | 8 |
| Panurginus cressoniellus Cockerell, 1898 | 252 | 21 | 231 |
| Panurginus sp. 1 | 1 | 1 | 0 |
| Panurginus sp. 2 | 1 | 0 | 1 |
| Protandrena bakeri Cockerell, 1896 | 23 | 1 | 22 |
| Protandrena sp. 1 | 9 | 8 | 1 |
| Protandrena sp. 2 | 2 | 2 | 0 |
| Sphecodes spp. | 94 | 88 | 6 |
| Stelis foederalis Smith, 1854 | 8 | 4 | 4 |
| Stelis montana Cresson 1864 | 3 | 0 | 3 |
| Stelis nitida Cresson, 1878 | 7 | 0 | 7 |
| Stelis pavonina Cockerell, 1908 | 4 | 3 | 1 |
| Stelis subcaerulea Cresson, 1878 | 5 | 4 | 1 |
Disclaimer/Publisher’s Note: The statements, opinions and data contained in all publications are solely those of the individual author(s) and contributor(s) and not of MDPI and/or the editor(s). MDPI and/or the editor(s) disclaim responsibility for any injury to people or property resulting from any ideas, methods, instructions or products referred to in the content. |
© 2024 by the authors. Licensee MDPI, Basel, Switzerland. This article is an open access article distributed under the terms and conditions of the Creative Commons Attribution (CC BY) license (https://creativecommons.org/licenses/by/4.0/).
Share and Cite
Anderson, N.; Petersen, S.; Johnson, R.; Terry, T.; Kunzelman, J.; Lariviere, D.; Anderson, V. Pan Trapping and Malaise Trapping: A Comparison of Bee Collection Techniques in Subalpine Meadows. Diversity 2024, 16, 536. https://doi.org/10.3390/d16090536
Anderson N, Petersen S, Johnson R, Terry T, Kunzelman J, Lariviere D, Anderson V. Pan Trapping and Malaise Trapping: A Comparison of Bee Collection Techniques in Subalpine Meadows. Diversity. 2024; 16(9):536. https://doi.org/10.3390/d16090536
Chicago/Turabian StyleAnderson, Nicholas, Steven Petersen, Robert Johnson, Tyson Terry, Jacqueline Kunzelman, David Lariviere, and Val Anderson. 2024. "Pan Trapping and Malaise Trapping: A Comparison of Bee Collection Techniques in Subalpine Meadows" Diversity 16, no. 9: 536. https://doi.org/10.3390/d16090536
APA StyleAnderson, N., Petersen, S., Johnson, R., Terry, T., Kunzelman, J., Lariviere, D., & Anderson, V. (2024). Pan Trapping and Malaise Trapping: A Comparison of Bee Collection Techniques in Subalpine Meadows. Diversity, 16(9), 536. https://doi.org/10.3390/d16090536