Abstract
The walleye pollock, Gadus chalcogrammus (Pallas, 1814), is one of the most commercially and ecologically valuable species in the Northwestern Pacific. However, combined pressures of overfishing and environmental changes have led to a substantial decline in its production in Japan and Russia since the 1990s, and a collapse in Korea since the 2000s. The objective of this study was to comprehensively examine its genetic diversity and population structure with an extensive sampling effort of 16 populations across the Northwestern Pacific including South Korea, Japan, and Russia. A multiplex PCR assay composed of seven microsatellite markers revealed a moderate level of observed heterozygosity (Ho = 0.369–0.599), which is lower than that reported in previous studies of this species. All loci were highly polymorphic, with the mean PIC ranging from 0.608 to 0.793. The structure of the 16 populations was characterized by heterozygote deficiency, a modest effective allele number (Ne = 4.551–7.969), low genetic differentiation (FST = 0.000–0.054), a weak population structure, a genetic admixture, and no significant correlation between the genetic and geographic distance. These characteristics are typical of pelagic marine species with large population sizes due to a consistent gene flow among populations when there are no physical boundaries in the open ocean. The seasonal and country-specific genetic structure indicated that G. chalcogrammus populations in the Northwestern Pacific region should be managed as a single management unit. The findings from this study provide critical information for future genetic monitoring, conservation management, and the development of strategies aimed at restoring the populations of this species.
1. Introduction
Walleye pollock (Gadus chalcogrammus), previously known as Theragra chalcogramma, is a highly abundant and widely distributed species across the continental shelves and slopes of the north Pacific Ocean, ranging from the Northwestern Pacific (including Korean and Japanese waters and the Sea of Okhotsk) to the Bering Sea and Gulf of Alaska [1]. Pollock exhibits a complex life history characterized by significant seasonal and spatial variability [2]. It typically spawns in large aggregations during late winter to early spring in deep waters, with larvae and juveniles subsequently dispersing to shallower, nearshore nursery grounds [3]. As it grows, walleye pollock migrates to deeper waters, following a diel vertical migration pattern where it ascends to feed at night and descends during the day [4,5]. This species exhibits fast growth rates, reaching maturity at around 3 to 4 years of age, and it can live up to 15–20 years [5]. Walleye pollock is a key commercial species in the North Pacific, with a commercial landing value of USD 383 million in 2021 [6]. Ecologically, it plays a central role in trophic chains, serving as prey for marine mammals, seabirds, and fish, while feeding on plankton and crustaceans [7,8,9]. However, intensive fishing and environmental changes have led to significant declines in walleye pollock populations, particularly along the coasts of Korea, Japan, and the Sea of Okhotsk [10,11,12]. This decline has raised serious concerns for the management and sustainability of walleye pollock stocks, highlighting the urgent need for continuous genetic monitoring to inform effective stock management strategies and identify distinct management units.
Recently, there has been a growing interest in investigating the population genetics of pollock using various molecular markers, including allozymes [13,14], panI locus variation by single-nucleotide polymorphism (SNP) analyses [15], and restriction fragment length polymorphisms (RFLPs) of mitochondrial DNA (mtDNA) [16]. However, assessing the genetic differentiation in marine fish species with large populations and high gene flows, such as pollock, can be challenging based on these methods. Polymorphic and co-dominant microsatellite markers with high mutation rates have emerged as a powerful tool for providing valuable insights into weak population structures [4,17,18]. However, the findings of these studies have shown inconsistencies. Notably, Orlova et al. [19] identified the genetic clustering of pollock samples from the East Sea (the Sea of Japan) and the Sea of Okhotsk when analyzing a large-scale dataset (1162 samples from 38 populations) based on the mtDNA control region (D-loop, 562 bp). Conversely, Dong et al. [18], using eight microsatellite markers on 186 pollock samples, revealed significant differences between the Korean, Russian, American, and Japanese populations.
In the present study, seven polymorphic microsatellite markers were used to assess the genetic structure and the genetic differentiation among G. chalcogrammus populations in the Northwestern Pacific, including South Korea, Japan, and Russia. In addition, this study provides the first insight into the genetic differentiation of the seasonal and country-specific genetic relationship of juvenile and adult populations in South Korea as compared to other spawning adults of Japanese and Russian populations. The comprehensive information gathered from our study will enhance the understanding of the genetic background and population structure of G. chalcogrammus, which is crucial for developing its effective conservation and management strategies.
2. Materials and Methods
2.1. Sample Collection and Genomic DNA Extraction
A total of 330 pollock samples of 16 populations were collected from the Northwestern Pacific, including South Korea, Japan, and Russia, from 2015 to 2017 (Table 1, Figure 1). All samples collected in Japan (JOT, JMO, JRU, and JMU) and Russia (RUJ and RUO) were identified as spawning adults, whereas the Korean samples comprised both juveniles (KJF, KJA, KJJ, KJS, and KJN) and spawning adults (KAF, KAM, KAJ, KAS, and KAN). In addition, the samples from Korea were collected in each life stage at various time points throughout the year.

Table 1.
Sampling information of Gadus chalcogrammus in the Northwestern Pacific including South Korea (juveniles: KJF, KJA, KJJ, KJS, and KJN; spawning adults: KAF, KAM, KAJ, KAS, and KAN), Japan (spawning adults: JOT, JMO, JRU, and JMU), and Russia (spawning adults: RUJ and RUO).
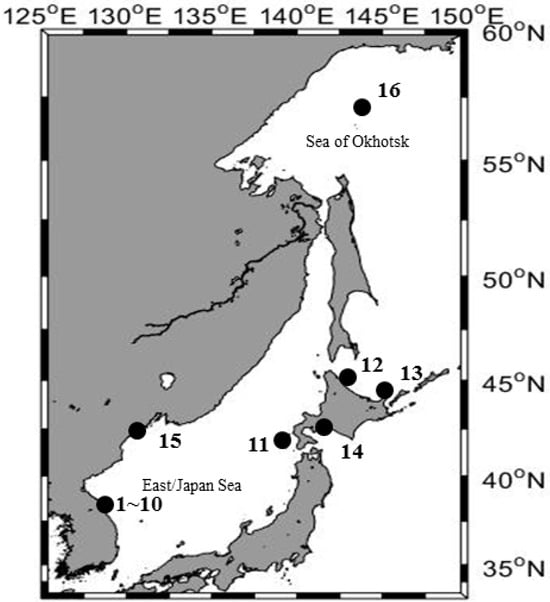
Figure 1.
Sampling map of Gadus chalcogrammus in the Northwestern Pacific including South Korea from 1 to 10 (juveniles: KJF, KJA, KJJ, KJS, and KJN; spawning adults: KAF, KAM, KAJ, KAS, and KAN), Japan from 11 to 14 (spawning adults: JOT, JMO, JRU, and JMU), and Russia from 15 to 16 (spawning adults: RUJ and RUO).
The pelvic fin of each sample was preserved in absolute ethanol and subsequently used to extract the total genomic DNA following the protocol of Asahida et al. [20]. It was qualitatively analyzed using a NanoDrop One Microvolume UV-Vis Spectrophotometer (Thermo Fisher Scientific Inc., Wilmington, DE, USA).
2.2. Microsatellite Genotyping
A total of 20 low-stutter di- and tetra-nucleotide microsatellites, described by O’Reilly et al. [21], were individually subjected to a preliminary PCR test using three randomly selected samples from each G. chalcogrammus population. Ultimately, seven marker candidates were chosen based on their best performance when validating their PCR products, such as distinct bands on gel electrophoresis and size variation within and between populations. The forward primers of the selected markers were fluorescently labeled differently after considering their amplicon sizes and were divided into two assay sets (A and B) as shown in Table S1. A multiplex PCR for each of these sets was carried out in a 25 µL volume using the AccuPower® Gold Multiplex PCR PreMix (Bionner, Daejeon, South Korea) in a ProFlex PCR System (Thermo Fisher Scientific) under the following reaction conditions: initial denaturation at 94 °C for 5 min, 35 cycles of denaturation at 95 °C for 20 s, annealing at 55 °C for 20 s, and extension at 72 °C for 30 s. The reaction was finished with a final extension at 72 °C for 5 min. The fluorescent PCR products were sized and separated on an ABI 3730xl DNA Analyzer (Applied Biosystems, Foster City, CA, USA). Allele sizes were scored against the GeneScan 500LIZ Size Standard using GeneMapper v.4.0 (Thermo Fisher Scientific).
2.3. Statistical Analysis
For each population and locus, genetic diversity indices including the number of alleles per locus (Na), observed heterozygosity (Ho), expected heterozygosity (He), polymorphic information content (PIC), and inbreeding coefficient (Fis) were calculated using Cervus v.3.0.7 [22] and GenAlEx v.6.5 [23,24]. The exact test of deviation from Hardy–Weinberg equilibrium (HWE) was computed using a probability and heterozygote deficiency test [25] in Genepop v.4.7.5 [26,27]. The test used a Markov chain with default parameters (1000 dememorizations, 100 batches, and 1000 iterations per batch). This software was also used for testing the linkage disequilibrium (LD) between pairs of loci.
The appropriation of using allele identity-based genetic differentiation (FST) or allele size-identity (RST) to evaluate the genetic variation at the population level was determined through the allele size randomization test [28] implemented in SPAGeDi v. 1.5 [29] with 10,000 permutations. The all-loci results of the test showed that the global observed statistics value (RST = 0.0176) does not significantly differ from the mean permuted value (ρRST = 0.0101; p-value = 0.4151) (Table S3), indicating that allele sizes lack informativeness in accordance with stepwise mutations, and the predominant factor contributing to genetic differentiation between subpopulations is likely genetic drift. Hence, pairwise FST values calculated in ARLEQUIN 3.1 [30] with 1000 permutations were used in subsequent analyses. Analysis of molecular variance (AMOVA) was implemented in Arlequin v. 5.3.2 with 1000 permutations to evaluate the genetic variability of 16 populations from the Northwestern Pacific with two prior grouping strategies, including four groups of populations [i.e., South Korea (juveniles: KJF, KJA, KJJ, KJS, and KJN; spawning adults: KAF, KAM, KAJ, KAS, and KAN), Japan (spawning adults: JOT, JMO, JRU, and JMU), and Russia (spawning adults: RUJ and RUO)] according to life stages and three groups of populations [i.e., South Korea (KJF, KJA, KJJ, KJS, KJN, KAF, KAM, KAJ, KAS, and KAN), Japan (JOT, JMO, JRU, and JMU), and Russia (RUJ and RUO)] according to sampling areas.
GenAlEx v.6.5 generated the genetic distance matrix according to Nei [31]. This matrix was imported into MEGA v. 10.2.2 [32] for constructing a neighbor-joining tree. General genetic patterns among populations were illustrated by principal coordinates analysis (PCoA) using GenAlEx v.6.5. This software was also used to regress the correlation of the pairwise genetic distance [FST/(1 − FST)] and the logarithm of the pairwise geographic distance (km) and calculate the nonparametric Mantel test with 9999 permutations.
Structure v. 2.3.4 [33] was used to detect the genetic structure that may exist among G. chalcogrammus populations. The parameters were set with 10 independent replicates for each K value (ranging from 1 to 10), 100,000 Markov chain Monte Carlo steps, and a burn-in period of 1,000,000. Verification of the most optimal K value was estimated using STRUCTURE HARVESTER [34].
3. Results
3.1. Polymorphic Level and Genetic Diversity
The seven microsatellite makers selected in this study (TCH03, TCH06, TCH10, TCH11, TCH13, TCH16, and TCH19) successfully amplified PCR products (amplicon sizes ranging from 51 to 298 bp) for 16 populations of G. chalcogrammus in South Korea, Japan, and Russia (Table S1). Table S2 shows that TCH19 had the highest allele size variation with the number of alleles (Na) = 56.000, whereas TCH16 had the lowest allele number of Na = 11.000. In each population, the mean effective allele values (Ne = 4.551–7.969) were consistently lower than the mean number of alleles (Na = 5.714–14.571) across the seven microsatellite loci. The mean expected heterozygosity (He = 0.649–0.813) was consistently greater than the mean observed heterozygosity (Ho = 0.369–0.599), resulting in positive mean inbreeding coefficient Fis values in all populations across all loci. All loci were highly polymorphic with the mean PIC ranging from 0.608 (KAM) to 0.793 (JRA). The mean values were greater than 0.5, indicating that all loci in this study were highly informative and provided reliable genetic information for downstream analysis.
Seven loci showed significant deviations from HWE (p < 0.01) in at least one out of 16 populations (Table S2). Particularly, TCH10, TCH13, and TCH16 significantly deviated from HWE in four, four, and one population, respectively, while the other loci deviated in at least 10 populations. All HWE deviations were associated with the significant heterozygote deficiency tests (p < 0.01). Genotypic linkage disequilibrium tests showed no significant values (p < 0.05), suggesting an absence of linkage disequilibrium between loci, and each locus can be considered an independent genetic marker (Table S4).
3.2. Genetic Differentiation
The estimation of pairwise FST showed low genetic differentiation among populations (ranging from 0.000 to 0.054) across the seven microsatellite loci (Table S5). Within groups of populations from each region, most pairwise FST values were not statistically significant, except for one pair in Russia (RUJ and RUO), one pair in Japan (JOT and JMO), and seven pairs in South Korea (KJF and KJS; KJA and KAS; KJJ with KJS and KAS; KJS and KAN; KJN and KAN; KAS and KAN). In comparison among groups, a statistically significant differentiation was found between adult populations (KAS and KAN) in South Korea with two or three populations in Japan, and all Russian populations. The pairwise FST of a population in Russia (RUJ) differed significantly with all populations (except for KJJ and KAF), while that of RUO was significant with three populations (i.e., KJS, KAS, and KAN) in South Korea. AMOVA was carried out based on two grouping strategies of populations according to different life stages (juveniles and spawning adults in South Korea, and spawning adults in Japan and Russia) and according to three geographical regions (South Korea, Japan, and Russia) (Table 2). Both strategies showed similar results of significant difference among populations within groups (FSC = 0.016, p = 0.000) and within populations (FST = 0.017, p = 0.000); the majority of genetic variation was distributed within populations (98.29 and 98.28%, respectively), with a low degree of genetic differentiation among groups without statistical significance (FCT = 0.001 and p > 0.01 for both strategies). PCoA showed a small magnitude of overall genetic difference among populations, with a cumulative variance of 28.48 and 13.30% from the first and second coordinates, respectively (Figure 2). The plot revealed a cluster from all populations except for one population from Russia (RUJ), which was clearly distant from the others. The regression between the genetic distance (FST) and logarithms of the geographic distance (km) of populations showed no correlation with R2 = 0.0067 (Figure 3). This result is supported by the Mantel test with a nonsignificant p value (p > 0.05).
Table 2.
Analysis of molecular variance (AMOVA) performed in three geographical groups of Gadus chalcogrammus populations in the Northwestern Pacific including South Korea (juveniles: KJF, KJA, KJJ, KJS, and KJN; spawning adults: KAF, KAM, KAJ, KAS, and KAN), Japan (spawning adults: JOT, JMO, JRU, and JMU), and Russia (spawning adults: RUJ and RUO).
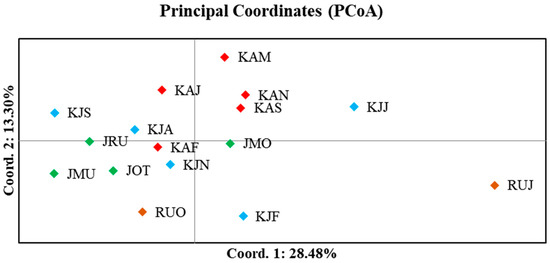
Figure 2.
Biplot of principal coordinates analysis (PCoA) based on Nei’s genetic distance of 16 populations of Gadus chalcogrammus in the Northwestern Pacific including South Korea (juveniles: KJF, KJA, KJJ, KJS, and KJN; spawning adults: KAF, KAM, KAJ, KAS, and KAN), Japan (spawning adults: JOT, JMO, JRU, and JMU), and Russia (spawning adults: RUJ and RUO).
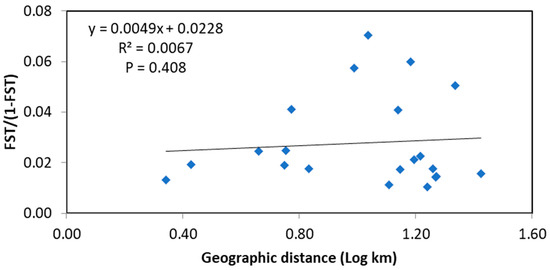
Figure 3.
Correlation between genetic distance [FST/(1 − FST)] and logarithms of geographic distance (km) of 16 populations of Gadus chalcogrammus in the Northwestern Pacific. The probability of the Mantel test is presented in the graph as the p value.
3.3. Genetic Structure
Genetic admixture analysis without prior clustering information revealed that the most likely number of four genetic clusters (K = 4) provides the most appropriate and informative representation of the underlying population structure (Table S6, Figure S1). However, the Bayesian clustering analysis in STRUCTURE at K = 2, 3, or 4 showed a genetic admixture regardless of life stage and geographical groups, without distinct clustering for any specific population (Figure S2). The genetic distance computed by Nei’s standard genetic distance (1972) among populations was low, ranging from 0.000 to 0.250. The neighbor-joining dendrogram (Figure 4) based on this genetic distance revealed a distinct clustering of two G. chalcogrammus populations (RUJ and RUO) compared to others in South Korea and Japan. The populations in South Korea were divided into two separate clusters, including one group of juvenile populations (KJF, KJA, KJJ, and KJS) and another group of spawning adult populations (KAJ, KAS, KAM, KAF, and KAN). While four spawning adult populations in Japan (JOT, JMO, JRA, and JMU) are grouped together, the dendrogram revealed their close genetic distance from the other spawning adult populations of South Korea through their clustering formation.
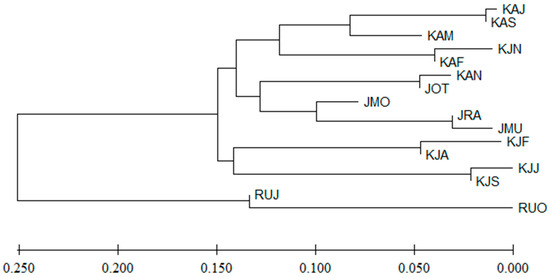
Figure 4.
Neighbor-joining tree based on Nei’s standard genetic distance using seven microsatellite loci of 16 populations of Gadus chalcogrammus in the Northwestern Pacific including South Korea (juveniles: KJF, KJA, KJJ, KJS, and KJN; spawning adults: KAF, KAM, KAJ, KAS, and KAN), Japan (spawning adults: JOT, JMO, JRU, and JMU), and Russia (spawning adults: RUJ and RUO).
4. Discussion
Gadus chalcogrammus is characterized by a large population (annual harvest ranging from 4 to 7 million tons in the North Pacific Ocean) and potentially high dispersal capabilities [1]. This species occupies a wide range of habitats and can adapt to various environments, such as large estuaries, coastal embayment, and offshore oceanic waters [2]. It is considered both a semi-demersal and an exclusively pelagic marine species, depending on its specific life stages. These complex features likely significantly contribute to its high level of genetic diversity and high nucleotide mutation accumulation in populations, as reported in many previous studies [14,18,35].
In this study, the result of the observed heterozygosity (Ho) was moderate (0.369–0.599) and similar across 16 populations. This proportion was lower compared to those reported by Dong et al. [18] (Ho = 0.689–0.808), Shubina et al. [4] (Ho = 0.710–0.760), and Smimova et al. [36] (Ho = 0.506–0.816). The reduced heterozygosity in the pollock populations may be influenced by a range of potential factors. Among them, population declines due to overharvesting and environmental changes emerge as significant drivers. This trend aligns with the demonstrated loss of genetic diversity in highly abundant marine fish populations due to reductions in population size, as established by Pinsky et al. [37] through a meta-analytical approach. Because genetic diversity loss might lead to several adverse impacts, affecting both the short-term sustainability of fisheries and the long-term health of marine ecosystems, it becomes imperative to elevate the significance of genetic diversity when formulating management strategies for this species.
Half of the HWE probability tests were significant and found in most of the seven microsatellite loci used in this study. Such a departure is common in marine species, including pollock, evidenced by several previous studies [18,38]. While a definitive hypothesis to elucidate this occurrence remains elusive, the HWE departure results observed in this study can be elaborated through their associated significant heterozygote deficiency, which is potentially indicative of inbreeding within the population. In the Northwestern Pacific, a previous study has highlighted four major spawning grounds, including the Tartar Strait and the Peter the Great Gulf in Russia, the western coastal areas off Hokkaido and Honshu in Japan, and the East Korean Bay [1,11]. As a semi-pelagic species, mature pollock descends to a depth of 20–600 m for feeding and migrates in winter [4,39], and it navigates between specific slope and shelf regions for spawning. Such a biological recruitment pattern of this species in various life stages enhances the chances of closely related individuals coming into close proximity and mating. However, it is important to approach this conclusion cautiously, as heterozygote deficiency can also stem from scoring errors or false positives in data analysis. Further investigation into G. chalcogrammus populations, specifically focusing on inbreeding among populations, is necessary to substantiate this assumption.
Studying the genetic structure of marine species, particularly those with large populations like pollock, might be challenging due to the absence of physical boundaries in the open ocean and the inherent complexities across the entire range. In this context, our examination of G. chalcogrammus populations revealed a weak population structure supported by the results of the pairwise FST values, AMOVA, PCoA, and genetic admixture analysis from STRUCTURE. This pattern is typical for pelagic marine species due to their dispersal potentials (i.e., planktonic development stage, egg buoyancy, high vagility, and migratory behavior) leading to a high level of gene flow between populations [15,17,39]. The high and consistent dispersal capability, minimizing the impact of geographic barriers on gene flow, was demonstrated by the nonsignificant results of the Mantel test in this study. According to these findings, G. chalcogrammus populations in the Northwestern Pacific region should be managed as a single management unit, because most of the analyses in this study are unable to identify structure within populations.
However, a few contradictions have arisen from certain analyses. Despite the low pairwise FST values among populations, statistical significance emerges for two populations in Russia (RUJ and RUO), with 16 out of 29 pairwise comparisons displaying significance. This outcome aligns with the results of the PCoA, where RUJ is separated from other populations. In addition, the juvenile populations that emerge in September exhibit genetic differences from those appearing in February and June, suggesting that these juvenile populations appearing in the specific period within the coastal waters of South Korea occupy distinct spatial positions in terms of spawning grounds and habitats relative to those appearing in other seasons. The seasonal and country-specific genetic relationships showed that the spawning adults of South Korean populations in September and November revealed limited genetic exchange with Japanese and Russian populations, though they share the spawning grounds and habitats with the other South Korean populations. Furthermore, although Nei’s standard genetic distance is low, it successfully clusters G. chalcogrammus samples based on different regions (South Korea, Japan, and Russia) and life stages (juveniles and spawning adults in South Korea, and spawning adults in Japan and Russia) in the neighbor-joining tree. This contradiction may highlight complexities within the population structure of G. chalcogrammus and require further research and exploration. Thus, the results imply that G. chalcogrammus resources of juveniles and adults in the coastal waters of South Korean populations are influenced by inflows from various sources.
Accumulating evidence in recent years has suggested the useful role of nuclear microsatellite markers in resolving low levels of genetic population structure in marine fish species characterized by large populations and a high potential for gene flow [17]. Compared to other molecular markers such as allozymes, RFLPs, mtDNA, and panI, microsatellites have the advantages of exhibiting multiple alleles, co-dominance, and high polymorphism. However, using microsatellites also presents certain drawbacks. During DNA replication, microsatellites are prone to forming stutter peaks, i.e., small peaks that appear near the true allele peak due to slippage [40], and mutations in the primer annealing sites can lead to the failure of amplification of one or two alleles, resulting in allelic dropout [41]. These two problems can result in the occurrence of null alleles, complicating allele scoring and genotyping accuracy, especially in multiplex reactions. Although the significant heterozygote deficiency due to inbreeding within the population in this study has been addressed, the underestimation of heterozygotes caused by null alleles should not be dismissed. Further actions are required to improve future microsatellite analyses, such as validating the presence of null alleles using additional genotyping methods and optimizing primers. In addition, expanding the number of microsatellite markers and incorporating multiple microsatellite loci are essential in offering more dependable insights into the population genetic study of G. chalcogrammus.
5. Conclusions
A total of 330 pollock samples were collected from 16 populations across the Northwestern Pacific region, encompassing South Korea, Japan, and Russia. The analysis of genetic diversity revealed moderate genetic diversity across these populations using seven microsatellite loci. Additionally, the results indicated low genetic differentiation and a weak genetic structure among the 16 populations, suggesting that G. chalcogrammus populations in the Northwestern Pacific region should be managed as a single management unit. However, a contradiction arises, supporting the separation of the 16 populations based on different geographical regions and life stages. This contradiction highlights the necessity of further comprehensive research into the genetic structure of this species.
Supplementary Materials
The following supporting information can be downloaded at https://www.mdpi.com/article/10.3390/d16090556/s1. Figure S1: Evanno’s delta K plots based on seven microsatellite loci of 16 populations of Gadus chalcogrammus from the Northwestern Pacific region. Figure S2: Bar plots of the genetic structure of the 16 populations of Gadus chalcogrammus in the Northwest Pacific based on seven microsatellite markers. Each individual is represented by a vertical line with a distinct color proportion associated with the probabilities of membership proportional to each of the inferred K groups at K = 2, 3, and 4. South Korea (juveniles: 1, KJF; 2, KJA; 3, KJJ; 4, KJS; 5, KJN; spawning adults: 6, KAF; 7, KAM; 8, KAJ; 9, KAS; 10, KAN), Japan (spawning adults: 11, JOT; 12, JMO; 13, JRU; 14, JMU), and Russia (spawning adults: 15, RUJ; 16, RUO). Table S1: Seven microsatellite primers of Gadus chalcogrammus used in this study. Table S2. Genetic diversity indices based on seven microsatellite markers in 16 populations of Gadus chalcogrammus in the Northwestern Pacific including South Korea (juveniles: KJF, KJA, KJJ, KJS, and KJN; spawning adults: KAF, KAM, KAJ, KAS, and KAN), Japan (spawning adults: JOT, JMO, JRU, and JMU), and Russia (spawning adults: RUJ and RUO). Table S3: Summary of allele size permutation test of seven microsatellite loci of Gadus chalcogrammus used in this study. Table S4: Pairwise genotypic linkage disequilibrium of seven microsatellite loci of Gadus chalcogrammus using Fisher’s method. Table S5: The average pairwise FST values in the lower diagonal and their associated geographic distance (km) in the upper diagonal of 16 populations of Gadus chalcogrammus in the Northwestern Pacific including South Korea (juveniles: KJF, KJA, KJJ, KJS, and KJN; spawning adults: KAF, KAM, KAJ, KAS, and KAN), Japan (spawning adults: JOT, JMO, JRU, and JMU), and Russia (spawning adults: RUJ and RUO). Table S6: The Evanno table output based on seven microsatellite loci of 16 populations of Gadus chalcogrammus in the Northwestern Pacific region.
Author Contributions
Conceptualization, C.I.L. and M.Y.; methodology, K.-Y.K., B.T.T. and J.W.; formal analysis and investigation, M.Y., K.-Y.K. and B.T.T.; writing—original draft preparation, C.I.L. and J.W.; writing—review and editing, B.T.T., C.-K.K. and I.K.; funding acquisition, M.Y. and H.K.J.; resources, Y.-H.J. and H.K.J.; supervision, I.K. and J.W. All authors have read and agreed to the published version of the manuscript.
Funding
This work was funded by the National Marine Biodiversity Institute of Korea (MABIK) under in-house Research Programs [2024M00500] and was supported with the project ‘Walleye pollock stock management based on marine information and communication technology’; ‘Long-term change of structure and function in marine ecosystems of Korea’ funded by the Ministry of Oceans and Fisheries, and the Marine Biotechnology Program [20170488].
Institutional Review Board Statement
This article does not contain any studies involving human participants performed by any of the authors. All experiments were performed following the guidelines of the South Korean Association for Laboratory Animals (approval no. 18-0680, 5 October 2018). All necessary permits for sampling and observational field studies were obtained by the authors from the competent authorities in Korea, Japan, and Russia. This study is compliant with the Convention on Biological Diversity (CBD) and the Nagoya Protocol.
Data Availability Statement
All data are contained within this article or the Supplementary Materials.
Conflicts of Interest
The authors declare that they have no competing interests.
References
- Bailey, K.M.; Powers, D.M.; Quattro, J.M.; Villa, G.; Nishimura, A.; Traynor, J.J.; Walters, G. Population ecology and structural dynamics of walleye pollock (Theragra chalcogramma). Adv. Mar. Biol. 1999, 37, 179–255. [Google Scholar]
- Bacheler, N.M.; Ciannelli, L.; Bailey, K.M.; Duffy-Anderson, J.T. Spatial and temporal patterns of walleye pollock (Theragra chalcogramma) spawning in the eastern Bering Sea inferred from egg and larval distributions. Fish. Oceanogr. 2010, 19, 107–120. [Google Scholar] [CrossRef]
- Eisner, L.B.; Zuenko, Y.I.; Basyuk, E.O.; Britt, L.L.; Duffy-Anderson, J.T.; Kotwicki, S.; Ladd, C.; Cheng, W. Environmental impacts on walleye pollock (Gadus chalcogrammus) distribution across the Bering Sea shelf. Deep. Sea Res. Part II Top. Stud. Oceanogr. 2020, 181, 104881. [Google Scholar] [CrossRef]
- Shubina, E.A.; Ponomareva, E.V.; Glubokov, A.I. Population genetic structure of walleye pollock Theragra chalcogramma (Gadidae, Pisces) from the Bering Sea and Sea of Okhotsk. Mol. Biol. 2009, 43, 855–866. [Google Scholar] [CrossRef]
- Alaska Department of Fish and Game. Walleye Pollock (Gadus chalcogrammus): Species Profile. 2023. Available online: https://www.adfg.alaska.gov (accessed on 22 August 2024).
- North Pacific Fishery Management Council, Anchorage, AK, USA. Available online: https://www.fisheries.noaa.gov/species/alaska-pollock (accessed on 20 July 2023).
- Strasburger, W.W.; Hillgruber, N.; Pinchuk, A.I.; Mueter, F.J. Feeding ecology of age-0 walleye pollock (Gadus chalcogrammus) and Pacific cod (Gadus macrocephalus) in the southeastern Bering Sea. Deep. Sea Res. Part II Top. Stud. Oceanogr. 2013, 109, 172–180. [Google Scholar] [CrossRef]
- Lowry, L.F.; Burkanov, V.N.; Frost, K.J. Importance of walleye pollock in the diets of marine mammals in the Gulf of Alaska and Bering Sea, and implications for fishery management. In Proceedings of the International Symposium on the Biology and Management of Walleye Pollock, Anchorage, AK, USA, 14–16 November 1988; pp. 701–726. [Google Scholar]
- Aydin, K.; Mueter, F. The Bering Sea—A dynamic food web perspective. Deep. Sea Res. Part II Top. Stud. Oceanogr. 2007, 54, 2501–2525. [Google Scholar] [CrossRef]
- Kang, S.; Park, J.H.; Kim, S. Size-class estimation of the number of Walleye pollock Theragra chalcogramma caught in the southwestern East Sea during the 1970s–1990s. Korean J. Fish. Aquat. Sci. 2013, 46, 445–453. [Google Scholar] [CrossRef][Green Version]
- Kang, S.; Kim, S. What caused the collapse of walleye pollock population in Korean waters? KMI Int. J. Marit. Aff. Fish. 2015, 7, 43–58. [Google Scholar] [CrossRef]
- Kim, Y.-Y.; Kang, Y.-K.; Lee, S.-T.; Jung, H.K.; Lee, C.I.; Kim, S.; Jeong, K.Y.; Byun, D.-S.; Cho, Y.-K. Potential Impact of Late 1980s Regime Shift on the Collapse of Walleye Pollock Catch in the Western East/Japan Sea. Front. Mar. Sci. 2022, 9, 802748. [Google Scholar] [CrossRef]
- Iwata, M. Population identification of walleye pollock, Theragra chalcogramma (Pallas), in the vicinity of Japan. Mem. Fac. Fish. Sci. Hokkaido Univ. 1975, 22, 193–258. [Google Scholar]
- Olsen, J.B.; Merkouris, S.E.; Seeb, J.E. An examination of spatial and temporal genetic variation in walleye pollock (Theragra chalcogramma) using allozyme, mitochondrial DNA, and microsatellite data. Fish. Bull. 2002, 100, 752–764. [Google Scholar]
- Canino, M.F.; O’Reilly, P.T.; Hauser, L.; Bentzen, P. Genetic differentiation in walleye pollock (Theragra chalcogramma) in response to selection at the pantophysin (PanI) locus. Can. J. Fish. Aquat. Sci. 2005, 62, 2519–2529. [Google Scholar] [CrossRef]
- Mulligan, T.J.; Chapman, R.W.; Brown, B.L. Mitochondrial DNA Analysis of Walleye Pollock, Theragra chalcogramma, from the Eastern Bering Sea and Shelikof Strait, Gulf of Alaska. Can. J. Fish. Aquat. Sci. 1992, 49, 319–326. [Google Scholar] [CrossRef]
- O’Reilly, P.T.; Canino, M.F.; Bailey, K.M.; Bentzen, P. Inverse relationship between FST and microsatellite polymorphism in the marine fish, walleye pollock (Theragra chalcogramma): Implications for resolving weak population structure. Mol. Ecol. 2004, 13, 1799–1814. [Google Scholar] [CrossRef]
- Dong, C.M.; Kang, J.-H.; Byun, S.-G.; Park, K.-Y.; Park, J.Y.; Kong, H.J.; An, C.M.; Kim, G.-D.; Kim, E.-M. Genetic Diversity and Relationship of the Walleye Pollock, Theragra chalcogramma Based on Microsatellite Analysis. J. Life Sci. 2016, 26, 1237–1244. [Google Scholar] [CrossRef]
- Orlova, S.Y.; Sergeev, A.A.; Shcepetov, D.M.; Kurnosov, D.S.; Chikurova, E.A.; Orlov, A.M.; Glubokovsky, M.K. Polymorphism of Walleye Pollock Gadus chalcogrammus Mitochondrial DNA Control Region in the Asiatic Part of the Range and its Phylogeographic History. J. Ichthyol. 2022, 62, 266–279. [Google Scholar] [CrossRef]
- Asahida, T.; Kobayashi, T.; Saitoh, K.; Nakayama, I. Tissue preservation and total DNA extraction form fish stored at ambient temperature using buffers containing high concentration of urea. Fish. Sci. 1996, 62, 727–730. [Google Scholar] [CrossRef]
- O’Reilly, P.T.; Canino, M.F.; Bailey, K.M.; Bentzen, P. Isolation of twenty low stutter di- and tetranucleotide microsatellites for population analyses of walleye pollock and other gadoids. J. Fish Biol. 2000, 56, 1074–1086. [Google Scholar] [CrossRef]
- Marshall, T.C.; Slate, J.; Kruuk, L.E.B.; Pemberton, J.M. Statistical confidence for likelihood-based paternity inference in natural populations. Mol. Ecol. 1998, 7, 639–655. [Google Scholar] [CrossRef]
- Peakall, R.O.D.; Smouse, P.E. genalex 6: Genetic analysis in Excel. Population genetic software for teaching and research. Mol. Ecol. Notes 2006, 6, 288–295. [Google Scholar] [CrossRef]
- Peakall, R.; Smouse, P.E. GenAlEx 6.5: Genetic analysis in Excel. Population genetic software for teaching and research—An update. Bioinformatics 2012, 28, 2537–2539. [Google Scholar] [CrossRef] [PubMed]
- Guo, S.W.; Thompson, E.A. Performing the exact test of Hardy-Weinberg proportion for multiple alleles. Biometrics 1992, 48, 361–372. [Google Scholar] [CrossRef]
- Raymond, M.; Rousset, F. GENEPOP (version 1.2): Population genetics software for exact tests and ecumenicism. J. Hered. 1995, 86, 248–249. [Google Scholar] [CrossRef]
- Rousset, F. genepop’007: A complete re-implementation of the genepop software for Windows and Linux. Mol. Ecol. Resour. 2008, 8, 103–106. [Google Scholar] [CrossRef] [PubMed]
- Hardy, O.J.; Charbonnel, N.; Fréville, H.; Heuertz, M. Microsatellite allele sizes: A simple test to assess their significance on genetic differentiation. Genetics 2003, 163, 1467–1482. [Google Scholar] [CrossRef] [PubMed]
- Hardy, O.J.; Vekemans, X. SPAGeDi: A versatile computer program to analyse spatial genetic structure at the individual or population levels. Mol. Ecol. Notes 2002, 2, 618–620. [Google Scholar] [CrossRef]
- Excoffier, L.; Lischer, H.E.L. Arlequin suite ver 3.5: A new series of programs to perform population genetics analyses under Linux and Windows. Mol. Ecol. Resour. 2010, 10, 564–567. [Google Scholar] [CrossRef]
- Nei, M. Genetic distance between populations. Am. Nat. 1972, 106, 283–292. [Google Scholar] [CrossRef]
- Tamura, K.; Stecher, G.; Kumar, S. MEGA11: Molecular evolutionary genetics analysis version 11. Mol. Biol. Evol. 2021, 38, 3022–3027. [Google Scholar] [CrossRef]
- Pritchard, J.K.; Stephens, M.; Donnelly, P. Inference of population structure using multilocus genotype data. Genetics 2000, 155, 945–959. [Google Scholar] [CrossRef]
- Earl, D.A.; vonHoldt, B.M. STRUCTURE HARVESTER: A website and program for visualizing STRUCTURE output and implementing the Evanno method. Conserv. Genet. Resour. 2012, 4, 359–361. [Google Scholar] [CrossRef]
- Yanagimoto, T.; Kitamura, T.; Kobayashi, T. Genetic stock structure of walleye pollock (Theragra chalcogramma) inferred by PCR–RFLP analysis of the mitochondrial DNA and SNP analysis of nuclear DNA. Mar. Genom. 2012, 7, 17–25. [Google Scholar] [CrossRef] [PubMed]
- Smirnova, M.A.; Orlova, S.Y.; Orlov, A.M. The Population Genetic Organization of Pacific Cod Gadus macrocephalus in the North Pacific Based on Microsatellite Analysis. J. Ichthyol. 2019, 59, 555–565. [Google Scholar] [CrossRef]
- Pinsky, M.L.; Palumbi, S.R. Meta-analysis reveals lower genetic diversity in overfished populations. Mol. Ecol. 2014, 23, 29–39. [Google Scholar] [CrossRef]
- An, H.S.; Kim, W.J.; Lim, H.J.; Byun, S.G.; Hur, Y.B.; Park, J.Y.; Myeong, J.I.; An, C.M. Genetic structure and diversity of Crassostrea gigas in Korea revealed from microsatellite markers. Biochem. Syst. Ecol. 2014, 55, 283–291. [Google Scholar] [CrossRef]
- Grant, W.S.; Spies, I.; Canino, M.F. Shifting-balance stock structure in North Pacific walleye pollock (Gadus chalcogrammus). ICES J. Mar. Sci. 2010, 67, 1687–1696. [Google Scholar] [CrossRef][Green Version]
- Van Oosterhout, C.; Hutchinson, W.F.; Wills, D.P.M.; Shipley, P. MICRO-CHECKER: Software for identifying and correcting genotyping errors in microsatellite data. Mol. Ecol. Notes 2004, 4, 535–538. [Google Scholar] [CrossRef]
- Chapuis, M.-P.; Estoup, A. Microsatellite null alleles and estimation of population differentiation. Mol. Biol. Evol. 2007, 24, 621–631. [Google Scholar] [CrossRef]
Disclaimer/Publisher’s Note: The statements, opinions and data contained in all publications are solely those of the individual author(s) and contributor(s) and not of MDPI and/or the editor(s). MDPI and/or the editor(s) disclaim responsibility for any injury to people or property resulting from any ideas, methods, instructions or products referred to in the content. |
© 2024 by the authors. Licensee MDPI, Basel, Switzerland. This article is an open access article distributed under the terms and conditions of the Creative Commons Attribution (CC BY) license (https://creativecommons.org/licenses/by/4.0/).