Article

Biodiversity, Ecological Status and Ecosystem Attributes of Agricultural Ditches Based on the Analysis of Macroinvertebrate Communities

1
Department for Sustainable Development and Ecological Transition, University of Eastern Piedmont, Piazza Sant’Eusebio 5, 13100 Vercelli, Italy
2
Alpine Stream Research Center/ALPSTREAM, 12030 Ostana, Italy
*
Author to whom correspondence should be addressed.
Diversity 2024, 16(9), 558; https://doi.org/10.3390/d16090558 (registering DOI)
Submission received: 21 July 2024 / Revised: 24 August 2024 / Accepted: 5 September 2024 / Published: 7 September 2024

Abstract

:
Ditches are widespread and common elements of the agricultural landscape. Although they can provide habitats for aquatic biodiversity, their ecosystem integrity and processes are generally limited or even unknown due to anthropogenic pressures and the paucity of studies on this type of aquatic ecosystem. This study aimed to enhance the knowledge on the biodiversity, ecosystem attributes and ecological status of agricultural ditches by analyzing the macroinvertebrate communities of six different ditches and those of the main river in the same area. While negligible differences in taxonomic richness were observed, macroinvertebrate community composition significantly varied among sites as a function of the heterogeneous habitat conditions. These compositional differences strongly affected the relative abundance of functional feeding groups among sites and their derived ecosystem attributes. Moreover, the ecological status assessment depicted different scenarios depending on the biomonitoring indices applied. By means of a multifaceted, but still poorly adopted, analysis of the macroinvertebrate community, ranging from the taxonomic and functional diversity to ecosystem attributes and biomonitoring indices, the results obtained in this study offer useful information on the ecology of agricultural ditches with potential insights to improving their management.

1. Introduction

Agricultural ditches are a particular type of lotic ecosystem as they have characteristics of both streams and wetlands [1]. Although these water bodies are generally artificial or semi-natural and partially align with natural river networks, they are somewhat affected by some geomorphological processes [1]. The main function of agricultural ditches is drainage and, in turn, the carriage of pollutants from crop fields to downstream water bodies. In fact, in the past, their management was mostly oriented toward water transport and hydrological regulation, but currently, there is increased concern about the environmental benefits in terms of water quality, habitat, and diversity [2].
In intensively cropped areas, where the heterogeneity of the landscape is usually low and homogenized, ditches may serve as important elements, enhancing the environmental complexity insofar as they provide surrogate habitats for aquatic plants and animals. For instance, in a study focusing on agricultural ditches in the UK, Williams et al. [3] found that these lotic ecosystems had lower species richness but harbored uncommon and different species that were not recorded in other types of aquatic habitats. However, the biodiversity of agricultural ditches depends on the magnitude and frequency of anthropogenic pressures. Eutrophication, due to the runoff from the fields, is one of the main threats to agricultural ditches and their biota. There are few organisms that can endure eutrophication, and several European aquatic species are at risk of extinction [4]. In addition to nutrient pollution, other man-induced pressures include water table regulation, especially the occurrence of dry phases, and the periodical removal of riparian and aquatic vegetation. All of these disturbances usually prevent the development of rich and stable biological communities by selecting only species with physiological and behavioral adaptations to cope with these alterations. Moreover, the distance and connectivity with other aquatic habitats, such as rivers or wetlands, can influence the colonization dynamics according to the species-specific dispersal abilities, thus affecting the resilience of biological communities in ditches and their compositional variation over time [5].
Since the diversity and composition of their biological communities are, therefore, shaped by the trade-off between levels of anthropogenic pressures, local habitat conditions, and dispersal-related processes, agricultural ditches are potentially good model systems for testing basic and applied research on community ecology [6], including for instance meta-community theories [7], patterns in alpha, beta, and gamma diversity [8], and mechanisms of resistance and resilience [9].
Among the biological communities of agricultural ditches, previous studies have often focused on benthic macroinvertebrates [10,11]. These consist of a heterogeneous group of invertebrates belonging to different taxa, such as Insecta, Crustacea, Mollusca, Hirudinea, and Oligochaeta, whose body size exceeds one millimeter and that spend at least a part of their life associated with the substrates of the riverbed. Compared to other riverine organisms, benthic macroinvertebrates occupy every consumer level in the trophic chain of lotic ecosystems, thus playing a top–down role in the processing of organic detritus and instream primary production, as well as a bottom–up role for higher trophic levels [12,13]. In this respect, the analysis of the abundance and composition of functional feeding groups of macroinvertebrates allows us to infer information relating to the ecosystem attributes, especially in terms of the energy pathway (i.e., detritus and primary production food chains) [14,15]. Moreover, the sensitivity to changes in the chemical and physical characteristics of water and habitats, along with the simplicity of collecting them, make benthic macroinvertebrates the foremost organisms employed in river biomonitoring [16,17]. Many species have long life cycles and are constantly in the same locality; therefore, analyzing the macroinvertebrate community structure is useful in terms of revealing human pressures across spatial and temporal gradients [18].
Therefore, benthic macroinvertebrates are excellent candidate bioindicators for improving our knowledge of the ecology, management, and conservation of agricultural ditches as the community-level analysis of this target group provides complementary and multifaceted insights ranging from the taxonomic and functional diversity to ecosystem attributes and biomonitoring applications. Nevertheless, most of the previous studies on benthic macroinvertebrates in agricultural ditches [4,7,8,10] dealt solely with one or two of these facets, often examined singularly, thus resulting in scattered and incomplete information.
This study aimed at filling, at least partially, the knowledge gap relating to the biodiversity, ecological status, and ecosystem attributes of agricultural ditches, which still are poorly monitored freshwater habitats. To this end, a multifaceted, but still seldom applied, analysis of macroinvertebrate communities was adopted: benthic macroinvertebrates from six different ditches in the intensive cropping area of the Novara municipality (northwestern Italy) were analyzed along with those of the main river in the same study area to highlight similarities and differences in terms of taxonomic diversity and composition, functional composition, ecosystem attributes, and ecological status (derived from the application of biomonitoring indices). Moreover, all of the biodiversity and biomonitoring metrics were correlated with the environmental parameters of the sampling sites to elucidate the response of macroinvertebrate communities to the ecological integrity of the investigated watercourses.

2. Materials and Methods
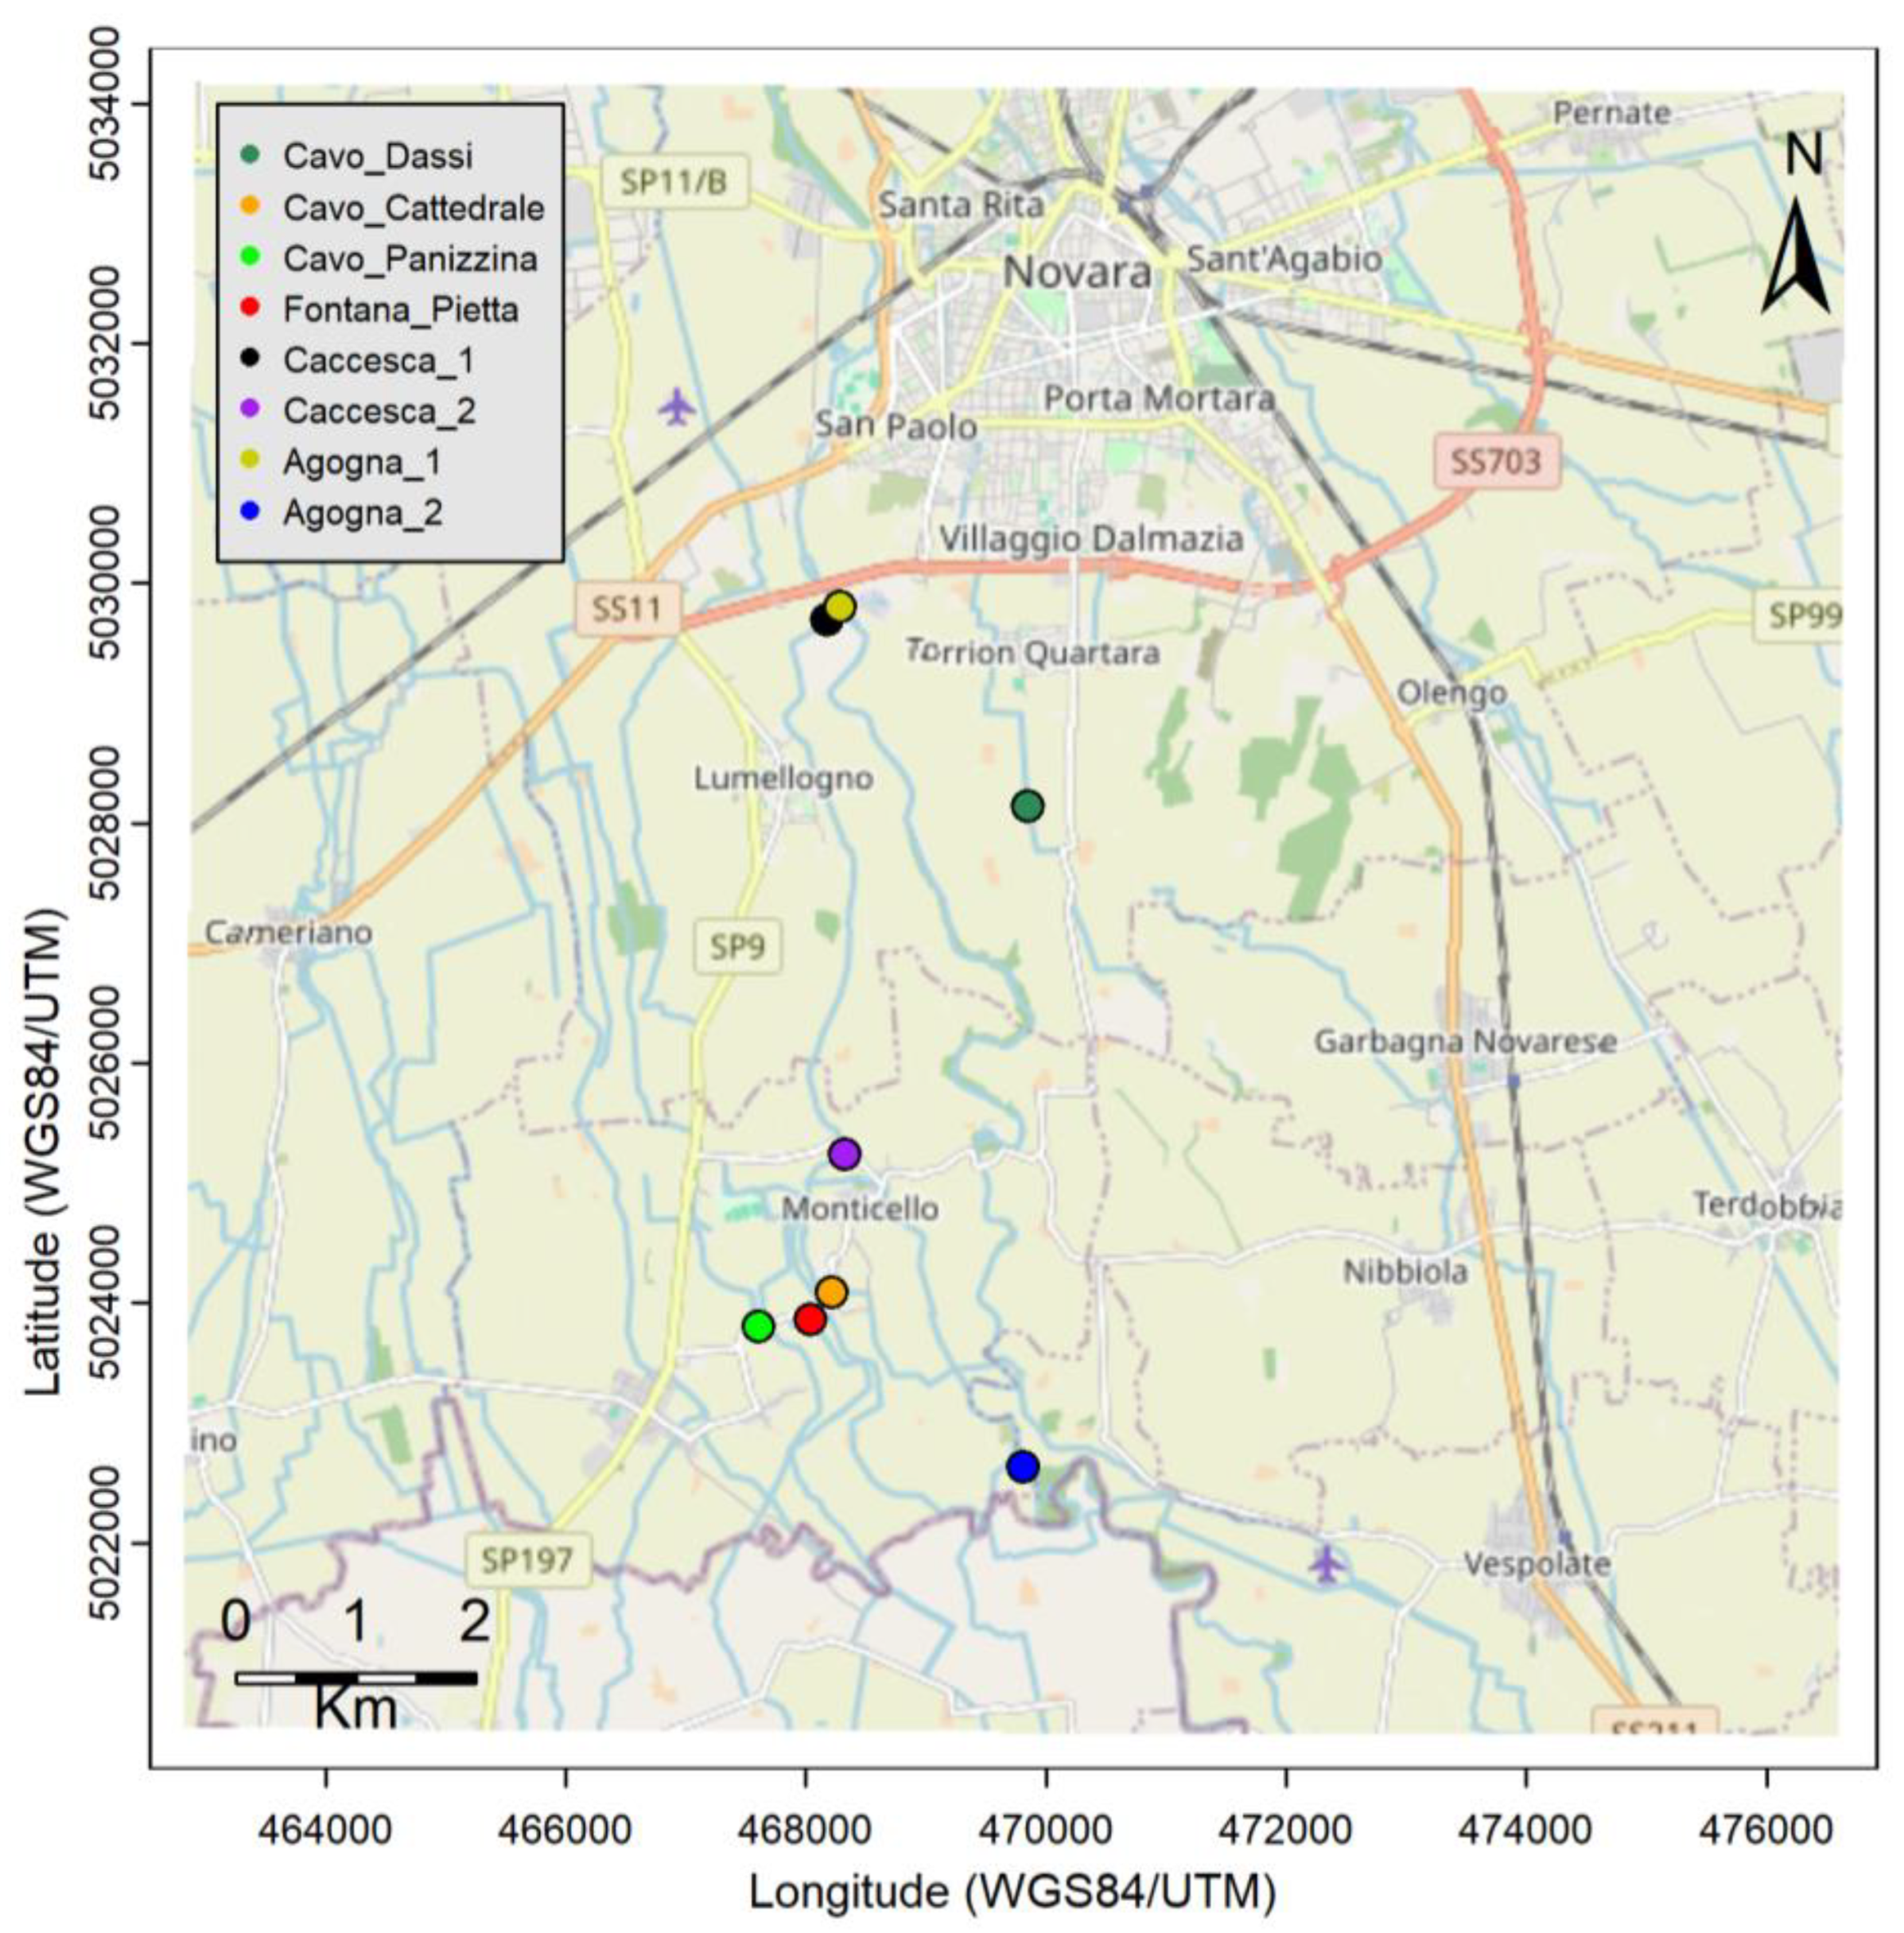
2.1. Area of Study

Novara is the second biggest city in the Piedmont Region according to the number of citizens (around 102,000 people), and it is, respectively, 52 and 98 Km apart from Milan and Turin (i.e., the main cities in northwestern Italy). Only the northern portion of Novara Province is characterized by some mountain and hilly areas, while the southern part is dominated by agricultural land use. The Agogna River (catchment area = 995 Km2; total length = 140 Km) is one of the main watercourses in this area: it originates from a complex of alpine mountains between Lake Orta and Lake Maggiore and, after running for 60 Km, it flows near the western border of the Novara municipality. Then, the Agogna River flows across rice paddies for 80 Km until its confluence with the Po River. Rice cultivation in this area of Italy has been historically documented since the late Middle Ages [19] and has contributed, over time, to shaping the local landscape as well as its social and economic identity. Therefore, this geographical area is characterized by a dense network of agricultural ditches. Eight sampling sites from six different watercourses were selected in the southern area of the Novara municipality (Figure 1).
Two sites were located on the Agogna River: one upstream (Agogna1) and the second one around 9.5 Km downstream (Agogna2). Similarly, two sampling sites were selected on the Roggia Caccesca, an agricultural watercourse directly fed by the Agogna River. The upstream site, Caccesca1, was close to Agogna1, while the downstream site, Caccesca2, was located 5 Km downstream. The remaining four sampling sites were selected in other agricultural ditches, namely Cavo Dassi, Cavo Cattedrale, Cavo Panizzina, and Fontana Pietta (Figure 1). Due to the proximity of the selected ditches, the Agogna River was included in this study because its macroinvertebrate community is expected to represent the potential pool of taxa colonizing the agricultural ditches. Moreover, this can facilitate a comparison of the macroinvertebrate richness and composition between the different watercourses in the area of study, as previously carried out in other studies [3,8]. All of the selected watercourses are permanent, with the exception of Cavo Dassi, which depending on the year, is affected by a drying phase during winter (December–March).

2.2. Data Collection

All of the sampling sites were surveyed from the 20th to the 27th of October 2022, which is at the end of the agricultural season associated with the rice crop. Benthic macroinvertebrates were sampled from the riverbed with a Surber net (0.05 m2; 250 μm mesh size) [20] and a multi-habitat proportional scheme was adopted [21]. Ten Suber samples were collected from each site according to the percentage cover of the mineral and biotic microhabitats. In addition, for each site, the sample water velocity (m/s) and water depth (cm) were recorded. Dissolved oxygen (mg/l), electrical conductivity (µS/cm), water temperature (°C), and pH were measured at each sampling site using a multiprobe (Hanna, mod. HI98194). Further, a water sample was collected and returned to the laboratory for analysis of the total phosphorous and nitrates. Macroinvertebrate samples were transferred into plastic tins and preserved in ethanol. In the laboratory, macroinvertebrates were sorted, counted, and taxonomically identified to the genus (mostly Plecoptera, Ephemeroptera, and Odonata) or family level by using a stereomicroscope (Leica, mod. EZ4), and the taxonomic keys for Italian fauna were used [22,23]. Moreover, benthic macroinvertebrates were classified into the following functional feeding groups: collector–gatherers, filter-feeders, predators, scrapers, and shredders [22,23].

2.3. Statistical Analyses

Principal component analysis (PCA) was performed to visualize the differences in the environmental conditions among the sampling sites. The percentage data on microhabitat occurrence were arcsine-transformed before performing this analysis, while the average water velocity and water depth were calculated for each site as the arithmetic mean of the ten measures associated with the Surber samples.
Different statistical analyses were applied to the macroinvertebrate data depending on the specific aim. Taxa accumulation curves were first drawn to check the representativeness of the macroinvertebrate communities in relation to the sampling effort (i.e., the number of Surber samples). Then, for each site, the total macroinvertebrate community was obtained by pooling together all the Surber samples. Changes in the taxonomic composition of macroinvertebrate communities among sampling sites were visually and statistically evaluated by means of heatmap and PERMANOVA. The Bray–Curtis index was used as a dissimilarity measure. The STAR_ICM index and its six sub-metrics [24,25] were calculated to check for differences in the richness, diversity, and ecological status class among the sampling sites. In Italy, STAR_ICMi is the official biomonitoring index based on macroinvertebrates to assess the ecological status of running waters in compliance with the European Water Framework Directive 2000/60 (WFD). It is a multimetric index obtained by the weighted sum of the following metrics: Average Score Per Taxon (ASPT), number of Ephemeroptera, Plecoptera and Trichoptera families (EPT); the total number of macroinvertebrate families; 1- the relative proportion of Gastropoda, Oligochaeta, and Diptera (1-GOLD); Shannon index; and the logarithm of the abundance of selected Ephemeroptera, Plecoptera, Trichoptera, and Diptera taxa plus one (Log10_Sel_EPTD+1) [24,25]. The ASPT was calculated by using the implemented scores for the Italian macroinvertebrate fauna. This resulted in 38 macroinvertebrate families for whom it was possible to assign a score (see Supplementary Materials Table S1). According to the WFD, the ecological assessment is expressed as the Ecological Quality Ratio (EQR) between the observed and reference conditions. This means that each sub-metric of the STAR_ICMi is first normalized with the value of the reference community and weighted. The values thus obtained are summed and, again, normalized with the reference STAR_ICMi value [18]. The reference values for both STAR_ICMi and its sub-metrics are listed in the Italian Ministerial Decree DM 260/2010. In addition, the BMWP (Biological Monitoring Working Party) index [26,27] was calculated as an additional biomonitoring index due to its worldwide application for lotic ecosystems [28,29]. The percentage abundance of all functional feeding groups was calculated to evaluate changes in the functional composition of macroinvertebrate communities among the sampling sites. Moreover, by adopting the approach proposed by [30,31], four ecosystem attributes (Table 1) were calculated as the ratio between the abundance of selected functional feeding groups. These unitless numerical variables are used as surrogates of more complex measures of processes and features of lotic ecosystems. The autotrophy/heterotrophy attribute provides information on the main energy pathway (i.e., instream production vs. detritus food chain) in the lotic ecosystem based on the feeding strategy and preferred food items of macroinvertebrate communities. Av.CPOM and Av.FPOM indicate the availability of coarse particulate organic matter and fine particulate organic matter, respectively, and these attributes describe the contribution of these two sources of organic detritus to food webs. The bottom stability attribute, instead, uses the feeding strategies of macroinvertebrates to obtain information on substrate stability. Indeed, a relatively stable substrate is required by scrapers and filter-feeders when feeding on a mature periphytic layer or maintaining their position, respectively.
To better evaluate the relationships between the community-based metrics and the environmental conditions of the sampling sites, the first two axes of PCA (i.e., PC1 and PC2) were used as gradients of the physical and chemical parameters in the study area. Spearman’s correlation test was applied to statistically evaluate the correlation between biomonitoring indices and metrics, the percentages of functional feeding groups, ecosystem attributes, and the first two axes of PCA.
All of the statistical analyses (significant threshold = p < 0.05) were performed with R software [32] using the basic functions and those in the following R packages: biomonitoR [33], ggplot2 [34], gplots [35], and vegan [36].

3. Results

3.1. Environmental Parameters

Overall, the first two axes of the PCA accounted for 66.12% of the total variance associated with the environmental variables. PC1 alone explained 44.50% of the variance: it was positively correlated with the electrical conductivity, water temperature, percentage of dissolved oxygen, and sand, while it was negatively correlated with the percentage cover of mesolithal and the concentration of nitrates (Figure 2).
On the contrary, the second axis of the PCA (PC2) explained 21.62% of the variance in the environmental conditions among the sampling sites. PC2 was positively correlated with the concentration of total phosphorous, the percentage cover of gravel, and the amount of CPOM, while it was negatively correlated with the occurrence of microlithal, macrophytes, and water depth (Figure 2).
The sampling sites showed heterogeneous conditions in terms of water chemistry and substrate. Both sampling sites in the Agogna River (i.e., Agogna1 and Agogna2) were in the bottom-left part of the PCA ordination plot and were characterized by greater water depths and concentrations of nitrates. Caccesca1 and Cavo Dassi were oriented in the upper-left part, and these sites showed an increased percentage of gravel and a higher amount of CPOM.
By contrast, all of the other sampling sites in the agricultural ditches occupied the right side of the PCA ordination plot and were generally associated with medium-to-fine substrate particle size and higher percentages of dissolved oxygen, pH, and conductivity. In particular, Caccesca2, Cavo Cattedrale, and Fontana Pietta were characterized by higher amounts of macrophytes, while Cavo Panizzina stood alone and was associated with elevated concentrations of total phosphorous and pH (Figure 2).

3.2. Macroinvertebrates

A total of 12,429 macroinvertebrates belonging to 52 different taxa were collected in this study. Chironomidae, Lumbricidae, Echinogammarus sp., Asellus sp., and Hydropsychidae were the most abundant taxa and together accounted for 78.5% of all macroinvertebrates collected in this study. The average number of taxa per sample and the average density (number of individuals/m2) were 9 (±4.391 SD) and 3147 (±3622 SD), respectively. The complete list of taxa found in each site is illustrated in Table S2 (Supplementary Materials).
Taxa accumulation curves showed that the sampling effort (i.e., 10 Suber samples in each site) was adequate to obtain representative values of macroinvertebrate taxonomic richness in the study area (Figure 3). On average, at all sampling sites, taxa accumulation curves plateaued after six Suber samples, indicating that additional effort scarcely contributed to increasing the number of taxa.
Taxonomic composition of macroinvertebrate communities significantly varied among sampling sites (PERMANOVA: F7,72 = 4.475; p-value = 0.001). Fontana Pietta and Caccesca2 clustered together and were the most dissimilar sites, especially when compared to the macroinvertebrate communities sampled in the Agogna River (Figure 4). Among the remaining sites, two main groups were identified: Agogna1, Agogna2 and Caccesca1 showed a more similar community composition and clustered separately from the agricultural ditches Cavo Dassi, Cavo Panizzina, and Cavo Cattedrale.
When looking at the biomonitoring assessment through the calculation of the STAR_ICMi index, differences in ecological status were found among the sampling sites, and these were mainly driven by differences in most of the sub-metrics composing the index. ASPT weakly varied among the sampling sites and ranged from 3.909 in Agogna2 to 5.600 in Cavo Panizzina (Figure 5a). Similarly, small variations in the total number of macroinvertebrate families were observed, with the lowest values recorded in Agogna2, Caccesca1, and Caccesca2 (22 families), while the highest values were observed in Cavo Panizzina and Fontana Pietta (27 families) (Figure 5b). On the contrary, marked differences in EPT (Ephermeroptera, Plecoptera, and Trichoptera) richness were found: only four EPT families were found in Agogna2, while nine EPT families were collected in Fontana Pietta, which was the richest site for EPT taxa, followed by Cavo Panizzina (Figure 5c). However, the major differences among sampling sites arose when looking at the compositional metrics or when including the abundance of taxa. Sel(EPTD + 1) is a compositional metric examining the abundance of selected Ephemeroptera, Plecoptera, Trichoptera, and Diptera taxa. This metric ranged from 0 in Agogna2, indicating that none of the selected taxa were found in this site, to 1.838 in Fontana Pietta, followed by Caccesca2, with a value of 1.612 (Figure 5d).
Similarly, pronounced variations among sampling sites were observed for 1-GOLD. This metric varied from 0.053 in Cavo Dassi, indicating that the macroinvertebrate community was strongly dominated by Gastropoda, Oligochaeta, and Diptera at this site, to 0.758 in Fontana Pietta, indicating that the relative abundance of Gastropoda, Oligochaeta and Diptera was lower at this site compared to that of other macroinvertebrate taxa (Figure 5e). When the diversity was examined using the Shannon index (Figure 5f), the highest values were recorded in Agogna1 and Fontana Pietta, 1.934 and 1.868, respectively, demonstrating that the evenness of taxa was high at these sites. On the contrary, the lowest Shannon index value was found in Cavo Dassi (0.531), where the benthic invertebrate community was dominated by Chironomidae. Because of the above-mentioned variations in the metrics, sampling sites had different ecological status classes (Figure 5g). Only Fontana Pietta reached the “Good” class (STAR_ICMi = 0.807). Most sampling sites fall into the “Moderate” class, with the exception of Agogna2 and Cavo Dassi, which were classified as “Poor” (Figure 5g). The ecological status assessment based on the BMWP index (Figure 5h) depicted a different scenario. According to this latter index, only Agogna2 was classified as “mild polluted” (BMWP = 86, II Class), while all the other sampling sites had a BMPW score higher than 100 (I Class), thus representing “not polluted or not sensibly altered” sites.
From a functional standpoint, in all sampling sites, benthic macroinvertebrate communities were dominated by collector–gatherers (percentage abundance > 45%), with the exception of Fontana Pietta, where this functional feeding group accounted for 13.2% of the whole community (Figure 6a). The highest percentage of filter-feeders was recorded in Caccesca1 (42.9%) and Fontana Pietta (24.7%), respectively, while in the other sites, the percentage of this functional feeding group was lower than 10% (Figure 6a). The relative abundance of predators was low compared to that of other FFGs and ranged from 1.6% in Caccesca1 to 5.3% in Cavo Cattedrale. The percentage of scrapers strongly varied among sampling sites, with the highest and the lowest values being found in Cavo Cattedrale (19.8%) and Agogna2, respectively (Figure 6a). Likewise, the percentage of shredders peaked in Fontana Pietta (42.2%), Caccesca2 (38.8%), and Agogna1 (29.6%), while in the remaining sites, this functional feeding group accounted for less than 10% of the whole community.
The above-mentioned variations in the relative abundance of feeding functional groups among sites affected the ecosystem attributes, as derived by their ratios. In all sampling sites, the ratio between scrapers to total collectors was less than 0.5, with the highest values observed in Cavo Cattedrale and Fontana Pietta (Figure 6b). The availability of the CPOM ratio was highest in Fontana Pietta, Caccesca2, and Agogna1, while in the other sampling sites, this attribute was always lower than 0.1 (Figure 6c). By contrast, the filterer-to-collector ratio, namely the attribute indicating the availability of FPOM in transport, was generally low at all sampling sites, with the exception of Caccesca1 and Fontana Pietta, where it was 0.90 and 1.87, respectively (Figure 6d). Figure 6e illustrates that the bottom stability ratio was highest in Caccesca1 and Fontana Pietta, while this latter ecosystem attribute was quite low in the remaining sampling sites.
When looking at the correlation between the biodiversity and biomonitoring metrics and axes of PCA, most of them were not statically significant, with only a few exceptions (Table 2). ASPT, BMWP, and the total number of families were positively and statistically correlated with PC1. By contrast, both the percentage of shredders and the autotrophy/heterotrophy ratio showed a significant and negative correlation with PC2 (Table 2).

4. Discussion

The overall aim of this study was to shed light on the ecological integrity of agricultural ditches in terms of biodiversity, ecological status, and ecosystem attributes. While most of the previous studies only addressed some taxonomic or functional aspects of biological communities associated with these aquatic ecosystems [37,38,39], to our knowledge, this is the first study that simultaneously examines all of these complementary facets related to the biodiversity and biomonitoring of agricultural ditches by analyzing the macroinvertebrate community, especially in northwestern Italy.
Although all of the watercourses were selected within the same area of study and were quite close to each other, our results indicate that environmental conditions differed between sampling sites in terms of water chemistry and microhabitat heterogeneity. In particular, PCA clearly clustered the two sites of the Agogna River and Caccesca1 apart from the remaining sites. These findings indicate that agricultural streams provide different habitat conditions compared to the rivers they are fed by, thus contributing to creating a mosaic of aquatic habitats at the local scale. Similar results were found by Leslie et al. [40] in a study focused on 29 ditches in Maryland, which showed higher environmental heterogeneity, especially in terms of flow velocity, conductivity, dissolved oxygen, total solid, total nitrogen, phosphorous, and carbon concentration. Likewise, Gething et al. [41] evaluated the influence of the substrate on the habitat heterogeneity of agricultural ditches and found that distinct macroinvertebrate taxa and communities were associated with different substrate types. By contrast, in a field survey on lowland agricultural ditches in Südtirol (Alto Adige Valley, northeastern Italy), Vallefuoco et al. [42] observed that the investigated watercourses had generally low substrate heterogeneity, which is likely a consequence of the frequency and intensity of management practices.
In our study, such heterogeneity in habitat conditions affected the diversity and composition of macroinvertebrate communities. While little to negligible variation in the total number of taxa was observed among the sites, the main differences arose when looking at the taxonomic composition of macroinvertebrate communities (Table S2). Like previous studies comparing macroinvertebrate communities between rivers and ditches [43,44], we found that macroinvertebrate communities in the Agogna River were taxonomically different from those in agricultural ditches despite the fact that changes were even observed within these latter watercourses. On the contrary, the macroinvertebrate community of Caccesca1 showed high similarity with that of the Agogna River but it can be explained by the fact that this site was really close to Agogna1. Thus, it is likely that the short distance facilitates the dispersion and colonization of macroinvertebrates from the Agogna River. In a field study conducted in Florida (USA), Simon and Travis [45] found higher macroinvertebrate and fish taxon richness in altered streams and ditches than within natural streams. The authors explained that these findings relate to the migration of species between connected ditch and altered stream habitats, thus highlighting the importance of dispersal-related processes in shaping aquatic communities [46,47].
Moreover, the compositional changes observed in this study can be explained by the taxon-specific preferences of macroinvertebrates toward the near-bed and chemical conditions. For instance, Baetis sp., Lumbricidae, Lumbriculidae, Hydropsychidae, and Asellus sp. were more abundant in the Agogna River and Caccesca 1, where the river bottom was mainly composed of medium-to-large mineral substrates (i.e., cobbles and gravel), and the water velocity was generally high. On the contrary, Echinogammarus sp., Aphelocheirus sp., Calopteryx sp., and the invasive species Corbicula fluminea were more abundant in the agricultural ditches, especially Fontana Pietta and Caccesca 2, where the substrate was dominated by aquatic macrophytes and finer mineral substrates (i.e., sand and small gravel). These findings stress the influence of substrates on the distribution and abundance of macroinvertebrates and corroborate previous evidence on the macroinvertebrate taxon-specific preferences for substrate types [48,49,50,51].
The previously mentioned differences in community composition were confirmed and even strengthened by the analysis of the sub-metrics composing the STAR_ICMi index. Marked variations in the EPT richness, 1-GOLD, Sel(EPTD + 1), and Shannon index were observed among sites. For all these metrics, the highest values were found in Fontana Pietta, thus indicating that the macroinvertebrate community at this site was characterized by a higher diversity of EPT taxa, a lower abundance of Gastropoda, Oligocheta, and Diptera, as well as higher evenness among taxa. Greater occurrence of EPT taxa was also found in Agogna1, Cavo Cattedrale, and Caccesca2, while Agogna2 and Cavo Dassi were the poorest and less diverse sites, with benthic invertebrate communities dominated by Gastropoda, Oligocheta, and Diptera.
With the exception of Fontana Pietta, which showed coherently high values of almost all metrics, the remaining sites exhibited both high and low values depending on the metrics. These variations influenced the ecological status of the sampling sites. Indeed, according to the STAR_ICMi index, only Fontana Pietta reached the “Good” class, while the other sites were mostly classified as moderately to impacted river stretches. The worst situations were recorded in Agogna2 and Cavo Dassi. By contrast, when the ecological status was assessed by using the BMWP index, we found very different results: all of the sampling sites fell into the I class (i.e., “not-polluted”), while only Agogna2 was classified as “mild-polluted” (i.e., II class). One possible reason for the contrasting results observed here may relate to how the STAR_ICMi and BMWP indices are calculated. While STAR_ICMi is a multimetric index that combines qualitative and quantitative community metrics, BMWP is a score index that is calculated by summing the sensitivity score of the macroinvertebrate taxa based on their presence only. Therefore, the performance of the BMWP index seems to be more influenced by patterns in total taxon richness, while the STAR_ICMi index better reflects changes in the relative abundance of macroinvertebrate taxa and their evenness within a community. In this study, since the total number of taxa had minimal variations among sites, ranging from 22 to 27 taxa, it is not surprising that BMWP, as well as other richness-based indices (e.g., ASPT), showed little to negligible variations and depicted a comparable situation. On the contrary, the STAR_ICMi index was more effective in detecting the significant compositional changes among the macroinvertebrate communities of the sampling sites, as clearly demonstrated by our multivariate analysis.
Nevertheless, BMWP, ASPT, and total taxon richness were the unique taxonomic and biomonitoring metrics statistically correlated with at least one axis of PCA (i.e., PC1). All of these indices increased with enhanced electrical conductivity, water temperature, and dissolved oxygen and decreased with enhanced mesolithal percentage cover and concentration of nitrates. Therefore, in this study, qualitative and richness-based indices were more effective rather than STAR_ICMi and other compositional metrics in terms of detecting variations in macroinvertebrate diversity along with environmental gradients.
Overall, these findings highlight the importance of including both richness-based and abundance-based metrics when analyzing the diversity of biological communities in lotic ecosystems, as stressed by previous researchers [52,53,54].
Moreover, although both STAR_ICMi and BMWP indices are widely used in biomonitoring programs [24,25,26,27,28,29], these results suggest that further studies are needed to implement our knowledge and methodologies for the ecological status assessment of agricultural ditches and streams [55,56]. In this respect, Verdonschot et al. [57] developed a multimetric index to assess the water quality of agricultural ditches by aggregating five different macroinvertebrate-based community metrics: Trichoptera family richness, percentage of Gastropoda families, percentage of taxa associated with freshwater, Dutch Saprobic index, and the percentage of predators. The response of the selected metrics was tested along gradients of eutrophication, organic pollution, and salinity.
Beyond taxonomic diversity and biomonitoring, we also found strong differences in the functional organization of macroinvertebrate communities among sampling sites. Collector–gatherers were generally the numerically dominant feeding function group, but the macroinvertebrate community in Fontana Pietta, again, was notable different from the other ones and characterized by comparatively higher proportions of shredders, filterers, and scrapers. In Fontana Pietta, Echinogammarus sp., C. fluminea, and Lymnea sp. were the most abundant taxa, thus driving the higher proportion of shredders, filterers, and scrapers, respectively. Their abundance in Fontana Pietta can be likely explained by the great occurrence of macrophytes and sandy substrates, which are the preferred microhabitats for these taxa [21,22]. These results are confirmed by previous studies that examined variations in the functional composition of macroinvertebrate communities in ditches [40,58].
Although functional feeding groups are widely utilized in river ecology [59,60,61], to our knowledge, this is one of the first studies to use ratios between these functional groups as surrogates for obtaining the ecosystem attributes of agricultural ditches. As expected, our results indicate that all of the selected sites in this study are mainly heterotrophic systems that rely on the coarse and fine organic detritus, and have limited stream bottom stability. Fontana Pietta was the sampling site that, when compared to the other ones, showed the highest and more coherent ecosystem attributes. For instance, when looking at the energy pathway, the highest Av.CPOM and Av.FPOM ratios recorded in this watercourse indicated that the availability of both CPOM and FPOM was greatly supplied. However, a remarkable contribution of instream primary production was even observed based on the autotrophy/heterotrophy ratio. These results suggest that Fontana Pietta is mainly a heterotrophic system where most of the energy comes from the organic detritus food chain; however, additive energetic inputs are also provided by primary producers, such as macrophytes and benthic algae. Owing to the importance of substrate stability for the growth of instream primary producers, this latter aspect can be likely explained by the fact that in Fontana Pietta, we observed the second highest value for the bottom stability ratio. These findings support those relating to taxonomic diversity and biomonitoring and suggest that, among the agricultural ditches in this study, Fontana Pietta offers the highest ecological integrity. This can be explained by the fact that Fontana Pietta partially receives inputs from groundwater. However, further studies are needed to verify whether Fontana Pietta can be a reliable reference site for implementing the biomonitoring and management of agricultural ditches in this area of study. To this end, the main thematic legislation in Europe, namely the Water Framework Directive (2000/60/EC-WFD), adopts a biomonitoring approach based on the Ecological Quality Ratio (i.e., EQR) [18]. This means that the ecological status is derived from the ratio between the observed and the reference biological community. However, according to the WFD, agricultural ditches were largely excluded from the monitoring networks in the past because they are generally considered Heavily Modified Water Bodies (HMWBs). In light of this, the data gained in this study can be used to identify the expected and reference macroinvertebrate community for agricultural ditches in the study area, thus implementing the biomonitoring standards.
Finally, it should be acknowledged that the one limitation of this study is represented by the short time period in which the data were collected. Although all of the selected watercourses are permanent, with the exception of Cavo Dassi, which is occasionally affected by a drying phase during the winter season (December–March), the sampling period considered here (i.e., October) is probably the most suitable one because it corresponds to the end of the agricultural season related to the rice crop, thus guaranteeing permanent flow since March in all the sampling sites. However, to better evaluate the temporal sources of variation in macroinvertebrate diversity associated with both species’ phenology and agricultural practices, future studies should be performed by collecting data over different seasons.
By examining variations in different and complementary facets of macroinvertebrate communities, such as taxonomic composition, diversity and functional metrics, biomonitoring indices and even ecosystem attributes, this study provides a detailed, but still rarely applied, evaluation of the ecological status and biodiversity of the investigated watercourses. Thus, these results can serve as informative data for future studies and for ameliorating the management of agricultural ditches.

Supplementary Materials

The following supporting information can be downloaded at: https://www.mdpi.com/article/10.3390/d16090558/s1, Table S1: List of the 38 macroinvertebrate families for whom it was possible to assign the score for the calculation of the ASPT index; Table S2: List of macroinvertebrate taxa found in each sampling sites.

Author Contributions

Conceptualization, A.D.; methodology, formal analysis, writing—original draft preparation, A.D.; data collection, writing—review and editing, A.D., C.S., M.C., and D.S. All authors have read and agreed to the published version of the manuscript.

Funding

This study originated from the collaboration between the Department for Sustainable Development and Ecological Transition (DiSSTE) of University of Eastern Piedmont and Unione Tutela Consumatori of Novara. Moreover, this study is part of the project “The biocultural dimensions of Eastern Piedmont’s waterlands: a multifaceted heritage to originate future development—H20-lands. Heritage to Originate” which has received funding from European Commission—NextGeneration EU and Compagnia di San Paolo.

Institutional Review Board Statement

Not applicable.

Data Availability Statement

Data are available from the corresponding author upon reasonable request.

Acknowledgments

Authors are very grateful to Franco Conturbia as representative of the Unione Tutela Consumatori—Osservatorio Ambientale of Novara for his help in the selection of the sampling sites as well as his assistance during data collection. Also, authors wish to thank the three anonymous reviewers for their input and suggestions.

Conflicts of Interest

The authors declare no conflicts of interest.

References

  1. Needelman, B.A.; Kleinman, P.J.; Strock, J.S.; Allen, A.L. Drainage Ditches: Improved management of agricultural drainage ditches for water quality protection: An overview. J. Soil Water Conserv. 2007, 62, 171–178. [Google Scholar]
  2. Dollinger, J.; Dagès, C.; Bailly, J.S.; Lagacherie, P.; Voltz, M. Managing ditches for agroecological engineering of landscape. A review. Agron. Sustain. Dev. 2015, 35, 999–1020. [Google Scholar] [CrossRef]
  3. Williams, P.; Whitfield, M.; Biggs, J.; Bray, S.; Fox, G.; Nicolet, P.; Sear, D. Comparative biodiversity of rivers, streams, ditches and ponds in an agricultural landscape in Southern England. Biol. Conserv. 2004, 115, 329–341. [Google Scholar] [CrossRef]
  4. Herzon, I.; Helenius, J. Agricultural drainage ditches, their biological importance and functioning. Biol. Conserv. 2008, 141, 1171–1183. [Google Scholar] [CrossRef]
  5. Death, R.G. Disturbance and riverine benthic communities: What has it contributed to general ecological theory? River. Res. Appl. 2010, 26, 15–25. [Google Scholar] [CrossRef]
  6. De Meester, L.; Declerck, S.; Stoks, R.; Louette, G.; Van De Meutter, F.; De Bie, T.; Michels, E.; Brendonck, L. Ponds and pools as model systems in conservation biology, ecology and evolutionary biology. Aquat. Conserv. 2005, 15, 715–725. [Google Scholar] [CrossRef]
  7. Iwamoto, H.; Tahara, D.; Yoshida, T. Contrasting metacommunity patterns of fish and aquatic insects in drainage ditches of paddy fields. Ecol. Res. 2022, 37, 635–646. [Google Scholar] [CrossRef]
  8. Gething, K.J.; Little, S. The importance of artificial drains for macroinvertebrate biodiversity in reclaimed agricultural landscapes. Hydrobiologia 2020, 847, 3129–3138. [Google Scholar] [CrossRef]
  9. Ward-Campbell, B.; Cottenie, K.; Mandrak, N.E.; McLaughlin, R. Fish assemblages in agricultural drains are resilient to habitat change caused by drain maintenance. Can. J. Fish. Aquat. Sci. 2017, 74, 1538–1548. [Google Scholar] [CrossRef]
  10. Leslie, A.W.; Lamp, W.O. Burrowing macroinvertebrates alter phosphorus dynamics in drainage ditch sediments. Aquat. Sci. 2019, 81, 23. [Google Scholar] [CrossRef]
  11. Linares, M.S.; dos Santos, L.B.; Callisto, M.; Santos, J.C. Physical habitat condition as a key tool to maintain freshwater biodiversity in neotropical artificial ponds. Water Biol. Secur. 2023, 2, 100–189. [Google Scholar] [CrossRef]
  12. Uno, H.; Power, M.E. Mainstem-tributary linkages by mayfly migration help sustain salmonids in a warming river network. Ecol. Lett. 2015, 18, 1012–1020. [Google Scholar] [CrossRef]
  13. Huryn, A.D.; Wallace, J.B. Life history and production of stream insects. Annu. Rev. Entomol. 2000, 45, 83–110. [Google Scholar] [CrossRef]
  14. Cummins, K.W. Combining taxonomy and function in the study of stream macroinvertebrates. J. Limnol. 2016, 75, 235–241. [Google Scholar] [CrossRef]
  15. Sitati, A.; Masese, F.O.; Yegon, M.J.; Achieng, A.O.; Agembe, S.W. Abundance-and biomass-based metrics of functional composition of macroinvertebrates as surrogates of ecosystem attributes in Afrotropical streams. Aquat. Sci. 2021, 83, 73. [Google Scholar] [CrossRef]
  16. Buss, D.F.; Carlisle, D.M.; Chon, T.S.; Culp, J.; Harding, J.S.; Keizer-Vlek, H.E.; Wayne, A.R.; Strachan, S.; Thirion, C.; Hughes, R.M. Stream biomonitoring using macroinvertebrates around the globe: A comparison of large-scale programs. Environ. Monit. Assess. 2015, 187, 4132. [Google Scholar] [CrossRef] [PubMed]
  17. Tornwall, B.; Sokol, E.; Skelton, J.; Brown, B.L. Trends in stream biodiversity research since the river continuum concept. Diversity 2015, 7, 16–35. [Google Scholar] [CrossRef]
  18. Bo, T.; Doretto, A.; Alex, L.; Bona, F.; Stefano, F.; Fenoglio, S.; Laini, A. Biomonitoring with macroinvertebrate communities in Italy: What happened to our past and what is the future? J. Limnol. 2017, 76, 21–28. [Google Scholar] [CrossRef]
  19. Pelloli, C. The long rice story. A comparison of rice’s introduction into Italy and Japan. Asian Archaeol. 2024, 8, 37–58. [Google Scholar] [CrossRef]
  20. Doretto, A.; Bo, T.; Bona, F.; Fenoglio, S. Efficiency of Surber net under different substrate and flow conditions: Insights for macroinvertebrates sampling and river biomonitoring. Knowl. Manag. Aquat. Ecosyst. 2020, 421, 10. [Google Scholar] [CrossRef]
  21. Hering, D.; Buffagni, A.; Moog, O.; Sandin, L.; Sommerhäuser, M.; Stubauer, I.; Feld, C.; Johnson, R.; Pinto, P.; Skoulikidis, N.; et al. The development of a system to assess the ecological quality of streams based on macroinvertebrates–design of the sampling program within the AQEM project. Int. Rev. Hydrobiol. 2003, 88, 345–361. [Google Scholar] [CrossRef]
  22. Campaioli, S.; Ghetti, P.F.; Minelli, A.; Ruffo, S. Manuale per Il Riconoscimento Dei Macroinvertebrati Delle Acque Dolci Italiane; Provincia Autonoma di Trento: Trento, Italy, 1994; Volume I. [Google Scholar]
  23. Campaioli, S.; Ghetti, P.F.; Minelli, A.; Ruffo, S. Manuale per Il Riconoscimento Dei Macroinvertebrati Delle Acque Dolci Italiane; Provincia Autonoma di Trento: Trento, Italy, 1999; Volume II. [Google Scholar]
  24. Erba, S.; Cazzola, M.; Belfiore, C.; Buffagni, A. Macroinvertebrate metrics responses to morphological alteration in Italian rivers. Hydrobiologia 2020, 847, 2169–2191. [Google Scholar] [CrossRef]
  25. Bo, T.; Doretto, A.; Marino, A.; Laini, A.; Candiotto, A. Taxonomic and functional responses of macroinvertebrate communities to dam construction in a non-wadeable river. Knowl. Manag. Aquat. Ecosyst. 2023, 424, 18. [Google Scholar] [CrossRef]
  26. Armitage, P.D.; Moss, D.; Wright, J.F.; Furse, M.T. The performance of a new biological water quality score system based on macroinvertebrates over a wide range of unpolluted running-water sites. Water Res. 1983, 17, 333–347. [Google Scholar] [CrossRef]
  27. Alba-Tercedor, J.; Sánchez-Ortega, A. Un método rápido y simple para evaluar la calidad biológica de las aguas corrientes basado en el de Hellawell (1978). Limnetica 1988, 4, 51–56. [Google Scholar] [CrossRef]
  28. O’Callaghan, P.; Kelly-Quinn, M. Distribution and structure of lotic macroinvertebrate communities and the influence of environmental factors in a tropical cloud forest, Cusuco National Park, Honduras. J. Limnol. 2017, 76, 148–160. [Google Scholar] [CrossRef]
  29. Fenoglio, S.; Doretto, A. Monitoring of neotropical streams using macroinvertebrate communities: Evidence from Honduras. Environments 2021, 8, 27. [Google Scholar] [CrossRef]
  30. Cummins, K.W.; Merritt, R.W.; Andrade, P.C. The use of invertebrate functional groups to characterize ecosystem attributes in selected streams and rivers in south Brazil. Stud. Neotrop. Fauna Environ. 2005, 40, 69–89. [Google Scholar] [CrossRef]
  31. Cummins, K.W.; Wilzbach, M.; Kolouch, B.; Merritt, R. Estimating macroinvertebrate biomass for stream ecosystem assessments. Int. J. Environ. Res. Public Health 2022, 19, 3240. [Google Scholar] [CrossRef]
  32. R Core Team. R: A Language and Environment for Statistical Computing; R Foundation for Statistical Computing: Vienna, Austria, 2023; Available online: https://www.R-project.org/ (accessed on 30 June 2024).
  33. Laini, A.; Guareschi, S.; Bolpagni, R.; Burgazzi, G.; Bruno, D.; GutiérrezCánovas, C.; Miranda, R.; Mondy, C.; Várbíró, G.; Cancellario, T. Biomonitor: An R package for calculating taxonomic and functional indices for river biomonitoring. PeerJ 2022, 10, e14183. [Google Scholar] [CrossRef]
  34. Warnes, M.G.R.; Bolker, B.; Bonebakker, L.; Gentleman, R.; Huber, W.; Liaw, A. Package ‘gplots’; Various R Programming Tools for Plotting Data; 2016; pp. 112–119. Available online: https://cran.r-project.org/web/packages/gplots/gplots.pdf (accessed on 30 June 2024).
  35. Wickham, H.; Chang, W.; Wickham, M.H. Package ‘ggplot2’. Version 2 (1); Create Elegant Data Visualisations Using the Grammar of Graphi Graphics; 2016; pp. 1–189. Available online: https://ggplot2.tidyverse.org/reference/ggplot2-package.html (accessed on 30 June 2024).
  36. Oksanen, J.; Blanchet, F.G.; Friendly, M.; Kindt, R.; Legendre, P.; McGlinn, D.; Minchin, P.R.; O’Hara, R.B.; Simpson, G.L.; Solymos, P.; et al. R Package; Version 2; Vegan: Community Ecology Package; 2015; Available online: http://CRAN.Rproject.org/package=vegan (accessed on 30 June 2024).
  37. Shaw, R.F.; Johnson, P.J.; Macdonald, D.W.; Feber, R.E. Enhancing the biodiversity of ditches in intensively man-aged UK farmland. PLoS ONE 2015, 10, e0138306. [Google Scholar] [CrossRef]
  38. Pieri, L.; Ventura, F.; Ventura, M.; Tagliavini, M.; Ponti, M.; Pistocchi, R.; Albertazzi, S.; Vignudelli, M.; Pisa, P.R. Chemical and biological indicators of water quality in three agricultural watersheds of the Po valley, Italy. Ital. J. Agron. 2011, 6, 29–38. [Google Scholar] [CrossRef]
  39. Gething, K.J. Physicochemical drivers of managed river and agricultural drainage channel macroinvertebrate communities. River. Res. Appl. 2021, 37, 675–680. [Google Scholar] [CrossRef]
  40. Leslie, A.W.; Smith, R.F.; Ruppert, D.E.; Bejleri, K.; Mcgrath, J.M.; Needelman, B.A.; Lamp, W.O. Environmental factors structuring benthic macroinvertebrate communities of agricultural ditches in Maryland. Environ. Entomol. 2012, 41, 802–812. [Google Scholar] [CrossRef]
  41. Gething, K.J.; Ripley, M.C.; Mathers, K.L.; Chadd, R.P.; Wood, P.J. The influence of substrate type on macroinvertebrate assemblages within agricultural drainage ditches. Hydrobiologia 2020, 847, 4273–4284. [Google Scholar] [CrossRef]
  42. Vallefuoco, F.; Vanek, M.; Scotti, A.; Bottarin, R. Effect of management strategies and substrate composition on functional and taxonomic macroinvertebrate communities in lowland ditches of Alto Adige/Südtirol. Gredleriana 2023, 23, 87–1015. [Google Scholar]
  43. Davies, B.R.; Biggs, J.; Williams, P.J.; Lee, J.T.; Thompson, S. A comparison of the catchment sizes of rivers, streams, ponds, ditches and lakes: Implications for protecting aquatic biodiversity in an agricultural landscape. In Pond Conservation in Europe; Springer: Berlin/Heidelberg, Germany, 2010; pp. 7–17. [Google Scholar]
  44. Armitage, P.D.; Szoszkiewicz, K.; Blackburn, J.H.; Nesbitt, I. Ditch communities: A major contributor to flood-plain biodiversity. Aquat. Conserv. 2003, 13, 165–185. [Google Scholar] [CrossRef]
  45. Simon, T.N.; Travis, J. The contribution of man-made ditches to the regional stream biodiversity of the new river watershed in the Florida panhandle. Hydrobiologia 2011, 661, 163–177. [Google Scholar] [CrossRef]
  46. Heino, J.; Melo, A.S.; Siqueira, T.; Soininen, J.; Valanko, S.; Bini, L.M. Metacommunity organisation, spatial extent and dispersal in aquatic systems: Patterns, processes and prospects. Freshw. Biol. 2015, 60, 845–869. [Google Scholar] [CrossRef]
  47. Li, F.; Tonkin, J.D.; Haase, P. Dispersal capacity and broad-scale landscape structure shape benthic invertebrate communities along stream networks. Limnologica 2018, 71, 68–74. [Google Scholar] [CrossRef]
  48. Beisel, J.N.; Usseglio-Polatera, P.; Thomas, S.; Moreteau, J.C. Stream community structure in relation to spatial variation: The influence of mesohabitat characteristics. Hydrobiologia 1998, 389, 73–88. [Google Scholar] [CrossRef]
  49. Mesa, L.M. Hydraulic parameters and longitudinal distribution of macroinvertebrates in a subtropical andean basin. Interciencia 2010, 35, 759–764. [Google Scholar]
  50. Rempel, L.L.; Richardson, J.S.; Healey, M.C. Macroinvertebrate community structure along gradients of hydraulic and sedimentary conditions in a large gravel-bed river. Freshw. Biol. 2000, 45, 57–73. [Google Scholar] [CrossRef]
  51. Doretto, A.; Receveur, J.P.; Baker, E.A.; Benbow, M.E.; Scribner, K.T. Nested analysis of macroinvertebrate diversity along a river continuum: Identifying relevant spatial scales for stream communities. River. Res. Appl. 2022, 38, 334–344. [Google Scholar] [CrossRef]
  52. Verdonschot, R.C.; Keizer-vlek, H.E.; Verdonschot, P.F. Biodiversity value of agricultural drainage ditches: A comparative analysis of the aquatic invertebrate fauna of ditches and small lakes. Aquat. Conserv. 2011, 21, 715–727. [Google Scholar] [CrossRef]
  53. Guareschi, S.; Laini, A.; Sanchez-Montoya, M.M. How do low-abundance taxa affect river biomonitoring? Exploring the response of different macroinvertebrate-based indices. J. Limnol. 2016, 76, 9–20. [Google Scholar] [CrossRef]
  54. Jones, J.I.; Lloyd, C.E.; Murphy, J.F.; Arnold, A.; Duerdoth, C.P.; Hawczak, A.; Pretty, J.L.; Johnes, P.J.; Freer, J.E.; Stirling, M.W.; et al. What do macroinvertebrate indices measure? Stressor-specific stream macroinvertebrate indices can be confounded by other stressors. Freshw. Biol. 2023, 68, 1330–1345. [Google Scholar] [CrossRef] [PubMed]
  55. Harrison, S.; McAree, C.; Mulville, W.; Sullivan, T. The problem of agricultural ‘diffuse’pollution: Getting to the point. Sci. Total Environ. 2019, 677, 700–717. [Google Scholar] [CrossRef] [PubMed]
  56. Keizer-Vlek, H.E.; Verdonschot, P.F.; Verdonschot, R.C.; Goedhart, P.W. Quantifying spatial and temporal variability of macroinvertebrate metrics. Ecol. Indic. 2012, 23, 384–393. [Google Scholar] [CrossRef]
  57. Verdonschot, R.C.; Keizer-Vlek, H.E.; Verdonschot, P.F. Development of a multimetric index based on macroinvertebrates for drainage ditch networks in agricultural areas. Ecol. Indic. 2012, 13, 232–242. [Google Scholar] [CrossRef]
  58. Leslie, A.W.; Lamp, W.O. Taxonomic and functional group composition of macroinvertebrate assemblages in agricultural drainage ditches. Hydrobiologia 2017, 787, 99–110. [Google Scholar] [CrossRef]
  59. Harvey, E.; Altermatt, F. Regulation of the functional structure of aquatic communities across spatial scales in a major river network. Ecology 2019, 100, e02633. [Google Scholar] [CrossRef] [PubMed]
  60. Bonada, N.; Prat, N.; Resh, V.H.; Statzner, B. Developments in aquatic insect biomonitoring: A comparative analysis of recent approaches. Annu. Rev. Entomol. 2006, 51, 495–523. [Google Scholar] [CrossRef] [PubMed]
  61. Salmaso, F.; Crosa, G.; Espa, P.; Quadroni, S. Climate change and water exploitation as co-impact sources on river benthic macroinvertebrates. Water 2021, 13, 2778. [Google Scholar] [CrossRef]
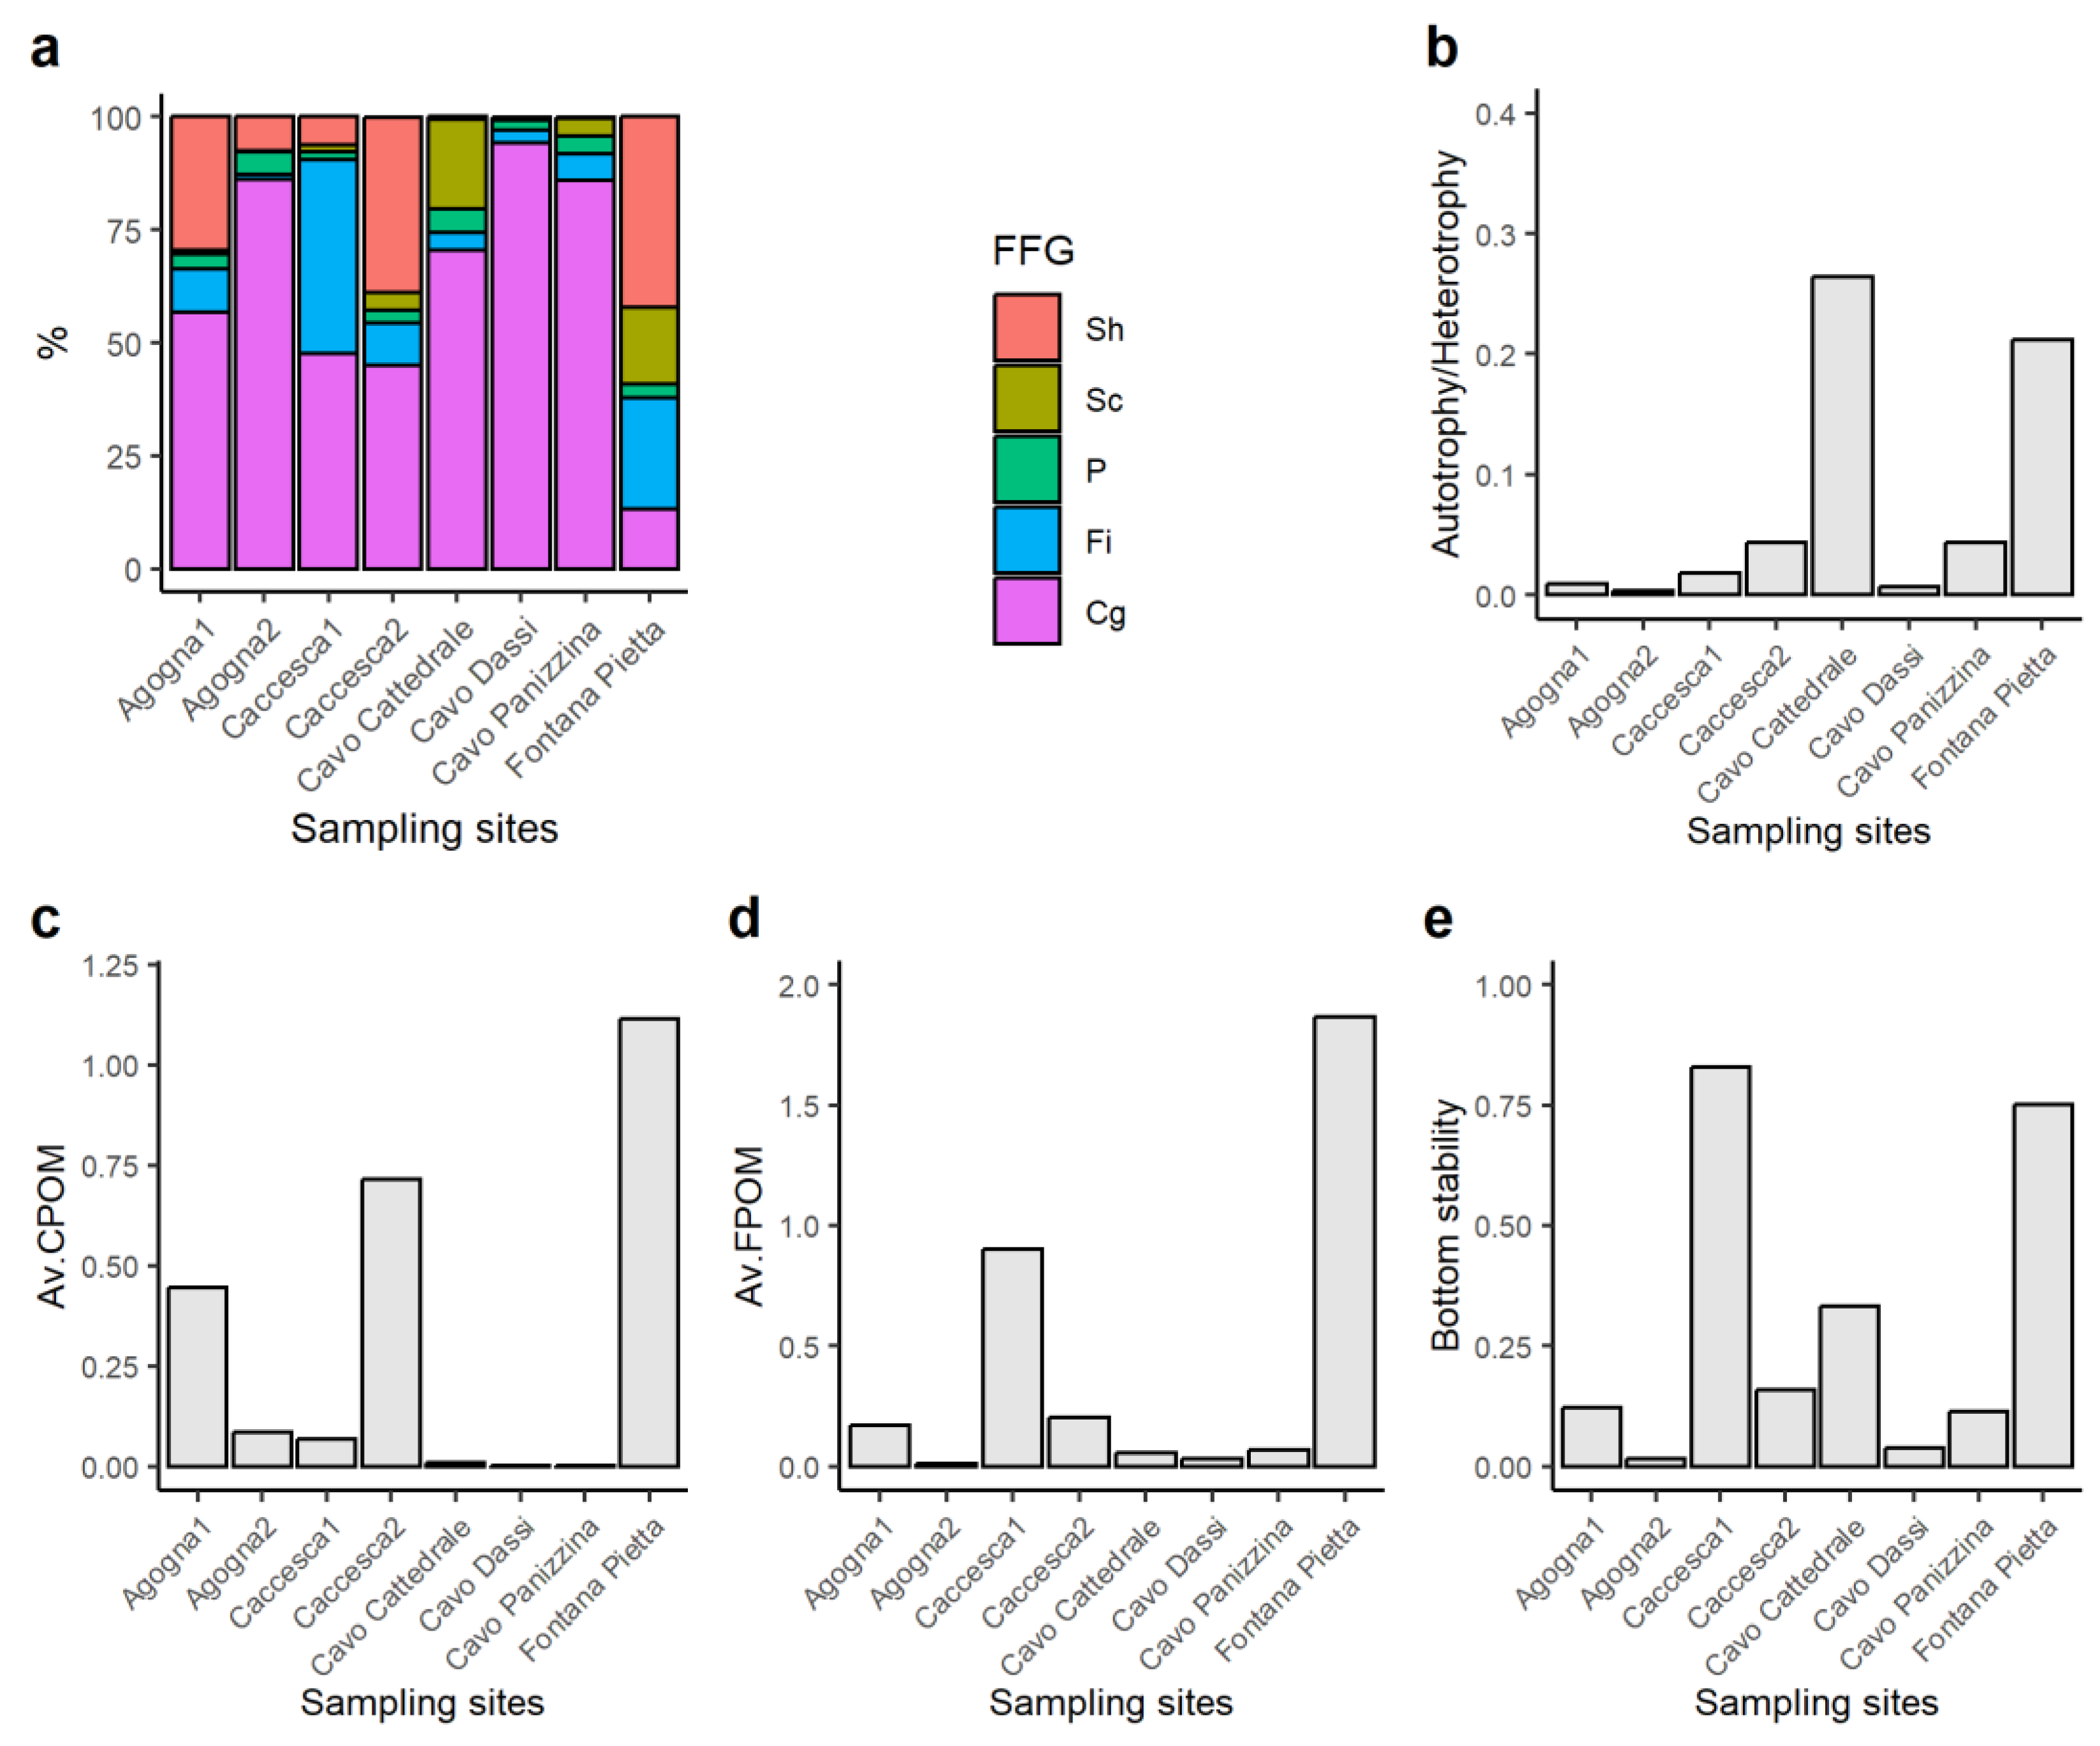
Figure 1. Topographic map of the area of study illustrating the Novara municipality (on the top) and the agricultural areas in the south part, including the watercourses surveyed in this study. Colored dots represent the location of sampling sites in the selected watercourses.
Diversity 16 00558 g001
Figure 2. Principal components analysis (PCA) ordination plot. Black dots and labels indicate the sampling sites; black arrows and labels indicate the environmental parameters: Vel = water velocity; Depth = water depth; SAND (<2 mm); GRAV = gravel (0.2–2 cm); MIC = microlithal (2–6 cm); MES = mesolithal (6–20 cm); CPOM = coarse particulate organic matter; Macrophytes, pH; Cond = electrical conductivity; DOperc = % of dissolved oxygen; Temp = water temperature; Ptot = total phosphorous; NO3 = nitrates.
Diversity 16 00558 g002
Figure 3. Taxa accumulation curves. X-axis indicates the sampling effort (i.e., the number of Surber samples collected in each site); Y-axis indicates the estimated number of taxa.
Diversity 16 00558 g003
Figure 4. Heatmap and dendrogram showing the pairwise dissimilarity in the taxonomic composition of macroinvertebrate communities among sampling sites based on the Bray–Curtis index.
Diversity 16 00558 g004
Figure 5. Bars indicate the values of (a) ASPT, (b) the total number of macroinvertebrate families, (c) the number of EPT families, (d) Sel(EPTD + 1), (e) 1-GOLD, (f) Shannon index, (g) STAR_ICMi index, and (h) BMWP index in all sampling sites.
Diversity 16 00558 g005
Figure 6. Bars indicate the (a) percentage abundance of functional feeding groups (Cg = collector–gatherers; Fi = filter-feeders; P = predators; Sc = scrapers; Sh = shredders) and ecosystem attributes derived from the functional feeding groups ratios: (b) autotrophy/heterotrophy (=Sc to Sh + Cg + Fi ratio); (c) availability of CPOM to FPOM (=Sh to Cg + Fi ratio); (d) availability of FPOM in transport (=Fi to Cg ratio); and (e) bottom stability (=Sc + Fi to Sh + Cg ratio).
Diversity 16 00558 g006
Table 1. Description of the ecosystem attributes calculated as the ratio between the abundances of selected functional feeding groups (Cg = collector–gatherers; Fi = filter-feeders; Sc = scrapers; Sh = shredders). Threshold is derived from [31].
Ecosystem AttributeRatioDescriptionThreshold
Autotrophy/heterotrophySc/(Sh + Cg + Fi)Prevalence of instream production or detritus food-chain based on the feeding strategy of macroinvertebrates>0.75 = Autotrophic
<0.75 = Heterotrophic
Av.CPOMSh/(Cg + Fi)Availability of CPOM to FPOM>0.50 = Abundant food for shredders
<0.50 = Spare food for shredders
Av.FPOMFi/CgAvailability of FPOM in transport>0.50 = Abundant food for filterers
<0.50 = Low food for filterers
Bottom stability(Sc + Fi)/(Sh + Cg) Stream bottom stability based on the feeding strategies of macroinvertebrates>0.50 = Stable bottom dominates
<0.50 = Stable bottom limiting
Table 2. Correlation (Spearman) between biomonitoring indices, community metrics, ecosystem attributes, and the two axes of the PCA. Significant values are in bold (* = p-value < 0.05).
Index or MetricPC1PC2
ASPT0.809 *0.500
N. Families0.716 *0.185
N. Fam. EPT0.5300.001
Sel(EPTD + 1)0.239−0.072
1-GOLD−0.071−0.429
Shannon−0.262−0.714
STAR_ICMi0.429−0.024
BMWP0.778 *0.503
%Gg−0.0950.381
%Fi−0.190−0.143
%P0.524−0.357
%Sc0.6350.108
%Sh0.048−0.785 *
Autotrophy/Heterotrophy0.6670.143
Av.CPOM0.048−0.786 *
Av.FPOM0.024−0.143
Bottom stability−0.0470.001
Disclaimer/Publisher’s Note: The statements, opinions and data contained in all publications are solely those of the individual author(s) and contributor(s) and not of MDPI and/or the editor(s). MDPI and/or the editor(s) disclaim responsibility for any injury to people or property resulting from any ideas, methods, instructions or products referred to in the content.

