Article

Genetic Diversity of Calligonum L. Species Analyzed Using Newly Developed Genomic Simple Sequence Repeats and Their Application to Conservation

1
State Key Laboratory of Desert and Oasis Ecology, Key Laboratory of Ecological Safety and Sustainable Development in Arid Lands, Xinjiang Institute of Ecology and Geography, Chinese Academy of Sciences, Urumqi 830011, China
2
Xinjiang Key Laboratory of Conservation and Utilization of Plant Gene Resources, Xinjiang Institute of Ecology and Geography, Chinese Academy of Sciences, Urumqi 830011, China
3
University of Chinese Academy of Sciences, Beijing 100049, China
4
Turpan Eremophytes Botanical Garden, Chinese Academy of Sciences, Turpan 838008, China
5
College of Life Sciences, Shihezi University, Shihezi 832003, China
*
Authors to whom correspondence should be addressed.
These authors contributed equally to this work.
Diversity 2025, 17(3), 196; https://doi.org/10.3390/d17030196
Submission received: 26 December 2024 / Revised: 5 March 2025 / Accepted: 7 March 2025 / Published: 10 March 2025
(This article belongs to the Special Issue Ecology and Diversity of Plants in Arid and Semi-Arid Ecosystems)

Abstract

:
Various species from the genus Calligonum L. are widely used in erosion control in Northwest China. Their widespread use and breeding efforts highlight the need for the conservation of the high-quality germplasm resources of this genus. To assess genetic diversity, the genome of Calligonum junceum was screened, and 380,328 SSR loci were identified. After further screening, 17 microsatellite markers were identified and transferred to 11 other species of the genus. When analyzed together, the 11 species showed significant discrimination power (PIC = 0.623), and we detected that the mean number of alleles per locus was 2.684, the overall heterozygosity observed value was 0.295, and the expected heterozygosity (He) was 0.373. Genetic diversity in Calligonum mongolicum was the highest at I = 1.305, He = 0.647, and that of Calligonum gobicum was the lowest at I = 0.127, He = 0.072. The results of this study provide reference SSR primers for the genus Calligonum, supporting the improvement of its germplasm conservation efforts.

1. Introduction

The genus Calligonum L., belonging to the Polygonaceae family, includes shrubby or semi-shrubby plants ranging in height from 0.2 to 2.5 m [1]. These plants exhibit diverse morphologies, including richly colored flowers and varied fruit shapes, with photosynthesis primarily occurring in assimilated branches. Fruit morphology plays a key role in the classification of this genus, leading to the identification of four sections based on fruit characteristics: Sect. Calliphysa, Sect. Ptcrococcus, Sect. Medusa, and Sect. Calligonumu [2]. A total of 23 species of this genus occur in China [2]. Species from the genus Calligonum are typically found in desert and semi-desert regions [3], with a wide distribution across Asia, southern Europe, and northern Africa, making them a common component of desert flora in Central Asia and Africa [4]. Some species, such as Calligonum klementzii, Calligonum alaschanicum, Calligonum chinense, Calligonum ebinuricum, Calligonum pumilum, and Calligonum roborowskii, are endemic to China, demonstrating a narrow distribution. Calligonum colubrinum, Calligonum leucocladum, C. junceum, C. mongolicum, and C. gobicum are distributed both in China and abroad. Calligonum arborescens was introduced from abroad [2]. This genus has a longstanding presence in arid deserts, dating back to ancient times [5]. Therefore, understanding genetic diversity is essential for the effective management and conservation planning of Calligonum. This species’ classification remains controversial, as traditional fruit phenotype-based classifications are unreliable [6], and plastid classification has also proven ambiguous [3,7].
Calligonum holds significant ecological, economic, and ornamental value [8]. All plants in this genus have an ecological role in wind and sand control. Due to its rapid growth, dense branching, and ease of propagation, Calligonum has become a crucial species for windbreaks, sand control, and ecological restoration [9]. Calligonum is an excellent tree species for windbreak and sand fixation, with species like Calligonum caput-medusae, Calligonum rubicundum, C. arborescens, and C. ebinuricum being used for these purposes in the Turpan area of Xinjiang [9,10]. Additionally, C. colubrinum, C. pumilum, C. trifarium, C. arborescens, C. mongolicum, C. roborowskii, and C. jeminaicum are utilized as carbon fuelwood and fodder [11]. C. ebinuricum’s resilience to drought, salinity, wind erosion, and sand burial makes it valuable for restoring degraded soils and stabilizing desert ecosystems [11]. Additionally, C. junceum, C. gobicum, and C. leucocladum are nectar plants with ornamental fruit, contributing to landscaping efforts [12]. Calligonum’s ecological value, especially as a wind and sand-fixing species, and its contribution to desertification control, cannot be denied [11,13]. Given its importance, large-scale artificial propagation is encouraged for controlling desertification and greening the northwest region of China. This necessitates an evaluation of the genetic diversity of cultivated Calligonum, the selection of a superior germplasm, and the protection of desert plant resources in Xinjiang to promote biodiversity conservation in arid zones. Establishing genetic banks and breeding programs can enhance the ecological restoration potential and sustainable utilization of Calligonum, making it a valuable species for combating desertification and preserving biodiversity in arid regions.
The study of genetic diversity is important for revealing the evolutionary history of species, assessing their survival, and predicting their future trends [14]. Variations in genetic diversity can impact population health and longevity [15]. By studying genetic diversity both within and between populations, researchers can gain insights into evolutionary relationships and inform conservation biology [16]. However, studies using molecular markers in Calligonum remain scarce. More research utilizing techniques such as microsatellites (SSRs) and RAD-seq is needed to better understand genetic diversity, population structure, and adaptation, which are crucial for effective conservation strategies.
Simple Sequence Repeats (SSR), also known as microsatellite markers [17,18], are invaluable tools for assessing genetic variability in plants. Widely distributed throughout plant genomes, these markers exhibit significant differences in the number and combination of repeats among individuals, providing abundant information on genetic diversity and population structure—key factors for species conservation and sustainable utilization [19,20]. In addition to evaluating genetic variability, SSR markers have been effectively applied in plant taxonomy. Their ability to reveal genetic differences and clarify phylogenetic relationships enables a more accurate identification of species and varieties [21,22,23]. Molecular markers have mainly been used in taxonomic studies [24,25,26]. However, studies employing SSR markers in Calligonum remain limited, particularly those focusing on genome-level SSR tag development.
In this study, SSR markers were selected for the genetic analysis of C. junceum. The aims of this study were to (1) develop new SSR primers for the genus, (2) apply them in a genetic diversity analysis of species to support conservation efforts, and (3) use them in taxonomic analysis. The results aim to offer a reference for the genetic evaluation, management, and conservation of this germplasm resource.

2. Results

2.1. An Analysis of the Distribution of SSRs in the Genome of Calligonum

The genome of C. junceum, which spans 1357.67 Mb, was screened for SSR markers, revealing 380,328 SSRs with a total length of 6,967,136 bp. Among these, 54,620 SSRs were identified as complex repeats. The overall frequency and density of SSRs in the genome were 280.13 SSRs/Mb and 5131.69 bp/Mb, respectively, accounting for 0.51% of the total genome sequence (Table 1).
Among the identified SSRs, single-nucleotide repeats (65.28%) were the most prevalent, followed by dinucleotide repeats (31.72%) (Table 2). The main repeat types included A/T for mononucleotides, AT/TA for dinucleotides, AAT/ATT for trinucleotides, and ACAT/ATGT for tetranucleotides.
The main SSR class type was single-nucleotide repeats (150.33 SSRs/Mb), while dinucleotide repeats exhibited the highest average length (14.34 bp). The highest average length (bp) among the six repeat types was that for dinucleotide repeats and then nucleotide repeats at 14.34 and 12.32, respectively, which was then followed by hexanucleotide repeats at an average length of 10.08, and the lowest length was that for pentanucleotide repeats at an average of 5.48, with an average value of 12.80 for all types (Table 2).

2.2. Development of Genome SSR Markers for Calligonum

PIC (polymorphism information content) was estimated in this study to evaluate the informativeness and discriminative power of the newly developed genomic SSR markers for Calligonum. By quantifying the level of polymorphism at each marker locus, PIC values help determine how effectively these markers can differentiate between individuals or populations. This information is crucial for accurately assessing genetic diversity, understanding population structure, and informing conservation strategies for the utilization and protection of Calligonum genetic resources. Polymorphism information content (PIC) is an important reference value for the indication of the polymorphism of a locus. According to the PIC index of Hildebrand et al. [27], a PIC value between 0.44 and 0.70 is moderately polymorphic, and a PIC value above 0.70 is highly polymorphic. Four pairs of SSR primers were highly polymorphic (Sgz005, Sgz006, Sgz012, Sgz017), and 13 pairs were moderately polymorphic (Table 3). The results showed that all SSR markers exhibited medium to high polymorphism, which provided a sufficient basis for further studies on the genetic diversity of Calligonum L. germplasm resources.
In this study, 17 pairs of g-SSR primers were selected for the PCR amplification of 80 samples from 11 species of Calligonum dates. The values of the observed number of alleles (Na) ranged from 1.72 to 5.09, with a mean value of 2.68; the effective number of alleles (Ne) ranged from 1.45 to 3.41, with a mean value of 1.90; observed heterozygosity (Ho) ranged from 0.00 to 0.97, with a mean value of 0.29; expected heterozygosity (He) ranged from 0.21 to 0.67, with a mean value of 0.21; and I ranged from 0.34 to 1.26, with a mean value of 0.66.

2.3. Genetic Diversity of Calligonum L.

We mainly relied on Shannon’s information index (I), observed heterozygosity (Ho), and expected heterozygosity (He) as genetic diversity indicators (Table 4). C. junceum (I = 0.74, Ho = 0.29, He = 0.43), C. trifarium (I = 0.98, Ho = 0.40, He = 0.51), and C. mongolicum (I = 1.30, Ho = 0.36, He = 0.64) have high genetic diversity. In contrast, C. gobicum (I = 0.12, Ho = 0.07, He = 0.07) has low genetic diversity. It is worth noting that the selected experimental materials, C. ebinuricum (I = 0.46, Ho = 0.30, He = 0.28), C. pumilum (I = 0.66, Ho = 0.27, He = 0.38), and C. roborowskii (I = 0.72, Ho = 0.36, He = 0.40), as endemic species in China, did not show high genetic diversity, which may originate from the result of their own high adaptability to narrow distribution. C. colubrinum, C. leucocladum, C. arborescens, and C. jeminaicum exhibited moderate levels of genetic diversity. A total of 80 private alleles (Table S1) were identified, of which C. mongolicum had the largest number of private alleles (35/17 loci), and C. arborescens (0/17 loci) and C. colubrinum (0/17 loci) had the smallest number of private alleles.
A further analysis of variance (AMOVA) (Table 5) showed that genetic variation in Calligonum was mainly within species (Among Species: 5%; within species: 95%).

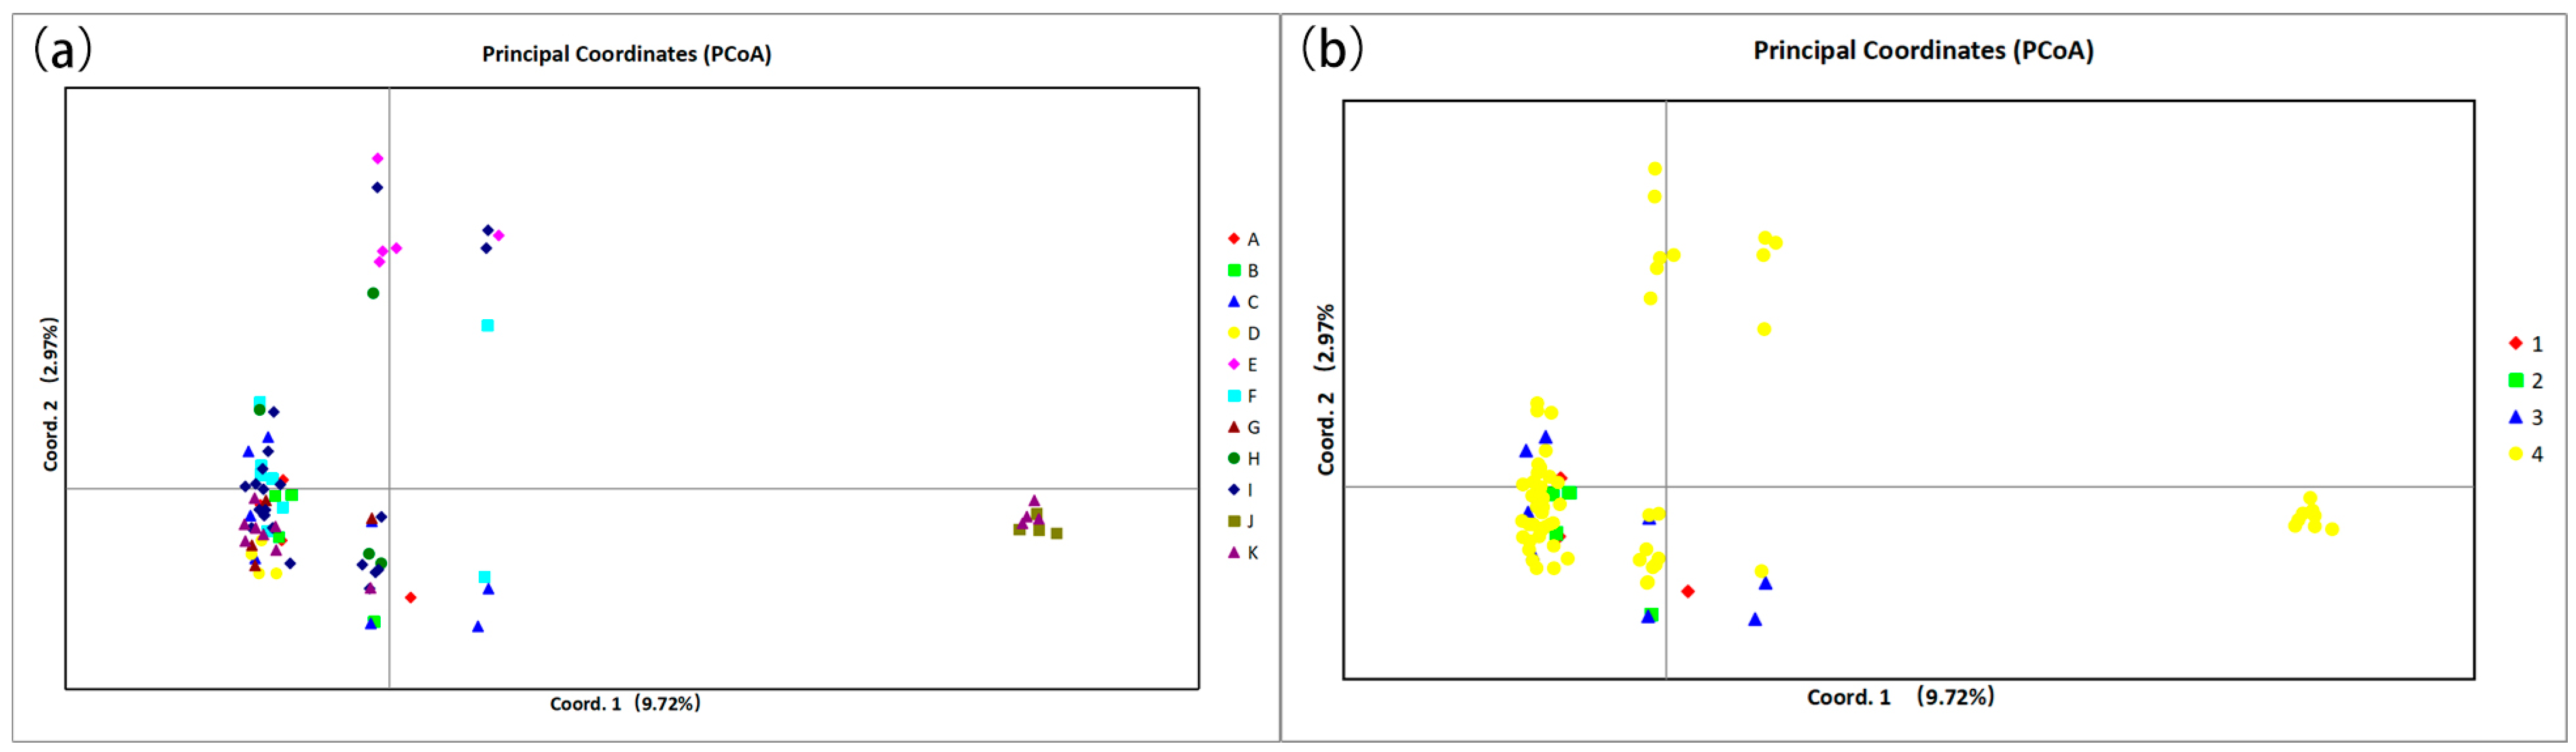
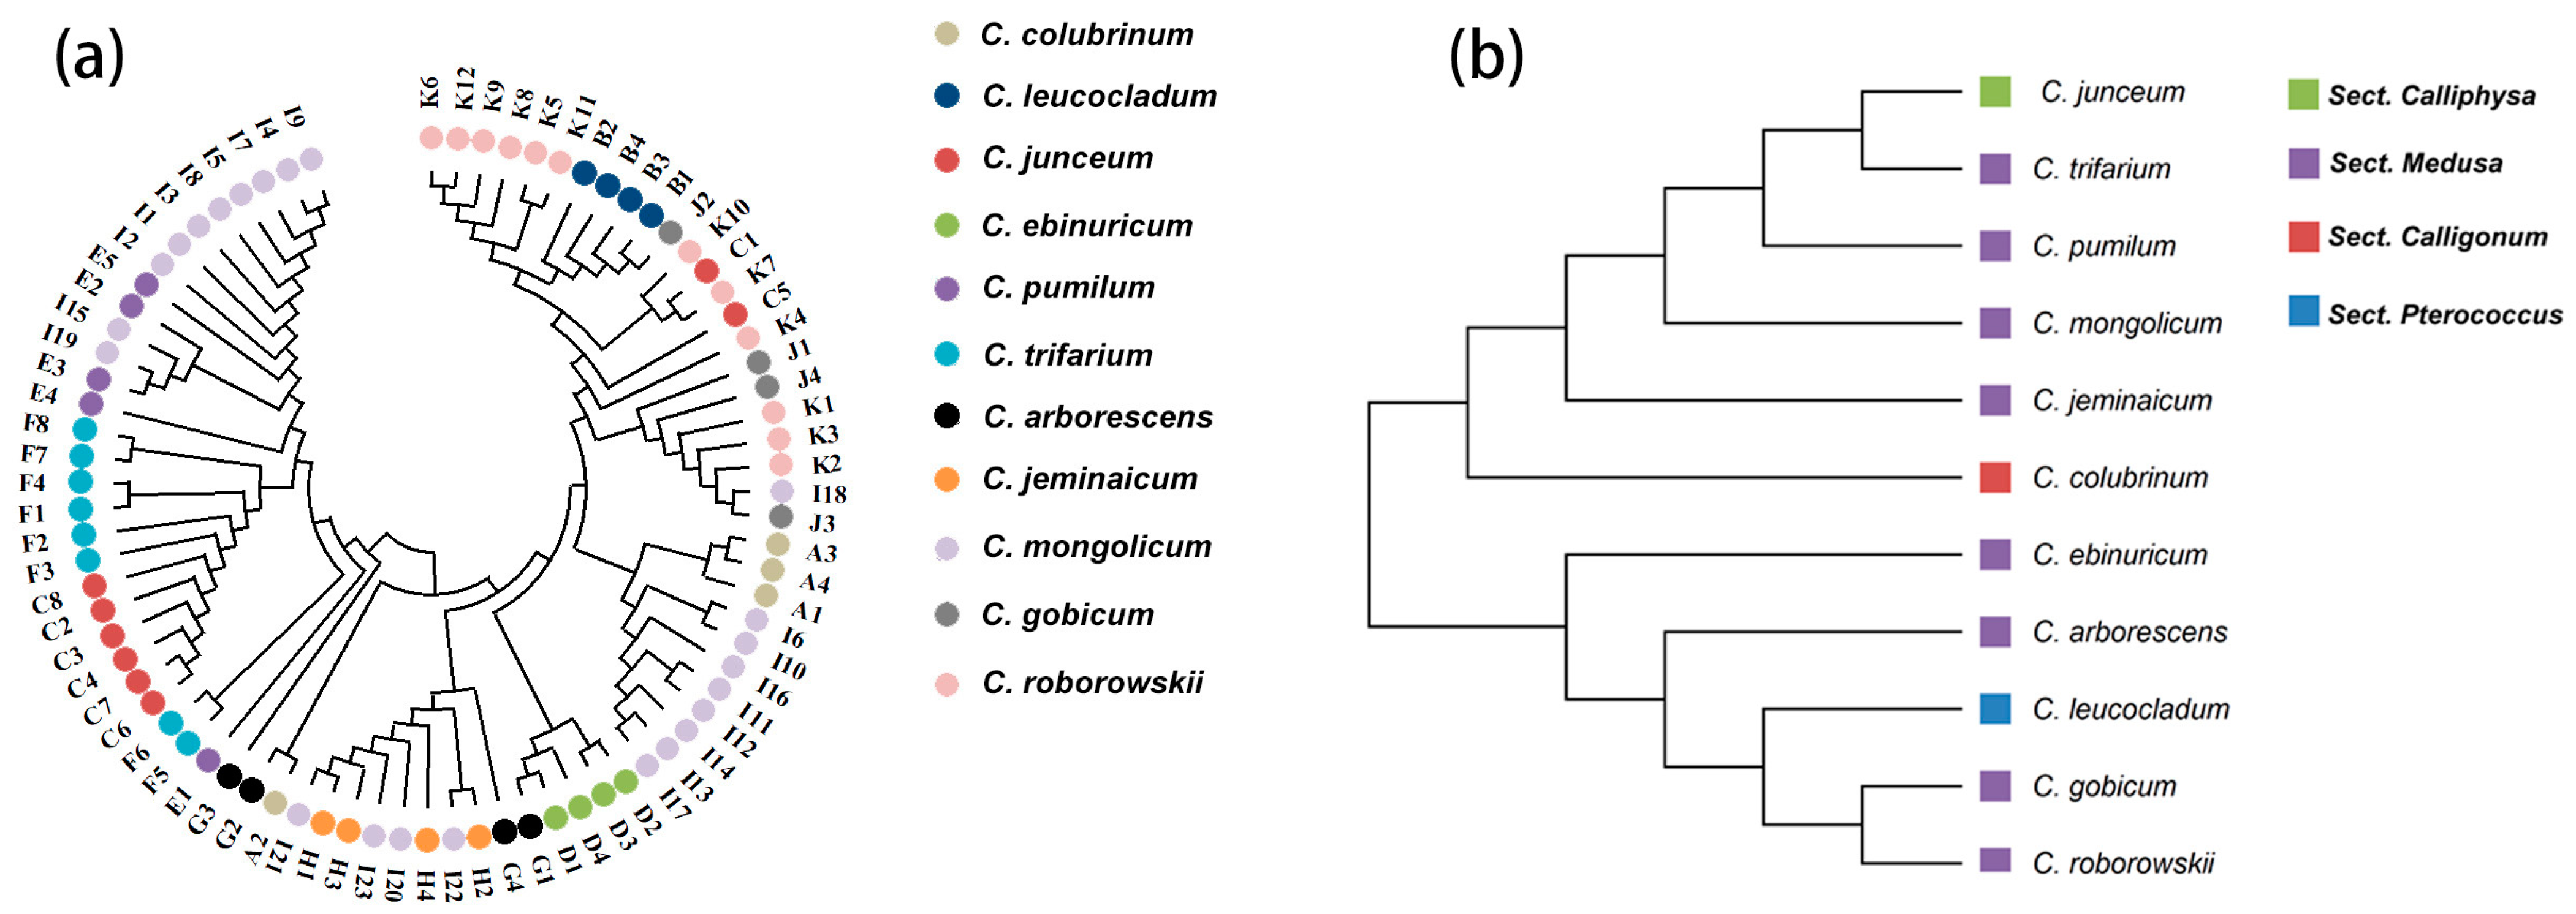
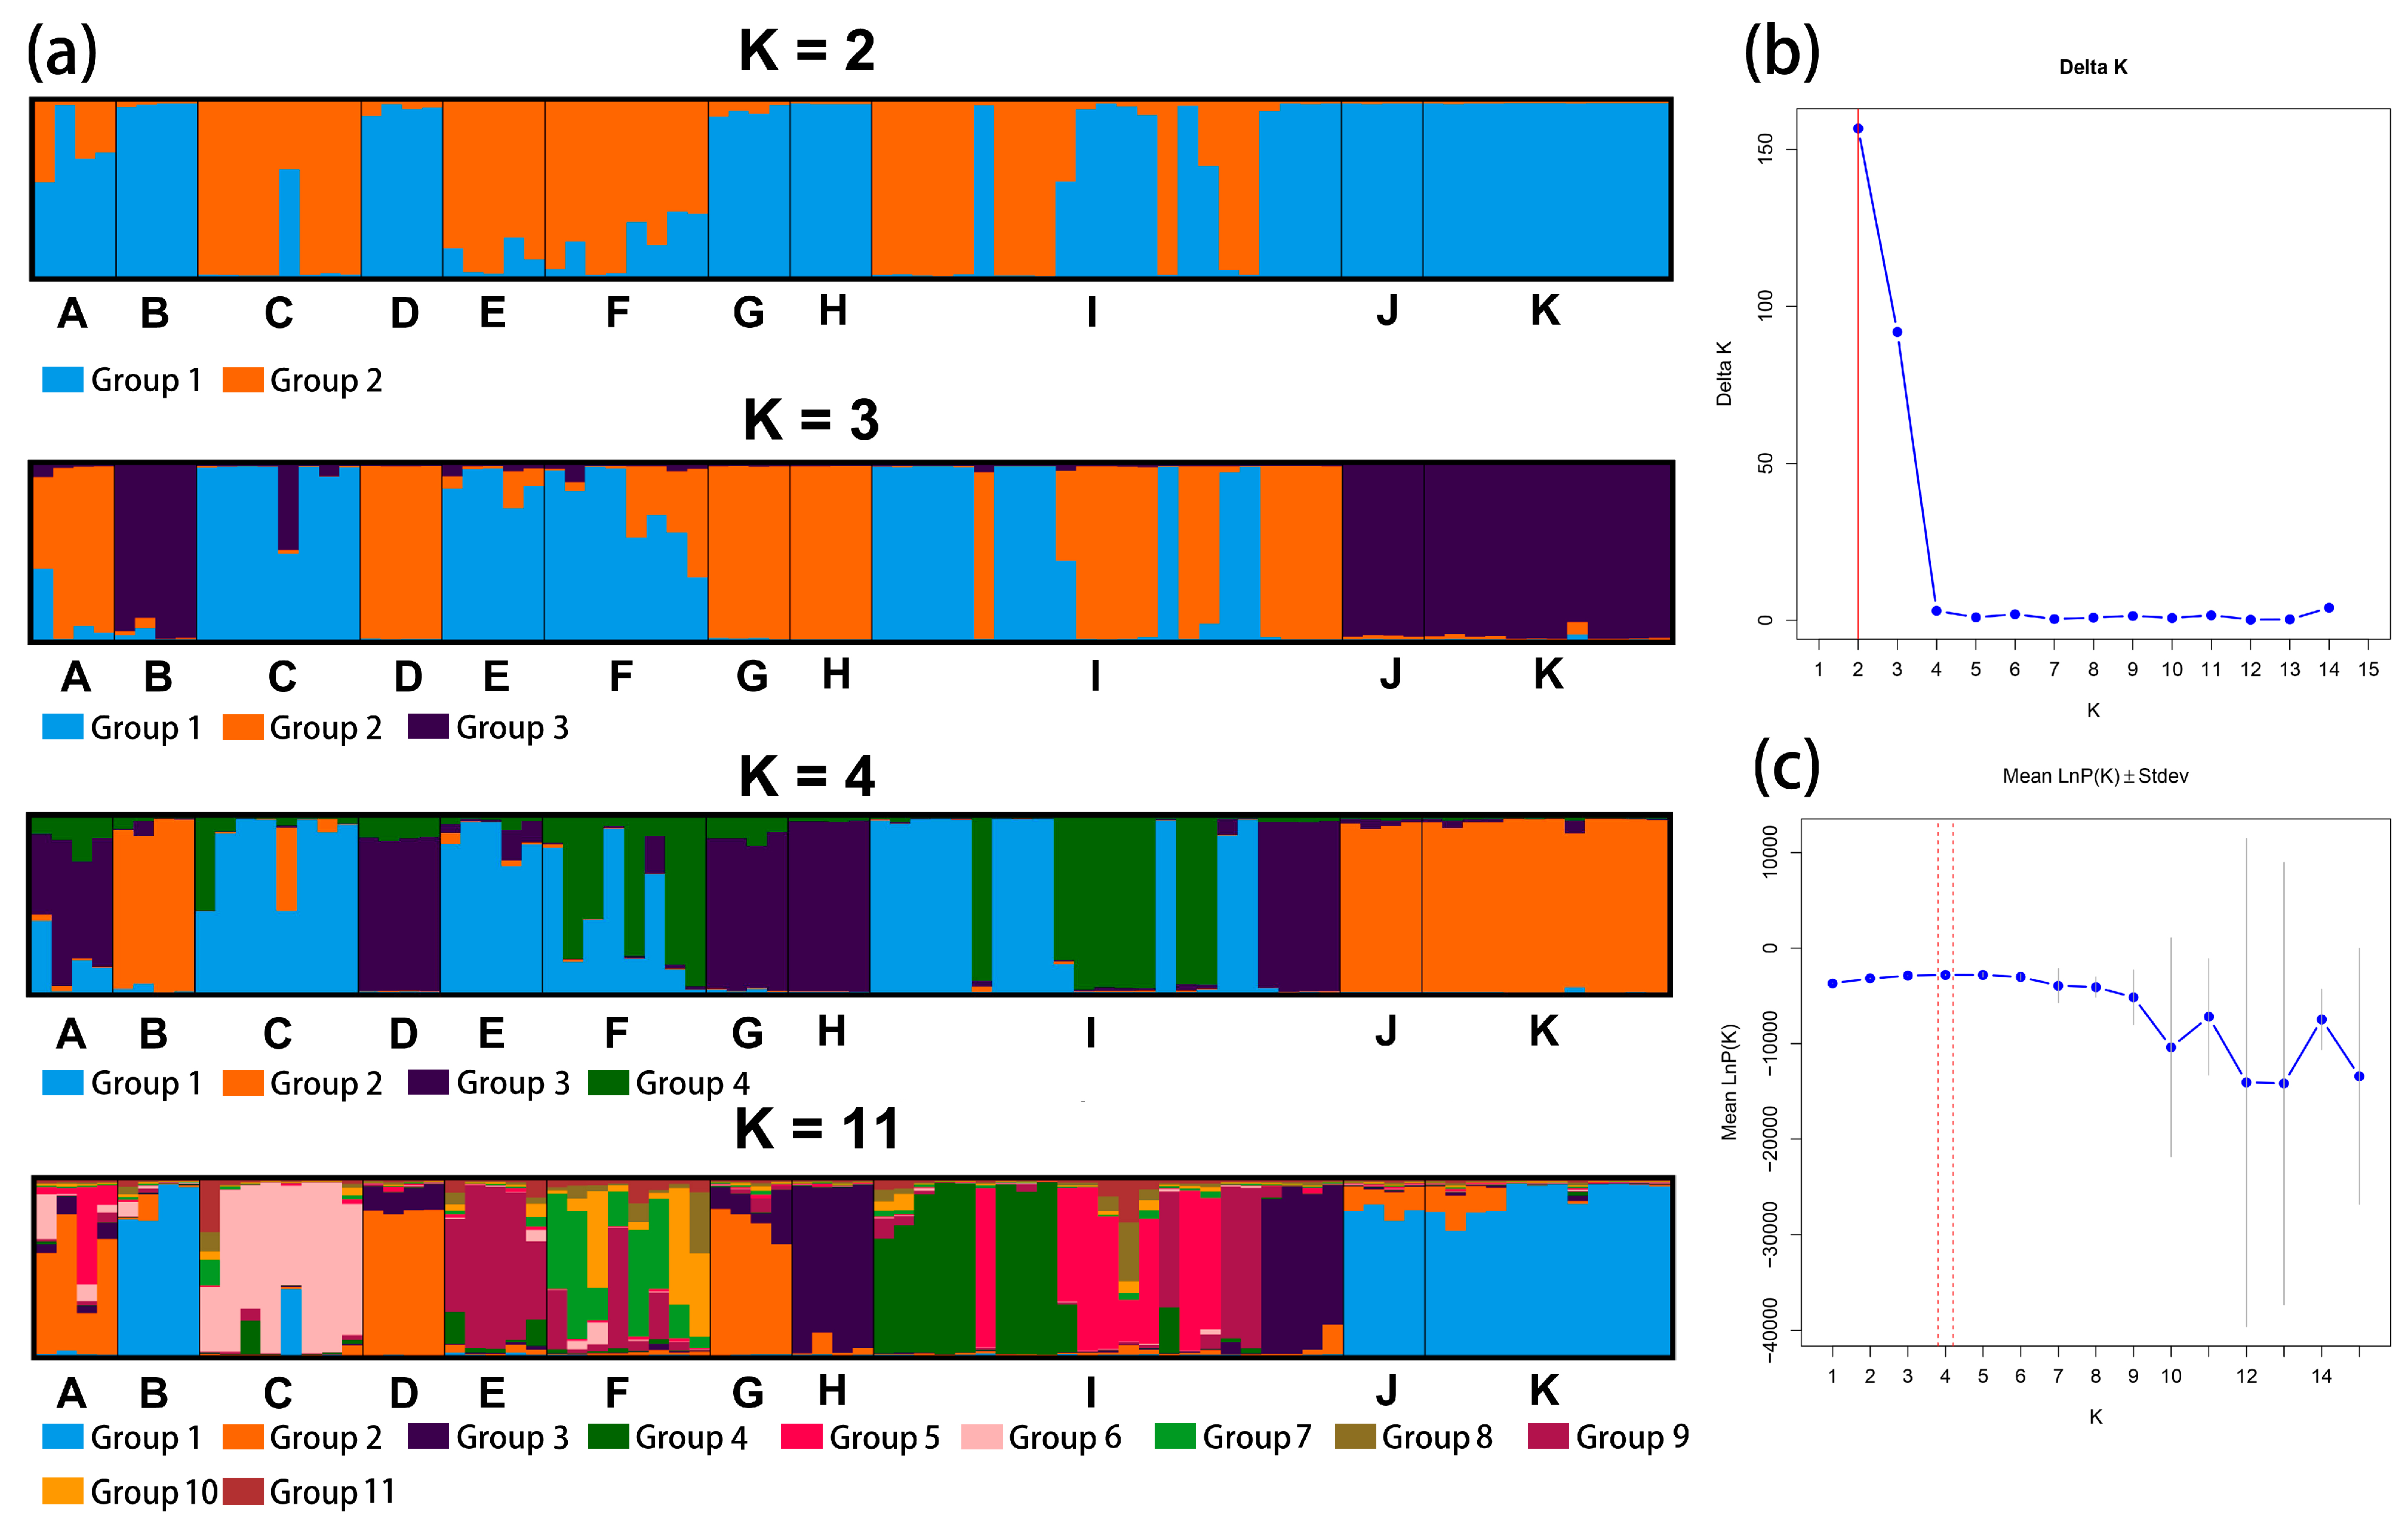
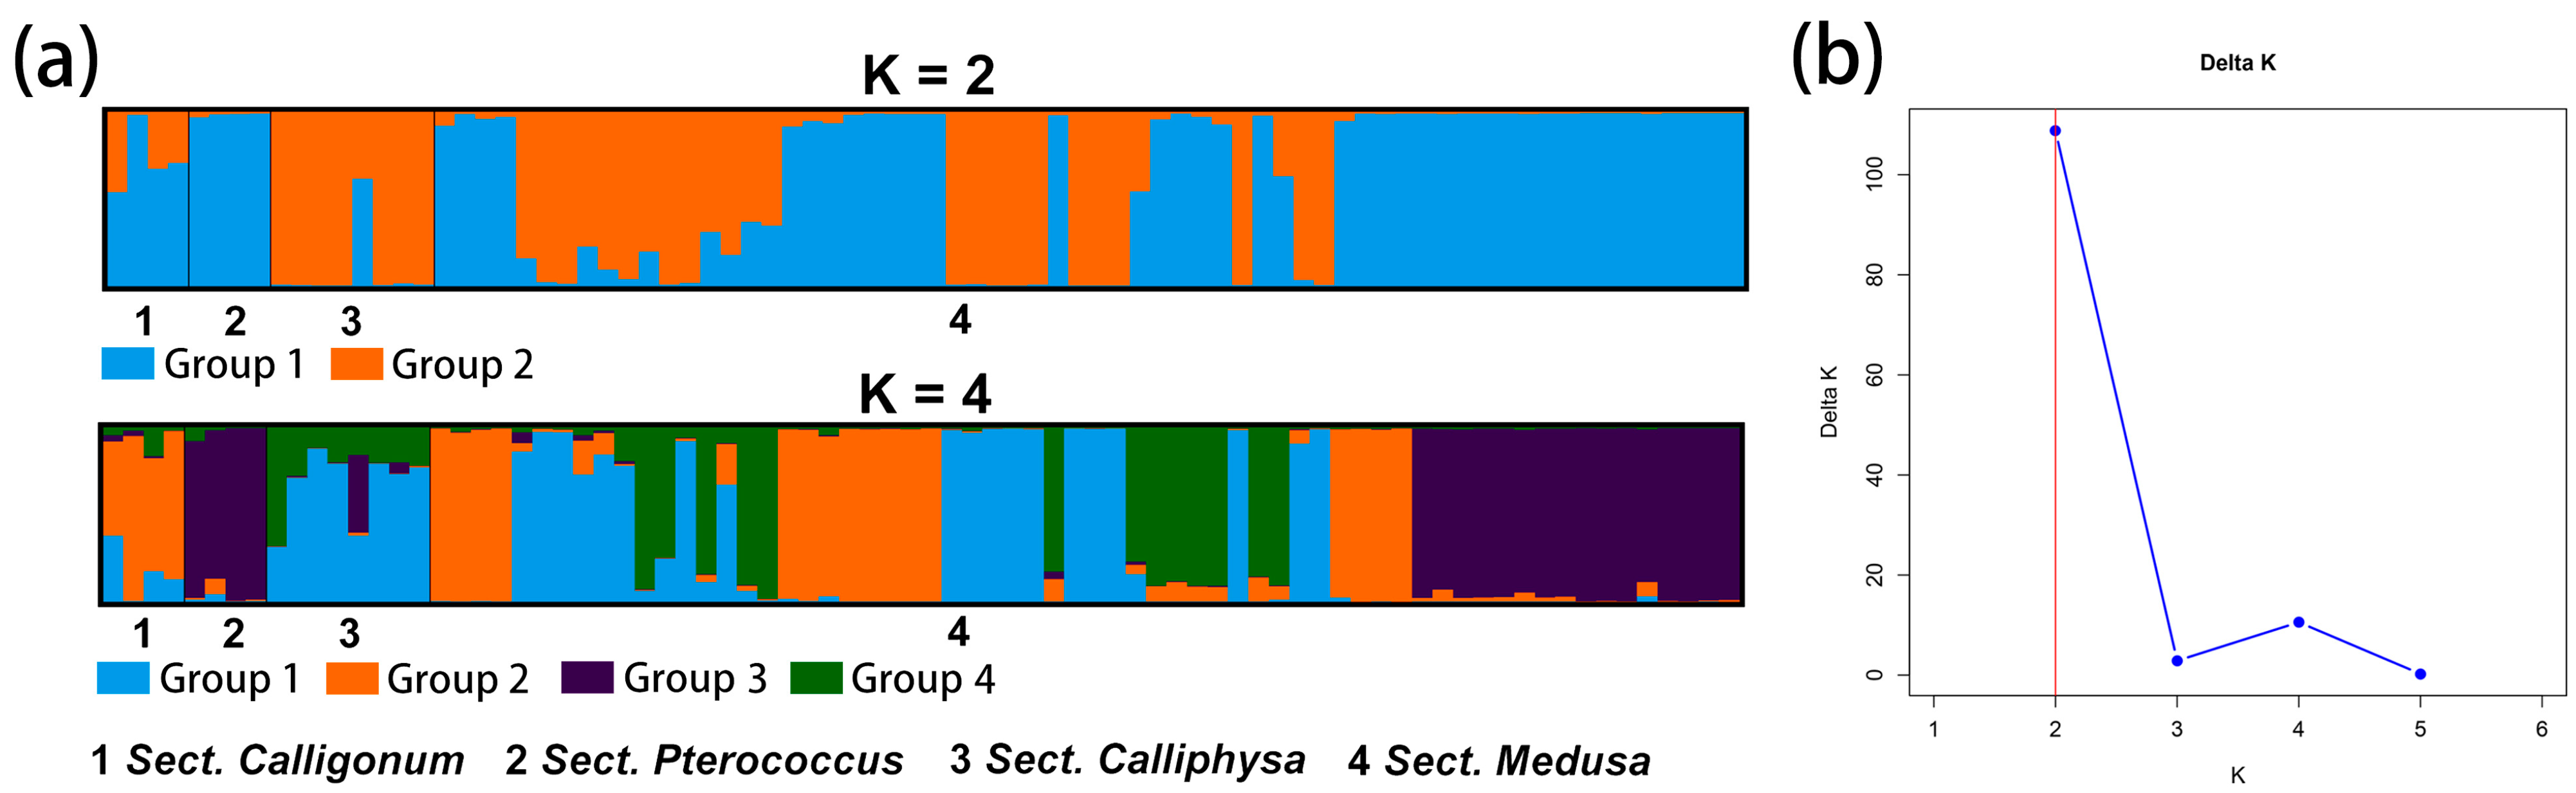
2.4. Genetic Relationship, Structure, and Differentiation Among 11 Species of Calligonum L.

The PCoA results showed that most of the species were concentrated in one region with a high degree of overlap, and a small number of individuals were dispersed in the surrounding area. C. gobicum and C. pumilum are separated in Figure 1a. PCoA reflects the complex variation within Sect. Medusa, which is larger compared to the other three groups. The results of PCoA (Figure 1) and individual neighbor-joining trees (Figure 2) showed that the existing 17 primer pairs could not distinguish the 11 species. In particular, the clustering results of the species in Figure 2 are not consistent with the clustering results of the groups.
According to Nei’s genetic distance results (Table 6), C. ebinuricum and C. gobicum have the most similar gene diversity, and C. gobicum and C. junceum have the most different gene diversity.
We analyzed the genetic structure of Calligonum using structure software based on 11 species and four groups, and the highest DK value of both was 2. The results are shown in Figure 3 and Figure 4. The results of the prediction of the genetic structure of Calligonum based on 11 species were selected with higher K values of 2 and 3 and were supplemented by the selection of K values of 4 and 11.
For the prediction of the genetic structure of Calligonum based on 11 species as a unit when K = 2, C. colubrinum, C. leucocladum, C. ebinuricum, C. arborescens, C. jeminaicum, C. gobicum, and C. roborowskii, were categorized into one group; C. junceum and C. pumilum were categorized into one group; and group I had a complex structure. Interestingly, for K values from 2 to 11, C. leucocladum, C. gobicum, and C. roborowskii were classified into one category. The complexity of the genetic structure is evident in the structure plot and is also evident in the clustering tree of individuals.

3. Discussion

3.1. Genetic Diversity of Calligonum L.

In this study, 380,328 SSR loci with a density of 280.13 SSRs/Mb were obtained from a C. junceum reference genome. The number and density of SSRs identified are higher than those of C. mongolicum cp genome data [28]. They are also higher than those for the transcriptional data [29] and genomic data [30] of Fagopyrum tibeticum. From the sequences of C. junceum, 17 SSR molecular markers were identified, characterized, and cross-transferred in C. colubrinum, C. leucocladum, C. ebinuricum, C. pumilum, C. trifarium, C. arborescens, C. jeminaicum, C. mongolicum, C. gobicum, and C. roborowskii species. The genetic diversity characterization of this germplasm was achieved with these SSRs. Higher genetic diversity shows the evolutionary potential of the species and its ability to adapt to the environment [31]. Genetic diversity is influenced by many factors, including the geographic range, seed dispersal, reproductive systems, life history, and evolutionary history of organisms [32,33], thus being useful for the future management of germplasm resources and the development of plant breeding measures.
The polymorphic information content (PIC) measures marker utility for population discrimination [34]. This can be used in SSR and ISSR [25] studies. Here, 17 SSR primers were used to analyze 80 individuals across 11 Calligonum species (the number of individuals of some species is low), and the mean value of PIC was 0.62. These results exceeded those of Song et al. (0.495) [35] but were lower than those of Ekincialp et al. (0.085) [36]. Furthermore, SSR markers from the C. junceum genome exhibited strong cross-species transferability, consistent with the high interspecific applicability of genomic SSRs and EST-SSRs [37,38].
High genetic diversity was observed in C. junceum and C. mongolicum, which might be due to their widespread distribution and similar habitats, promoting better adaptability to diverse environments. Conversely, the low genetic diversity of some Chinese endemic species (C. ebinuricum, C. pumilum, C. roborowskii) may be due to their adaptation to a narrower range of habitats, but these species generally have some special adaptations, such as C. ebinuricum’s ability to adapt to salinity and drought. Despite low interspecific variation, high intraspecific variation was detected, which might explain the challenges of species identification using SSR markers.

3.2. Breakdown in Genetic Structure and Taxonomic Identification in Calligonum L.

Classification within the Calligonum species remains a matter of controversy. Traditionally, the taxonomy of this genus has been primarily based on morphological characteristics such as shrub size, shrub form, stem color, whether the perianth bends, and the number of stamens [39,40], with fruit morphology being an important criterion for classification. However, fruit morphology can also be highly variable, which makes its classification challenging [3]. Environmental factors have a profound effect on the morphological characteristics of Calligonum [40], and secondly, there is hybridization among Calligonum species, especially in some polyploid species or from independent hybrid origins, which makes the boundaries of the interspecies unclear. DNA barcoding can only be used to identify some of the species [7], and the use of DNA barcoding screened by whole-plasmid genome sequencing increased the identification rate to 78% [2], but some of the identifications are still doubtful. Although the genomic SSRs demonstrated cross-species transferability, they exhibited limited discriminatory power, failing to resolve species-level differentiation or cluster individuals based on taxonomic grouping. It is important to considering that the classification of the genus itself is a difficult taxonomic problem, and the genomic SSRs were not able to classify it. This suggests that the existing classification may be controversial, implying that the genus’s classification may require more effective taxonomic tools and perspectives.
PCoA reflects the complex variation within Sect. Medusa, which is the same as the richness of phenotypic variation in species under Sect. Medusa. C. leucocladum, C. gobicum, and C. roborowskii were classified into one category, indicating that these three species share a common ancestry. The species is highly variable in phenotype and widespread in NW China, which seems to be similarly reflected in its genetic structure.

3.3. Conservation and Utilization of Calligonum L. Genetic Resources

Our genetic diversity analysis revealed that species with more restricted distributions exhibit lower genetic diversity (Table 4). Additionally, most of the variation observed among the 11 species occurred within species, indicating limited species-to-species variation (Table 5). These findings highlight the importance of using genetic diversity data to guide conservation priorities and develop tailored management strategies. Natural populations such as C. ebinuricum and C. jeminaicum, which are currently in a degraded state, could be a priority [41,42,43].
Although the assessment of genetic diversity is an important for determining the conservation success of protected species [44], there is still a gap in the assessment of genetic diversity for the in situ conservation of Calligonum. The method of studying windbreak and sand fixation in Xinjiang through the use of the artificial breeding of Calligonum has played a disguised role in protecting some species with narrow distribution [11]. However, the primary goal is to ensure the survival of these species in viable numbers, with less consideration given to genetic aspects. In our study, newly developed SSR primers were used to effectively assess the genetic diversity of Calligonum species, which provides new perspectives on diversity conservation in this genus. As shown in Figure 3, species such as C. junceum and C. mongolicum exhibit distinct population structures at K = 2, with more complex admixture patterns observed at K = 11. Similarly, the analyses of the genetic structure within sections of the genus yielded promising results, with the sect. medusa in Figure 4 also displaying clear population structures. These findings represent a positive step forward in conservation efforts for the genus Calligonum. Although the number of individuals of some of the species in this study is small, the results of this study indicate some potential. Especially in the case of in situ conservation, the methodology of this study can be utilized to screen suitable plant resources for in situ conservation from the perspective of genetic diversity. Additionally, the method in this study can be used to screen populations with high genetic diversity for ecological recuperation in the deserts of Northwest China.
This study’s results indicated that private alleles varied across species. Species with high genetic diversity do not contain a large number of private alleles (Table 4). Therefore, private alleles must be considered in conservation planning to protect the unique genetic resources of different Calligonum species. When relocation and conservation efforts begin, the selection of desirable tree species should be further expanded and their numbers increased. Seed orchards with a larger genetic base than that of the original tree species should be established. The primers identified in this study for assessing the genetic diversity of various Calligonum species provide a theoretical foundation for the development of conservation strategies and the effective utilization of Calligonum resources.

4. Materials and Methods

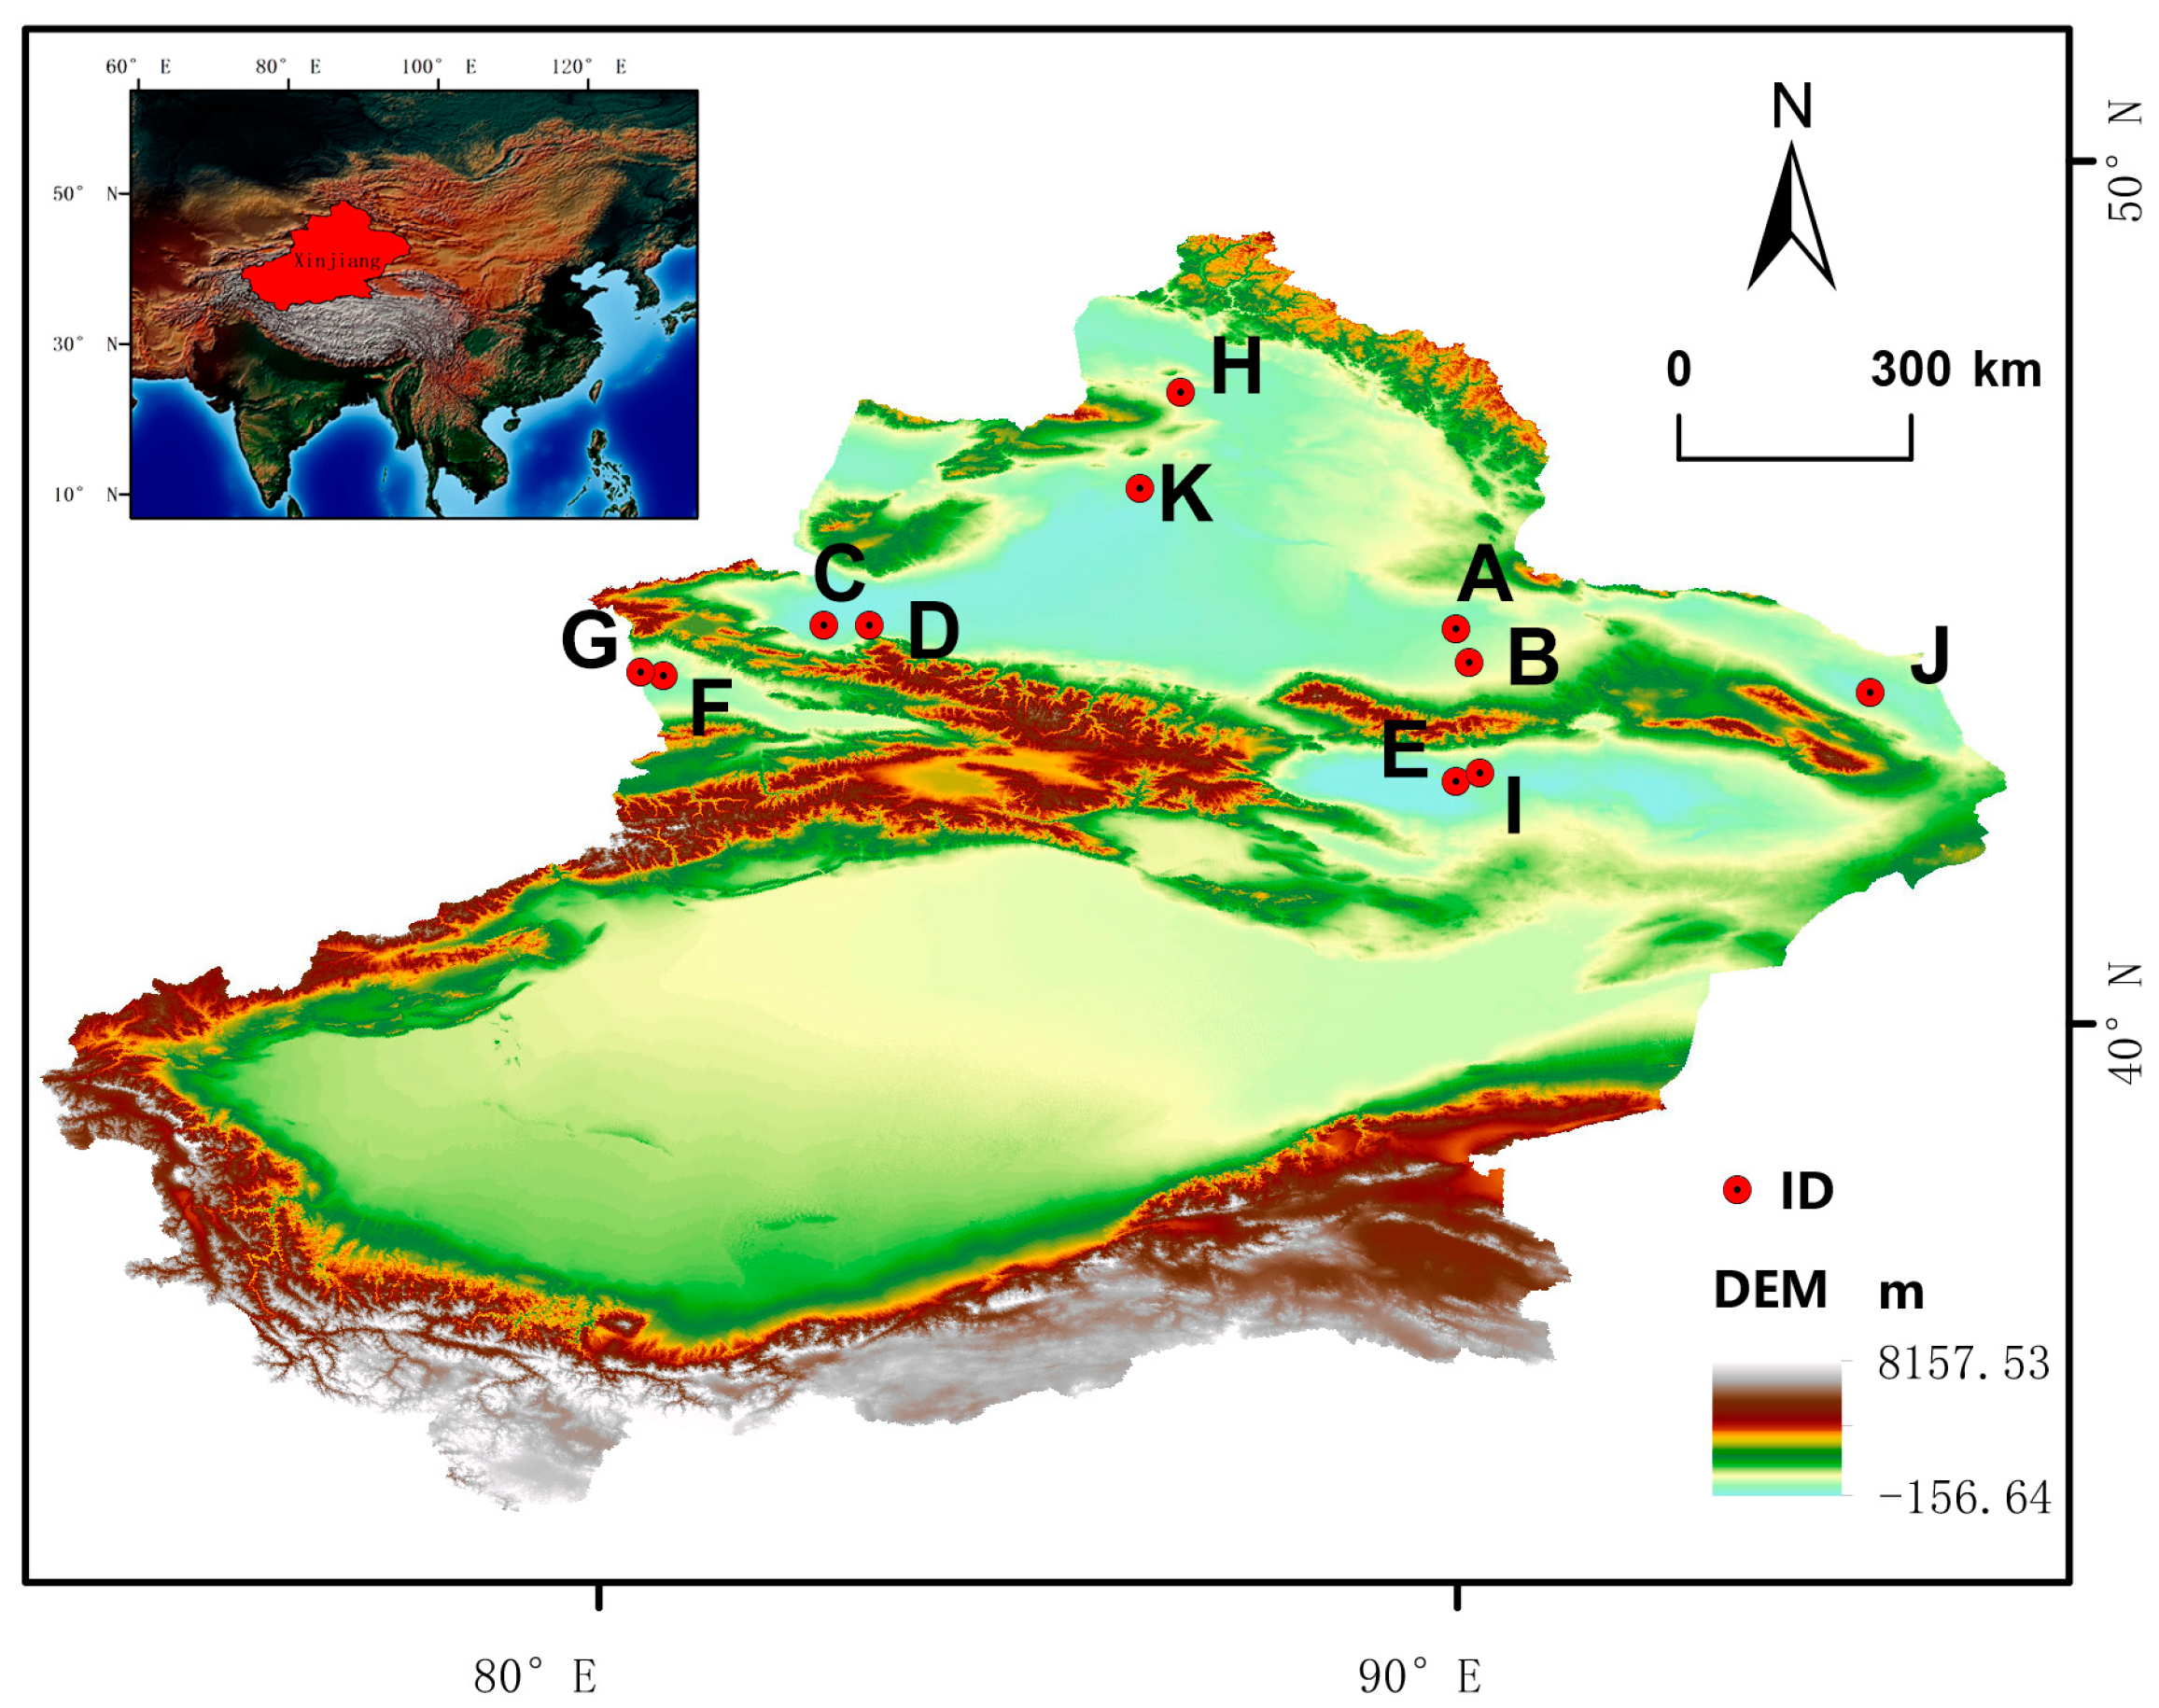
4.1. Experimental Materials

This study selected 80 individuals from 11 species of Calligonum L., representing all four sections (Table 7). The species selection was as follows (Figure 5): for Sect. Calligonum, four individuals of C. colubrinum were included; for Sect. Calliphysa, eight individuals of C. junceum; and for Sect. Medusa, a total of eight species were included, with four individuals of C. ebinuricum, five of C. pumilum, and eight of C. trifarium, C. arborescens, C. jeminaicum, C. mongolicum, C. gobicum, and C. roborowskii (Figure 6). We selected Calligonum junceum as the target species for developing the SSR molecular markers and the other 10 species for testing the cross-transferability of the identified markers.
To ensure the exclusion of polyploid interference, all collected materials were diploid [45,46]. The collection criteria for wild samples included a plant spacing of at least 10 m, normal growth without visible defects or pests, and young leaves from the current year, which were dried and preserved in silica gel.

4.2. SSR Primer Development

We selected C. junceum from Sect. Calliphysa for sequencing and assembly to form a reference genome (to be published). SSR sites were queried using MISA [47] to remove error-prone single-nucleotide sequences generated in the polymerase chain reaction. Parameters were set to include nucleotide repeat-10, dinucleotide repeat-6, trinucleotide repeat-5, tetranucleotide repeat-5, pentanucleotide repeat-5, and hexanucleotide repeat-5, where the length was set to be greater than or equal to 100 bp.
Primers were designed in batch using Primer 3 [48], and primer designs were selected to meet the following conditions: a GC content between 45 and 55%, primer length between 18 and 24 bp, and annealing temperature between 55 and 65 °C for further use. Screened primer sequences were entered into a website (https://www.primer3plus.com, accessed on 15 June 2024) for the subsequent secondary screening.

4.3. DNA Extraction

Plant tissues were ground to powder in liquid nitrogen, and total genomic DNA was extracted from leaf tissues using the cetyltrimethylammonium bromide (CTAB) method [49]. DNA was quantitatively assessed via 1% agarose gel electrophoresis, then stored at −20 °C until their use for experiments involving SSRs.

4.4. Primer Screening

A total of 23 candidate primer pairs were randomly selected from genomic SSRs, with consideration given to the minimum lengths of di-, tri-, and tetranucleotide repeats [50]. The 5′ ends of the forward primers were labeled with FAM blue, a fluorescent dye from Shanghai General Biotechnology in Shanghai, China. This labeling facilitated easy scoring during genotyping. We chose two randomly selected DNAs from each species. SSR primers were amplified by a PCR on a G1000 Modified Gene Amplifier (Bioer Technology, Hangzhou, China), and single bands and bright bands of the primers were verified by electrophoresis on a 1% agarose gel. The remaining PCR products were sent to Sangon Biotech (Shanghai, China) for polymorphism detection by capillary electrophoresis. Finally, 17 pairs of SSR primers that met the above conditions and had a good degree of polymorphism were screened out. The primer information is shown in Table 8.

4.5. PCR Amplification

PCR amplification was performed using the selected primers on a DNA sample of each individual DNA in a 25 µL reaction system. The reaction mixture consisted of 1 µL of template DNA, 1 µL each of upstream and downstream primers, 12.5 µL of 2× EasyTaq PCR SuperMix, and 9.5 µL of ddH2O. The DNA concentration should not be less than 20 μg, and the primer concentration was 10 μM. The amplification reaction procedure involved three stages. In the first stage, pre-denaturation was carried out at 93 °C for 3 min. In the second stage, there were 30 cycles consisting of denaturation at 94 °C for 30 s, annealing at 56 °C for 30 s, and extension at 65 °C for 90 s. The third stage occurred at 65 °C for 5 min, ending with a temperature drop to 4 °C. PCR products were detected using capillary electrophoresis. Alleles generated from the PCR amplification experiment were analyzed using Genemarker v2.2.0 (SoftGenetics LLC., State College, PA, USA) genotyping software.

4.6. Data Analysis

Various genetic diversity indices were computed using different software packages. Popgene 32, Cervus v3.0.7, and GenAlEx 6.5 were used to calculate the number of alleles (Na), number of effective alleles (Ne), Shannon information index (I), observed heterozygosity (Ho), expected heterozygosity (He), and polymorphism information content (PIC) [51,52,53]. Nei’s gene diversity index was also calculated using Nei’s genetic distance. Subsequently, UPGMA clustering was performed for all Calligonum samples using MEGA6 [54,55]. Principal coordinate, genetic similarity, and molecular variance (AMOVA) analysis were performed using GenAlEx 6.5 software [52]. Structure analysis was performed using Structure 2.3.4 [56]; the number of genetic populations (K) and the percentage of individuals assigned to each inferred natural genetic cluster from each hypothetical population were calculated. The number of “K” was inferred from a confounding model of related allele frequencies. Markov Chain Monte Carlo (MCMC) was set to 1000 repetitions with a burn-in period of 10,000. The program was run 10 times, with each “K” ranging from 1 to 15. The Evanno method [57] was used to select the best “K” value according to the deltaK criterion. Visualization was conducted using the R package (V2.2.9) [58].

5. Conclusions

This study provides a comprehensive analysis of the genetic diversity and structure of Calligonum L. species, revealing significant intraspecific variation and the challenges of interspecific differentiation within the genus. The developed markers allowed for a genetic diversity analysis of the 11 species selected in this study. C. junceum and C. mongolicum demonstrated the highest diversity, reflecting their broader adaptability to varied environments. In contrast, endemic species such as C. ebinuricum and C. pumilum showed lower diversity, likely due to their adaptation to narrow habitats. Conservation strategies should prioritize maintaining genetic diversity, through in situ conservation, genetic monitoring, and expanded germplasm resources.

Supplementary Materials

The following supporting information can be downloaded at https://www.mdpi.com/article/10.3390/d17030196/s1, Table S1. The main parameters for 17 SSR loci analyzed in Calligonum L.; Table S2. The characteristics of the 17 polymorphic SSR primer pairs of Calligonum.

Author Contributions

Conceptualization, W.S., B.P. and J.W.; methodology, W.S., S.L. and M.W.; software, X.L., J.S. and S.L.; validation, X.L. and J.S.; formal analysis, X.W.; investigation, X.W.; resources, D.Z.; data curation, W.S.; writing—original draft preparation, X.L.; writing—review and editing, X.L. and W.S.; visualization, X.L. and J.S.; supervision, B.P.; project administration, W.S.; funding acquisition, W.S. All authors have read and agreed to the published version of the manuscript.

Funding

This research was funded by China National Natural Fund (CNF), grant number 42077411, and Xinjiang Uygur Autonomous Region Science and Technology Department, grant number 2023TSYCCX0024.

Institutional Review Board Statement

Not applicable.

Informed Consent Statement

Not applicable.

Data Availability Statement

The primer data information was uploaded to NGDC (https://ngdc.cncb.ac.cn/). The project number is PRJCA036654, and the data query number is OMIX009213.

Conflicts of Interest

The authors declare no conflicts of interest.

References

  1. Feng, Y.; Pan, B.; Yan, C. Biodiversity and Distribution Pattern of Calligonum L. in Xinjiang. J. Arid. Land Resour. Environ. 2008, 22, 139–144. [Google Scholar]
  2. Li, A.; Gao, Z.; Mao, Z.; Editorial Committee of the Flora of China of Chinese Academy of Science. Flora of China; Science Publishing House: Beijing, China, 1998. [Google Scholar]
  3. Song, F.; Li, T.; Burgess, K.S.; Feng, Y.; Ge, X.-J. Complete plastome sequencing resolves taxonomic relationships among species of Calligonum L. (Polygonaceae) in China. BMC Plant Biol. 2020, 20, 261. [Google Scholar] [CrossRef]
  4. Purohit, C.S.; Kumar, R. A review on genus Calligonum L. (Polygonaceae) from India and report Calligonum crinitum an addition for Flora of India. J. Asia-Pac. Biodivers. 2020, 13, 319–324. [Google Scholar] [CrossRef]
  5. Brummitt, N.; Cui, Q.; Bai, P.; Liu, X.; Scott, B.; De Palma, A.; Araujo, A.C. Reducing the number of Data Deficient plant species. Syst. Biodivers. 2024, 22, 2302180. [Google Scholar] [CrossRef]
  6. Feng, Y.; Pan, B.; Shen, G. Seed Morphology of Calligonum Sect. EucaUigonum (Polygonaceae) in Xinjiang and Its Taxonomic Significance. Acta Bot. Yunnanica 2008, 30, 47–50. [Google Scholar]
  7. Liu, P.; Shi, W.; Wen, J.; Fayzullaevich, S.K.; Pan, B. A phylogeny of Calligonum L. (Polygonaceae) yields challenges to current taxonomic classifications. Acta Bot. Bras. 2021, 35, 310–322. [Google Scholar] [CrossRef]
  8. Lui, Y. Desert Flora of China; Science Publishing House: Beijing, China, 1985. [Google Scholar]
  9. Dong, Z.B.; Chen, G.T.; He, X.D.; Han, Z.W.; Wang, X.M. Controlling blown sand along the highway crossing the Taklimakan Desert. J. Arid Environ. 2004, 57, 329–344. [Google Scholar] [CrossRef]
  10. Lu, Q.; Li, X.; Xiao, H. Desert Ecosystem Observation Methods; China Environmental Science Publishing House: Beijing, China, 2004. [Google Scholar]
  11. Ci, J.; Zheng, L. Xinjiang Desert and Sand Fixation Afforestation; Xinjiang People’s Publishing House: Urumqi, China, 1963. [Google Scholar]
  12. Wang, J.; Zhang, W.; Xu, D. Influence of Calcium on the Plant Height, Photosynthesis, Fluorescence and Chlorophyll Content of Calligonum arborescensunder NaCl Stress. J. Desert Res. 2015, 35, 167–174. [Google Scholar]
  13. Tan, Y.; Pan, B.; Shiming, D.; Xu, G. Alpha diverstiy of four Calligonum L. Communities and soil interpretation in the Junggar Basin. J. Arid. Land Resour. Environ. 2009, 23, 136–142. [Google Scholar]
  14. An, Q.; Feng, Y.; Yang, Z.; Hu, L.; Wu, D.; Gong, G. Differences in Albizia odoratissima genetic diversity between Hainan Island and mainland populations in China. Front. Plant Sci. 2024, 15, 1369409. [Google Scholar] [CrossRef]
  15. Hedrick, P.W.; Miller, P.S. Conservation genetics: Techniques and fundamentals. Ecol. Appl. 1992, 2, 30–46. [Google Scholar] [CrossRef]
  16. Ahmad, R.; Malik, W.; Anjum, M.A. Genetic Diversity and Selection of Suitable Molecular Markers for Characterization of Indigenous Zizyphus Germplasm. Erwerbs-Obstbau 2019, 61, 345–353. [Google Scholar] [CrossRef]
  17. Powell, W.; Machray, G.C.; Provan, J. Polymorphism revealed by simple sequence repeats. Trends Plant Sci. 1996, 1, 215–222. [Google Scholar] [CrossRef]
  18. Choudhary, M.; Singh, A.; Das, M.M.; Kumar, P.; Naliath, R.; Singh, V.; Kumar, B.; Rakshit, S. Morpho-physiological traits and SSR markers-based analysis of relationships and genetic diversity among fodder maize landraces in India. Mol. Biol. Rep. 2023, 50, 6829–6841. [Google Scholar] [CrossRef] [PubMed]
  19. Boccacci, P.; Aramini, M.; Ordidge, M.; van Hintum, T.J.L.; Marinoni, D.T.; Valentini, N.; Sarraquigne, J.-P.; Solar, A.; Rovira, M.; Bacchetta, L.; et al. Comparison of selection methods for the establishment of a core collection using SSR markers for hazelnut (Corylus avellana L.) accessions from European germplasm repositories. Tree Genet. Genom. 2021, 17, 48. [Google Scholar] [CrossRef]
  20. Qian, F.; Gao, Z.; Hu, L.; Wang, H. Characteristics of Crambe abyssinica Chloroplast Genome and Its Phylogenetic Relationship in Brassicaceae. Biotechnol. Bull. 2022, 38, 174–186. [Google Scholar]
  21. Wencai, Z. Application of SSR Molecular Marker in Soybean. J. Anhui Agric. Sci. 2007, 35, 3156–3158. [Google Scholar]
  22. Li, L.; Yan, C.; Xing, Y.; Wang, X.; Zhang, X. Utilization of SSR Marker in Genetic Diversity Analysis and Heterotic Grouping of Maize. Maize Sci. 2005, 13, 12–15. [Google Scholar]
  23. Mezzomo, P.; Mielniczki-Pereira, A.A.; Sausen, T.L.; Marinho, J.R.; Cansian, R.L. Molecular inferences about the genus Hypostomus Lacepede, 1803 (Siluriformes: Loricariidae): A review. Mol. Biol. Rep. 2020, 47, 6179–6192. [Google Scholar] [CrossRef]
  24. Algarawi, A.M.; Abd-Elgawad, M.E. Genetic diversity of closely related Calligounum species collected from Saudi habitats by analyzing the matK and rpoC1 genes, and SCoT and IRAP markers. Plant Biotechnol. Rep. 2025, 19, 55–66. [Google Scholar] [CrossRef]
  25. Gasmi, A.; Triki, T.; Benabderrahim, M.A.; Nagaz, K.; Guasmi, F. Assessing phenolic and molecular diversity of arta (Calligonum comosum L.), a wild Tunisian desert plant. S. Afr. J. Bot. 2022, 151, 166–174. [Google Scholar] [CrossRef]
  26. Shi, W.; Wen, J.; Zhao, Y.; Johnson, G.; Pan, B. Reproductive biology and variation of nuclear ribosomal ITS and ETS sequences in the Calligonum mongolicum complex (Polygonaceae). PhytoKeys 2017, 76, 71–88. [Google Scholar] [CrossRef]
  27. Hildebrand, C.E.; Torney, D.C.; Wagner, R.P. Informativeness of Polymorphic DNA Markers. Los Alimos Sricnce 1992, 2, 100–102. [Google Scholar]
  28. Duan, H.; Zhang, Q.; Tian, F.; Hu, Y.; Wang, C.; Lu, Y.; Yuan, H.; Yang, H.; Cui, G. Complete chloroplast genome of Calligonum mongolicum Turcz. and comparative analysis with other Calligonum species. J. Appl. Res. Med. Aromat. Plants 2022, 27, 100370. [Google Scholar] [CrossRef]
  29. Yang, B.; Li, L.; Liu, J.; Zhang, L. Plastome and phylogenetic relationship of the woody buckwheat Fagopyrum tibeticum in the Qinghai-Tibet Plateau. Plant Divers. 2021, 43, 198–205. [Google Scholar] [CrossRef]
  30. Zuo, X.; Song, Y.; Ma, X.; Yang, Y.; Wang, Y.; Guo, Z.; Zhu, X.; Liu, Y. Mining SSR Loci and Analysis the Genetic Diversity of Tartary Buckwheat Based on the Whole Genome Sequence. J. Agric. Sci. Technol. 2022, 24, 38–51. [Google Scholar]
  31. Booy, G.; Hendriks, R.J.J.; Smulders, M.J.M.; Van Groenendael, J.M.; Vosman, B. Genetic diversity and the survival of populations. Plant Biol. 2000, 2, 379–395. [Google Scholar] [CrossRef]
  32. Gaudeul, M.; Taberlet, P.; Till-Bottraud, I. Genetic diversity in an endangered alpine plant, Eryngium alpinum L. (Apiaceae), inferred from amplified fragment length polymorphism markers. Mol. Ecol. 2000, 9, 1625–1637. [Google Scholar] [CrossRef]
  33. Li, J.; Jin, Z.; Lou, W.; Li, J. Genetic diversity of Lithocarpus harlandii populations in three forest communities with different succession stage. Chin. J. Ecol. 2007, 26, 509–514. [Google Scholar] [CrossRef]
  34. Wei, J.; Li, X.; Xu, H.; Wang, Y.; Zang, C.; Xu, J.; Pei, X.; Zhao, X. Evaluation of the genetic diversity of Pinus koraiensis by EST-SSR and its management, utilization and protection. For. Ecol. Manag. 2022, 505, 119882. [Google Scholar] [CrossRef]
  35. Song, Y.; Cheng, Z.; Dong, Y.; Liu, D.; Bai, K.; Jarvis, D.; Feng, J.; Long, C. Diversity of Tartary Buckwheat (Fagopyrum tataricum) Landraces from Liangshan, Southwest China: Evidence from Morphology and SSR Markers. Agronomy 2022, 12, 1022. [Google Scholar] [CrossRef]
  36. Ekincialp, A.; Erdinc, C.; Turan, S.; Cakmakci, O.; Nadeem, M.A.; Baloch, F.S.; Sensoy, S. Genetic Characterization of Rheum ribes (Wild Rhubarb) Genotypes in Lake Van Basin of Turkey through ISSR and SSR Markers. Int. J. Agric. Biol. 2019, 21, 795–802. [Google Scholar]
  37. Dow, B.D.; Ashley, M.V. Microsatellite analysis of seed dispersal and parentage of saplings in bur oak, Quercus macrocarpa. Mol. Ecol. 1996, 5, 615–627. [Google Scholar] [CrossRef]
  38. Chabane, K.; Ablett, G.A.; Cordeiro, G.M.; Valkoun, J.; Henry, R.J. EST versus genomic derived microsatellite markers for genotyping wild and cultivated barley. Genet. Resour. Crop Evol. 2005, 52, 903–909. [Google Scholar] [CrossRef]
  39. Sabirhazi, G.; Borong, P. Variability of Fruit Characters of Calligonum roborovskii A. Los. Acta Bot. Boreali-Occident. Sin. 2008, 28, 370–374. [Google Scholar]
  40. Shi, W.; Pan, B.; Duan, S.; Kang, X. Difference of Fruit Morphological Characters of Calligonum mongolicum and Related Species. J. Desert Res. 2011, 31, 121–128. [Google Scholar]
  41. Feng, Y.; Wen, Z.; Li, Y.; Li, W. Climatic Factors Influencing Geographical Replacement in the Desert Genus Calligonum Sect. Medusa (Polygonaceae) in Xinjiang, China. Pak. J. Bot. 2021, 53, 1339–1342. [Google Scholar]
  42. Pan, H.; Feng, Y.; Wang, X.; Li, Y. Examination and comparison of the physiological characteristics of ten Calligonum species in a desert environment. Acta Prataculturae Sin. 2017, 26, 68–75. [Google Scholar]
  43. Zhang, Y.Z.; Zhang, Q.; Kang, X.S.; Pan, B.R.; Duan, S.M. Soil Characteristics of the Different Habitats of the Chinese Endemic Species Calligonum ebinuricum. Bull. Bot. Res. 2011, 31, 347–353. [Google Scholar]
  44. Rivers, M.C.; Brummitt, N.A.; Lughadha, E.N.; Meagher, T.R. Do species conservation assessments capture genetic diversity? Glob. Ecol. Conserv. 2014, 2, 81–87. [Google Scholar] [CrossRef]
  45. Sabirhazi, G.; Pan, B.-R. Chromosome numbers of three Calligonum species (Polygonaceae). Nord. J. Bot. 2009, 27, 284–286. [Google Scholar] [CrossRef]
  46. Gui, C.; Guan, S. Chromosomal geographic distribution of the genus Calligonum species (Polygonaceae) in Xinjiang. Arid. Zone Res. 1986, 02, 28–31. [Google Scholar]
  47. Beier, S.; Thiel, T.; Muench, T.; Scholz, U.; Mascher, M. MISA-web: A web server for microsatellite prediction. Bioinformatics 2017, 33, 2583–2585. [Google Scholar] [CrossRef]
  48. Untergasser, A.; Cutcutache, I.; Koressaar, T.; Ye, J.; Faircloth, B.C.; Remm, M.; Rozen, S.G. Primer3—New capabilities and interfaces. Nucleic Acids Res. 2012, 40, e115. [Google Scholar] [CrossRef]
  49. Adeyemo, O.A.; Ayodele, O.O.; Ajisafe, M.O.; Okinedo, U.E.; Adeoye, D.O.; Afanou, A.B.; Akinsemoyin, F.A.; Ogunjobi, O.O.; Kasali, O.J.; Chukwudiri, E.E. Evaluation of dark jute SSR markers and morphological traits in genetic diversity assessment of jute mallow (Corchorus olitorius L.) cultivars. S. Afr. J. Bot. 2021, 137, 290–297. [Google Scholar] [CrossRef]
  50. Vit, P.; Krak, K.; Douda, J.; Mandak, B. Microsatellite markers for Anthericum ramosum: Development, characterization, and cross-species amplification. Appl. Plant Sci. 2020, 8, e11323. [Google Scholar] [CrossRef]
  51. Glaubitz, J.C. CONVERT: A user-friendly program to reformat diploid genotypic data for commonly used population genetic software packages. Mol. Ecol. Notes 2004, 4, 309–310. [Google Scholar] [CrossRef]
  52. Peakall, R.; Smouse, P.E. GenAlEx 6: Genetic analysis in Excel. Population genetic software for teaching and research. Mol. Ecol. Notes 2006, 6, 288–295. [Google Scholar] [CrossRef]
  53. Carpio, A.J.; Apollonio, M.; Acevedo, P. Wild ungulate overabundance in Europe: Contexts, causes, monitoring and management recommendations Palabras clave. Mamm. Rev. 2021, 51, 95–108. [Google Scholar] [CrossRef]
  54. Muellner, D. fastcluster: Fast Hierarchical, Agglomerative Clustering Routines for R and Python. J. Stat. Softw. 2013, 53, 1–18. [Google Scholar]
  55. Tamura, K.; Stecher, G.; Peterson, D.; Filipski, A.; Kumar, S. MEGA6: Molecular Evolutionary Genetics Analysis Version 6.0. Mol. Biol. Evol. 2013, 30, 2725–2729. [Google Scholar] [CrossRef] [PubMed]
  56. Sonstebo, J.H.; Tollefsrud, M.M.; Myking, T.; Steffenrem, A.; Nilsen, A.E.; Edvardsen, O.M.; Johnskas, O.R.; El-Kassaby, Y.A. Genetic diversity of Norway spruce (Picea abies (L.) Karst.) seed orchard crops: Effects of number of parents, seed year, and pollen contamination. For. Ecol. Manag. 2018, 411, 132–141. [Google Scholar] [CrossRef]
  57. Evanno, G.; Regnaut, S.; Goudet, J. Detecting the number of clusters of individuals using the software STRUCTURE: A simulation study. Mol. Ecol. 2005, 14, 2611–2620. [Google Scholar] [CrossRef]
  58. Francis, R.M. POPHELPER: An R package and web app to analyse and visualize population structure. Mol. Ecol. Resour. 2017, 17, 27–32. [Google Scholar] [CrossRef] [PubMed]
Figure 1. (a) Principal component analysis of 11 species of Calligonum L. based on SSR markers. (b) Principal component analysis of four groups under Calligonum L. based on SSR markers. A: C. colubrinum. B: C. leucocladum. C: C. junceum. D: C. ebinuricum. E: C. pumilum. F: C. trifarium. G: C. arborescens. H: C. jeminaicum. I: C. mongolicum. J: C. gobicum. K: C. roborowskii. 1 Sect. Calligonum. 2 Sect. Pterococcus. 3 Sect. Calliphysa. 4 Sect. Medusa.
Diversity 17 00196 g001
Figure 2. (a) Phylogenetic clustering of 80 individuals based on neighbor-joining method. (b) Phylogenetic clustering of 11 species based on neighbor-joining method.
Diversity 17 00196 g002
Figure 3. (a) Structure plot showing division of 80 individuals into K = 2, K = 3, K = 4, and K = 11. Each color represents a different group and each species is separated by a black vertical line. The horizontal scale is for the 11 species and the vertical scale is for the Q-values. (b) Structure graphic showing subpopulation using Evanno technique. K attained its highest value when K = 2. The optimal value is marked with a red line. (c) Data’s log-likelihood, L(K), is plotted as function of K (number of groups used to stratify sample). The optimal value is marked with a red line. A: C. colubrinum. B: C. leucocladum. C: C. junceum. D: C. ebinuricum. E: C. pumilum. F: C. trifarium. G: C. arborescens. H: C. jeminaicum. I: C. mongolicum. J: C. gobicum. K: C. roborowskii.
Diversity 17 00196 g003
Figure 4. (a) Structure plot showing division of 4 sections into K = 2 and K = 4. Each color represents a different group and each section is separated by a black vertical line. The horizontal scale is for the 4 section and the vertical scale is for the Q-values. (b) Structure graphic showing subpopulation. K attained its highest value when K = 2. The optimal value is marked with a red line.
Diversity 17 00196 g004
Figure 5. Photographs of fruits of four species of Calligonum.
Diversity 17 00196 g005
Figure 6. Geographical distribution of plant materials. A: C. colubrinum. B: C. leucocladum. C: C. junceum. D: C. ebinuricum. E: C. pumilum. F: C. trifarium. G: C. arborescens. H: C. jeminaicum. I: C. mongolicum. J: C. gobicum. K: C. roborowskii.
Diversity 17 00196 g006
Table 1. SSRs in the C. junceum genome.
ItemsNumber
Total size of genome (Mb)1357.67
Total number of identified SSRs380,328
Total length of SSRs (bp)6,967,136
Frequency (SSRs/Mb)280.13
Density (bp/Mb)5131.69
Table 2. Characteristics of Simple Sequence Repeat (SSR) loci of C. junceum.
Repeat TypePredominant TypeNumberProportion (%)Frequency (SSRs/Mb)Total Length (bp)Average Length (bp)
MonoA/T204,094 65.28 150.33 2,514,452 12.32
DiAT/TA99,173 31.72 73.05 1,422,190 14.34
TriAAT/ATT6527 2.09 4.81 43,106 6.60
TetraACAT/ATGT1129 0.36 0.83 9221 8.17
Penta-769 0.25 0.57 4216 5.48
Hexa-939 0.30 0.69 9462 10.08
Table 3. Details of genetic diversity parameters obtained from 17 polymorphic SSR primers in Calligonum L.
LocusNaNeIHoHePIC
Sgz0013.002.020.770.240.440.68
Sgz0021.901.510.430.350.260.60
Sgz0043.092.080.850.660.490.68
Sgz0053.272.300.880.280.490.70
Sgz0065.093.411.230.610.610.86
Sgz0072.451.820.660.300.390.64
Sgz0102.001.470.410.020.230.48
Sgz0112.632.160.810.740.480.55
Sgz0123.542.741.020.600.550.82
Sgz0142.271.650.490.110.290.49
Sgz0161.811.450.380.010.240.51
Sgz0174.363.271.260.970.670.75
Sgz0191.721.450.340.000.210.51
Sgz0202.181.700.400.020.220.62
Sgz0211.811.510.380.000.230.56
Sgz0222.271.490.430.050.250.48
Sgz0232.181.700.400.000.210.61
Mean2.68 1.99 0.66 0.29 0.37 0.62
Abbreviations: Na: observed number of alleles; Ne: effective number of alleles; I: Shannon’s information index; Ho: observed heterozygosity; He: expected heterozygosity; PIC: polymorphism information content.
Table 4. Analysis of genetic diversity of 11 species of Calligonum L.
SpeciesNaNeIHoHeuHePrivate Alleles
C. colubrinum2.001.760.520.250.330.370.00
C. leucocladum2.231.880.560.270.320.370.11
C. junceum2.821.980.740.290.430.460.47
C. ebinuricum1.941.710.460.300.280.320.05
C. pumilum2.521.960.660.270.380.420.11
C. trifarium3.942.680.980.400.510.541.17
C. arborescens2.051.860.550.290.340.390.00
C. jeminaicum2.291.870.600.320.360.410.23
C. mongolicum6.113.331.300.360.640.662.05
C. gobicum0.760.660.120.070.070.080.05
C. roborowskii2.822.150.720.360.400.430.41
Mean2.681.990.660.290.370.410.42
Abbreviations: Na: number of alleles; Ne: effective number of alleles; I: Shannon’s information index; Ho: observed heterozygosity; He: expected heterozygosity; uHe: Unbiased Expected Heterozygosity; private alleles: number of Alleles Unique to a Single Population.
Table 5. The AMOVA testing results of Calligonum L. populations.
SourcedfSSMSEst. Var.%PNm
Among Species10370.3837.041.455%0.050.38
Within Species691869.3227.1027.0995%
df: degree of freedom; SS: sum of squares; MS: mean sum of squares; P: genetic differentiation coefficient; Nm: gene flow.
Table 6. Nei’s genetic distance between different species genotypes.
ABCDEFGHIJK
0.00 A
0.63 0.00 B
0.33 0.78 0.00 C
0.28 0.52 0.54 0.00 D
0.36 1.00 0.26 0.44 0.00 E
0.42 0.85 0.22 0.46 0.20 0.00 F
0.31 0.56 0.56 0.13 0.47 0.39 0.00 G
0.20 0.86 0.57 0.36 0.45 0.42 0.33 0.00 H
0.21 0.73 0.26 0.26 0.22 0.24 0.24 0.22 0.00 I
1.09 0.85 1.92 1.01 1.83 1.63 0.88 1.15 1.33 0.00 J
0.50 0.19 0.83 0.72 0.90 0.85 0.63 0.51 0.65 0.76 0.00 K
Note: A: C. colubrinum; B: C. leucocladum; C: C. junceum; D: C. ebinuricum; E: C. pumilum; F: C. trifarium; G: C. arborescens; H: C. jeminaicum; I: C. mongolicum; J: C. gobicum; K: C. roborowskii.
Table 7. Details of 11 Calligonum L. species sampled, along with their geocoordinates.
IDSpeciesNumberLatitude (N)Longitude (E)Elevation (m)
ACalligonum colubrinum444.5889.98520.51
BCalligonum leucocladum444.1990.14755.91
CCalligonum junceum844.6282.63277.57
DCalligonum ebinuricum444.6283.16370.29
ECalligonum pumilum542.8189.98129.20
FCalligonum trifarium844.0380.75564.00
GCalligonum arborescens444.0880.49639.00
HCalligonum jeminaicum447.3286.77574.20
ICalligonum mongolicum2342.8990.25387.00
JCalligonum gobicum443.8494.81361.87
KCalligonum roborowskii1246.2186.31438.23
Table 8. The characteristics of the 17 polymorphic SSR primer pairs of Calligonum.
Locus NamePrimers (5′ to 3′)Allele Size (bp)Ta (°C)
Sgz001F: ACCTCTTCAGTAGTTGACCTCA19559
R: TCCCTAAGGCTAGTTGGAGGA
Sgz002F: CAACTGCCGACACACAGATG17559
R: AGTTTGCTTGGTTGGGTCTGA
Sgz004F: AGCATACAAGTGTCGGCCTC17859
R: TGGTCTTGAGTGCGGATGAT
Sgz005F: TCGAGTTAGTCCCGGATCGT13159
R: ACTTCACCATCTCAATCACCTCT
Sgz006F: TCCATGTCTCCAAACGGCTG14060
R: TCCCTCCACATCTCACGAATC
Sgz007F: GAAGGGTAAGCAGAAACTGGGA19060
R: TCGCAGAACCACAACGATCC
Sgz010F: CCTACGTCTGAGGCGTTCTC18960
R: AGCAAAGAGGGCTTAGTTCTTCA
Sgz011F: ACGTCGTGCTTCTAAAGGGT12257
R: ACTGACAATTATATGGAGGCACA
Sgz012F: GGTTACAGCGCCAGGAATCT14459
R: TGCTACACTTGTACTTATACCCTGA
Sgz014F: ATACGTGGCACAGAAGTCCG16560
R: TGGGTGGAAAGGTGAATCGAG
Sgz016F: AGGCGTTAACACCCGAAACT17758
R: AGCAAGGAGGGCTTAGTTCT
Sgz019F: CCGCCCGAAACTCTGTGTT16959
R: AGCAAAGAGGGCTTAGTTCTTCA
Sgz020F: CCGCCCGAAACTCTGTGTT16959
R: AGCAAAGAGGGCTTAGTTCTTCA
Sgz021F: CCGCCCGAAACTCTGTGTT16959
R: AGCAAAGAGGGCTTAGTTCTTCA
Sgz022F: TTCCCGCCCGAAACTTTGT16758
R: AGGGCTTTGTTCTTCATAGAGCA
Sgz023F: CCGCCCGAAACTCTGTGTT16959
R: AGCAAAGAGGGCTTAGTTCTTCA
Disclaimer/Publisher’s Note: The statements, opinions and data contained in all publications are solely those of the individual author(s) and contributor(s) and not of MDPI and/or the editor(s). MDPI and/or the editor(s) disclaim responsibility for any injury to people or property resulting from any ideas, methods, instructions or products referred to in the content.

