Article

Effect of Long-Term Set-Aside Management System on Soil Health by Evaluation of Biodiversity Indicators

1
Research Centre for Plant Protection and Certification, Council for Agricultural Research and Economics, Via di Lanciola 12A, 51025 Firenze, FI, Italy
2
Research Centre for Agriculture and Environment, Council for Agricultural Research and Economics, Via di Lanciola 12A, 51025 Firenze, FI, Italy
3
Research Centre for Genomics and Bioinformatics, Council for Agricultural Research and Economics, Via S. Protaso 69, 29017 Fiorenzuola d’Arda, PC, Italy
*
Author to whom correspondence should be addressed.
Diversity 2025, 17(4), 240; https://doi.org/10.3390/d17040240
Submission received: 6 March 2025 / Revised: 20 March 2025 / Accepted: 24 March 2025 / Published: 28 March 2025
(This article belongs to the Special Issue Restoring and Conserving Biodiversity: A Global Perspective)

Abstract

:
The loss of organic matter and the decline of biodiversity pose significant threats to soil health and the sustainability of agriculture. Managing set-aside land through mowing remains a practical strategy to prevent land abandonment while preserving soil biodiversity and essential soil functions that support fertility. The primary objective of this study was to evaluate the effectiveness of long-term set-aside (12 years) in preventing soil degradation. In an experimental field in Vicarello (Pisa, Italy), set-aside management was compared to land abandonment and conventional crop rotation. Soil chemical and microbiological analyses were conducted, and various indicators were used to assess soil fertility conservation. Soil biodiversity was evaluated through nematode and microarthropod indices. Total organic carbon increased in abandoned fields and, to a lesser extent, in set-aside areas, following a similar trend to microbial biomass values. Nematode and microarthropod indicators revealed a more stable soil structure in set-aside areas, followed by abandoned fields, highlighting their role in regulating ecosystem services such as carbon mineralization. On the whole, the results indicate that set-aside management serves as an intermediate step in the transition from conventionally managed fields to naturalized grasslands, confirming its potential benefits for soil biological diversity and function.

Graphical Abstract

1. Introduction

Loss of organic matter and decline in biodiversity are among the main threats to soil health and agricultural sustainability. To address these issues, the current European Common Agricultural Policy (CAP) 2023–2027 responds to urgent environmental challenges and includes some new attempts at greening. In this framework, GAEC (BCAA) n. 8 requires a minimum percentage of at least 4% of arable land, at farm level, to be allocated to non-productive areas and features, including set-aside, to improve the conservation of all soil organisms that represent a huge reserve of biodiversity and are essential for soil fertility. In parallel, land use transition, related to extensification of management and agricultural abandonment, is a widespread phenomenon in European landscapes, particularly in the Mediterranean area and also represents a serious threat [1,2]. In this perspective, the management of set-aside areas by mowing and abandoned lands could still represent a simple way to prevent land abandonment and preserve biodiversity and soil functions, essential for its fertility.
Several authors have studied the impact of set-aside management in the short and mid-term by chemical parameters and soil biodiversity [3]. The set-aside management increases the total organic carbon content [4,5], but the humification remains low [6]. The highest organic C increment is obtained when the previous crops are cereal such as wheat and barley increasing soil depletion. At a biological level, the set-aside enhances the microbial diversity likely due to the vegetal residues and roots left in the soil alter mowing, but it decreases the microbial biomass compared to conventional management evidencing a minor efficiency in the use of the organic matter [7,8]. Some authors found that when nematode community structure changes in set-aside management, the colonizer species, mainly bacterivores, increase in abundance and richness [6,9,10]. Instead, predator and plant-parasitic nematode composition weakly shift [6,11]. In these conditions, the predators are not able to regulate the ecosystem services of carbon mineralization and plant parasitic nematodes [6]. Regarding the microarthropod community, several authors reported that the set-aside increases the presence of edaphic groups [7,12,13] and prevents the dominance of some aggressive groups.
To date, no studies have been conducted to evaluate the long-term effect of mowing. There are only a few studies on how succession to a naturalized pasture from former agricultural lands influences changes in soil fertility and soil community [10,14,15,16]. Furthermore, several authors are starting to consider land abandonment as an effective strategy for ecological restoration on a global scale [17,18,19].
The main objective of the present study was to evaluate the potential effectiveness of mowing set-aside over a long period to improve soil biodiversity. Mowing set-aside was compared with unmowed/abandoned fields and conventional crops. Different indicators have been used to assess soil fertility conservation and changes in biodiversity at different scales, including nematodes and microarthropods. The hypothesis in this work was that set-aside management by mowing could increase soil fertility, the abundance of nematode and microarthropod communities, and their biodiversity indicators better than the usual crop rotation and abandoned fields. Even though the comparison after only 12 years of application could represent a limitation in appreciating significant differences between set-aside and abandonment, it still provides insights into the temporal trends of soil biota. In detail, the effect of set-aside management was evaluated by (i) the soil chemical properties and microbial indicators, (ii) the entire soil nematode and microarthropod structure and their biodiversity indicators, and (iii) the relationship between environmental variables and biological indicators.

2. Materials and Methods

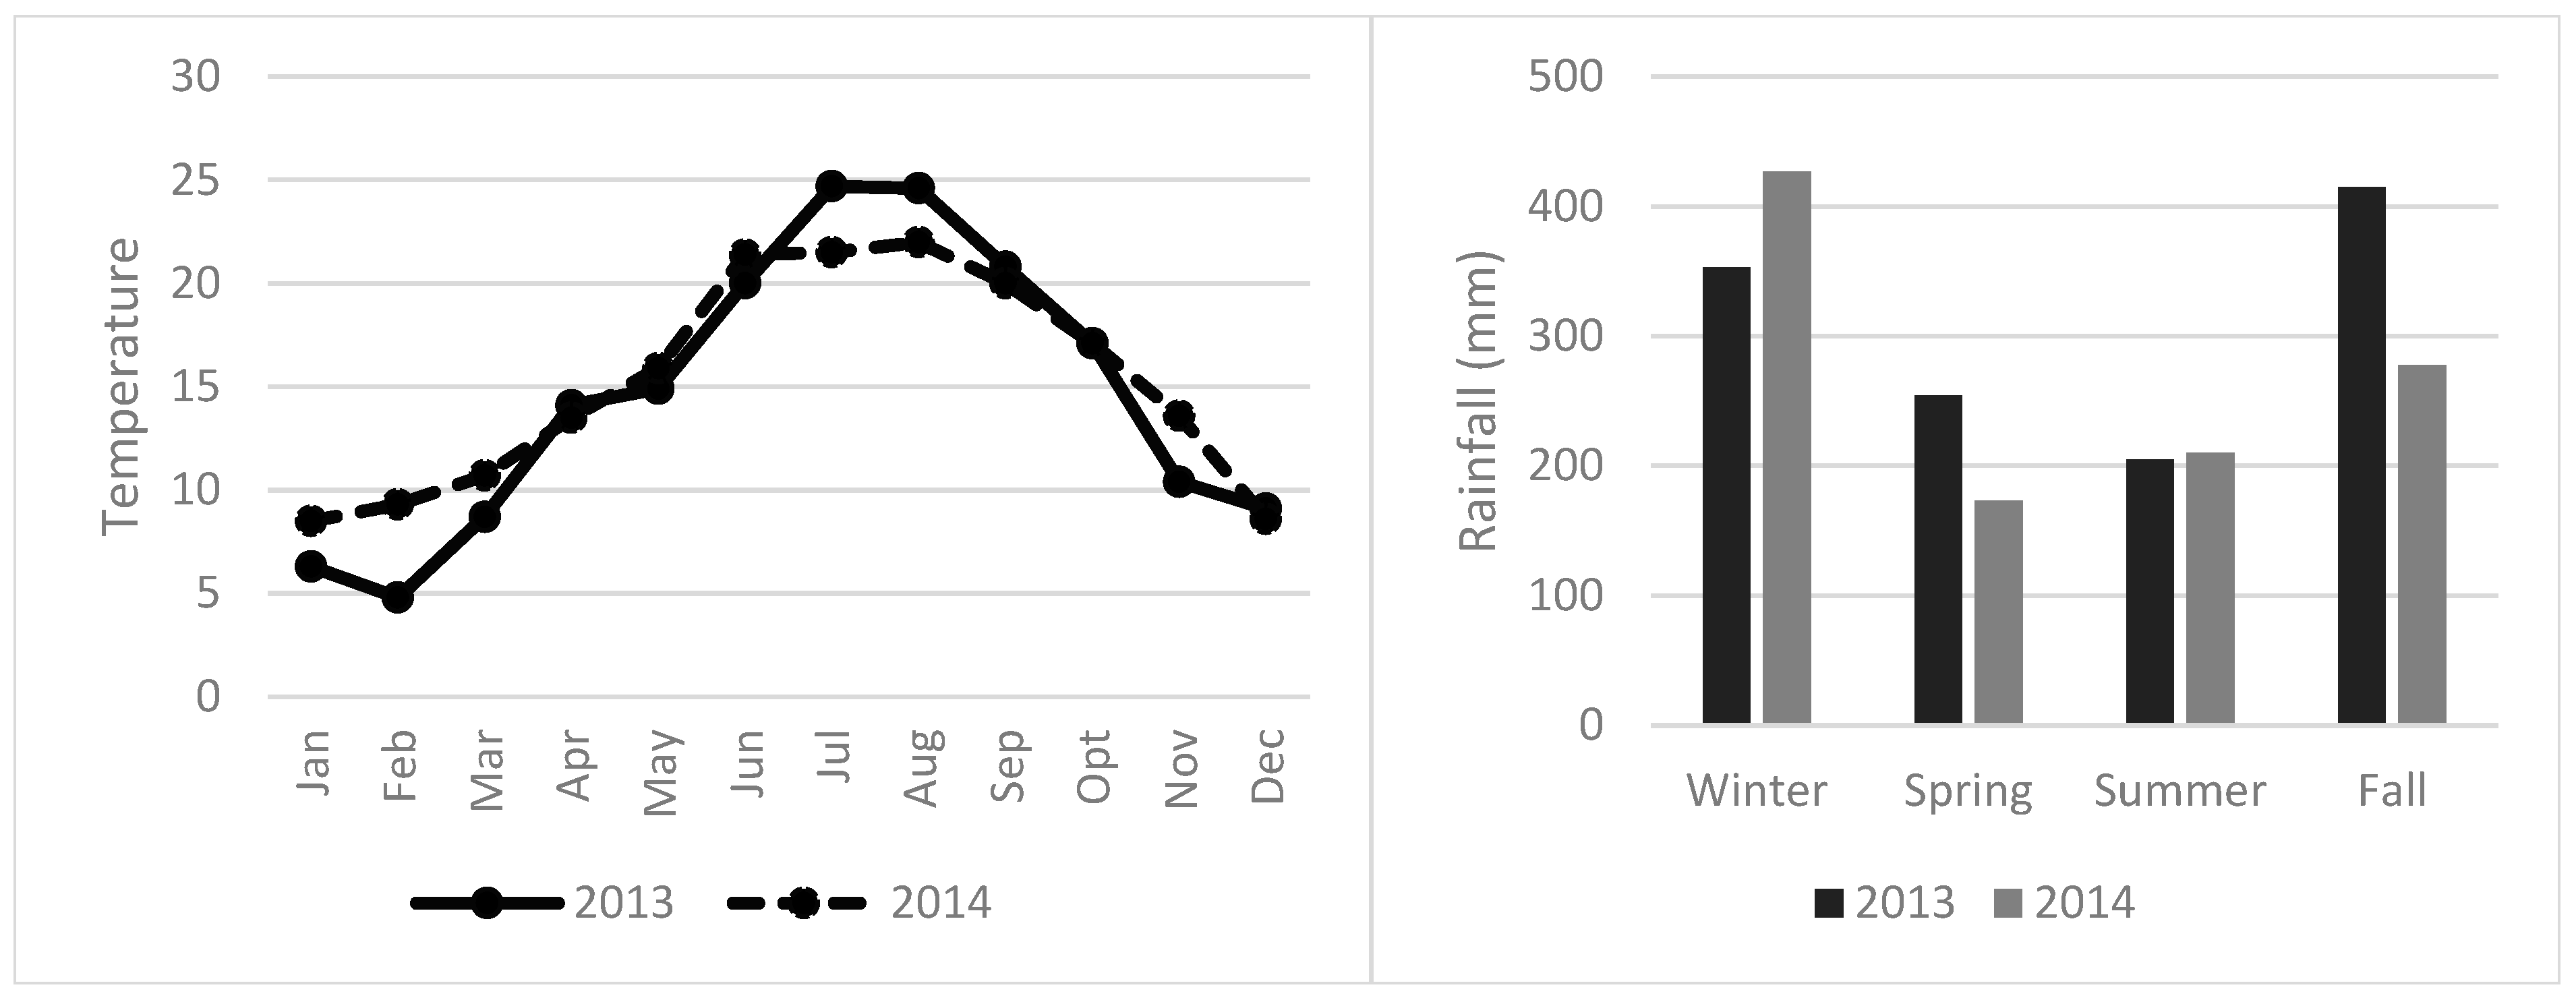
2.1. Field Site and Treatments Description

The experimental field used in this study belonged to CREA and was located in Central Italy, at Vicarello of Volterra (Pisa, Tuscany; latitude 43°27′48″ N, longitude 10°51′52″ E), on a hill at 450 m a. s. l. Soil is a Vertic Haploxerepts, fine, mixed thermic (USDA classification), and the texture was classified as silty-clay with 4.6% (0.20) of sand, 53.5% (0.34) of silt, and 41.9% (0.52) of clay. The field has been managed as set-aside since 2002 in a site previously used for conventional cereal crops. The trial was carried out in 2013 and 2014, corresponding to the 11th and 12th year of the set-aside management. The local climate was defined as Hot-summer Mediterranean climate (Csa) according to the Köppen climate classification. During these two years, the average temperature was 14.9 °C with average maximum temperatures observed in July and August 2013 (30 °C) and the minimum in February 2013 (5 °C). The average annual precipitation was 1157 mm, mostly concentrated in fall 2013 and winter 2014 (Figure 1).
The set-aside management was compared to an adjacent abandoned field and to conventional crop rotation. More specifically, the three plots considered in the present study were managed as (i) set-aside with mowing (SA), avoiding the removal of the vegetation cover, carried out in July to preserve bird breeding by Directive 2009 147/EC; (ii) set-aside without mowing/abandoned (AB); and (iii) crop rotation (CR) alternating wheat (Triticum durum) and common vetch (Vicia sativa). The total area of three plots was 1.5 ha (0.5 ha per plot) with an ecotonal belt on one side common to all the selected fields to favor the introduction of species from a natural area.

2.2. Soil Sampling Design

To evaluate the mowing impact on biodiversity and the eventual introduction of species from the ecotonal belt, soil samples were collected in 2013 and 2014 in spring (before mowing) and autumn (after mowing) in three different points of each plot, located at about 20 m, 40 m, and 60 m from the ecotonal belt. For each parameter examined, three samples per three treatments and four times, corresponding to 36 samples as a whole, were collected.
To characterize the main soil chemical properties, samples were taken at 0–20 cm depth (corresponding to Horizons O, Ap1, and Ap2). Soil pH, available phosphorus (P), and total organic carbon (TOC) were measured. Soil samples for microbial biomass and respiration were collected from the topsoil (0–20 cm) and stored at 4 °C until arrival at the laboratory. To characterize soil nematode structure, an additional set of soil samples was collected close to previous ones. The sampling was carried out with a hand auger (5 cm inside diameter) from the 0–20 cm deep top layer of bulk soil. For each soil sample, six cores were randomly sampled and then mixed to form one composite sample. To characterize microarthropod composition, a soil sample, of approximately 1 kg, was collected from each point through a special corer devoted to the mesofauna sampling (a 10 cm cube). Each sample was then placed in a sterile plastic bag, labeled, and stored in a cold chamber at 4 °C.

2.3. Soil Chemical Analysis

The soil samples were air dried at room temperature (20 °C) and sieved through a 2 mm mesh. Soil pH was measured potentiometrically in a 1:2.5 soil–water suspension. Available phosphorous (P) was determined by the Olsen method [20] using a spectrophotometer UV/Visible (UV-1601, Shimadzu, Kyoto, Japan). Total organic carbon (TOC) was determined by hot oxidation with potassium dichromate and sulphuric acid [21].

2.4. Soil Microbial Community Analysis

Microbial respiration was assessed according to Isermeyer [22]; soil respiration was expressed as mg C-CO2 kg−1 soil d−1 and measured in a closed environment after 1, 3, 7, 10, 15, 21, and 28 days for each soil using DL50-Rondolino titrator (Mettler Toledo, Columbus, Ohio, USA). Cumulative respiration (CR) represents the amount of total C-CO2 production after 28 days of incubation. Basal respiration (BR) represents the value of mineralized C in a definite period (28 days) when steady-state condition has been reached. Microbial biomass carbon MBC (mg C kg−1 soil) was measured by the fumigation extraction method on air-dried soils which were conditioned at −33 kPa water tension and preincubated for 10 days in open glass jars at 30 °C. The extraction solution was K2SO4 0.5 M, and the calculation formula was MBC (g C/g soil) = EC × 2.64, where EC is the difference between the amount of C of fumigated and non-fumigated soils [23].
Several derived parameters were then calculated in accordance with Mocali et al. [24]: (i) qCO2 (metabolic quotient), calculated by the ratio BR/MBC [(mg C-CO2 basal mg MBC −1) h−1]; (ii) the ratio MBC/TOC (microbial quotient, qMIC) expressed as a percentage [mg C biomass/mg total organic C × 100]; and (iii) qM (mineralization quotient), expressed as mg C-CO2 kg−1 soil h−1 and calculated from cumulative respiration after 28 days by the relationship: CR/TOC; (iv) the qCO2/TOC ratio expressing the metabolic efficiency (qME) [25]; (v) the Biological Fertility Index (BFI) was calculated as proposed by Renzi et al. [26], and here briefly reported: BFI = BR + CR + MBC + SOM + qCO2 + qM, where SOM (%) is soil organic matter, obtained from TOC multiplied by a conversion factor of 1.724. The biological fertility index is scored in increasing classes of soil fertility. Class I, BFI < 9, is stressed soils with very low fertility; class II, 9 < BFI < 12, is pre-stressed soils; class III, 13 < BFI < 18, is intermediate fertility soils; class IV, 19 < BFI < 24, is good fertility soils; and class V, BFI > 24, is very high fertility soils.

2.5. Soil Nematode Community Analysis

Nematodes were isolated from 100 mL of each soil sample using the cotton-wood filter extraction method. Nematodes were extracted for 48 h at room temperature, approximately 20 °C. Each nematode suspension was sieved through a 25 μm mesh, and the nematodes were counted with a stereomicroscope (50X magnification). Nematodes were mounted on temporary slides and identified at higher magnification to genus or family level using the key from Mai and Lyon [27], Bongers [28], and Marinari-Palmisano and Vinciguerra [29]. Taxonomic families were assigned to a trophic grouping based on Yeates et al. [30] and Okada et al. [31]. Nematode communities were characterized using the following: (i) absolute abundance of individuals; (ii) richness determined by counting the number of taxa (family level); (iii) biodiversity indices; (iv) the Maturity (MI) and Plant Parasitic (PPI) indices according to Bongers [32] and the food web indicators (BI, basal index; EI, enrichment index; SI, structure index; CI, channel index) according to Ferris et al. [33]; and (v) diversity-weighted abundance index (θ) calculated using biomass values [34] as reported by Ferris and Tuomisto [35] in order to evaluate the ecosystem services efficiency [6].

2.6. Soil Microarthropod Community Analysis

Microarthropods were extracted from soil samples using modified Berlese–Tullgren funnels following the standard methodology [36], observed at the stereomicroscope, and identified at the order level. The edaphic microarthropod community was characterized using (i) individual abundance, (ii) richness determined by counting the number of taxa; (iii) biodiversity indices; and (iv) QBS-ar index according to Parisi et al. [36]. The index is based on the life-form approach, and its values are the summa of EMI (Eco-Morphological Index) scores, ranging between 1 and 20 for each organism depending on its adaptation to the edaphic habitat.

2.7. Statistical Analysis

Three-way ANOVA was performed to assess the influence of management, season, and year on indicators of soil chemical properties (pH, available P, and TOC), microbial parameters (basal respiration and microbial biomass), nematode taxa abundance and edaphic microarthropods taxa abundance, and biological indicators. When the F-test was significant at p < 0.05, treatment means were compared using the Student–Newman–Keuls test using CoStat statistical software package. 6.4 (https://www.cohortsoftware.com/costat.html, accessed on 15 January 2025). In addition, nematode and microarthropods communities were compared using analysis of similarities (ANOSIM), multidimensional scaling (MDS), and SIMPER analysis based on the Bray–Curtis similarity index, nearest-neighbor provided by the Past analysis package 2.12 [37] (https://palaeo-electronica.org/2001_1/past/pastprog/index.html, accessed on 15 January 2025). The nematode and microarthropods abundance data were transformed using the square root. Bonferroni correction of p-values was applied. Environmental variables (pH, TOC, available P) were added. Canonical Correspondence Analysis (CCA) was carried out to link nematode and microarthropod communities (abundance of nematode and microarthropod taxa and their indicators) and soil chemical variables (soil pH, available P, TOC, microbial respiration, and biomass). Only the significant environmental axes were considered and are represented by vectors. The statistical significance of the relationship between community and environmental variables was assessed by permutation test of both the first ordination axis and the combination of both the first and second axes.

3. Results

3.1. Soil Chemical Properties

The average values of soil pH, TOC, and available P as well as their statistically significant changes are reported in Figure 2 and Table 1, respectively. Soil pH values ranged from 8.3 to 8.4, evidencing a soil with moderate alkalinity. The lowest organic C value was found in CR, while the highest value was observed in AB. Conversely, no differences were found between the two years. The content of available P showed only seasonal differences; the highest value was found in fall. The combined effect of management plus year and season significantly influenced both TOC and available P (Table 1).

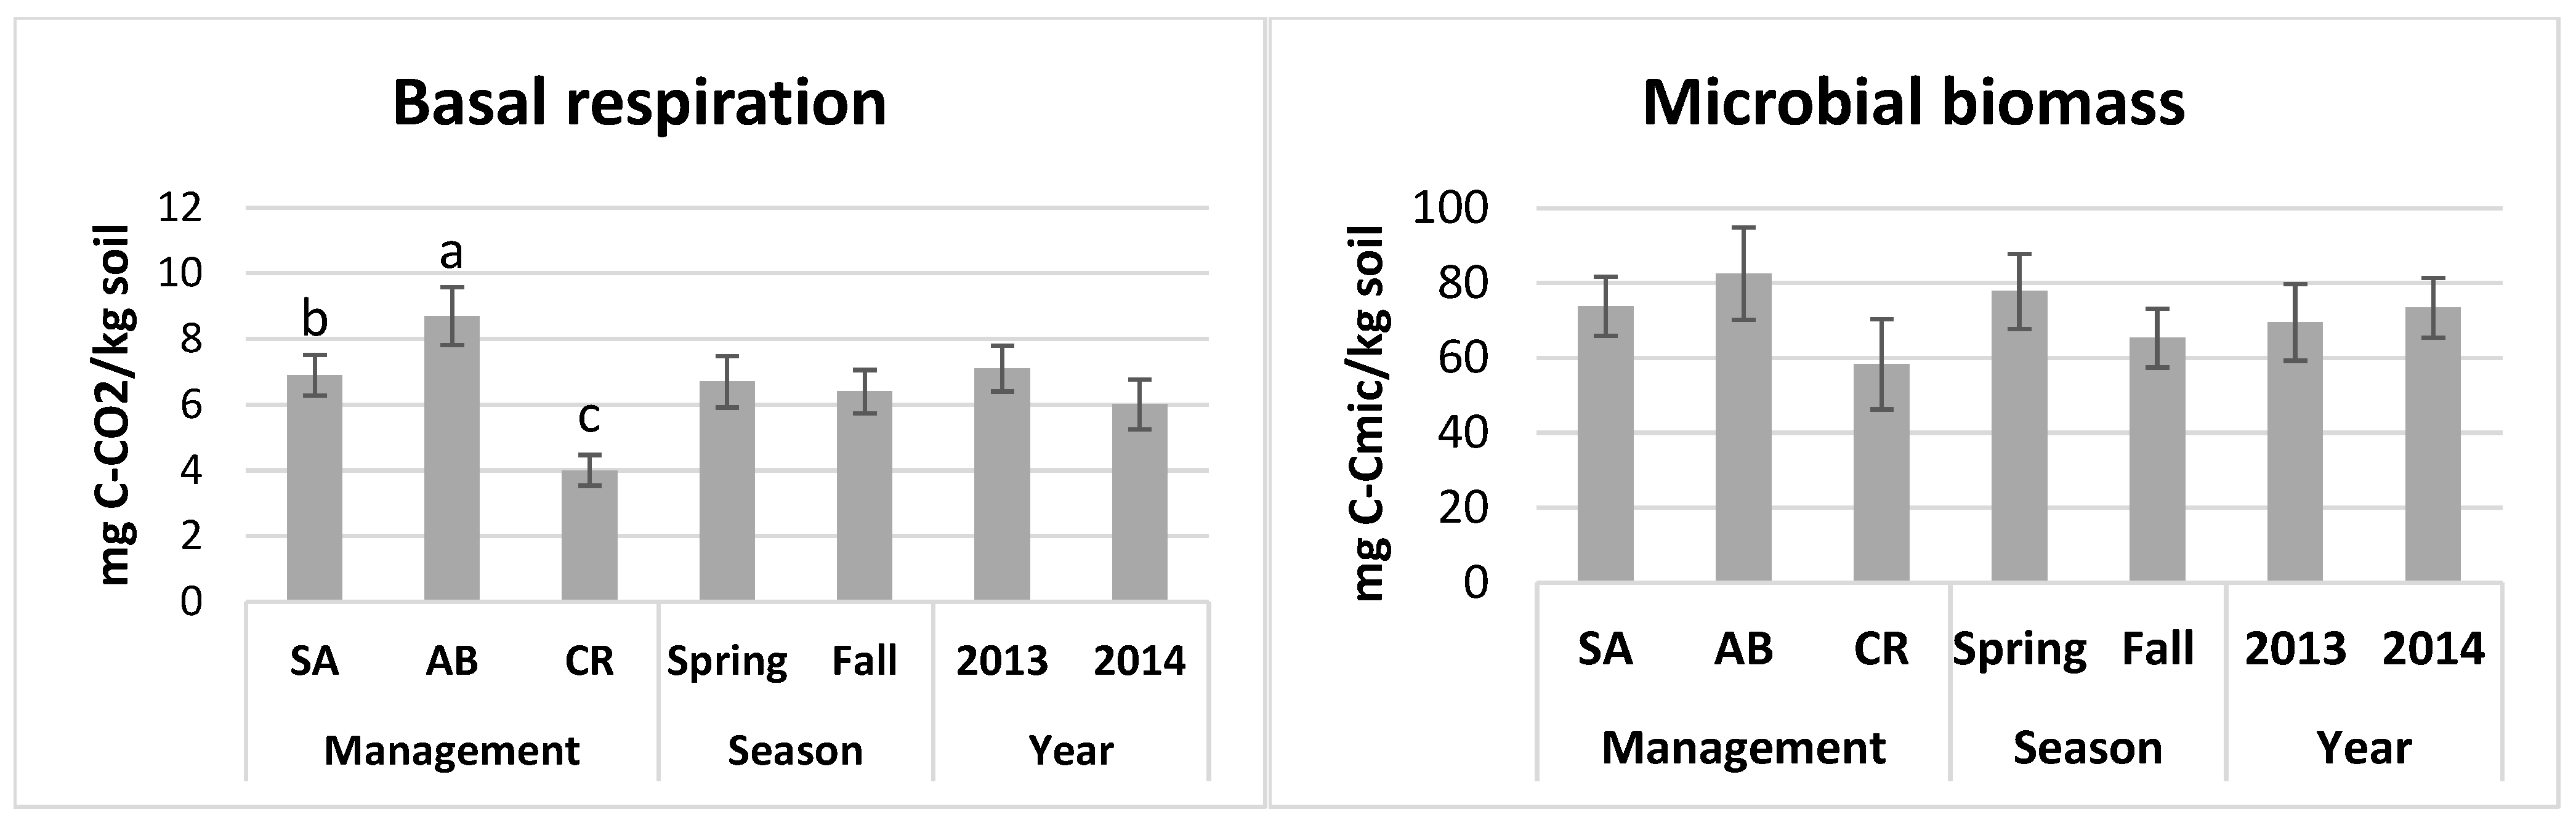
3.2. Soil Biological Activity

In accordance with the TOC values, AB and SA showed higher (but not significant) microbial biomass values than CR (Figure 3). On the other hand, the highest soil basal respiration values found in AB whereas the lowest values were displayed by CR soils, according to the TOC values (Figure 3, Table 2). No significant differences were observed between 2013 and 2014 as well as between the two seasons. Nonetheless, the interaction between season and year significantly affected both basal respiration and microbial biomass (Table 2).

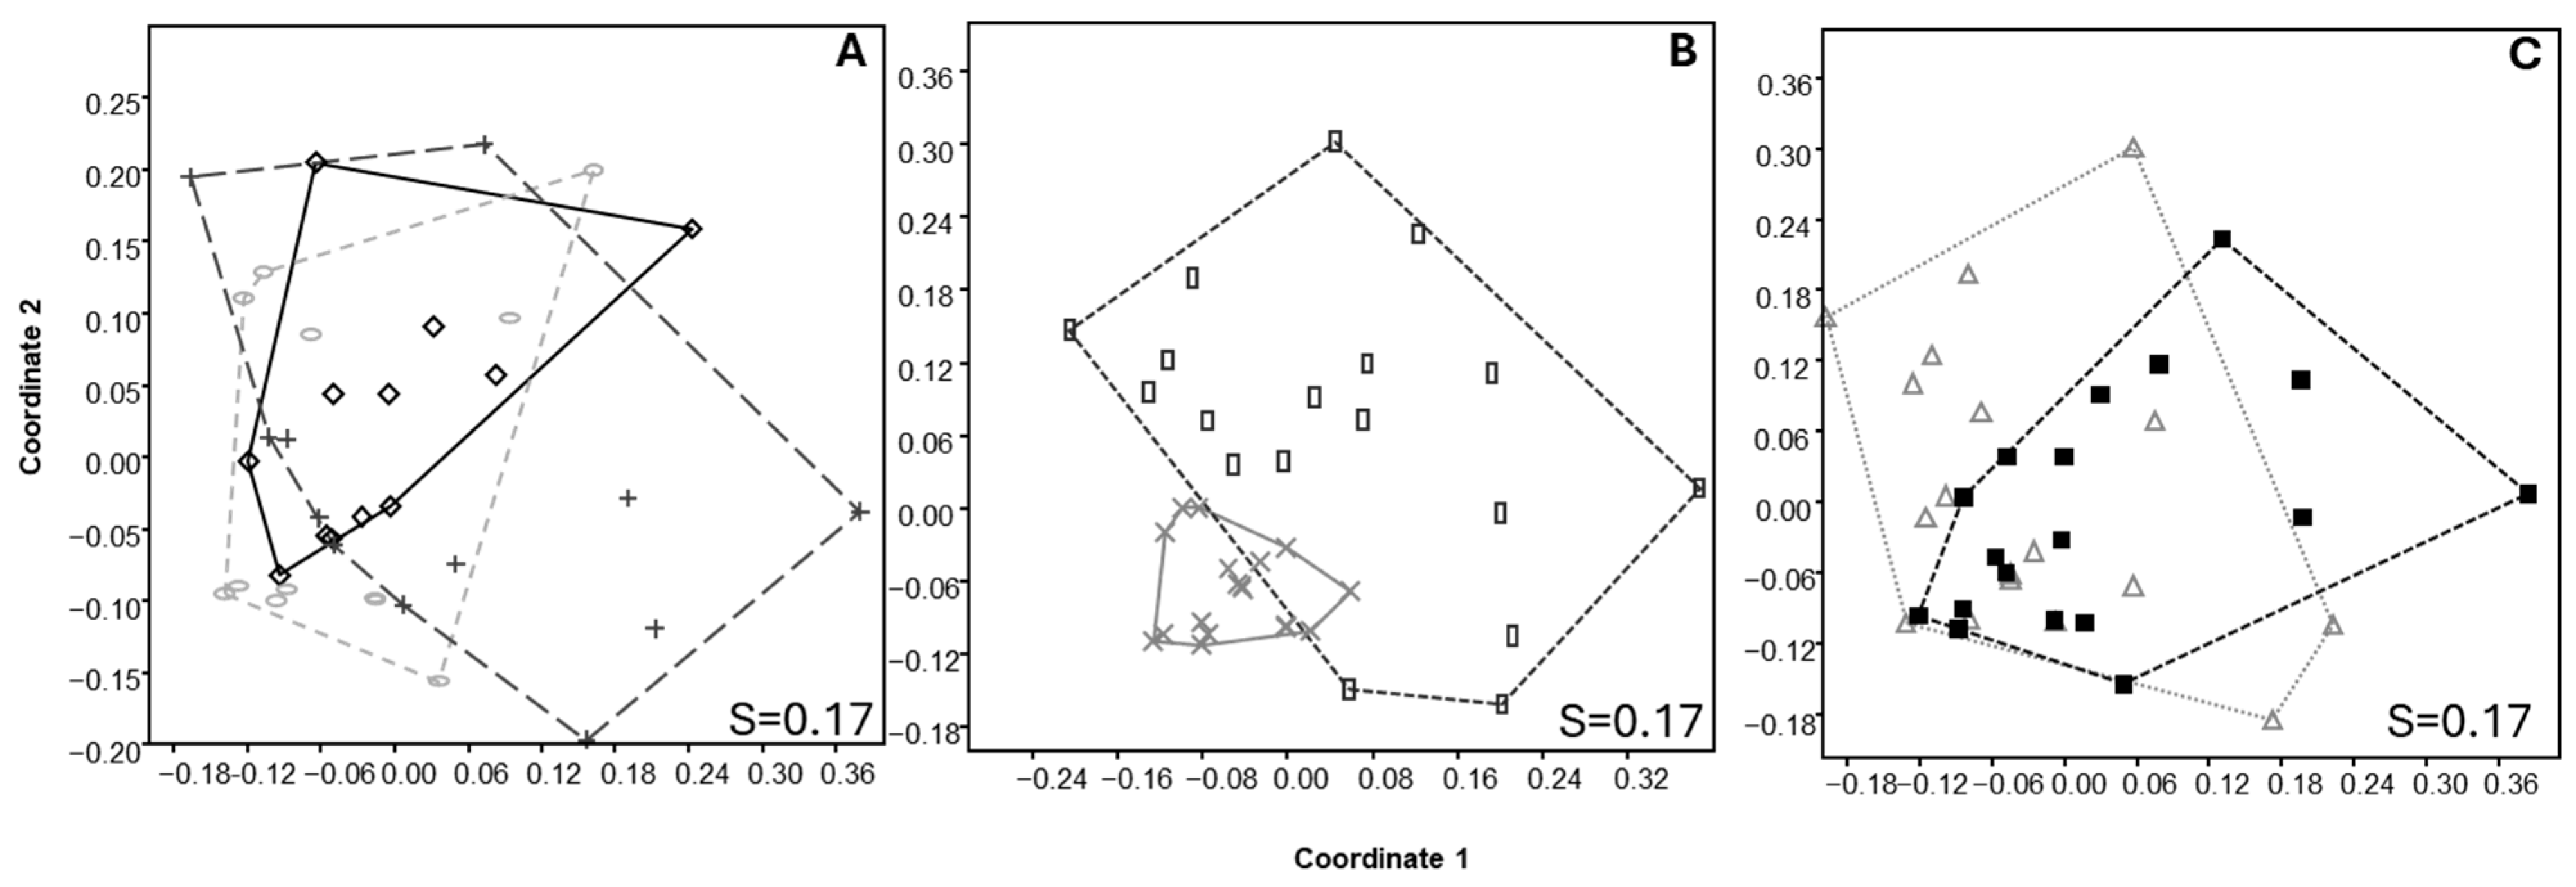
3.3. Soil Nematode Structure

Nineteen different genera, belonging to twelve plant-parasitic and free-living nematode families, were identified in soil samples collected in three different managements during the growing season for two years (Table S1).
The MDS analysis on taxa nematode abundance showed a spatial separation between SA and CR (Figure 4). ANOSIM analysis confirmed a small but significant difference between these two managements (R = 0.13, p < 0.02).
The analysis of the family abundance to the average Bray–Curtis dissimilarity using SIMPER showed 33.5% dissimilarity (Table S2). In general, the nematode population was higher in SA and AB than CR. Rhabditidae, Dorylaimidae, and Tylenchidae families were prominent and were differently affected by management. The abundance of the family of Rhabditidae was significantly greater in SA and AB than CR, the individuals belonging to the Dorylaimidae family were higher in SA than in the other managements, and no differences were found in Tylenchidae family individuals among managements. Instead, MDS analysis showed a great spatial separation between seasons (ANOSIM R = 0.45, p < 0.0001). The families of Aphelenchidae, Dorylaimidae, Mononchidae, and Tylenchidae were higher in spring than autumn (Table S3). Instead, Aphelenchoidae and Paratylenchidae families were more abundant in autumn. No spatial separation was found between years; only the Aphelenchoidae family was higher in 2014.

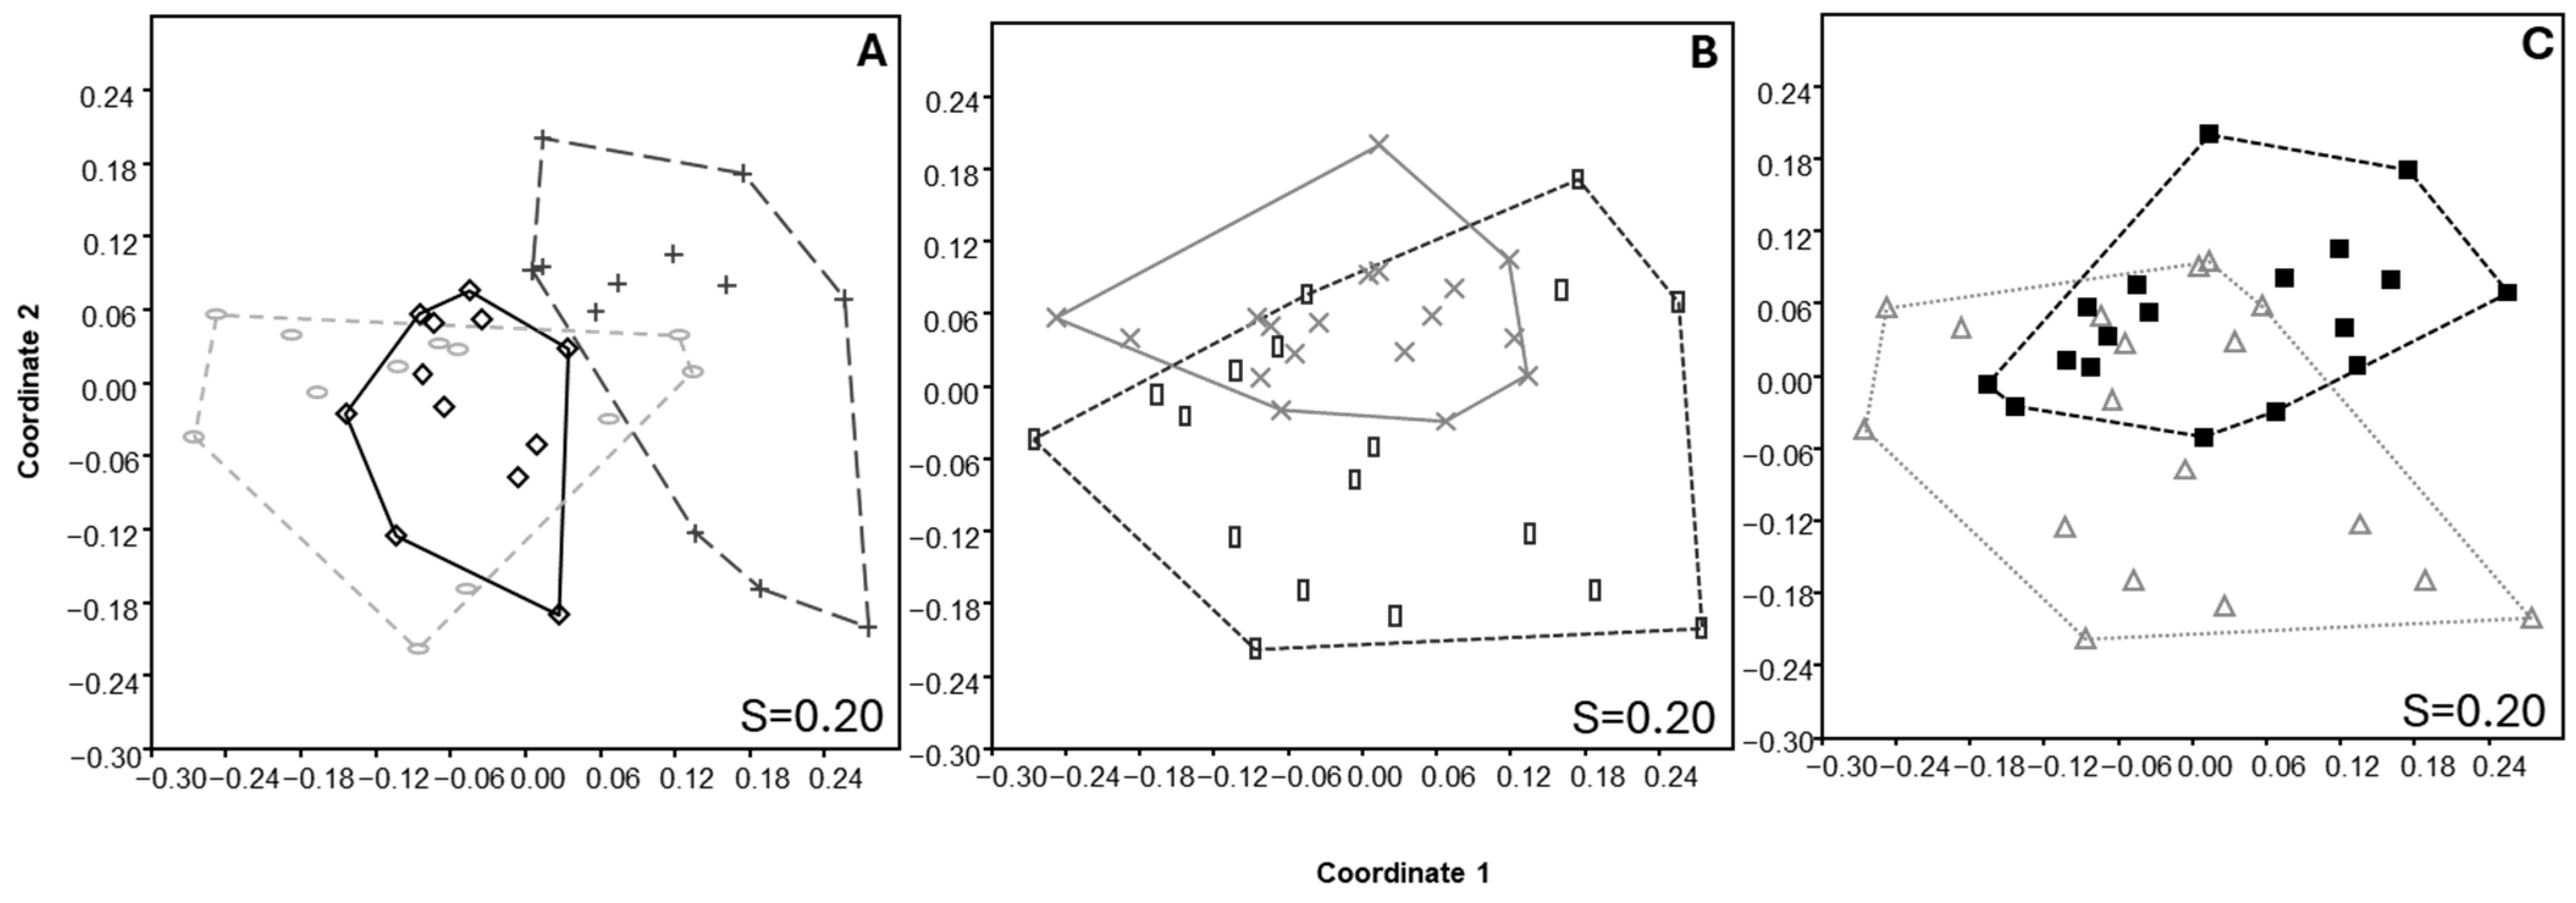
3.4. Soil Microarthropod Structure

Seventeen taxa were identified in soil samples collected in the three different managements during the two growing seasons (Table S4). The MDS analysis on taxa microarthropod abundance showed a spatial separation of SA and AB from CR (Figure 5). ANOSIM analysis confirmed a significant difference between these managements, the R value was 0.43 (p < 0.0001) and 0.41 (p < 0.0003) for the comparisons SA-CR and AB-CR, respectively. The analysis of the family abundance to the average Bray–Curtis dissimilarity using SIMPER showed 38.1% and 42.5% dissimilarity, respectively (Table S5). The abundance and taxa richness of microarthropods in SA and AB were higher than in CR. Acarina, Isopoda, Diplopoda, and Coleoptera were positively affected by both SA and AB. The taxa Chilopoda and Symphyla were significantly higher in SA than in other managements; instead, Araneae, Opilionida, and Collembola were higher in AB than others. The highest abundance of Hemiptera taxa was found in CR. Instead, MDS analysis showed a small spatial separation between seasons (ANOSIM R = 0.18, p < 0.0004) and year (ANOSIM R = 0.10, p < 0.03) (Tables S6 and S7).

3.5. Soil Biological Indicators

The average values of biological indicators are reported in Table 3. Most of the indicators showed higher values in AB compared to SA and CR. For example, the qMIN index was significantly higher in AB than in CR, and the BFI values were significantly higher in AB than in both SA (+9.6%) and CR (+11.6%). Nevertheless, no effect of management practices was observed on qCO2, qMIC, and qME values. The autumn season generally showed higher values compared to spring, with a significantly higher qM index. Additionally, 2013 was characterized by generally higher indicator values than 2014, although these differences were not significant. A significant effect of the combination of season and year was observed on qM, qMIC, and BFI. The latter was also significantly affected by the interaction between management and sampling year.
Regarding nematodes, the soil biodiversity indices evidenced few differences. Only Evenness and Menhinick indices were significant, but their range among the treatments was very low. The food web indicators instead showed that SI was significantly higher in SA than in AB and CR. To calculate diversity-weighted abundance (θ) index the nematode assemblage was arranged in three functional classes: (i) detritivores (bacterial and fungal feeders); (ii) predators (including omnivores); and (iii) plant parasitic nematodes. The detritivores group was significantly higher in SA and AB than in CR. Therefore, the regulation functions of opportunistic and plant parasitic nematodes by predation were greater in CR: the predator/prey ratio ranged from 1:1.6 in SA to 1:0.9 in CR. Many significant differences were found between the seasons, while a few between the two sampling years.
Concerning microarthropods, Evenness and Equitability were significantly higher in CR than SA and AB, while Berger–Parker and QBS-ar showed an opposite trend. In particular, the QBS-ar values were greater than 100 (good threshold value) in SA and AB, while CR showed a soil disturbance. Few significant differences for season and year were found.

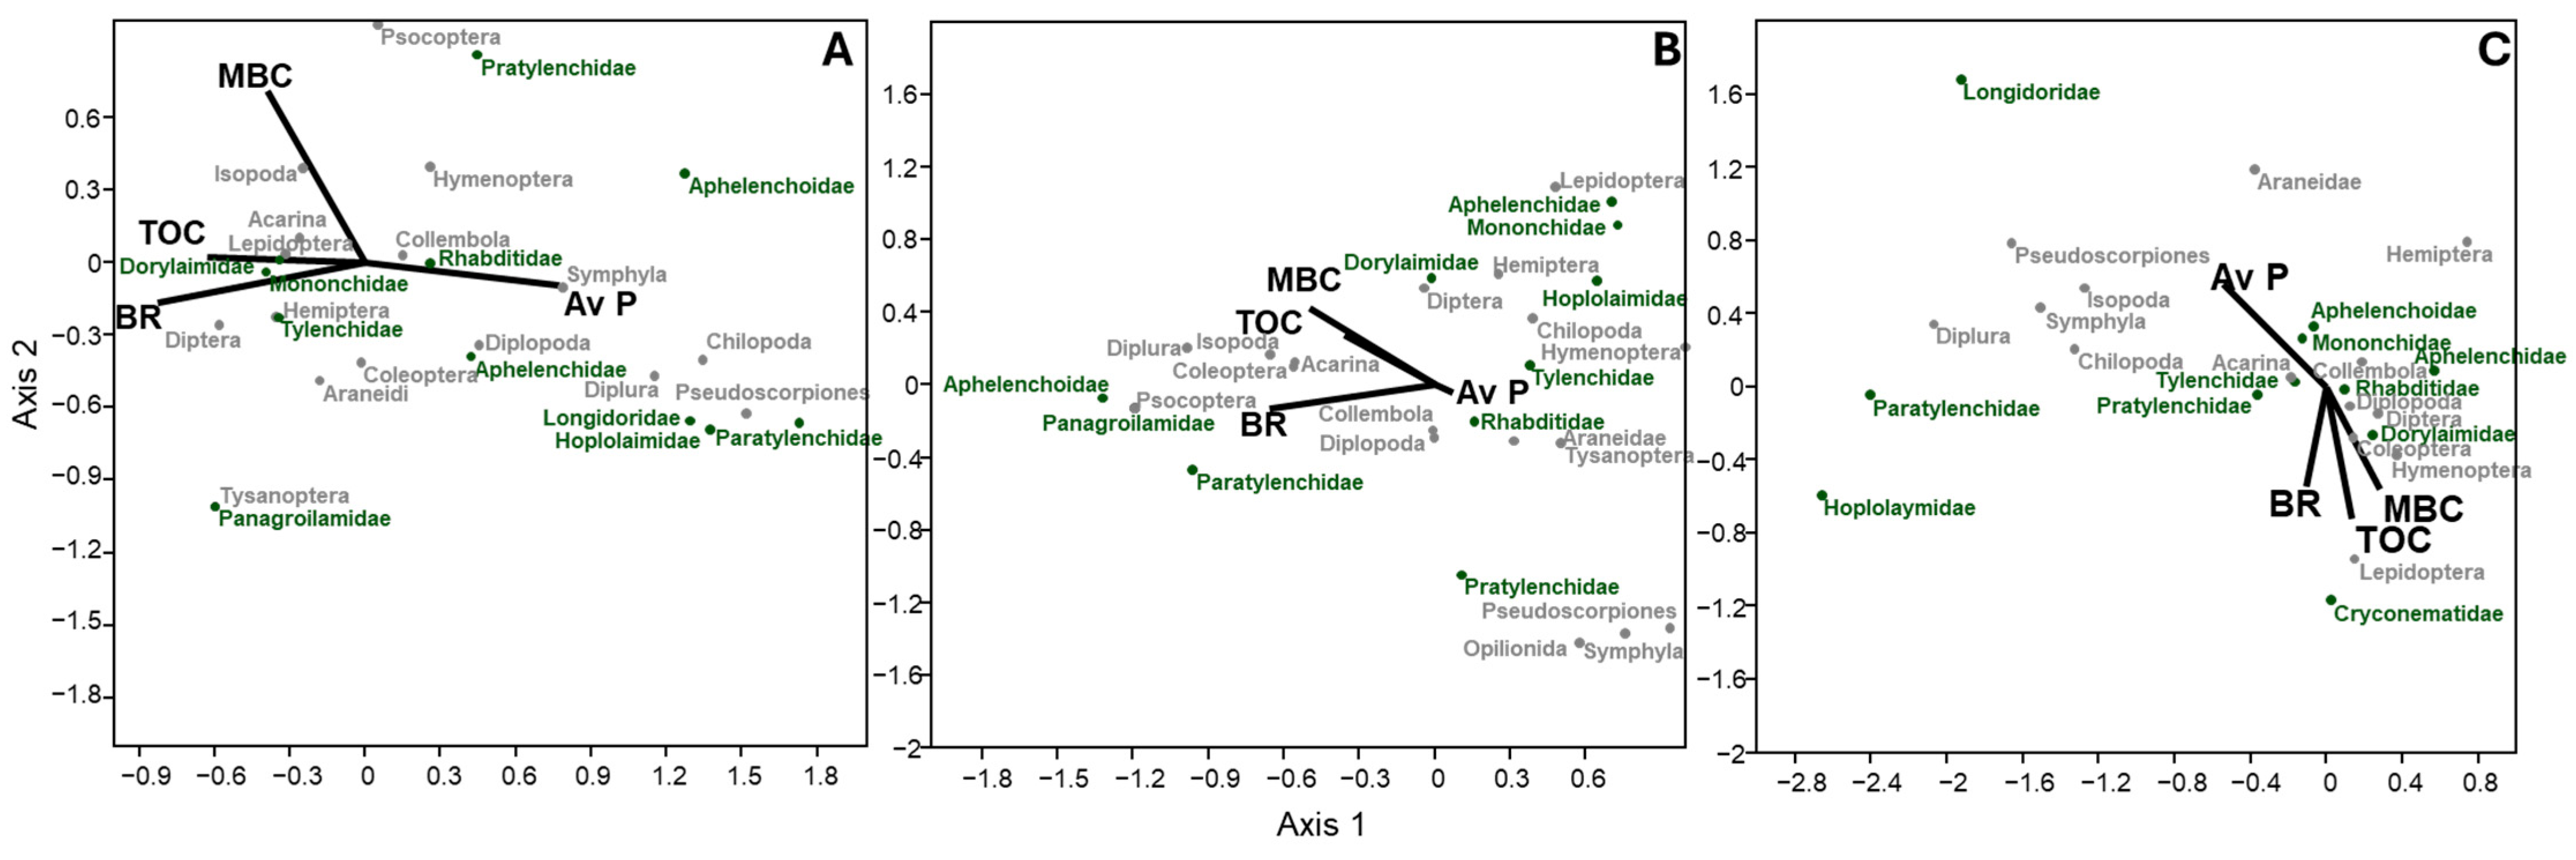
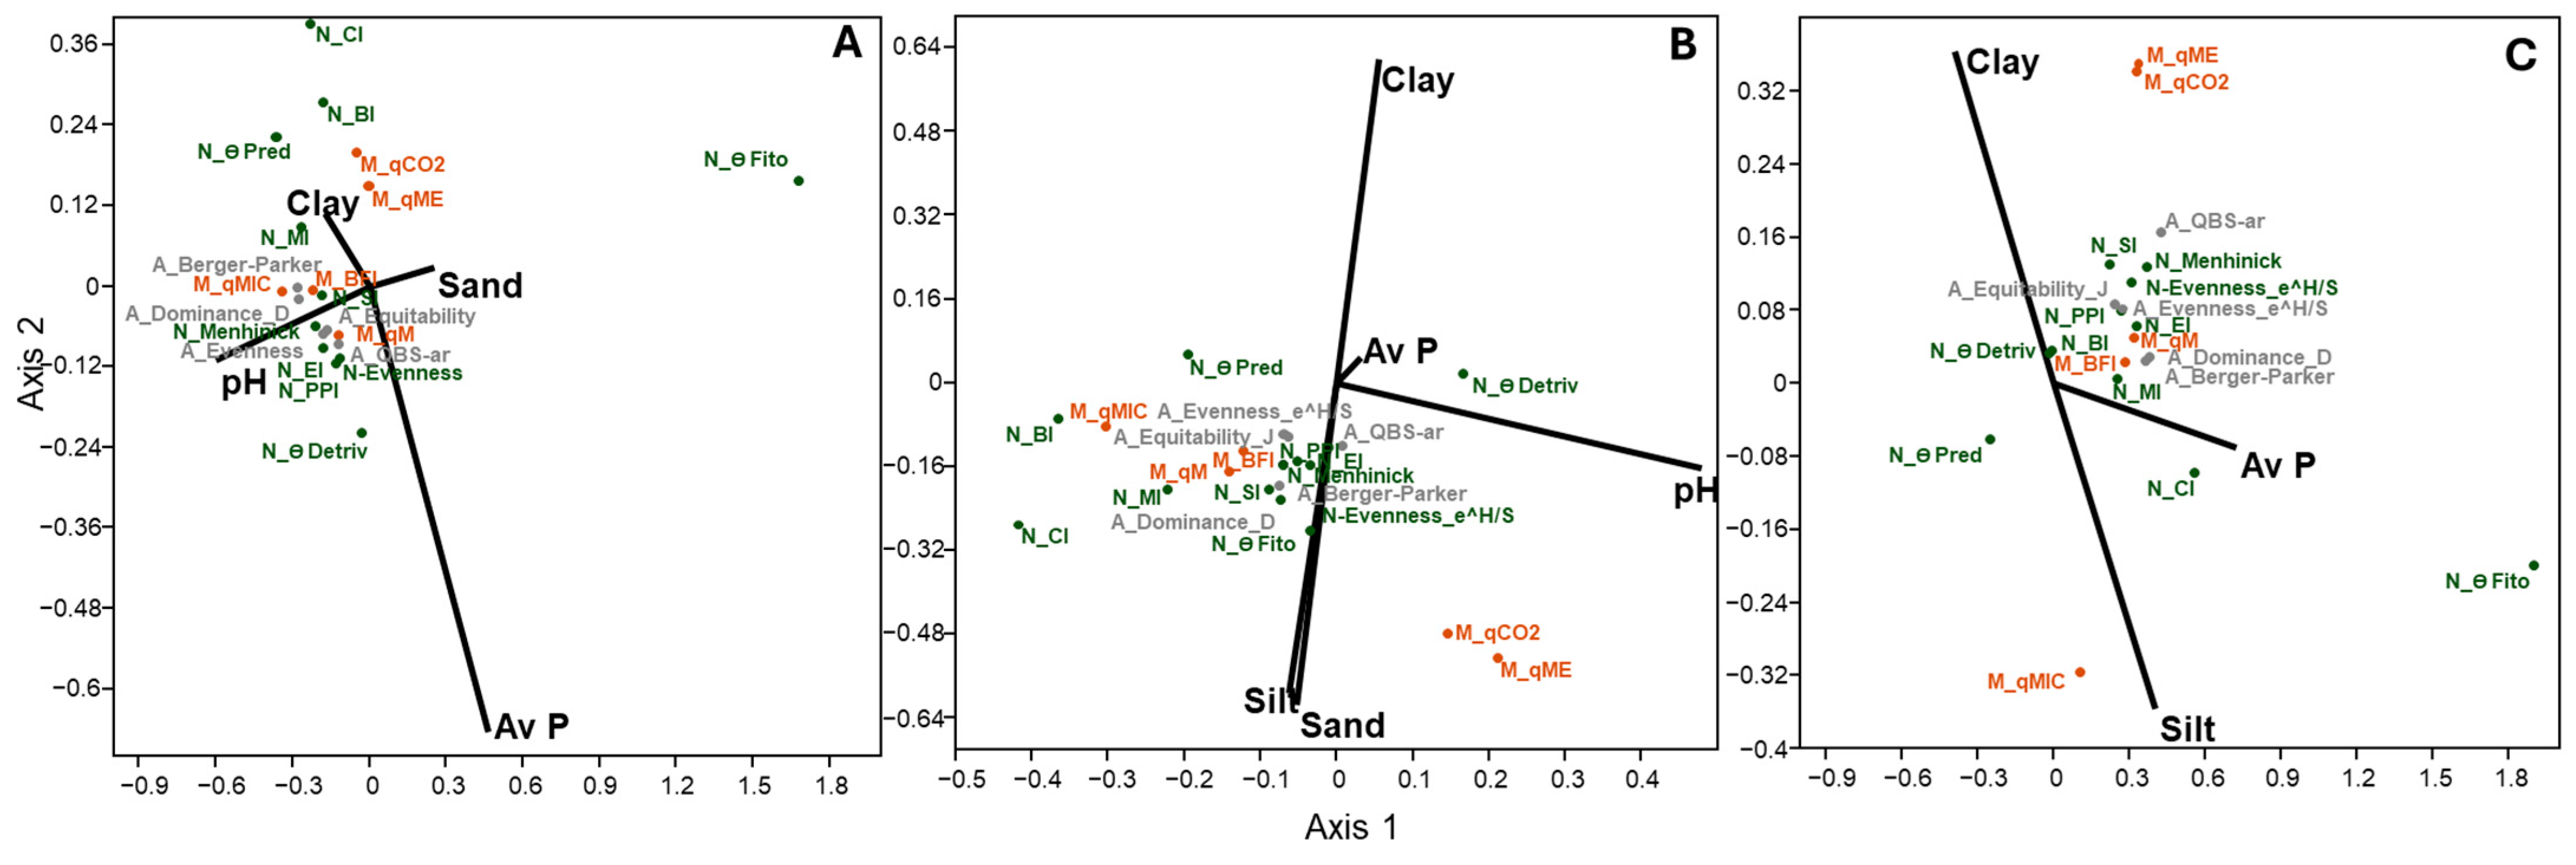
3.6. Relationship Between Environmental Variables and Community Structure of Nematodes and Microarthropods

The CCA, conducted between nematode and microarthropod taxa abundance and soil fertility variables (TOC, available P, soil respiration, and microbial biomass), evidenced that all the considered soil fertility parameters significantly influenced both communities. In SA management, axis 1 was dominated by basal respiration (−0.83), available P (0.77), and TOC (−0.62); in AB, axis 2 was dominated by microbial biomass (0.43) and TOC (0.28); in CR, axis 1 was dominated by available P (−0.54) and microbial biomass (0.28). TOC, basal respiration, and microbial biomass were positively related to each other in all managements, while the available P always showed the opposite trend. In general, the dominant nematode families such as Rhabditidae and Dorylaimidae and the microarthropod taxa Collembola and Coleoptera were moderately affected by the explored parameter (Figure 6). Regarding nematodes, significant community properties were as follows: (1) The plant-parasitic nematodes were related to the available P. Specifically, the families Longidoridae, Hoplolaimidae, and Paratylenchidae were positively influenced by the available P in both SA and CR, while in the family Pratylenchidae the dominant driver was the available P in AB. (2) The bacterial and fungal feeder nematodes and their predators were related to TOC and microbial biomass. In particular, the families Panagroilamidae and Aphelenchoidae were related to TOC in SA, the families Aphelenchidae and Mononchidae were positively influenced by TOC, and microbial biomass in AB and Aphelenchidae was positively driven by microbial biomass. Concerning microarthropods, significant community variables were as follows: (1) for the taxa of Pseudoscorpiones, Symphyla, Diplura, Isopoda, and Chilopoda the dominant driver was available P in all managements; (2) the taxa of Diptera and Tysanoptera were positively influenced by TOC and basal respiration in SA; (3) the taxa Hymenoptera, Lepidoptera, and Hemiptera were related to microbial biomass in AB; and (4) the taxa Hemiptera was also positively related to microbial biomass in CR.
The biplot of CCA between soil biological indicators (for microorganisms, nematodes, and microarthropods) and soil physicochemical parameters (texture, pH, available P, and TOC) showed that the biodiversity indices for nematodes and microarthropods were scarcely influenced by the established environmental gradient (Figure 7). In SA, axis 1 was driven by pH (−0.60) and available P (0.46). The food web indicators for nematodes such as BI and CI were positively related to clay. The diversity-weighted abundance index (θ) showed that θ predators and θ plant-parasitic nematodes were positively affected by clay and sand, respectively. Moreover, microbial indicators such as qCO2 and qME were affected by soil texture. In AB, axis 2 was driven by soil texture (sand −0.61, silt −0.59, and clay 0.62). The microbial indicators qCO2 and qME, which plotted furthest from the origin and so varied the most within this environmental gradient, were related to silt and sand. To a lesser extent, the food web nematode indicators CI and θ plant-parasitic were positively affected by the same parameters. In CR, the axis 1 was dominated by available P (0.72) and to lesser extent by silt (0.40) and clay (−0.39). Only θ plant-parasitic nematodes were relevant and positively related to available P. However, to a lesser extent the microbial indicators qCO2 and qME and the arthropod indicator QBS-ar were positively affected by the same parameter.

4. Discussion

4.1. Effect of Set-Aside and Abandonment Management Systems on Soil Fertility

As expected, the results showed that the set-aside management systems significantly improved the TOC values, according to most of the literature [38]. Nevertheless, it is well known that agricultural soils contain 25–75% less SOC than soils in undisturbed or natural ecosystems, and set-aside should be carefully evaluated as a C sequestration option [39,40]. Accordingly, in our study AB soils presented higher TOC values compared to SA (+10.5%) and CR (+24.4%), thus enhancing basal respiration values and confirming how natural soils are more biologically active than soils agronomically managed, especially compared to conventional systems. This statement is confirmed by the overall biological fertility status of the soils, expressed by the BFI composite index, which is enhanced by SA as well as AB practices, in accordance with previous studies. In particular, whereas the fertility status of SA and AB soils were classified as “intermediate”, CR soil resulted being closer to the “pre-stressed” soil category, typical of disturbed soils or less sustainable management practices [41,42]. The integrated effects of season and year on biological activity indicated by qM, qMIC, and BFI may be likely due to the different temperatures occurred before sampling. In fact, the moderate temperature occurred during the summer period (June–September) might have strongly promoted the microbial activity compared to the winter temperature (January–April), as previously reported [43].
Soil pH tends to remain relatively stable over time in set-aside systems, primarily due to reduced human intervention and minimal application of chemical inputs. However, this stability may be influenced by factors such as parent material, weathering, and natural vegetation succession [10]. For example, authors showed that pH may decrease in semi-natural fields compared to set-aside and conventional systems, due to previous fertilization and liming practices [44].
P availability is more affected by season than by management. In fact, although CR soils showed lower P content than AB and SA soils, these differences were not statistically significant. On the other hand, the higher P availability observed in autumn is likely due to the warm summer period boosting microbial activity, thus increasing P availability, in accordance with previously reported studies [45]. Overall, soil management practices minimizing soil disturbance like SA can be used to improve phosphorus availability in the rhizosphere soil and increase the abundance of different phosphorus fractions [46].

4.2. Effects of Set-Aside and Abandonment on Soil Nematode and Microarthropod Community Structure

MDS analysis showed that SA modified the composition of nematode and microarthropod communities compared to CR, as previously reported by Landi et al. [6] and Mocali et al. [7]. At the same time, AB soil showed little difference compared to SA by mowing, indicating that soil naturalization is a very long process and that finding a good balance in the composition of nematode and microarthropod communities is not always achievable. It is known that the composition and diversity of nematode and microarthropod communities in SA and AB lands depend more on their age and use than on soil geographical, climatic, and site conditions [47]. Twelve years without agricultural management is probably a period too short to detect significant changes.
In this framework, CR showed a low abundance of individuals and low richness, especially for microarthropods, due to normal agricultural practices causing significant alteration of physicochemical properties [10]. However, all the trophic groups were well represented, balanced, and constant in the years due to the long-term adaptations. After twelve years of SA application and AB, the populations of nematodes and microarthropods increased, even though the richness showed few variations. These deductions are consistent with our data where, regardless of season and year, all the trophic groups were present though unbalanced. According to our data, bacterial feeder nematodes, especially the Rhabditidae family (r-strategist, enrichment-opportunistic nematodes), were the dominant trophic group, thanks to greater resources of organic matter. On the other hand, omnivores, characterized by k-strategy, a long-life cycle, and a low abundance were a sub-dominant trophic group, confirming what already reported by Cerevková [47] in permanent meadows and pastures. However, the SA showed that they increased more than in abandonment, indicating a quite stable habitat. This finding demonstrates that the SA with mowing in July improves not only bird biodiversity, but also the nematode community structure. According to Boag et al. [11] and Landi et al. [6], SA and AB showed a weak effect on plant-parasitic nematodes. Several authors [48,49] have reported a decrease in the density of plant-parasitic nematodes with an increase of organic matter content. However, in this study there was no clear evidence of this relationship since, for all selected management systems, the most abundant families (Pratylenchidae, Hoplolaimidae, and Paratylenchidae) showed no relevant difference. As reported by several authors, mites and collembola, the numerically dominant taxa, were the most affected by more natural management systems such as set-aside and abandonment [7,50]. Specifically, mites increased in both systems, whereas collembola increased only in abandonment. Although richness in SA and AB remained similar to those of CR, several taxa increased their abundance. In accordance with Mocali et al. [7], the eu-edaphic group, mainly Chilopoda, Diplopoda, and Symphyla, and hemi-edaphic group, mainly Coleoptera, were favored by SA and AB, while the epi-edaphic groups, especially Hemiptera, were favored by the conditions occurring in CR.
Among the indicators selected for this work, biodiversity indices appear to have low potential as indicators of healthy/unhealthy systems; some significant differences were found, but with negligible differences for both nematode and microarthropod communities. Among ecological indicators, the best performing indices were SI and Detritivores θ index for nematodes, while QBS-ar for microarthropods. In general, all the nematode ecological indicators confirm that shifts in nematode community composition vary more as a result of the previous agricultural management than of twelve years of SA and AB as already reported by several authors [6,51]. The MI and EI values indicated that soil was disturbed by anthropic activities with an exponential growth of colonizing species. Moreover, the CI and EI food web indicators evidenced the dominance of bacterial decomposers within the free-living soil nematode community. The SI value signaled a more stable structure of the soil nematode community in SA, indicating that the mowing operation improved the good soil quality more than AB and CR. This achievement is in accordance with Landi et al. [6], where SA was evaluated in middle-term. Moreover, the low temporal and seasonal trend for omnivores and predators characterized by high c-p values made its evaluation irrelevant. According to Freckman and Ettema [9], in SA and AB the θ diversity-weighted abundance expressed as biomass of detritivores nematode evidenced a dominance of bacterivore and fungivore classes. Moreover, the θ indices showed that free-living nematodes involved in nutrient mineralization and plant-parasitic nematodes were more efficiently regulated by predation in SA; in fact, the predator/prey ratio was approximately 1:1. In accordance with what previously reported for natural areas and set-aside land use, in our investigated management systems, the measured soil threshold was approximately 100 EMI, which is the generally accepted good soil quality standard [12,13,36,50,52,53]. On the other hand, the degrading rotation based on wheat produced QBS-ar values lower than 100 EMI, showing a disturbance in soil microarthropod community.
In most cases, in accordance with other authors, the nematode community indices exhibited a significant seasonal shift, with great stability, though, between the two years [6,51]. Conversely, for microarthropod community indicators, the seasonal and year shifts were almost absent, except for QBS-ar which demonstrated its strong sensitivity to seasonal and annual climatic changes.

4.3. Soil Factors and Microbial Parameters Influencing Soil Nematode and Microarthropod Structure

In general, as widely reported in the literature, nematode and microarthropod community compositions and abundance are influenced by organic matter and microbial activity [54,55,56]. Indeed, it is well known that nematodes are involved in microbial regulation by grazing, and the CCA results should be evaluated in this perspective. Organic matter favored bacterivores, especially those with short life cycles such as the Panagroilamidae family, fungal feeders, and their predators. These results were more evident in SA and AB. Indeed, the involved taxa (Panagroilamidae, Aphelenchidae, Aphelenchoides, and Mononchidae) were further from the origin in these systems than in CR. On the other hand, according to several authors, plant-parasitic nematodes were disadvantaged by the high amount of organic matter as plants become less susceptible to nematode attack [48,57,58]. The families Hoplolaimidae, Paratylenchidae, and Longidoridae showed this relationship in the SA and CR, while the family Pratylenchidae was inversely correlated to TOC and microbial biomass in the AB. Among microarthropods, the eu-edaphic taxa of Pseudoscorpiones, Symphyla, Diplura, and Chilopoda as well as the hemi-edaphic Isopoda were less influenced by organic matter and microbial activity than other taxa, while they were more favored by chemical properties such as available P. Adejuyigbe and Kodaolu [59] suggested that microarthropod population was correlated with soil organic carbon, available P and exchangeable cations, and nutrient uptake depending on their taxa. Instead, the taxa of Diptera, Tysanoptera, Lepidoptera, Hymenoptera, and Hemiptera, all hemi- and epi-edaphic groups, were more related to the mineralization of organic matter. This was particularly evident in the more naturalized environment.
Weak correlations were found between nematode and microarthropod community indices and environmental parameters. The most relevant nematode indicators (CI, BI, θ plant parasite, θ predator) were mainly related to soil texture in SA and AB. Conversely, CR was driven by available P, and the indicators θ plant-parasite for nematodes and QBS-ar for microarthropods were the only significant ones. However, it is also worth noting that indicators involved in organic matter mineralization such as CI, BI, θ predator for nematodes, and QBS-ar for microarthropods were always located in the biplots close to the microbial activity indices. On the other hand, θ plant-parasitic was always in opposition to them. Microbial activity represents, probably, the main driver for nematode and microarthropod populations and consequently for their indicator as demonstrated by Barbato et al. [60] in other environments.
In a cost–benefit framework, the set-aside management systems represent an inexpensive agricultural practice increasing TOC content and soil fertility as well as soil biodiversity. This is particularly evident compared to the crop rotation management system. Moreover, in both nematodes and microarthropods, the set-aside improves the abundance of k-strategy species more than “field abandonment” allowing a better regulation of ecosystem services.

5. Conclusions

By evaluating three different managements, set-aside, abandonment, and conventional crop rotation, we were able to assess their effects on soil biological fertility and the diversity of the soil nematode and microarthropod community structure. These results evidenced that SA is an intermediate step of a transition from conventional agricultural to naturalized grassland and confirmed its potential benefits on soil biological diversity and functions. In twelve years, the set-aside management system exhibited the most effective performance: it increased the total organic carbon content (+8%), thus promoting both soil microbial activity as well as the nematode and microarthropod abundance (+59 and 97%, respectively). Moreover, the SA was able to efficiently regulate the ecosystem services of carbon mineralization and plant-parasitic nematodes (SI + 20%), thus favoring the eu-edaphic microarthropods (QBS-ar + 45.5%). Overall, SA and AB management practices contribute to improving soil carbon storage, microbial activity, and soil biodiversity. However, a period of twelve years appears too short to fully assess the impact of agricultural practices on the soil environment, as significant differences between AB and SA remain limited. While set-aside management enhances soil biological fertility and structure more effectively than crop rotation, the soil ecosystem’s recovery is a slow process that depends on long-term stability and reduced human intervention.
Nematode and microarthropod communities showed some shifts in composition and abundance, but their full adaptation to a more natural state was not yet evident. The persistence of opportunistic and disturbance-associated species suggests that the legacy of past agricultural management still influences soil biological processes. Moreover, microbial activity, rather than management type alone, emerged as the primary driver of soil community dynamics.
Overall, while set-aside management represents a beneficial strategy for improving soil quality and biodiversity, its long-term effectiveness in restoring soil ecosystems to a near-natural state requires extended periods of reduced disturbance, emphasizing the need for continued monitoring and conservation efforts.

Supplementary Materials

The following supporting information can be downloaded at: https://www.mdpi.com/article/10.3390/d17040240/s1, Table S1: Effects of different managements on abundance of nematode taxa (number of nematodes/100 mL soil). Samples were collected from SA, set-aside; AB, abandonment; CR, crop rotation in Vicarello (PI) during 2013 and 2014. Standard errors are reported. Significant differences are highlighted in bold; Table S2: SIMPER analysis (SA = Set-aside; CR = Crop rotation) on the abundance of nematode taxa (number of nematodes/mL of soil) in Vicarello site in 2013–2014; Table S3: SIMPER analysis on the abundance of nematode taxa (number of nematodes/mL of soil) for season in Vicarello site in 2013–2014; Table S4: Effects of different managements on abundance of microarthropod taxa (number of individuals/1 dm3 soil). Samples were collected from SA, set-aside; AB, abandonment; CR, crop rotation in Vicarello (PI) during 2013 and 2014. Standard errors are reported. Significant differences are highlighted in bold; Table S5: SIMPER analysis (SA = Set-aside; CR = Crop rotation) on the abundance of microarthropod taxa (number of nematodes/dm3 of soil) in Vicarello site in 2013–2014; Table S6: SIMPER analysis on the abundance of microarthropod taxa (number of nematodes/dm3 of soil) for season in Vicarello site in 2013–2014; Table S7: SIMPER analysis on the abundance of microarthropod taxa (number of nematodes/dm3 of soil) for year in Vicarello site in 2013–2014.

Author Contributions

Conceptualization, S.M. and S.L.; methodology, S.M. and S.L.; formal analysis, S.L.; investigation, F.B., G.d., R.P., S.D.D. and A.F.; data curation, S.L. and S.M.; writing—original draft preparation, S.L.; writing—review and editing, F.B., R.P., G.d., S.D.D., A.F. and S.M.; supervision, S.M.; funding acquisition, S.M. All authors have read and agreed to the published version of the manuscript.

Funding

This research was conducted as part of the MO.NA.CO. project (National Network for Monitoring the Environmental Effectiveness of Cross Compliance and the Competitiveness Differential Affecting Agricultural Enterprises), funded on 18/02/2011 by the Italian Ministry of Agriculture, Food Sovereignty, and Forests (MASAF), under grant number ‘COSVIR II Prot.0004010’, within Action 1.2.2, ‘Interregional Workshops for Development’, of the Operational Programme ‘National Rural Network 2007–2013’.

Institutional Review Board Statement

No ethical approval was required for the sample types collected in this study.

Data Availability Statement

The data presented in this study are available upon request from the corresponding author.

Acknowledgments

We wish to thank Stefania Simoncini for field logistics and support.

Conflicts of Interest

The authors declare no conflicts of interest.

References

  1. Romero-Díaz, A.; Pérez-Morales, A.; Marín-Sanleandro, P. Prevalence, causes, and consequences of agricultural land abandonment: A case study in the Region of Murcia, Spain. Catena 2024, 241, 108071. [Google Scholar] [CrossRef]
  2. Lieskovský, J.; Kenderessy, P.; Petlušová, V.; Peter Petlǔs, P. Effect of grass cover and abandonment on soil surface changes and soil properties in traditional vineyards in Vrable viticultural region in southwestern Slovakia. Catena 2024, 235, 107702. [Google Scholar] [CrossRef]
  3. Van Buskirk, J.; Willi, Y. Enhancement of farmland biodiversity within set-aside land. Conserv. Biol. 2004, 18, 987–994. [Google Scholar]
  4. Masciandaro, G.; Ceccanti, B.; Gallardo-Lancho, J.F. Organic matter properties in cultivated versus set-aside arable soils. Agric. Ecosyst. Environ. 1998, 67, 267–274. [Google Scholar]
  5. Smith, P. Carbon sequestration in croplands: The potential in Europe and the global context. Europ. J. Agron. 2004, 20, 229–236. [Google Scholar]
  6. Landi, S.; Papini, R.; d’Errico, G.; Brandi, G.; Rocchini, A.; Roversi, P.F.; Bazzoffi, P.; Mocali, M. Effect of different set-aside management systems on soil nematode community and soil fertility in North, Central and South Italy Agriculture, Ecosystems and Environment. Agric. Ecosyst. Environ. 2018, 261, 251–260. [Google Scholar] [CrossRef]
  7. Mocali, S.; Landi, S.; Fabiani, A.; Piccolo, R.; Agnelli, A.; d’Errico, G.; Mazza, G.; Fedrizzi, M.; Sperandio, G.; Guerrieri, M.; et al. Environmental effectiveness of GAEC cross-compliance Standard 4.2 on biodiversity in set-aside management and economic evaluation of the competitiveness gap for farmers, part I. Ital. J. Agron. 2015, 10 (Suppl. S1), 711. [Google Scholar] [CrossRef]
  8. Hamer, U.; Makeschin, F.; Stadler, J.; Klotz, S. Soil organic matter and microbial community structure in set-aside and intensively managed arable soils in NE-Saxony, Germany. Appl. Soil Ecol. 2008, 40, 465–475. [Google Scholar]
  9. Freckman, D.W.; Ettema, C.H. Assessing nematode communities in agroecosystems of varying human intervention. Agric. Ecosyst. Environ. 1993, 45, 239–261. [Google Scholar] [CrossRef]
  10. Landi, S.; d’Errico, G.; Manachini, B. Nematode Communities in Soils of the Same Volcanic Origin across a Gradient of Naturalization: From Intensive Agriculture to Forest. Sustainability 2024, 16, 6307. [Google Scholar] [CrossRef]
  11. Boag, B.; Hebden, P.M.; Neilson, R.; Rodger, S.J. Observations on the effect of different management regimes of set-aside land on nematode community structure. Appl. Soil Ecol. 1998, 9, 339–343. [Google Scholar] [CrossRef]
  12. Biaggini, M.; Bazzoffi, P.; Gentile, R.; Corti, C. Effectiveness of the GAEC cross-compliance Standard Rational management of set-aside, Grass strips to control soil erosion and Vegetation buffers along watercourses on surface animal diversity and biological quality of soil. Ital. J. Agron. 2011, 6 (Suppl. S1), e14. [Google Scholar] [CrossRef]
  13. Raglione, M.; Lorenzoni, P.; Bonifazi, A.; Nannelli, R.; Gagnarli, E.; Bazzoffi, P.; Gentile, R. Effectiveness of the GAEC cross-compliance Standard Rational management of set-aside (weed control through mowing) in assuring a minimum level of habitats maintenance. Ital. J. Agron. 2011, 6 (Suppl. S1), e13. [Google Scholar] [CrossRef]
  14. Maharning, A.R.; Mills, A.A.S.; Adl, S.M. Soil community changes during secondary succession to naturalized grasslands. Appl. Soil Ecol. 2009, 41, 137–147. [Google Scholar] [CrossRef]
  15. Pastorelli, R.; Landi, S.; Trabelsi, D.; Piccolo, R.; Mengoni, A.; Bazzicalupo, M.; Pagliai, M. Effects of soil management on structure and activity of denitrifying bacterial communities. Appl. Soil Ecol. 2011, 49, 46–58. [Google Scholar] [CrossRef]
  16. Papini, R.; Valboa, G.; Favilli, F.; L’Abate, G. Influence of land use on organic carbon pool and chemical properties of Vertic Cambisols in central and southern Italy. Agric. Ecosyst. Environ. 2011, 140, 68–79. [Google Scholar] [CrossRef]
  17. Morriën, E.; Hannula, S.E.; Snoek, L.B.; Helmsing, N.R.; Zweers, H.; De Hollander, M.; Soto, R.L.; Bouffaud, M.L.; Buée, M.; Dimmers, W.; et al. Soil networks become more connected and take up more carbon as nature restoration progresses. Nat. Commun. 2017, 8, 14349. [Google Scholar] [CrossRef]
  18. Wu, L.; Ren, C.; Jiang, H.; Zhang, W.; Chen, N.; Zhao, X.; Wei, G. Land abandonment transforms soil microbiome stability and functional profiles in apple orchards of the Chinese Losses Plateau. Sci. Total Environ. 2024, 906, 167556. [Google Scholar] [CrossRef]
  19. You, Y.; Li, W.; Chen, Y.; Zhang, Q.; Zhang, K. Soil carbon and nitrogen accumulation during long-term natural vegetation restoration following agricultural abandonment in Qingling Mountains. Ecol. Eng. 2024, 201, 107212. [Google Scholar] [CrossRef]
  20. Olsen, S.R.; Sommers, L.E. Phosphorus. In Methods of Soil Analysis. Part 2: Chemical and Microbiological Properties, 2nd ed.; Buxton, R.H., Miller Keeney, D.R., Eds.; American Society of Agronomy: Madison, WI, USA, 1982; pp. 403–430. [Google Scholar]
  21. Yeomans, J.C.; Bremner, J.M. A rapid and precise method for routine determination of organic carbon in soil. Commun. Soil Sci. Plant Anal. 1988, 19, 1467–1476. [Google Scholar] [CrossRef]
  22. Isermeyer, H. Eine einfache Methode zur Bestimmung der Bodenatmung und der Karbonate im Boden. Z. Pflanzenernaehr. Bodenkd. 1952, 56, 26–38. [Google Scholar]
  23. Vance, E.D.; Brookes, P.C.; Jenkinson, D.S. An extraction method for measuring microbial biomass C. Soil Biol. Biochem. 1987, 19, 703–707. [Google Scholar]
  24. Mocali, S.; Paffetti, D.; Emiliani, G.; Benedetti, A.; Fani, R. Diversity of heterotrophic aerobic cultivable microbial communities of soils treated with fumigants and dynamics of metabolic, microbial, and mineralization quotients. Biol. Fertil. Soils 2008, 44, 557–569. [Google Scholar] [CrossRef]
  25. Dilly, O.; Winter, K.; Lang, A.; Munch, J.C. Energetic eco-physiology of the soil microbiota in two landscapes of southern and northern Germany. J. Plant Nutr. Soil Sci. 2001, 164, 407–413. [Google Scholar]
  26. Renzi, G.; Canfora, L.; Salvati, L.; Benedetti, A. Validation of the soil Biological Fertility Index (BFI) using a multidimensional statistical approach: A country-scale exercise. Catena 2017, 149, 294–299. [Google Scholar]
  27. Mai, W.F.; Lyon, H.H. Pictorial Key to Genera of Plant Parasitic Nematodes; New York State College of Agriculture, Cornell University: Ithaca, NY, USA, 1962. [Google Scholar]
  28. Bongers, T. De Nematoden van Nederland; K.N.N.V.: Utrecht, The Nederlands, 1988. [Google Scholar]
  29. Marinari-Palmisano, A.; Vinciguerra, M. Classificazione dei Nematodi. In Nematologia Agraria Generale e Applicate; Ambrogioni, L., d’Errico, F.P., Greco, N.A., Marinari-Palmisano, A., Roversi, P.F., Eds.; Società Italiana di Nematologia: Bari, Italia, 2014; pp. 23–42. [Google Scholar]
  30. Yeates, G.W.; Bongers, T.; De Goede, R.; Freckman, D.; Georgieva, S. Feeding habits in soil nematode families and genera in outline for soil ecologists. J. Nematol. 1993, 25, 315. [Google Scholar]
  31. Okada, H.; Harada, H.; Kadota, I. Fungal-feeding habits of six nematode isolates in the genus Filenchus. Soil Biol. Biochem. 2005, 37, 1113–1120. [Google Scholar]
  32. Bongers, T. The maturity index: An ecological measure of environmental disturbance based on nematode species composition. Oecologia 1990, 83, 14–19. [Google Scholar] [CrossRef]
  33. Ferris, H.; Bongers, T.; De Goede, R. A framework for soil food web diagnostics: Extension of the nematode faunal analysis concept. Appl. Soil Ecol. 2001, 18, 13–29. [Google Scholar] [CrossRef]
  34. Ferris, H. Form and function: Metabolic footprints of nematodes in the soil food web. Eur. J. Soil Biol. 2010, 46, 97–104. [Google Scholar]
  35. Ferris, H.; Tuomisto, H. Unearthing the role of biological diversity in soil health. Soil Biol. Biochem. 2015, 85, 101–109. [Google Scholar] [CrossRef]
  36. Parisi, V.; Menta, C.; Gardi, C.; Jacomini, C.; Mozzanica, E. Microarthropod communities as a tool to assess soil quality and biodiversity: A new approach in Italy. Agr. Ecosys. Environ. 2005, 105, 323–333. [Google Scholar] [CrossRef]
  37. Hammer, Ø.; Harper, D.; Ryan, P. PAST—Palaeontological statistics, ver. 1. 89. Palaeontol. Electron. 2001, 4, 1–9. [Google Scholar]
  38. Lal, R. Soil carbon sequestration impacts on global climate change and food security. Science 2004, 304, 1623–1627. [Google Scholar] [CrossRef]
  39. Petersson, T.; Antoniella, G.; Perugini, L.; Chiriacò, M.V.; Chiti, T. Carbon farming practices for European cropland: A review on the effect on soil organic carbon. Soil Tillage Res. 2025, 247, 106353. [Google Scholar] [CrossRef]
  40. Nieder, R.; Benbi, D.K.; Isermann, K. Soil Organic Matter Dynamics. In Handbook of Processes and Modeling in the Soil-Plant System; CRC Press: Boca Raton, FL, USA, 2024; pp. 345–408. [Google Scholar]
  41. Francaviglia, R.; Renzi, G.; Ledda, L.; Benedetti, A. Organic carbon pools and soil biological fertility are affected by land use intensity in Mediterranean ecosystems of Sardinia, Italy. Sci. Total Environ. 2017, 599, 789–796. [Google Scholar] [CrossRef]
  42. Yaghoubi Khanghahi, M.; Cucci, G.; Lacolla, G.; Lanzellotti, L.; Crecchio, C. Soil fertility and bacterial community composition in a semiarid Mediterranean agricultural soil under long-term tillage management. Soil Use Manag. 2020, 36, 604–615. [Google Scholar] [CrossRef]
  43. Pietikäinen, J.; Pettersson, M.; Bååth, E. Comparison of temperature effects on soil respiration and bacterial and fungal growth rates. FEMS Microbiol. Ecol. 2005, 52, 49–58. [Google Scholar] [CrossRef]
  44. Tóth, Z.; Hornung, E.; Báldi, A. Effects of set-aside management on certain elements of soil biota and early stage organic matter decomposition in a High Nature Value Area, Hungary. Nat. Conserv. 2018, 29, 1–26. [Google Scholar] [CrossRef]
  45. Bhat, N.A.; Riar, A.; Ramesh, A.; Iqbal, S.; Sharma, M.P.; Sharma, S.K.; Bhullar, G.S. Soil biological activity contributing to phosphorus availability in vertisols under long-term organic and conventional agricultural management. Front. Plant Sci. 2017, 8, 1523. [Google Scholar] [CrossRef] [PubMed]
  46. Xomphoutheb, T.; Jiao, S.; Guo, X.; Mabagala, F.S.; Sui, B.; Wang, H.; Zhao, L.; Zhao, X. The effect of tillage systems on phosphorus distribution and forms in rhizosphere and non-rhizosphere soil under maize (Zea mays L.) in Northeast China. Sci. Rep. 2020, 10, 6574. [Google Scholar]
  47. Cerevková, A. Diversity and Distribution of Nematode Communities in Grassland in Relation to Its Establishment Age and Utilization. In Nematodes Morphology, Functions and Management Strategies; Nova Science Publishers: Hauppauge, NY, USA, 2011; Volume 9, pp. 1–16. [Google Scholar]
  48. Barker, K.R.; Koenning, S.R. Developing sustainable systems for nematode management. Annu. Rev. Phytopathol. 1998, 36, 165–205. [Google Scholar]
  49. Bird, G. Nematodes and Soil Ecology. In Michigan Field Crop Ecology; E-2704; Michigan State University Extension: East Lansing, MI, USA, 2000; pp. 84–94. [Google Scholar]
  50. Menta, C.; Leoni, A.; Bardini, M.; Gardi, C.; Gatti, F. Nematode and microarthropod communities: Comparative use of soil quality bioindicators in covered dump and natural soils. Environ. Bioind. 2008, 3, 35–46. [Google Scholar]
  51. Ugarte, C.M.; Zaborski, E.R.; Wander, M.M. Nematode indicators as integrative measures of soil condition in organic cropping systems. Soil Biol. Biochem. 2013, 64, 103–113. [Google Scholar]
  52. Ferrazzi, P.; Berger, F.; Verti, F. Biomonitoraggio della Qualità dei Suoli nei Comuni di Agenda 21 Laghi. In Proceedings of the 4° Forum di Agenda 21 Laghi, Torino, Italy, 16 June 2007. [Google Scholar]
  53. Menta, C.; Conti, F.D.; Pinto, S.P.; Bodini, A. Soil Biological Quality index (QBS-ar): 15 years of application at global scale. Ecol. Indic. 2018, 85, 773–780. [Google Scholar]
  54. Del Duca, S.; Mocali, S.; Vitali, F.; Fabiani, A.; Cucu, M.A.; Valboa, G.; d’Errico, G.; Binazzi, F.; Storchi, P.; Landi, S.; et al. Impacts of Soil Management and Sustainable Plant Protection Strategies on Soil Biodiversity in a Sangiovese Vineyard. Land 2024, 13, 599. [Google Scholar] [CrossRef]
  55. Landi, S.; Pennacchio, F.; Papini, R.; d’Errico, G.; Torrini, G.; Strangi, A.; Barabaschi, D.; Roversi, P.F. Evaluation of sheep grazing effects on nematode community, insect infestation and soil fertility in sweet chestnut orchards: A case of study. REDIA 2016, 99, 117–126. [Google Scholar]
  56. Lazarovits, G.; Tenuta, M.; Conn, K.L. Organic amendments as a disease control strategy for soilborne diseases of high-value agricultural crops. Australas. Plant Pathol. 2001, 30, 111–117. [Google Scholar]
  57. Freitas, J.R.B.; Moitinho, M.R.; De Bortoli Teixeira, D.; da Silva Bicalho, E.; da Silva, J.F.; Siqueira, D.S.; Barbosa, B.F.F.; Soares, P.L.M.; Pereira, G.T. Soil factors influencing nematode spatial variability in soybean. Agron. J. 2017, 109, 610–619. [Google Scholar]
  58. Landi, S.; Valboa, G.; Vignozzi, V.; d’Errico, G.; Pellegrini, S.; Simoncini, S.; Torrini, G.; Roversi, P.F.; Priori, S. Response of nematode community structure to different restoration practices in two vineyard soils in Tuscany (Italy). Biol. Agric. Hortic. 2023, 39, 149–169. [Google Scholar] [CrossRef]
  59. Adejuyigbe, C.O.; Kodaolu, E.O. Faunal population as parameter for soil fertility assessment: A case of soil microarthropod study in South-Western Nigeria. Arch. Agron. Soil Sci. 2012, 58 (Suppl. S1), 116–121. [Google Scholar] [CrossRef]
  60. Barbato, D.; Perini, C.; Mocali, S.; Bacaro, G.; Tordoni, E.; Maccherini, S.; Marchi, M.; Cantiani, P.; De Meo, I.; Bianchetto, E.; et al. Teamwork makes the dream work: Disentangling cross-taxon congruence across soil biota in black pine plantations. Sci. Total Environ. 2019, 656, 659–669. [Google Scholar] [CrossRef] [PubMed]
Figure 1. Mean air temperature and rainfall in Vicarello of Volterra in 2013 and 2014.
Diversity 17 00240 g001
Figure 2. Soil chemical properties of the topsoil (0–20 cm) in Vicarello sites. Samples were collected from set-aside (SA), no mowing/abandonment (AB), and conventional rotation (CR) managements during 2013 and 2014. Mean values with standard errors are reported. Different letters for the same parameters indicate significantly different values (Student-Newman_Keuls test, p < 0.05).
Diversity 17 00240 g002
Figure 3. Barplots of the average values of soil basal respiration and microbial biomass, stratified by management (SA: set-aside, AB: no mowing/abandonment, CR: conventional rotation), season, or year. Mean values with standard errors are reported. Significant differences between groups are reported with letters.
Diversity 17 00240 g003
Figure 4. MDS analysis based on Bray–Curtis dissimilarity index of nematode community abundance from soils sampled in 2013 and 2014. Samples were stratified by: (A), management; (B), season; (C), year. Symbols represent: SA, black diamond; AB, light grey oval; CR, dark grey cross; Spring, light grey cross; Fall, black rectangle; 2013, grey triangle; 2014, black square. Stress values (S) and convex hulls are reported.
Diversity 17 00240 g004
Figure 5. MDS analysis based on Bray–Curtis dissimilarity index of arthropod community abundance from soil sampled in 2013 and 2014. Samples were stratified by: (A), management; (B), season; (C), year. Symbols represent: SA, black diamond; AB, light grey oval; CR, dark grey cross; Spring, light grey cross; Fall, black rectangle; 2013, grey triangle; 2014, black square. Stress values (S) and convex hulls are reported.
Diversity 17 00240 g005
Figure 6. Scatter plots of CCA ordination showing relationships between soil properties and nematode and microarthropod taxa abundance. The following letters represent: (A), set-aside, percentage of variance was 61.96% for axis 1 (p < 0.05); no significant for axis 2; (B), abandonment; percentage of variance was 41.20% (p < 0.007) for axis 2; no significant for axis 1; (C), crop rotation, percentage of variance was 64.07% (p < 0.05%) for axis 1; no significant for axis 2.
Diversity 17 00240 g006
Figure 7. Scatter plots of CCA ordination showing relationships between soil properties and biological indicators. The following letters represent: (A), set-aside, percentage of variance explained were 87.89% for axis 1 (p < 0.03) and 11.51% for axis 2 (p < 0.009); (B), abandonment, percentage of variance was 16.10% (p < 0.05) for axis 2; no significant axis 1; (C), crop rotation, percentage of variance was 96.22% (p < 0.05%) for axis 1; no significant axis 2.
Diversity 17 00240 g007
Table 1. Summary of the effects (ANOVA p-values) of managements (M), season (S), and year (Y) and their interactions with the soil chemical properties. Significant p-values are evidenced in bold.
Taxap-Value
Main EffectInteraction
MSYM + SM + YS + YM + S + Y
Soil pH0.050.070.020.060.720.980.01
TOC (g kg−1)0.000010.00030.850.390.0020.00030.0008
Olsen P (mg kg−1)0.120.000010.070.430.0050.000010.67
Abbreviations: TOC, Total Organic Carbon; Olsen P, available P determined by the Olsen method.
Table 2. Summary of the effects (ANOVA p-values) of managements (M), season (S), and year (Y) on soil basal respiration and microbial biomass. Significant p-values are evidenced in bold.
Taxap-Value
Main EffectInteraction
MSYM + SM + YS + YM + S + Y
BR (mg C-CO2 kg−1 d−1)0.000010.570.110.470.440.0020.15
MBC (mg C kg−1)0.220.280.710.510.210.0040.35
Abbreviations: BR, Basal Respiration; MBC, Microbial Biomass Carbon.
Table 3. Soil biological indicators for microorganisms, nematodes, and microarthropods from set-aside (SA), no mowing/abandonment (AB) and conventional rotation (CR) managements during 2013 and 2014. Mean values with standard errors are reported (±). Letters indicate significant differences between groups (ANOVA p < 0.05). Summary of the significance of the effects of managements (M), season (S), and year (Y) on soil biological indicators and their interactions are reported. Significant p-values are evidenced in bold.
TaxaManagementSeasonYearp-Value
SAABCRSpringAutumn20132014MSYM + SM + YS + YM + S + Y
Microorganisms
qCO24.5 ± 0.766.3 ± 1.824.4 ± 1.174.8 ± 0.875.3 ± 1.265.9 ± 1.274.3 ± 0.810.530.750.300.140.390.230.57
qM3.5 ± 0.08 a3.6 ± 0.12 a 2.5 ± 0.15 b 2.9 ± 0.16 b3.4 ± 0.13 a3.2 ± 0.123.1 ± 0.180.000010.00010.670.430.100.040.22
qMIC0.6 ± 0.050.5 ± 0.070.5 ± 0.090.5 ± 0.070.5 ± 0.050.5 ± 0.060.5 ± 0.050.690.590.640.590.370.020.79
qME3.5 ± 0.554.4 ± 1.393.6 ± 0.973.6 ± 0.714.1 ± 3.964.4 ± 0.953.3 ± 0.670.770.630.320.160.350.140.53
BFI15.6 ± 0.26 b17.1 ± 0.51 a12.9 ± 0.47 c15.2 ± 0.58 15.2 ± 0.4915.6 ± 0.4714.8 ± 0.590.000010.890.080.920.020.0020.23
Nematodes
Dominance_D0.3 ± 0.01 0.3 ± 0.01 0.3 ± 0.010.3 ± 0.0060.3 ± 0.010.3 ± 0.010.3 ± 0.0080.680.620.230.350.980.050.85
Shannon_H1.3 ± 0.041.2 ± 0.041.3 ± 0.031.2 ± 0.021.3 ± 0.031.3 ± 0.031.3 ± 0.030.440.230.530.470.600.250.92
Evenness_e^H/S0.6 ± 0.02 b0.7 ± 0.03 a0.7 ± 0.03 a0.6 ± 0.02 b0.7 ± 0.02 a0.6 ± 0.020.7 ± 0.020.050.010.210.280.080.070.22
Brillouin1.3 ± 0.04 1.2 ± 0.041.2 ± 0.031.2 ± 0.021.3 ± 0.04 a1.2 ± 0.03 b1.3 ± 0.03 a0.410.330.570.390.630.270.92
Menhinick0.2 ± 0.01 b0.2 ± 0.01 b0.3 ± 0.03 a0.2 ± 0.009 a0.3 ± 0.02 b0.2 ± 0.01 b0.3 ± 0.02 a0.0080.030.550.010.330.430.59
Margalef0.8 ± 0.66 0.7 ± 0.050.7 ± 0.040.7 ± 0.03 a0.7 ± 0.04 b0.7 ± 0.040.7 ± 0.030.220.920.870.310.730.790.79
Equitability_J0.7 ± 0.020.8 ± 0.020.8 ± 0.020.7 ± 0.01 b0.8 ± 0.02 a0.7 ± 0.020.8 ± 0.020.070.0050.120.140.040.020.76
Fisher_alpha1.0 ± 0.050.8 ± 0.050.9 ± 0.050.9 ± 0.04 b0.9 ± 0.05 a0.9 ± 0.040.9 ± 0.040.220.740.930.580.290.820.38
Berger–Parker0.4 ± 0.020.4 ± 0.020.4 ± 0.020.4 ± 0.01 b0.5 ± 0.02 a0.4 ± 0.020.4 ± 0.010.670.030.320.570.520.040.41
MI2.1 ± 0.122.1 ± 0.152.1 ± 0.112.4 ± 0.04 a1.8 ± 0.10 b2.0 ± 0.11 b2.2 ± 0.08 a0.880.000010.0090.810.0010.0030.002
PPI2.5 ± 0.122.2 ± 0.052.3 ± 0.072.2 ± 0.04 b2.5 ± 0.08 a2.3 ± 0.082.3 ± 0.070.080.00060.870.040.981.000.79
BI65.13 ± 9.666.7 ± 11.153.2 ± 11.1986.4 ± 7.78 a37.0 ± 4.37 b60.9 ± 8.5162.5 ± 8.880.510.00010.880.880.890.940.99
EI89.8 ± 1.6589.8 ± 1.6587.0 ± 2.4187.5 ± 0.94 b91.7 ± 1.90 a89.5 ± 1.8489.7 ± 1.280.150.080.900.080.460.920.62
SI92.0 ± 1.39 a80.54 ± 3.87 b76.5 ± 6.02 b87.4 ± 0.88 a74.8 ± 4.68 b78.7 ± 3.2183.5 ± 4.050.160.0050.250.190.070.190.06
CI8.0 ± 1.3910.2 ± 1.6513.1 ± 2.4312.6 ± 0.94 a8.3 ± 1.92 b10.5 ± 1.8410.3 ± 1.310.150.050.930.080.490.900.65
Detritivores θ1398.5 ± 133.3 a1226.9 ± 182.7 a626.2 ± 103.1 b1007.13 ± 58.11160.6 188.31205.6 ± 144.1962.1 ± 87.020.000010.200.050.00050.080.020.22
Predators θ1130.6 ± 144.9782.9 ± 161.2725.6 ± 221.51287.0 ± 116.4 a472.4 ± 110.2 b729.04 ± 115.31030.3 ± 136.420.050.000010.040.120.190.180.48
Plant parasitics θ314.2 ± 294.1423.0 ± 3.5255.5 ± 41.4619.3 ± 2.6242.5 ± 196.5244.3 ± 170.0317.6 ± 2.030.430.270.260.460.430.260.44
Microarthropods
Dominance_D0.4 ± 0.03 a0.4 ± 0.04 a0.3 ± 0.02 b0.4 ± 0.030.4 ± 0.030.4 ± 0.020.4 ± 0.030.050.100.590.0090.0020.200.76
Shannon_H1.3 ± 0.08 1.2 ± 0.09 1.3 ± 0.04 1.3 ± 0.051.2 ± 0.071.3 ± 0.061.2 ± 0.060.270.290.440.030.0030.030.92
Evenness_e^H/S0.4 ± 0.03 b0.4 ± 0.04 b0.5 ± 0.03 a0.4 ± 0.030.4 ± 0.03 0.4 ± 0.020.4 ± 0.040.00010.060.060.020.0020.340.34
Brillouin1.2 ± 0.07 1.1 ± 0.081.2 ± 0.041.2 ± 0.051.1 ± 0.06 1.2 ± 0.06 1.2 ± 0.050.470.140.470.020.0020.050.94
Menhinick0.6 ± 0.05 0.5 ± 0.06 0.7 ± 0.070.5 ± 0.03 b0.7 ± 0.06 a0.7 ± 0.060.6 ± 0.040.120.020.180.090.090.020.44
Margalef1.6 ± 0.12 1.5 ± 0.111.4 ± 0.101.4 ± 0.071.6 ± 0.101.6 ± 0.101.4 ± 0.080.180.070.070.960.380.050.77
Equitability_J0.5 ± 0.03 b0.5 ± 0.04 b0.7 ± 0.02 a0.6 ± 0.030.6 ± 0.030.6 ± 0.030.6 ± 0.030.00030.070.370.0080.00090.150.52
Fisher_alpha2.1 ± 0.18 1.9 ± 0.171.8 ± 0.171.8 ± 0.10 b2.2 ± 0.16 a2.1 ± 0.151.8 ± 0.110.390.040.060.790.310.030.66
Berger–Parker0.6 ± 0.04 a0.6 ± 0.04 a0.5 ± 0.03 b0.5 ± 0.03 0.6 ± 0.03 0.6 ± 0.030.6 ± 0.040.050.090.900.0030.0010.120.93
QBS-ar116.8 ± 7.51 a104.8 ± 7.44 a80.3 ± 7.95 b91.3 ± 4.59 b109.9 ± 8.46 a110.2 ± 6.91 a91.1 ± 6.67 b0.880.0020.020.390.860.040.35
Disclaimer/Publisher’s Note: The statements, opinions and data contained in all publications are solely those of the individual author(s) and contributor(s) and not of MDPI and/or the editor(s). MDPI and/or the editor(s) disclaim responsibility for any injury to people or property resulting from any ideas, methods, instructions or products referred to in the content.

