Article

Mixed Mating System, Dispersal Limitation Shape, and Spatial Genetic Structure of Tamarix chinensis on Isolated Wudi Seashell Island

1
College of the Environment and Ecology, Xiamen University, Xiamen 361102, China
2
Fujian Key Laboratory of Island Monitoring and Ecological Development, Island Research Center, Ministry of Natural Resources, Pingtan 350400, China
*
Author to whom correspondence should be addressed.
Diversity 2025, 17(4), 285; https://doi.org/10.3390/d17040285
Submission received: 10 March 2025 / Revised: 16 April 2025 / Accepted: 16 April 2025 / Published: 18 April 2025

Abstract

:
Tamarix chinensis Lour. is a halophytic shrub native to coastal China, commonly used in afforestation and ecological restoration due to its high tolerance to salinity and drought. To understand how this species maintains genetic variation and adapts to extreme environments, we examined the genetic diversity, mating system, and spatial genetic structure of a natural T. chinensis population on the geographically isolated and environmentally harsh Wudi Seashell Island. Using both SSR and ISSR markers, we observed high levels of genetic diversity despite the small population size and spatial fragmentation. SSR markers revealed an average of 11.75 alleles per locus, with an expected heterozygosity (He) of 0.754 and an observed heterozygosity (Ho) of 0.702. ISSR markers showed a polymorphic locus rate of 97.87%, with a mean He of 0.402. Parentage analysis revealed relatively long seed and pollen dispersal distances, with most dispersal occurring within 150 m and seeds and pollens occasionally reaching 948 m and 447 m, respectively. The species exhibited a mixed mating system, with a multilocus outcrossing rate of 0.554, contributing to gene flow and reducing inbreeding. A fine-scale spatial genetic structure was detected within 75 m, consistent across both SSR and ISSR markers, suggesting limited local gene dispersal. These findings provide new insights into the adaptive strategies of T. chinensis in marginal habitats and offer valuable guidance for conservation and restoration efforts in vulnerable coastal ecosystems.

1. Introduction

Tamarix chinensis Lour. (T. chinensis) is a salt- and alkali-tolerant deciduous shrub, typically 3–6 m in height, with significant ecological and economic value [1]. It is native to coastal China and has been widely used in afforestation and ecological restoration efforts due to its ability to survive in high-salinity environments by secreting excess salts through its leaf glands [2]. T. chinensis plays a vital role in stabilizing the newly formed coastal wetlands and facilitating vegetation succession in the Yellow River Delta (YRD), one of its primary distribution areas [3]. As a halophyte adapted to harsh conditions, understanding its genetic characteristics is crucial for assessing its evolutionary potential and resilience under environmental stresses such as salinity, drought, and habitat fragmentation [4].
Numerous studies have investigated the genetic diversity and structure of T. chinensis and related species using molecular markers. For instance, Liang et al. [5] employed six simple sequence repeat (SSR; microsatellite) markers to analyze YRD populations and observed moderate genetic diversity (He ranging from 0.366 to 0.740) and low genetic differentiation (Fst = 0.053). Random Amplified Polymorphic DNA (RAPD) and inter-simple sequence repeat (ISSR) marker-based studies also revealed low levels of genetic differentiation but relatively high genetic diversity [2,6]. Moreover, Zhu et al. [7] highlighted a negative correlation between genetic diversity and soil salinity, suggesting that environmental heterogeneity contributes to spatial genetic variation in this species.
Wudi Seashell Island is one of a set of unique coastal landforms formed by the accumulation of sediment and shell debris along muddy and silty shorelines. These islands are geographically isolated from the mainland and face harsh environmental pressures, including high soil salinity, large seasonal temperature fluctuations, high evaporation rates, and frequent storm surges. These harsh conditions result in low vegetation diversity and limit the natural regeneration of plant communities. T. chinensis, one of only two native woody species, plays a critical ecological role in stabilizing soil and maintaining habitat structure.
From a genetic perspective, T. chinensis populations exhibit significant genetic diversity, as revealed by microsatellite marker studies conducted in estuarine flats. This diversity underpins its adaptability to heterogeneous and challenging habitats [1,8]. Phylogeographic analyses further suggest that T. chinensis has a widespread distribution influenced by historical ecological factors, highlighting the importance of understanding its genetic structure for conservation planning. However, fine-scale spatial genetic structure (SGS) and mating system studies remain scarce for T. chinensis [9,10], particularly in isolated coastal habitats like Wudi Seashell Island.
In this study, we investigate the genetic diversity, mating system, and spatial genetic structure of a natural T. chinensis population on Wudi Seashell Island, using both SSR markers and ISSR markers. Specifically, we aim to achieve the following: (1) assess the levels of genetic variation within this isolated population; (2) estimate seed and pollen dispersal distances via parentage analysis; (3) quantify spatial genetic structure and discuss how limited gene flow, mating patterns, and island environmental features shape local genetic patterns. Our results will provide new insights into the evolutionary potential of and conservation strategies for T. chinensis in dynamic coastal habitats.

2. Materials and Methods

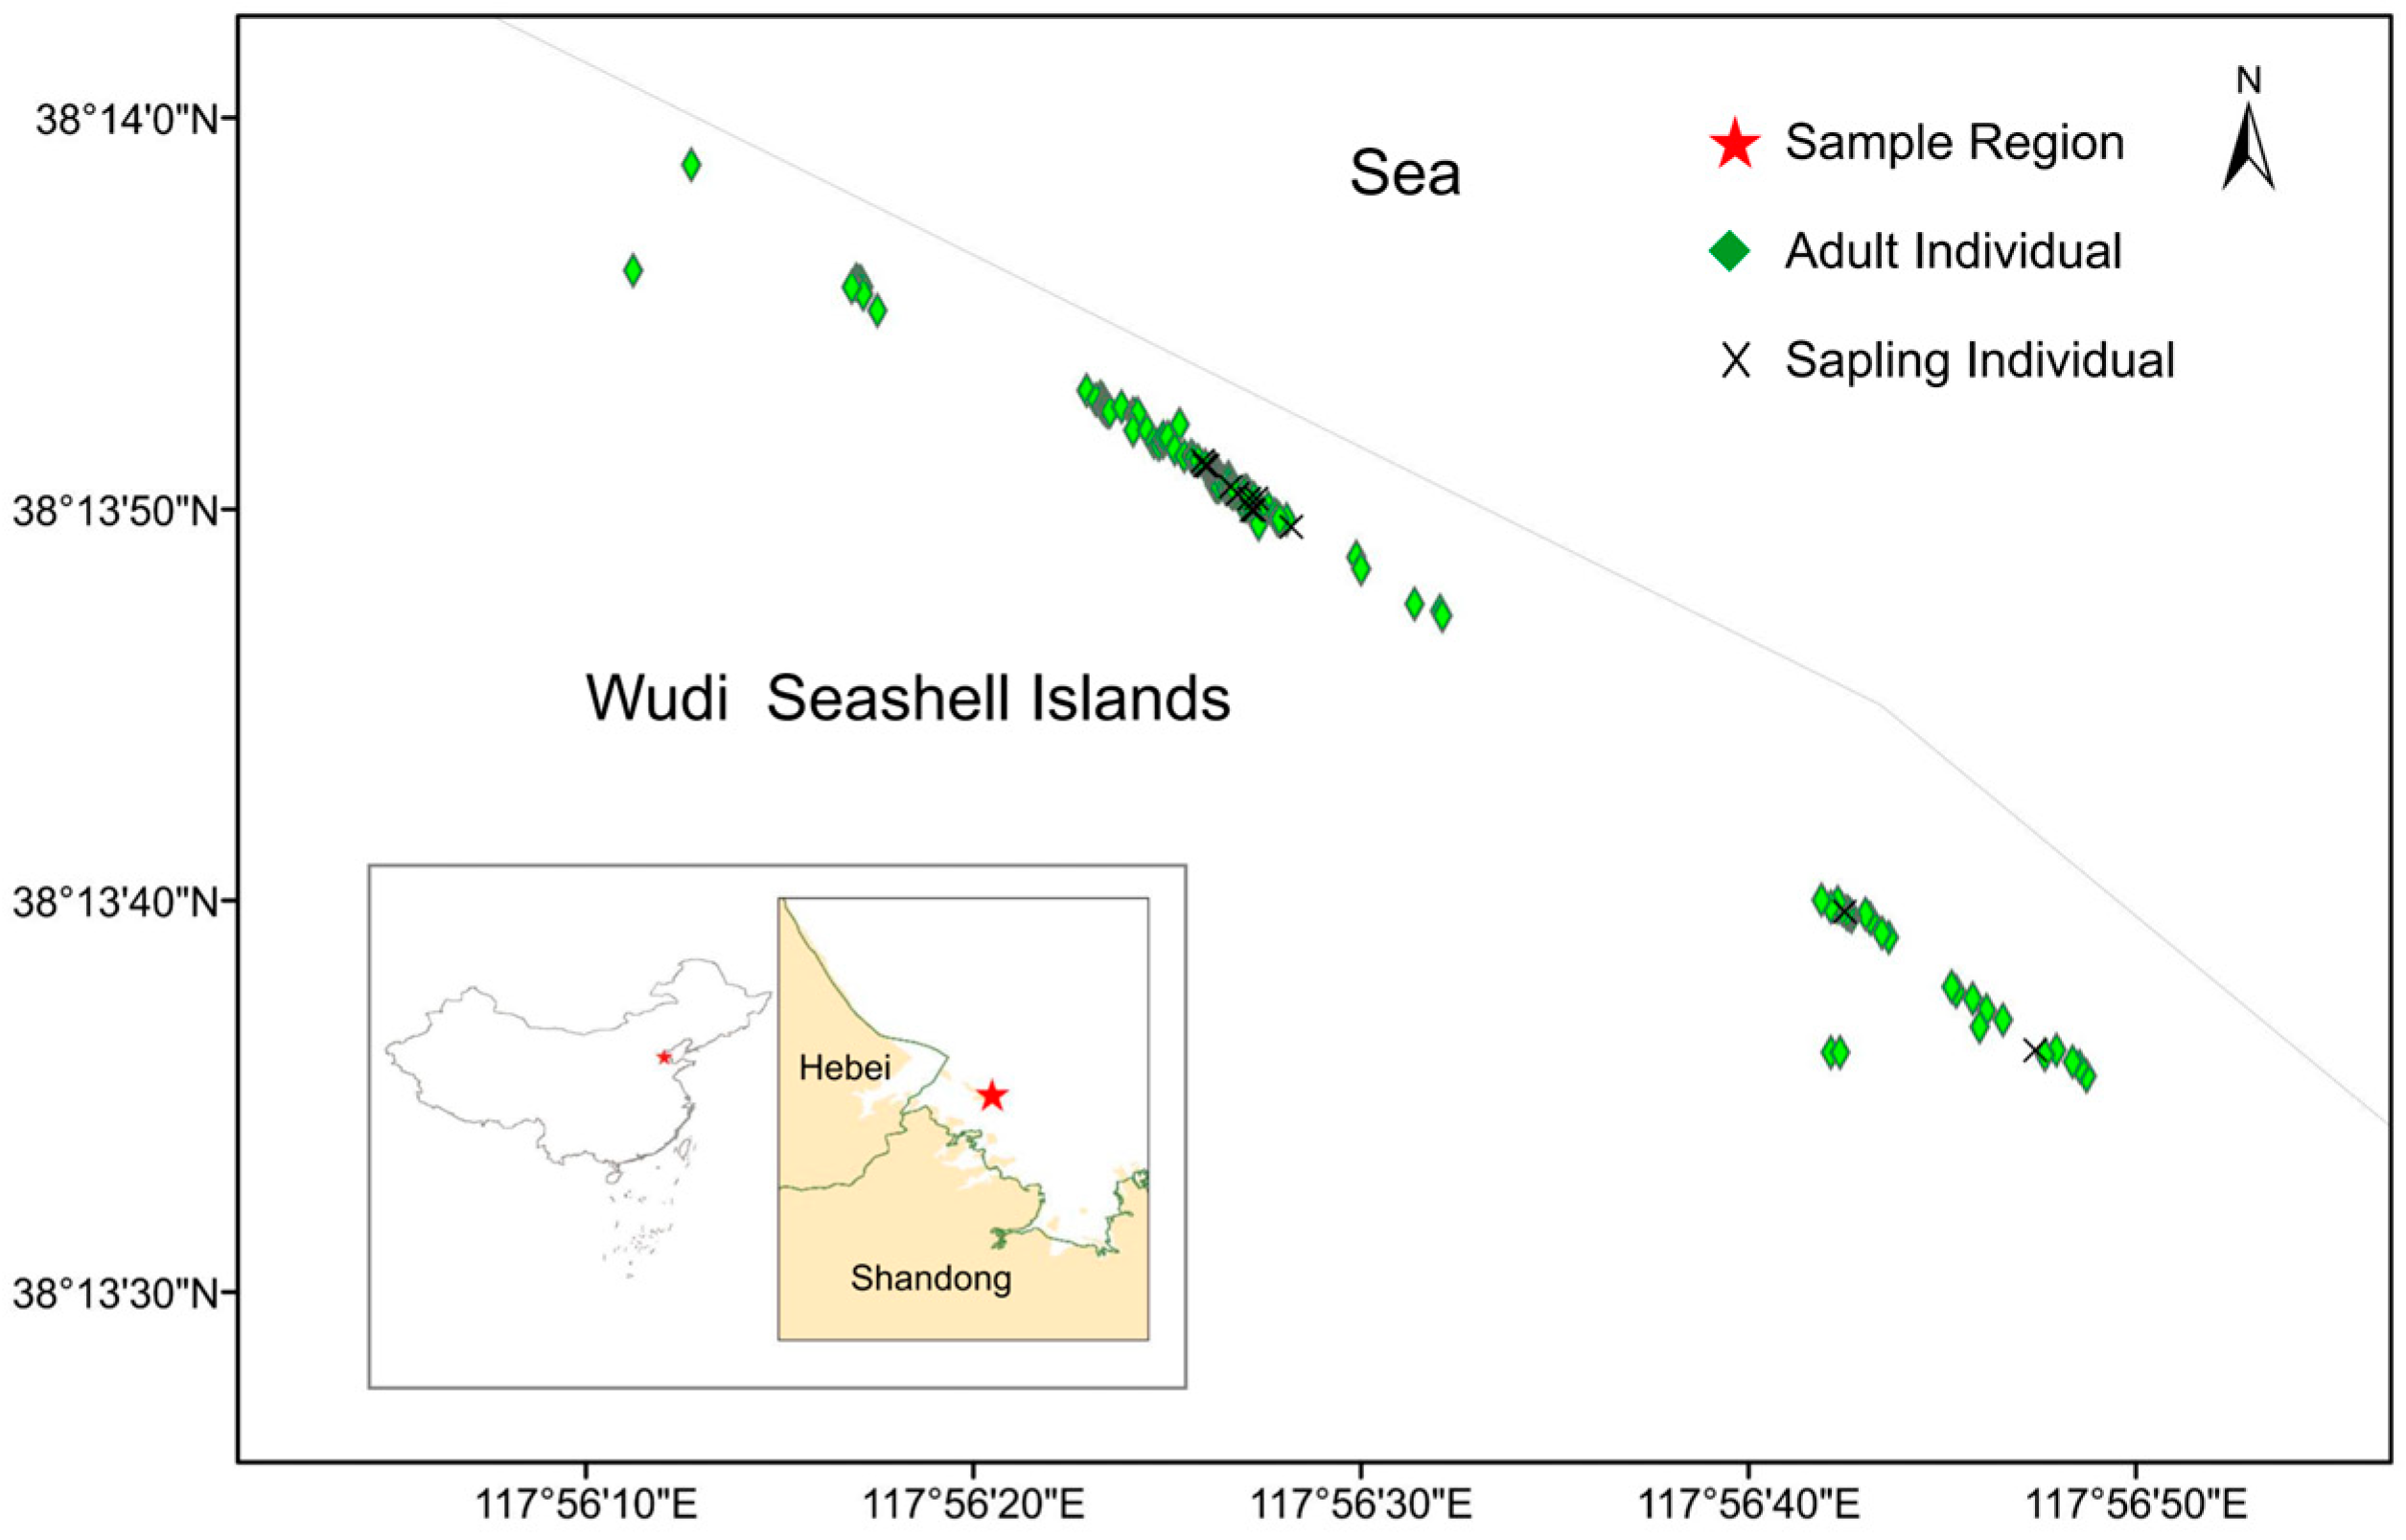
2.1. Study Area and Sampling

The study area was located within Wudi Seashell Island (Figure 1) and the Wetland National Nature Reserve in Wudi County, Binzhou, Shandong Province, extending from Wangzi Island to the coastal area of the Dakouhe River (38.0475–38.3517° N, 117.7828–118.0952° E). The region is relatively flat, with an elevation below 5 m. It experiences a warm temperate East Asian monsoon continental semi-humid climate, with an average annual temperature of 12.36 °C. The average annual precipitation is 550 mm, while the average annual evaporation is 2430 mm, resulting in an evaporation-to-precipitation ratio of 4.4:1. The shell sand layer has an average thickness ranging from 1.1 to 2.5 m. The soil is predominantly shell sandy soil and coastal saline soil, characterized by low porosity, low organic matter, and low nitrogen content. The vegetation mainly consists of shrubs and herbaceous plants [11].
Samples were collected from all Tamarix chinensis individuals within accessible and continuously distributed patches on Wangzi Island and the Dakouhe River, covering an area of 28 hectares. A total of 109 plants were sampled, including 11 seedlings. For each plant, healthy young branches were collected, and their coordinates, clump diameters, numbers of clumps per plant, canopy coverages, and heights were recorded (Table S2). The samples were placed in sealed bags containing desiccant silica gel and brought back to the laboratory for further analysis.

2.2. DNA Extraction and PCR Amplification

Genomic DNA of T. chinensis was extracted from fresh leaf tissue using the TianGen Quick Plant Genomic DNA Extraction Kit (non-spin column type), DP321. The DNA was dissolved in TE buffer and stored at 4 °C. The quality of the extracted DNA was monitored using 1% agarose gel electrophoresis, and the concentration and purity were measured using a UV spectrophotometer (Table S3; see Figure S1A for the DNA quality check results). The DNA was then stored at −20 °C. Referring to a previous study [12], 30 pairs of ISSR primers were selected for screening, among which 10 pairs produced clear, stable, and reproducible amplification results. These ISSR primers (listed in Table S4) were used for the PCR amplification of 107 T. chinensis individuals (2 samples were excluded due to poor amplification quality). Additionally, to enhance the reliability of the results, 4 pairs of SSR primers (E1–E4) were used to amplify 109 T. chinensis individuals [13] (see Figure S1B,C for electrophoresis results of ISSR and SSR products, respectively). The primers were synthesized by Sangon Biotech (Shanghai) Co., Ltd. (listed in Table S5).
The PCR amplification reaction system for the ISSR markers (25 μL) was composed of 25 ng of template DNA, 0.6 mM of primer, 12.5 μL of Bioteke 2 × Taq PCR MasterMix, and sterile water to make up the volume. The PCR cycling conditions followed those in the previous study [6]: initial denaturation at 94.0 °C for 10 min, followed by 40 cycles of denaturation at 94.0 °C for 1 min, annealing at 48 °C (annealing temperature varied according to each primer) for 1 min, extension at 72.0 °C for 2 min, and a final extension at 72.0 °C for 10 min. The PCR amplification reaction system for the SSR markers (20 μL) consisted of 25 ng of template DNA, 0.5 mM each of forward and reverse primer, 10 μL of Bioteke 2 × Taq PCR MasterMix, and sterile water to make up the volume. The PCR cycling conditions followed the previous study [14]. All PCR reactions were performed on a BIO-RAD T100 Thermal Cycler.
ISSR amplification products were detected by 1% agarose gel electrophoresis in 1 × TBE electrophoresis buffer at 80 V for 2.5 hours, then visualized and photographed using a Tanon 2500 gel imaging system from Shanghai Tianneng Technology Co., Ltd. (Shanghai, China). SSR amplification products were analyzed by capillary electrophoresis, outsourced to Sangon Biotech (Shanghai) Co., Ltd. (Shanghai, China).

2.3. Genetic Parameters

For the ISSR marker data, the presence of stable amplification bands was recorded as 1 and the absence as 0, resulting in a binary matrix. Based on this matrix, genetic diversity parameters were calculated using marker-appropriate software. POPGENE 1.32 [15] was used to estimate the percentage of polymorphic loci (P), gene diversity (H), and Shannon’s information index (I) to estimate the genetic diversity level of T. chinensis populations. The average number of alleles (Na), effective number of alleles (Ne), and effective population size were calculated using GenAlEx 6.5 [16].
For the SSR marker data, which provided codominant, multi-allelic genotypes, diversity parameters including Na, Ne, H, unbiased diversity (uH), and I were calculated for the entire population and for each of the three phenotypic groups using GenAlEx 6.5 [16]. The two marker systems were used in parallel to validate genetic diversity and structure, enhancing the robustness of the conclusions.

2.4. Paternity Analysis and Mating System

Paternity analysis was conducted exclusively based on SSR marker data. Maximum-likelihood paternity assignment was performed using Cervus 3.0.7. Before analysis, 10,000 simulations were conducted with the following parameters: 1.0 proportion of candidate parents sampled, 0.01 mistyped rate, confidence levels of 95% (strict) and 80% (relaxed), and 98 individuals being used as candidate parents.
The mating system of T. chinensis was evaluated using MLTR 3.2 [17], based on SSR genotypes. The parameters estimated included multilocus outcrossing rate (tm), single-locus outcrossing rate (ts), biparental inbreeding (tm − ts), and multilocus paternity correlation (rp). The software was run with default settings (t = 0.9, F = 0.1, rp = 0.1) and standard errors were obtained by bootstrapping 1000 times among the progeny.

2.5. Spatial Genetic Structure

To assess fine-scale SGS in T. chinensis, we performed two complementary analyses. First, the pairwise kinship coefficients (Fij) was calculated between individuals using codominant SSR markers, which provided high-resolution, multi-allelic data suitable for estimating genetic relatedness. Mean multilocus Fij values were calculated across defined distance classes (0.75,1.25, 1.75, 2.25, 3, 4, 5, 20, 75, 200, and 500 m) using SPAGeDi 1.5 [18] and GenAlEx 6.5 [16], with significance assessed through 10,000 permutations and standard errors estimated by jack-knifing over loci. In addition, spatial genetic autocorrelation was evaluated using both SSR and ISSR datasets to capture patterns from both codominant and dominant markers. This analysis was also conducted in SPAGeDi using 20 distance classes with 20 m intervals. While both marker types revealed significant SGS at short distances, kinship-based patterns derived from SSR data were emphasized in interpretation due to their greater precision and informativeness.
Additionally, the spatial distribution of individual genetic variation was visualized using Alleles in Space (AIS), based solely on SSR data. The Interpolated Genetic Landscape Shape (IGLS) procedure [19] was applied, and genetic distance-based maps were generated using Surfer 15 software.

2.6. Bottleneck Analysis and Estimation of Effective Population Size

Bottleneck events were estimated using BOTTLENECK 1.2.02 based on SSR data [20]. Two mutation models were applied: the Infinite Allele Model (IAM) and the Stepwise Mutation Model (SMM). The presence of recent bottlenecks was evaluated using both the one-tailed Wilcoxon signed-rank test and the sign test. Additionally, contemporary effective population size was estimated using the linkage disequilibrium (LD) method, implemented in NEEstimator v2.1 based on SSR data, with 95% confidence intervals calculated via parametric and jack-knife approaches [21].

3. Results

3.1. Genetic Diversity

Table 1 presents the genetic diversity indices based on the amplification results of ten ISSR markers. Out of the 30 primers screened, 10 primers were selected for their ability to generate clear, stable, and reproducible amplification products. The results show that the average number of alleles (Na) is 1.979, the average number of effective alleles (Ne) is 1.715, the diversity index (I) ranges from 0.516 to 0.655 with a mean of 0.585, and the expected heterozygosity (He) ranges from 0.352 to 0.462 with an average of 0.402. These indices are lower compared to those obtained using SSR markers. Despite this, the ISSR markers generated 92 polymorphic loci, representing 97.87% of the total loci, which indicates a high level of genetic variation within the population.
The genetic diversity of the T. chinensis population was assessed using SSR molecular markers. The number of alleles per locus ranged from 8 to 15, with an average of 11.750 (Table 2). The effective number of alleles (Ne) ranged from 2.962 to 6.005, with an average of 4.431. The diversity index (I) varied from 1.382 to 2.129, with a mean of 1.763. The observed heterozygosity (Ho) was 0.702, while the expected heterozygosity (He) was 0.745. At locus E1, the observed heterozygosity (0.881) was higher than the expected heterozygosity (0.814), indicating an excess of heterozygotes at this locus. In contrast, the expected heterozygosity was higher than the observed heterozygosity at the other three loci. The fixation index (F) showed that E1 had an F-value less than 0, and Hardy–Weinberg equilibrium tests indicated that E1 deviated from equilibrium, which was consistent with the excess of homozygotes discussed earlier. Loci E2 and E3 significantly conformed to Hardy–Weinberg equilibrium. The inbreeding coefficient (Fis) ranged from 0.037 to 0.137, with a mean of 0.078, suggesting a low probability of inbreeding in the population.

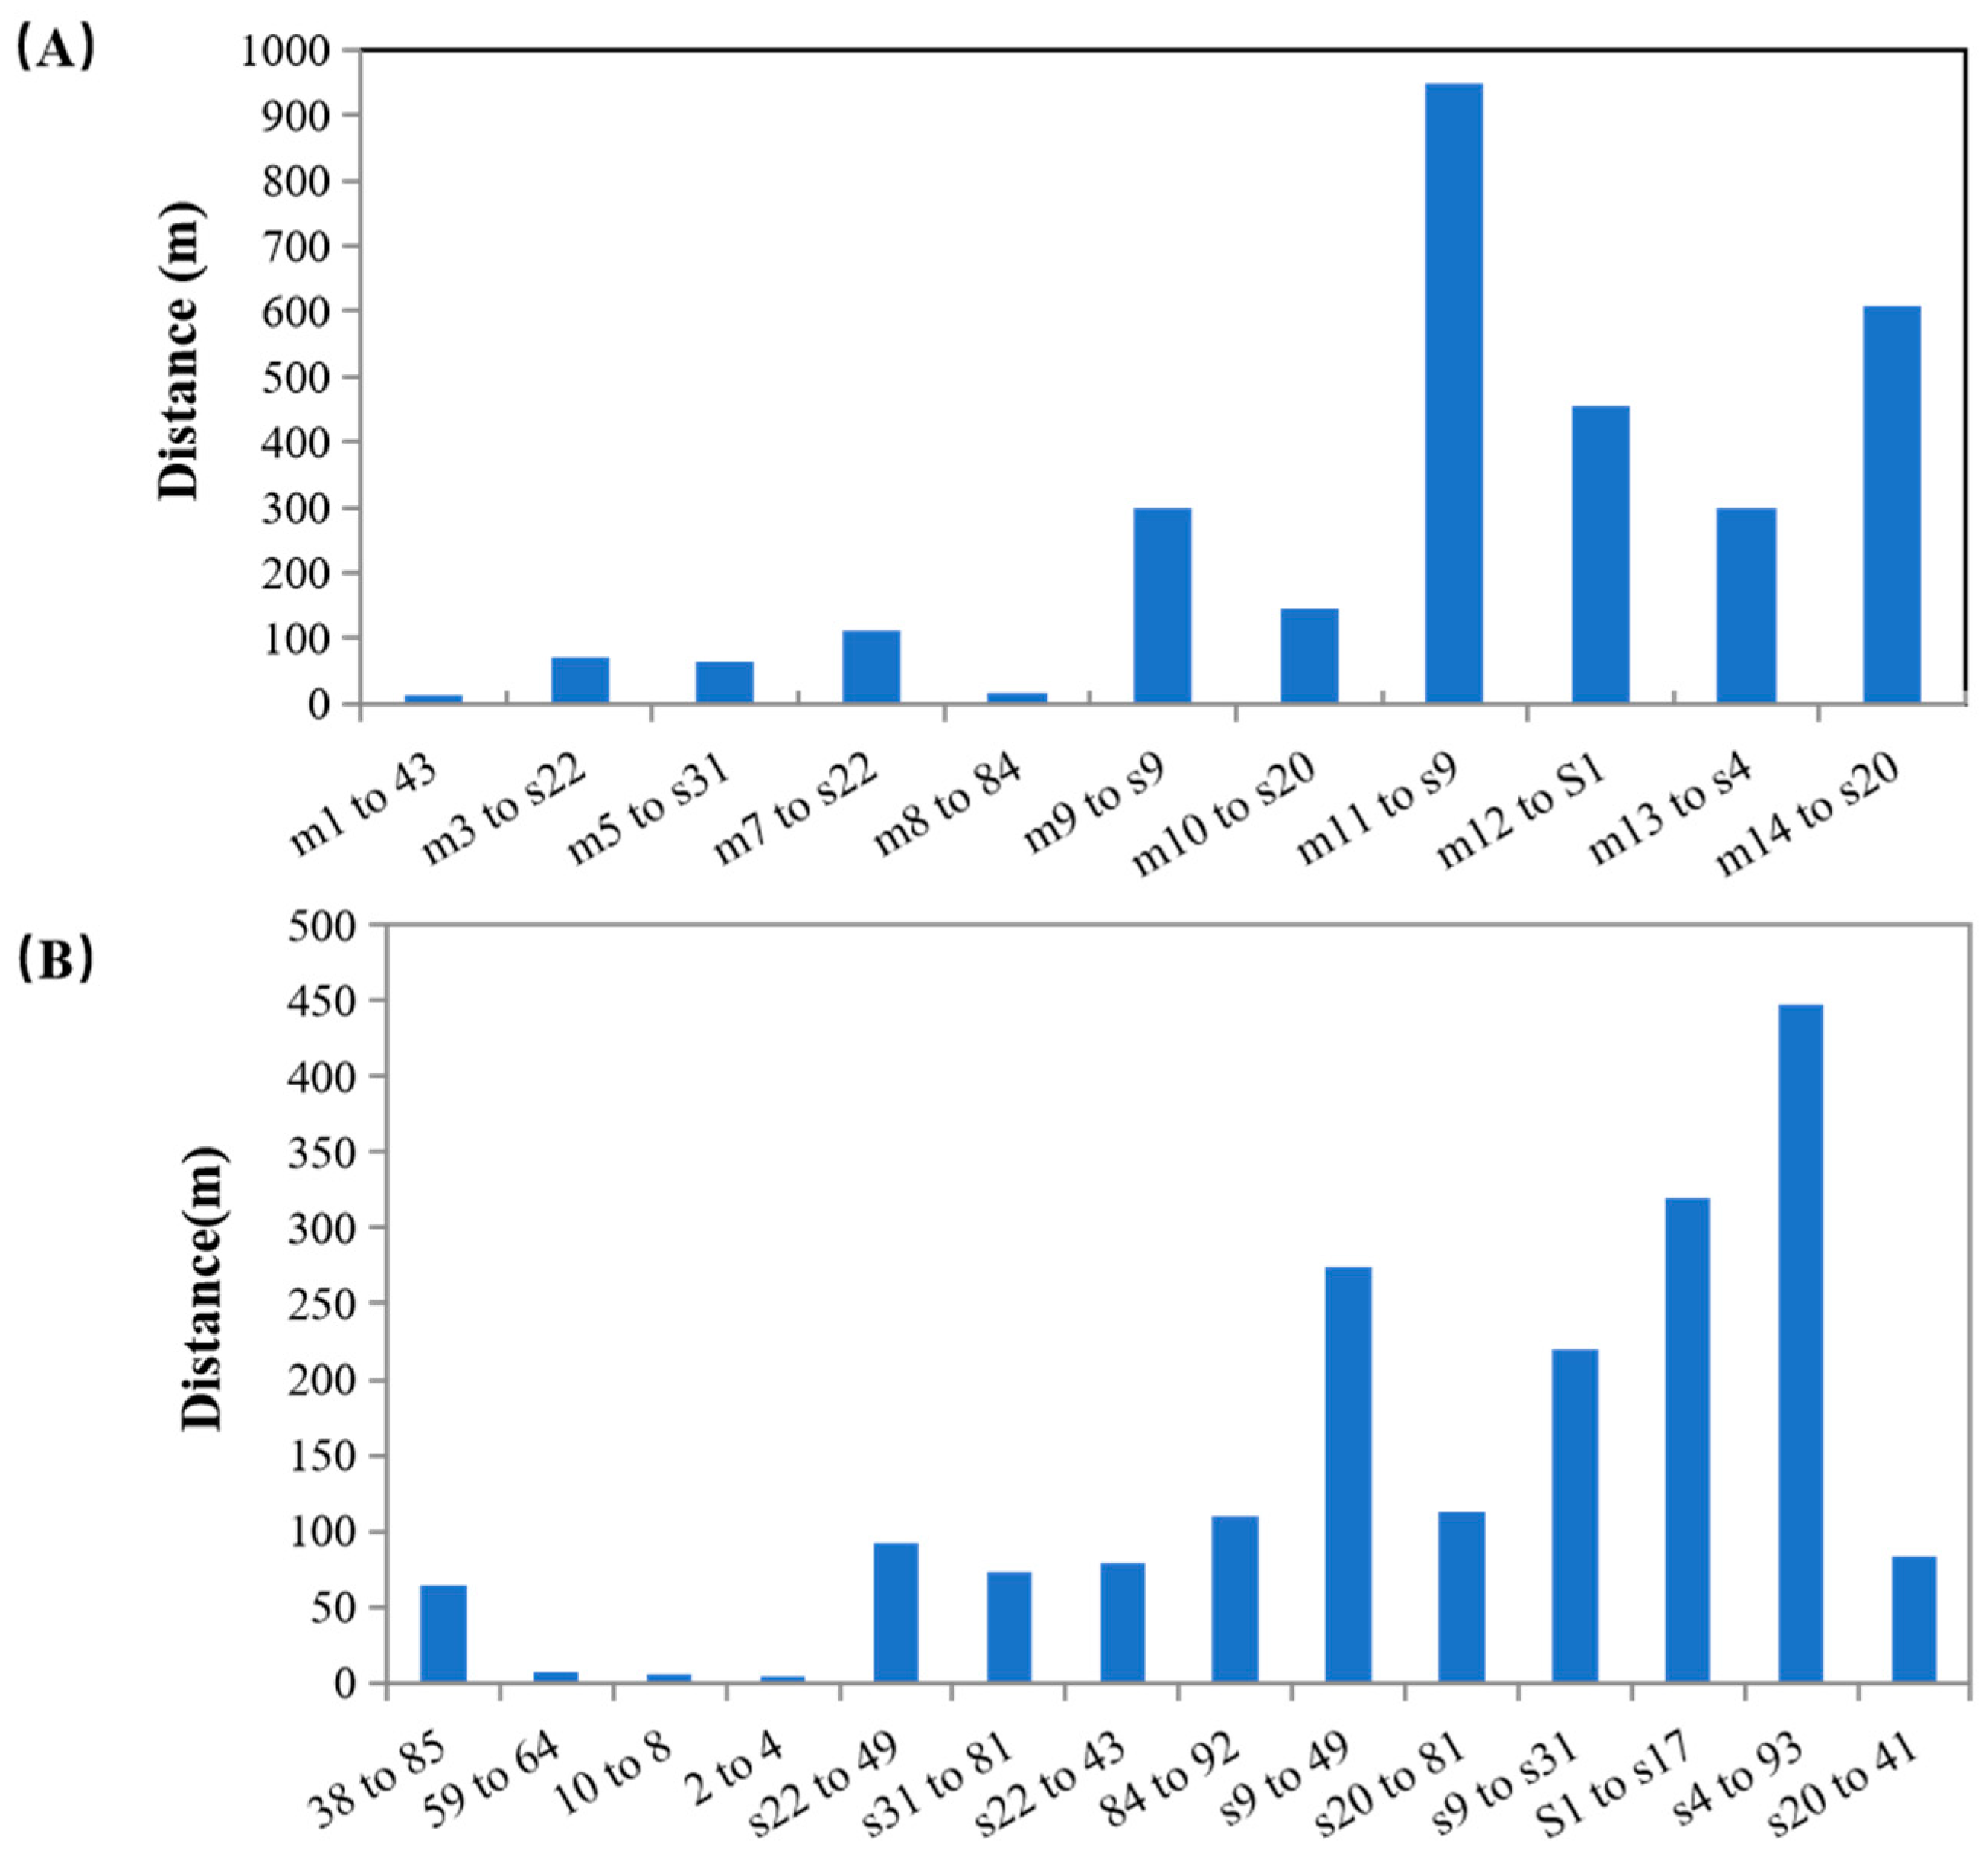
3.2. Paternity Analysis and Mating System

The polymorphic information content (PIC) of the four loci ranged from 0.618 to 0.815, with an average of 0.722 (Table 3). The exclusion probability for the first parent (NE-1P) varied between 0.486 and 0.742, with a mean of 0.612, while the exclusion probability for the second parent (NE-2P) ranged from 0.315 to 0.570, with an average of 0.440. The non-exclusion probability (NE-PP) ranged from 0.141 to 0.280, with an average of 0.253. The F-value for the E1 locus was negative (−0.046), indicating a deviation from Hardy–Weinberg equilibrium at this locus. Based on maximum-likelihood estimation, the exclusion probabilities for the first and second parents were 0.868 and 0.967, respectively. These results are consistent with those of other studies, supporting their reliability [10,22].
Figure 2 shows the distances from the T. chinensis saplings to the mother tree (seed dispersal) and from the mother tree to the pollen donor (pollen flow). Overall, in the study area, the seed dispersal distance was relatively large, with seeds reaching up to 948 m and as close as 12 m, averaging 275 m. However, the majority of seed dispersal events occurred within 150 m, where the frequency of occurrence was highest. The frequency of seed dispersal was lower in the 200–300 m range, and the probability of successful seed colonization decreased with increasing distance.
As for pollen flow, which refers to the distance between the mother tree and the pollen source, the maximum pollen dispersal distance reached 447 m while the minimum distance was 3 m, with an average of 167 m. Compared to seed dispersal, pollen dispersal distances were shorter. Within 10 m, the success rate of pollen fertilization was 21.4%, whereas no seeds were found to successfully colonize within 10 m. Similarly to seed dispersal, the highest probability of successful pollen fertilization occurred within 150 m, accounting for 71.4% of cases. As the distance increased, the likelihood of successful fertilization by the pollen donor decreased.
The mating system parameters for the entire population, saplings, and adult individuals were estimated based on individual-level data (Table 4). The single-locus outcrossing rate (ts) for the entire population was 0.210, while the multilocus outcrossing rate (tm) was 0.554, and the inbreeding rate (tm − ts) was 0.343. Among different life stages, saplings exhibited the highest single-locus outcrossing rate (0.455), followed by adult individuals (0.369), and the entire population (0.210). In contrast, multilocus outcrossing rates showed a different trend, with saplings having the lowest (0.492), followed by adult individuals (0.583), and the entire population (0.554). The pattern of inbreeding rate followed the same trend as the multilocus outcrossing rate, with saplings showing the lowest inbreeding rate (0.037), suggesting that most saplings are produced through outcrossing.

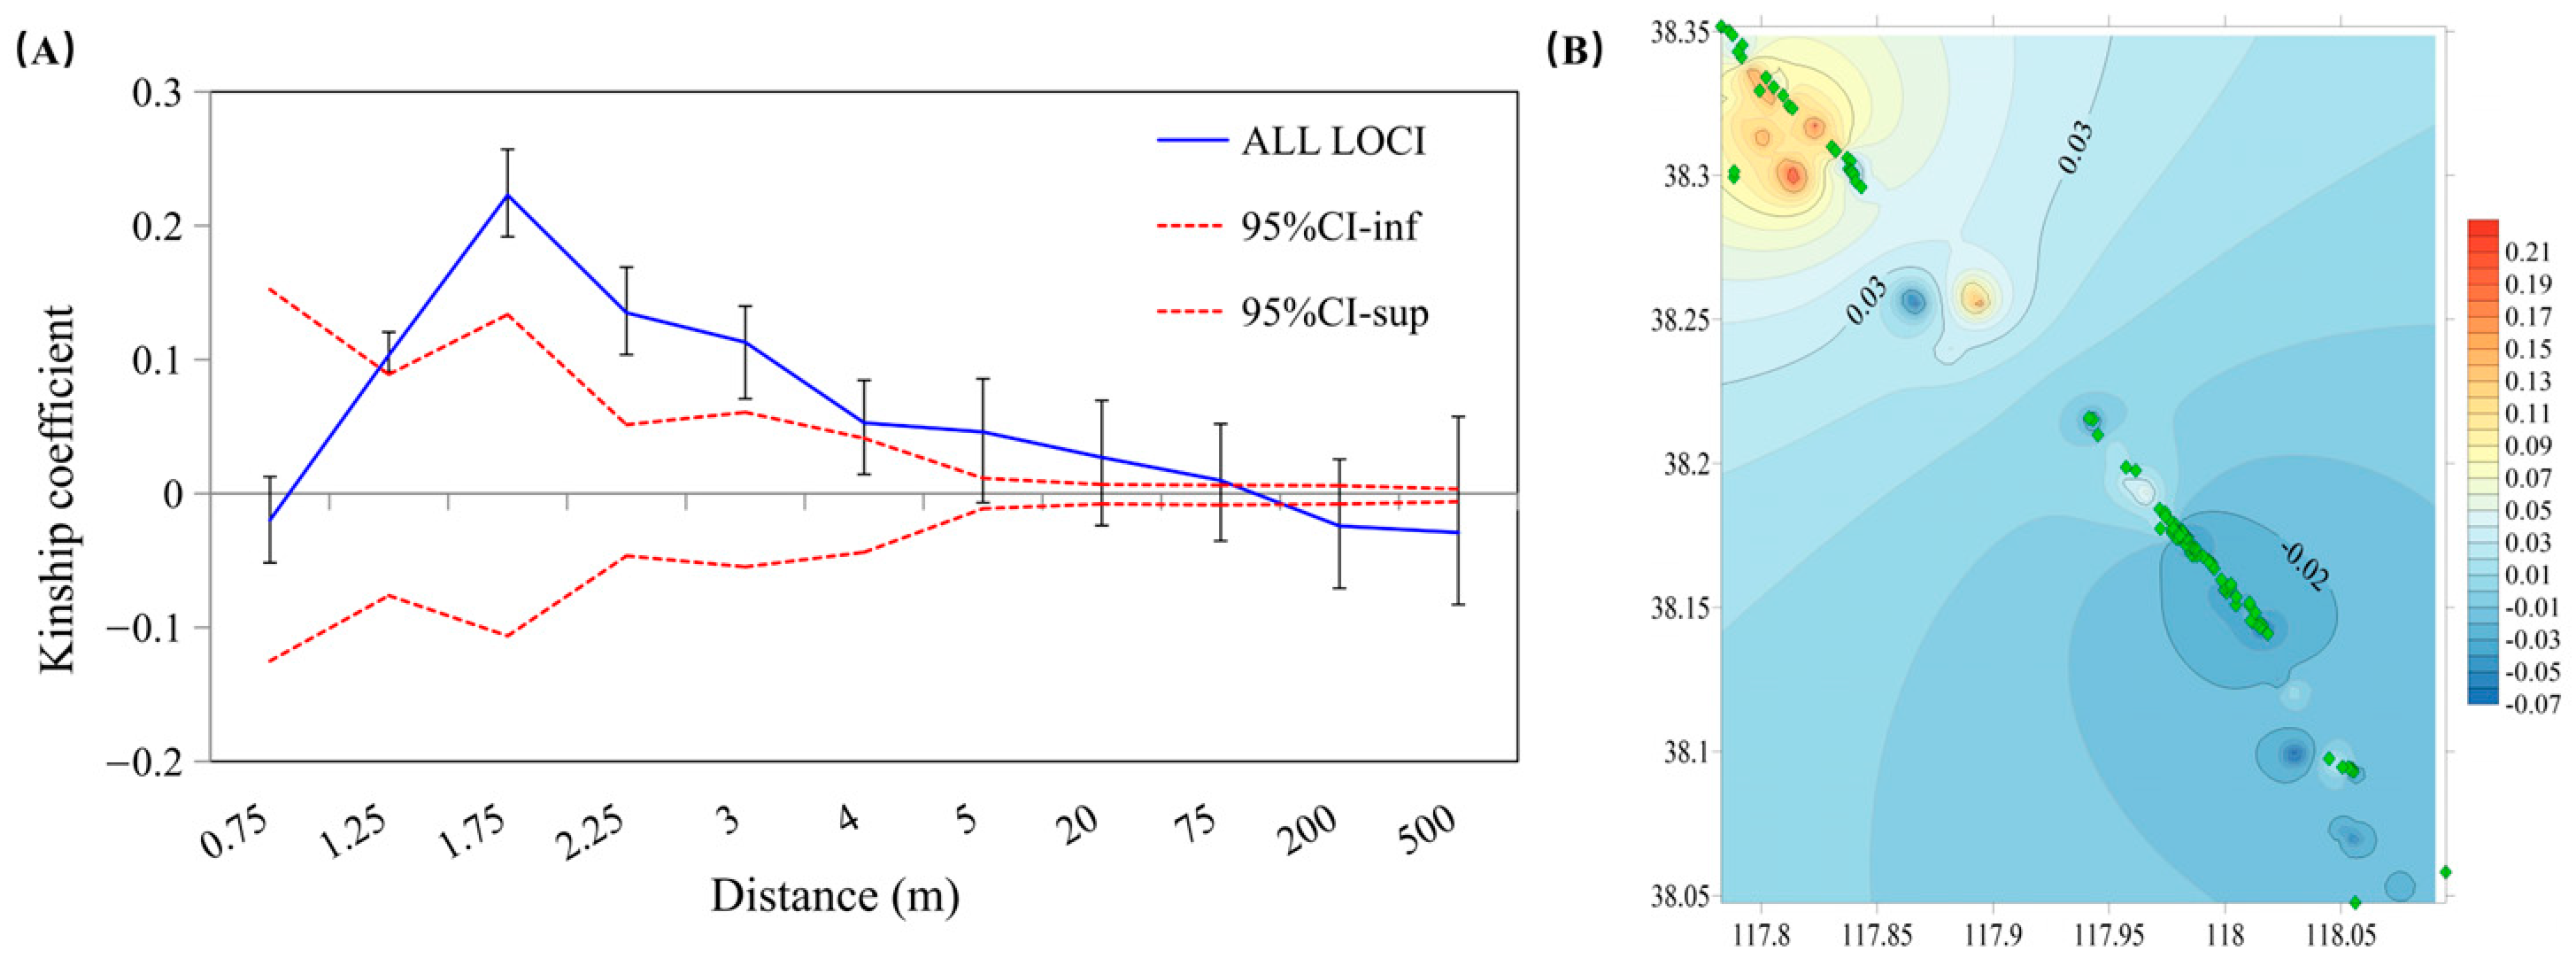
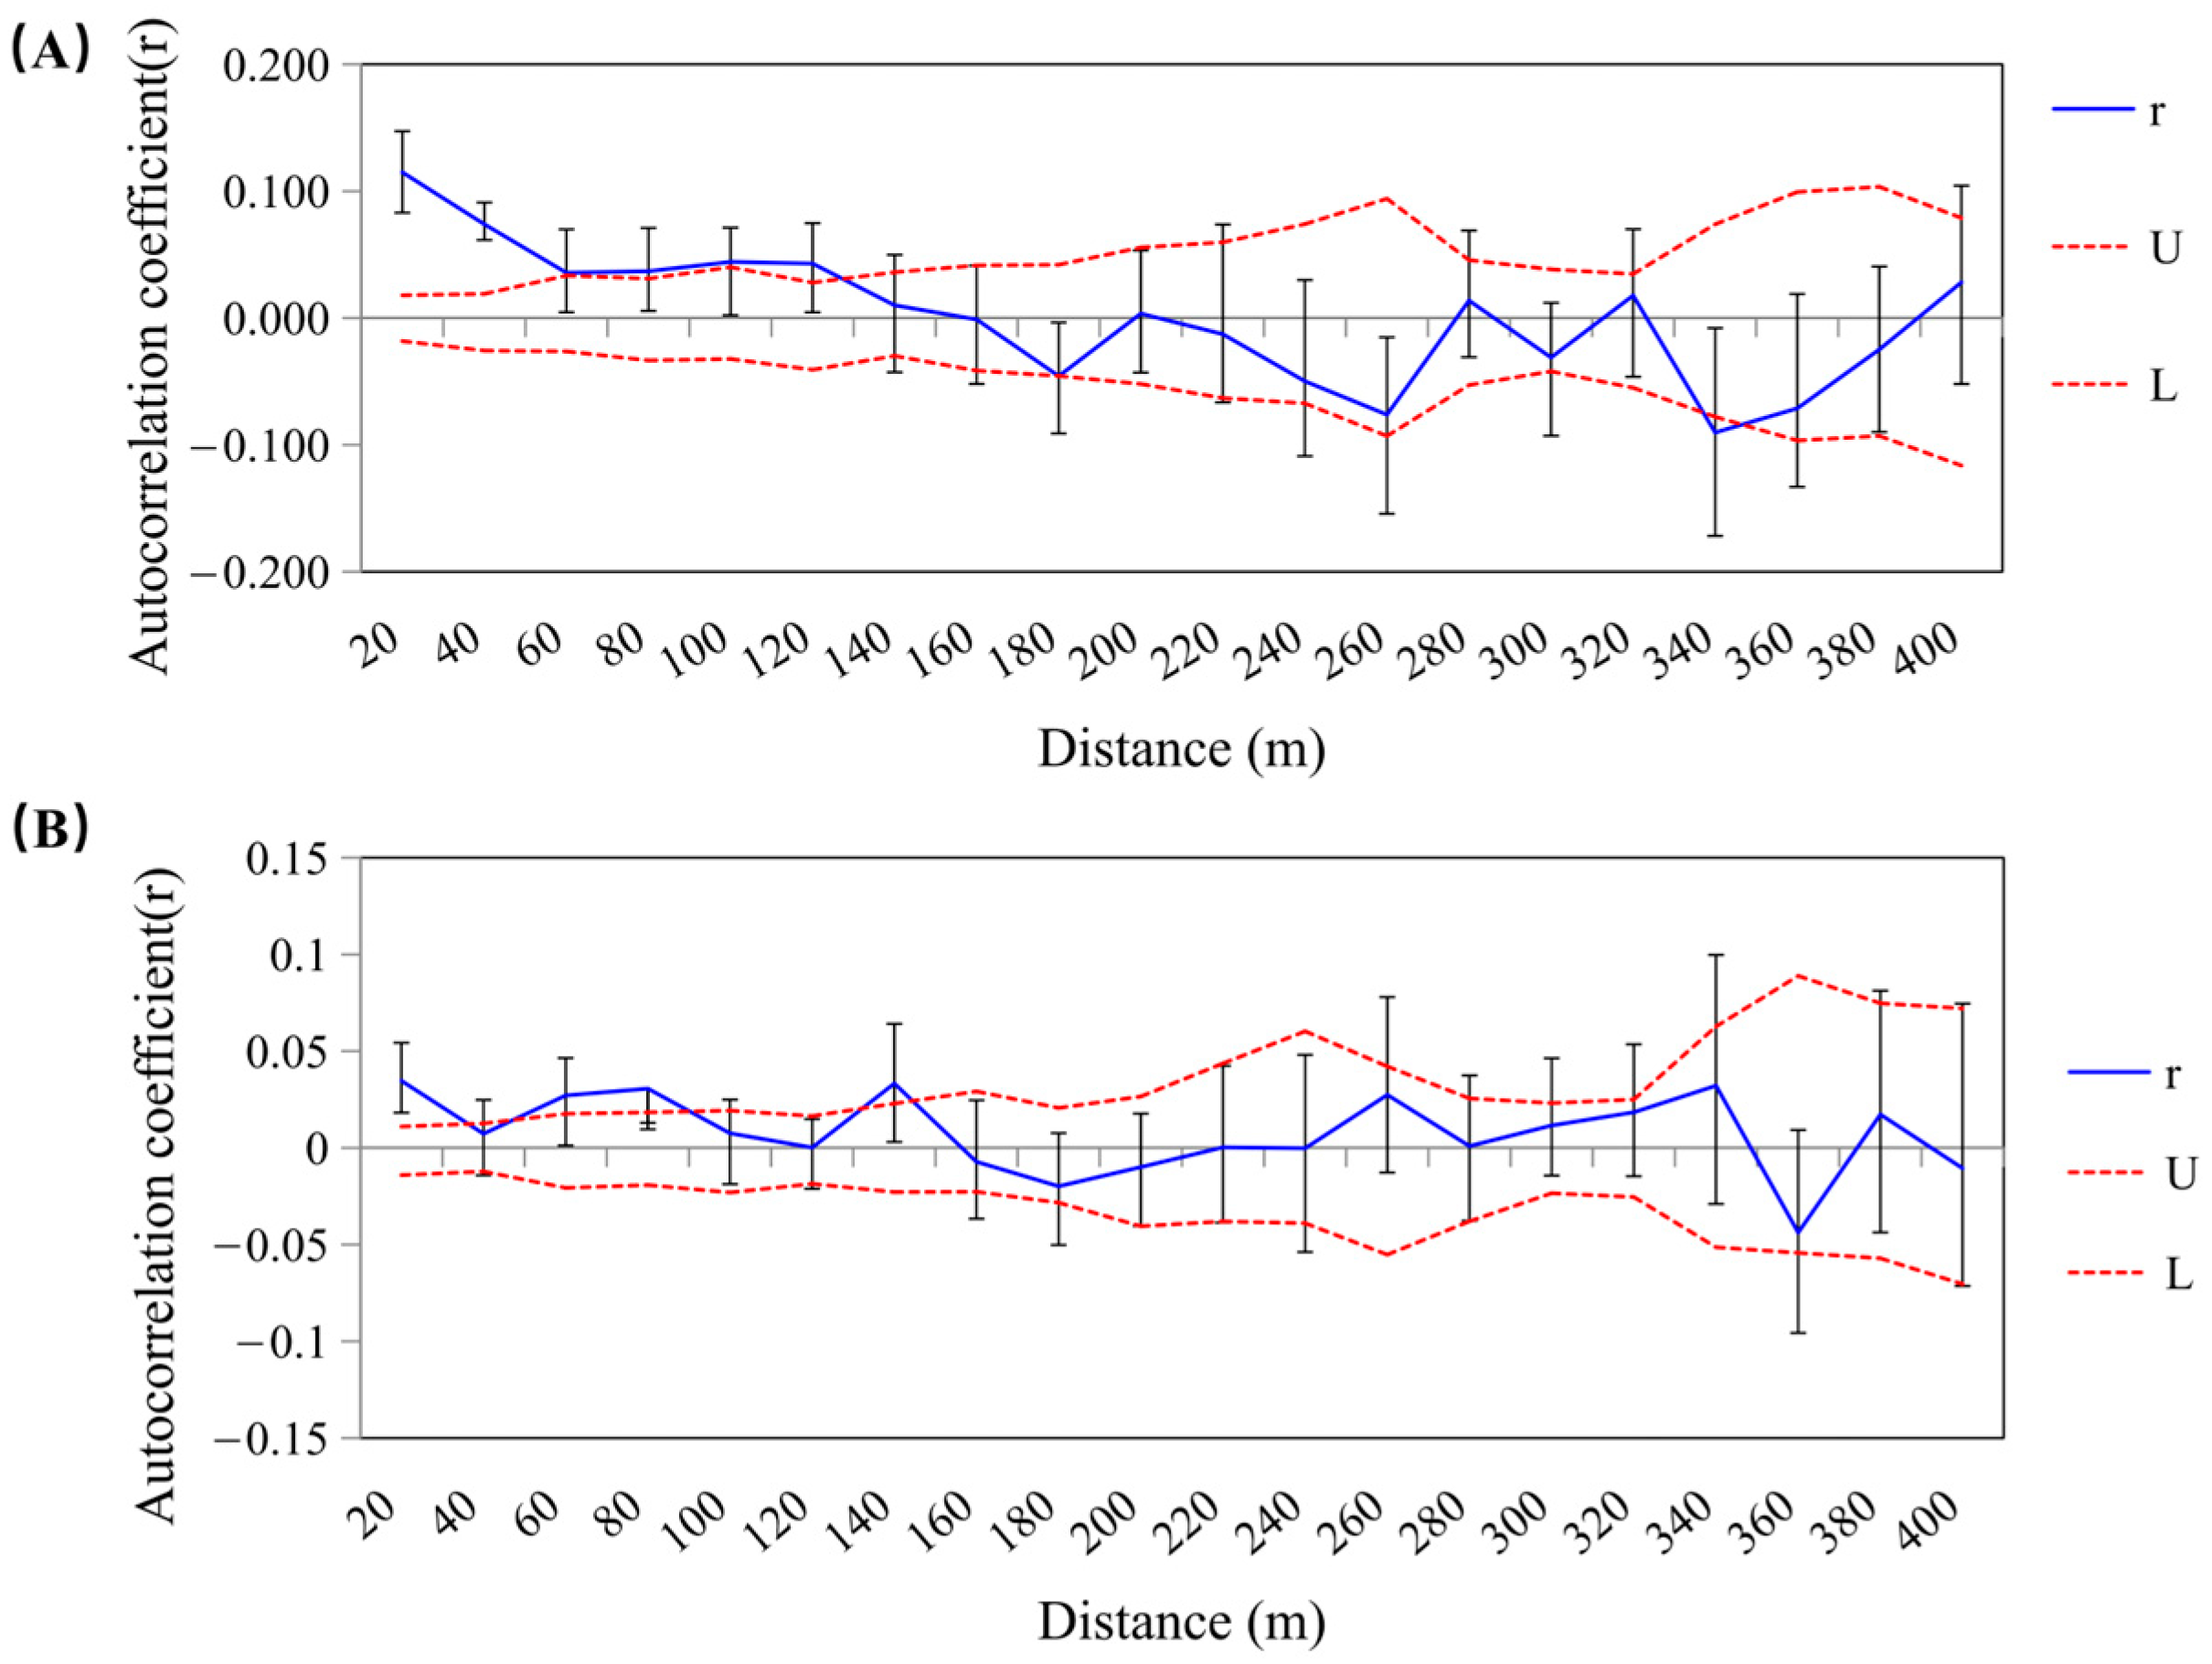
3.3. Spatial Genetic Structure Analysis

As shown in Figure 3A, the kinship coefficient Fij exhibited significant positive values within the distance classes of 1.25–1.75 m, 1.75–2.25 m, 2.25–3 m, 3–4 m, 4–5 m, 5–20 m, and 20–75 m, indicating a strong spatial genetic structure up to 75 m. The highest Fij value was observed in the 1.25–1.75 m distance class, suggesting the greatest degree of genetic relatedness at this spatial scale. Beyond 75 m, Fij values gradually declined and became non-significant, reflecting a reduction in genetic relatedness with increasing distance. The spatial distribution of individual genetic variation (Figure 3B) revealed clear spatial heterogeneity. Regions with higher genetic variation were mainly distributed in the northwest, whereas regions with lower variation appeared in the central and southeastern parts of the study area. These patterns indicate the non-random spatial clustering of genotypes, implying restricted gene flow and localized genetic differentiation within the population.
Spatial genetic autocorrelation analyses based on both SSR and ISSR markers revealed significant fine-scale genetic structure within the T. chinensis population (Figure 4). For SSR data, significant positive spatial autocorrelation was detected among individuals within 60 m, with weaker but still significant autocorrelation observed between 60 m and 120 m. Regression analysis of Fij against log-transformed geographic distance further confirmed this pattern. All four SSR loci exhibited significantly negative slopes (p < 0.001), indicating a consistent decline in genetic relatedness with increasing distance. The multilocus regression slope was −0.0210 (95% CI: −0.00239 to +0.00177), reflecting a clear spatial decay in genetic structure. Similarly, ISSR-based autocorrelation analysis showed significant positive r-values within the first 100 m, implying that most gene dispersal via pollen or seeds likely occurs within this spatial range.

3.4. Bottleneck and Effective Population Size

Bottleneck analysis provided no evidence of recent population reductions in T. chinensis, as suggested by the normal L-shaped allele frequency distribution (Figure S2) and non-significant heterozygosity excess under the Infinite Allele Model (IAM) and Stepwise Mutation Model (SMM) [20] (Table S6). The sign test and Wilcoxon test were non-significant under the IAM, and only marginally significant under the SMM, with locus E3 exhibiting a notable heterozygosity deficiency under SMM (DH/sd = −5.673, p < 0.001), which may reflect localized demographic instability [23]. Estimates of effective population size, derived from allele frequency data across different thresholds, ranged from 5.6 to 12.9.

4. Discussion

4.1. Genetic Diversity

Species on isolated fragmented islands generally exhibit lower genetic diversity compared to those in large continuous populations, primarily due to smaller population sizes and limited gene flow, which lead to genetic drift and inbreeding effects [24,25]. However, the T. chinensis population on Wudi Seashell Island, despite its small size, maintains relatively high genetic diversity. Based on the analysis of four SSR markers, each locus amplified an average of 11.75 alleles, with an observed heterozygosity (Ho) of 0.702 and expected heterozygosity (He) of 0.754, values higher than those observed in other large, continuous T. chinensis populations [7,14]. This suggests that, despite some spatial isolation, this T. chinensis population still retains a significant amount of genetic variation. Additionally, ISSR marker analysis further supports this finding, with an He of 0.402 and a diversity index of 0.585, both higher than those found in other T. chinensis populations The polymorphic locus rate for ISSR was as high as 97.87%, which is also higher than the 79.5–85% polymorphism reported by Jiang et al. [6,12]. These results indicate that, despite the harsh environmental conditions on Wudi Seashell Island, the T. chinensis population maintains a healthy level of genetic diversity.

4.2. Paternity Analysis and Mating System

This study provides the first parentage analysis of T. chinensis, revealing seed and pollen dispersal distances of up to 948 m and 447 m, respectively. Most seed dispersal occurred within 150 m, while pollen movement averaged 167 m. The seed dispersal distances are notably greater than those reported for mangrove and other terrestrial species [26,27,28], likely due to wind-mediated seed dispersal facilitated by cottony appendages, frequent storms, and flat terrain. Additionally, the seeds’ tolerance to high salinity [29] enables their colonization of saline coastal habitats. Although T. chinensis is insect-pollinated [30], the low vegetation density (4.6/ha) and sparse mate availability on Wudi Seashell Island may drive pollinators to travel farther, resulting in pollen dispersal distances comparable to wind-pollinated species [28,31].
The species exhibits a mixed mating system, with a single-locus outcrossing rate of 0.210 and a multilocus rate of 0.554. While clumped growth may increase inbreeding, insect pollination enhances gene flow. Together, these mechanisms help to maintain the high genetic diversity observed in this isolated island population, despite its small size and environmental constraints.

4.3. Spatial Genetic Structure

Spatial genetic structure analysis indicates that T. chinensis populations exhibit significant fine-scale genetic structuring within a 75 m range, suggesting limited gene flow due to restricted seed and pollen dispersal distances. This is consistent with the findings of Zhu et al. [7], who demonstrated that local habitat conditions, such as soil salinity, significantly influence the genetic structure of T. chinensis populations in the Yellow River Delta. Spatial autocorrelation patterns derived from both SSR and ISSR markers consistently revealed significant structuring at short distances, indicating that both marker types reliably capture the fine-scale spatial genetic patterns of this species. Meanwhile, Liang et al. [5] found low genetic differentiation among T. chinensis populations along the Yellow River, indicating that the river does not act as a barrier to gene flow. Therefore, while T. chinensis exhibits localized genetic structuring due to limited dispersal capabilities, larger-scale factors like hydrological systems may facilitate broader gene flow, contributing to genetic homogeneity across more extensive geographic areas.

5. Conclusions

This study provides a comprehensive assessment of the genetic diversity, mating system, and spatial genetic structure of T. chinensis on Wudi Seashell Island, a geographically isolated and environmentally harsh coastal habitat. Despite its limited population size and spatial fragmentation, T. chinensis maintains a high level of genetic diversity, as evidenced by both SSR and ISSR markers. This is likely attributed to a mixed mating system with moderate outcrossing rates and effective pollen- and seed-mediated gene flows. Fine-scale spatial genetic structure was detected within 75 m, reflecting restricted gene dispersal at the local scale. However, long-distance dispersal events facilitated by strong wind, storm surges, and the flat terrain may contribute to occasional gene exchange across greater distances. These findings highlight the species’ resilience and adaptive potential, supporting its continued use in coastal afforestation and ecological restoration in newly formed saline–alkali lands.

Supplementary Materials

The following are available online at https://www.mdpi.com/article/10.3390/d17040285/s1, Figure S1: Electrophoresis gel images of T. chinensis samples. (A) Genomic DNA quality check; (B) ISSR amplification products; (C) SSR amplification products; Figure S2: Mode-shift indicator (L-shaped distribution). Table S1: List of abbreviations; Table S2: Morphological data of T. chinensis samples; Table S3: DNA concentrations measured for T. chinensis samples; Table S4: ISSR primers used in this study; Table S5: SSR primers used in this study; Table S6: Bottleneck analysis summary.

Author Contributions

Conceptualization, X.L. and S.Y.; methodology, X.L. and S.Y.; validation, B.Z. and M.H.; formal analysis, B.Z. and X.L.; investigation, X.L. and S.Y.; data curation, B.Z. and X.L.; writing—original draft preparation, B.Z. and X.L.; writing—review and editing, X.L., M.H., and S.Y.; visualization, X.L.; supervision, S.Y.; project administration, S.Y.; funding acquisition, S.Y. All authors have read and agreed to the published version of the manuscript.

Funding

This research was funded by the National Key Research and Development Program of China, grant number (2017YFC0506103); the Ocean Public Fund Research Project Grants of State Oceanic Administration, grant number (No. 201305021-2); the National Natural Science Foundation of China (No. 30972334); and the Fujian Province Natural Science Foundation, grant number (No. 2023J011385).

Institutional Review Board Statement

Not applicable.

Data Availability Statement

Data contained within the article and supplementary material.

Acknowledgments

We thank editors and three anonymous reviewers for their suggestions.

Conflicts of Interest

The authors declare no conflicts of interest.

References

  1. Jiang, Z.Y.; Yang, A.-A.; Zhang, H.-G.; Wang, W.-B.; Zhang, R.-H. Population structure and genetic diversity of Tamarix chinensis as revealed with microsatellite markers in two estuarine flats. Peerj 2023, 11, e15882. [Google Scholar] [CrossRef] [PubMed]
  2. Zhao, J.; Xu, L.; Xie, H.; Zhao, D.; Huang, M. RAPD analysis of population genetic diversity of Tamarix chinensis in Yellow River delta. J. Nanjing For. Univ. 2008, 32, 56–60. [Google Scholar] [CrossRef]
  3. Xu, Z.; Li, R.; Dou, W.; Wen, H.; Yu, S.; Wang, P.; Ning, L.; Duan, J.; Wang, J. Plant Diversity Response to Environmental Factors in Yellow River Delta, China. Land 2024, 13, 264. [Google Scholar] [CrossRef]
  4. Hughes, A.R.; Inouye, B.D.; Johnson, M.T.J.; Underwood, N.; Vellend, M. Ecological consequences of genetic diversity. Ecol. Lett. 2008, 11, 609–623. [Google Scholar] [CrossRef]
  5. Liang, H.; Liu, C.; Li, Y.; Wang, Y.; Kong, Y.; Quan, J.; Yang, X. Low population genetic differentiation in two Tamarix species (Tamarix austromongolica and Tamarix chinensis) along the Yellow River. Genetica 2019, 147, 13–22. [Google Scholar] [CrossRef] [PubMed]
  6. Jiang, Z.; Chen, Y.; Bao, Y. Population genetic structure of Tamarix chinensis in the Yellow River Delta, China. Plant Syst. Evol. 2012, 298, 147–153. [Google Scholar] [CrossRef]
  7. Zhu, Z.; Zhang, L.; Gao, L.; Tang, S.; Zhao, Y.; Yang, J. Local habitat condition rather than geographic distance determines the genetic structure of Tamarix chinensis populations in Yellow River Delta, China. Tree Genet. Genomes 2016, 12, 14. [Google Scholar] [CrossRef]
  8. Sun, L.K.; Liu, G.X.; Lu, Y.L.; Zhang, B.G.; Zhang, G.S. Molecular data and ecological niche modelling reveal the phylogeographic pattern of the widespread shrub Tamarix chinensis Lour. (Tamaricaceae) in China. Kew Bull. 2020, 75, 41. [Google Scholar] [CrossRef]
  9. Bacles, C.F.E.; Ennos, R.A. Paternity analysis of pollen-mediated gene flow for Fraxinus excelsior L. in a chronically fragmented landscape. Heredity 2008, 101, 368–380. [Google Scholar] [CrossRef]
  10. Geng, Q.; Lian, C.; Goto, S.; Tao, J.; Kimura, M.; Islam, S.; Hogetsu, T. Mating system, pollen and propagule dispersal, and spatial genetic structure in a high-density population of the mangrove tree Kandelia candel. Mol. Ecol. 2008, 17, 4724–4739. [Google Scholar] [CrossRef]
  11. Yue, X.Y.; Yue, W. Ndvi Dynamics and Its Relationship with Climatic Factors in the Shell Ridge Island of the Yellow River Delta. Appl. Ecol. Environ. Res. 2024, 22, 2809–2819. [Google Scholar] [CrossRef]
  12. Jiang, Z.-M.; Chen, Y.-X.; Bao, Y. Genetic Structure and Population Differentiation of Tamarix chinensis in Yellow Rive Delta, China. Plant Divers. 2011, 33, 403–408. [Google Scholar]
  13. Gaskin, J.F.; Pepper, A.E.; Manhart, J.R. Isolation and characterization of 10 polymorphic microsatellites in saltcedars (Tamarix chinensis and Tamarix ramosissima). Mol. Ecol. Notes 2006, 6, 1147–1149. [Google Scholar] [CrossRef]
  14. Zhang, R.; Wen, Q.; Ku, L.-A. Development and characterization of genomic SSR markers for Tamarix chinensis (Tamaricaceae). Appl. Plant Sci. 2019, 7, e1219. [Google Scholar] [CrossRef]
  15. Yeh, F.C.; Boyle, T.J.B. Population genetic analysis of codominant and dominant markers and quantitative traits. Belg. J. Bot. 1997, 129, 157. [Google Scholar]
  16. Peakall, R.; Smouse, P.E. GenAlEx 6.5: Genetic analysis in Excel. Population genetic software for teaching and research—An update. Bioinformatics 2012, 28, 2537–2539. [Google Scholar] [CrossRef] [PubMed]
  17. Ritland, K. Extensions of models for the estimation of mating systems using n independent loci. Heredity 2002, 88, 221–228. [Google Scholar] [CrossRef]
  18. Hardy, O.; Vekemans, X. SPAGeDI: A versatile computer program to analyse spatial genetic structure at the individual or population levels. Mol. Ecol. Notes 2002, 2, 618–620. [Google Scholar] [CrossRef]
  19. Miller, M. ALLELES IN SPACE (AIS): Computer software for the joint analysis of interindividual spatial and genetic information. J. Hered. 2005, 96, 722–724. [Google Scholar] [CrossRef]
  20. Piry, S.; Luikart, G.; Cornuet, J.M. Computer note. BOTTLENECK: A computer program for detecting recent reductions in the effective size using allele frequency data. J. Hered. 1999, 90, 502–503. [Google Scholar] [CrossRef]
  21. Do, C.; Waples, R.S.; Peel, D.; Macbeth, G.M.; Tillett, B.J.; Ovenden, J.R. NeEstimator v2: Re-implementation of software for the estimation of contemporary effective population size (Ne) from genetic data. Mol. Ecol. Resour. 2014, 14, 209–214. [Google Scholar] [CrossRef]
  22. Md, S.I.; Chunlan, L.; Norikazu, K.; Taizo, H. Analysis of the mating system, reproductive characteristics, and spatial genetic structure in a natural mangrove tree (Bruguiera gymnorrhiza) population at its northern biogeographic limit in the southern Japanese archipelago. J. For. Res. 2015, 20, 293–300. [Google Scholar] [CrossRef]
  23. Luikart, G.; Allendorf, F.W.; Cornuet, J.M.; Sherwin, W.B. Distortion of allele frequency distributions provides a test for recent population bottlenecks. J. Hered. 1998, 89, 238–247. [Google Scholar] [CrossRef]
  24. Pinto, A.V.; Hansson, B.; Patramanis, I.; Morales, H.E.; van Oosterhout, C. The impact of habitat loss and population fragmentation on genomic erosion. Conserv. Genet. 2024, 25, 49–57. [Google Scholar] [CrossRef]
  25. Baldauf, C.; Ciampi-Guillardi, M.; Aguirra, T.J.; Corrêa, C.E.; dos Santos, F.A.M.; de Souza, A.P.; Sebbenn, A.M. Genetic diversity, spatial genetic structure and realised seed and pollen dispersal of Himatanthus drasticus (Apocynaceae) in the Brazilian savanna. Conserv. Genet. 2014, 15, 1073–1083. [Google Scholar] [CrossRef]
  26. Bittencourt, J.V.M.; Sebbenn, A.M. Patterns of pollen and seed dispersal in a small, fragmented population of the wind-pollinated tree Araucaria angustifolia in southern Brazil. Heredity 2007, 99, 580–591. [Google Scholar] [CrossRef]
  27. Slatkin, M. Gene flow and the geographic structure of natural populations. Science 1987, 236, 787–792. [Google Scholar] [CrossRef]
  28. Tambarussi, E.V.; Boshier, D.; Vencovsky, R.; Freitas, M.L.M.; Sebbenn, A.M. Paternity analysis reveals significant isolation and near neighbor pollen dispersal in small Cariniana legalis Mart. Kuntze populations in the Brazilian Atlantic Forest. Ecol. Evol. 2015, 5, 5588–5600. [Google Scholar] [CrossRef]
  29. Cui, B.; Yang, Q.; Zhang, K.; Zhao, X.; You, Z. Responses of saltcedar (Tamarix chinensis) to water table depth and soil salinity in the Yellow River Delta, China. Plant Ecol. 2010, 209, 279–290. [Google Scholar] [CrossRef]
  30. Wang, Z.; Liu, L.; Fang, Y. Study on the Flowering Characteristics and Pollination Ecology of Tamarix chinensis in the Yellow River Delta. J. Trop. Subtrop. Bot. 2005, 13, 353–357. [Google Scholar]
  31. Sebbenn, A.M.; Carvalho, A.C.M.; Freitas, M.L.M.; Moraes, S.M.B.; Gaino, A.P.S.C.; da Silva, J.M.; Jolivet, C.; Moraes, M.L.T. Low levels of realized seed and pollen gene flow and strong spatial genetic structure in a small, isolated and fragmented population of the tropical tree Copaifera langsdorffii Desf. Heredity 2011, 106, 134–145. [Google Scholar] [CrossRef]
Figure 1. Location of study area on Wudi Seashell Island (Shandong, China) and mapped positions of adult and sapling individuals of T. chinensis.
Diversity 17 00285 g001
Figure 2. Dispersal distances of T. chinensis in study area: (A) seed dispersal; (B) pollen flow.
Diversity 17 00285 g002
Figure 3. Spatial genetic structure of T. chinensis based on SSR data. (A) Pairwise kinship coefficients Fij across distance classes with 95% confidence intervals.; (B) interpolated genetic landscape of individual-level genetic variation via AIS.
Diversity 17 00285 g003
Figure 4. Spatial genetic autocorrelation of T. chinensis based on (A) SSR and (B) ISSR markers. Solid lines indicate autocorrelation coefficients (r); dashed lines show 95% confidence intervals across 20 distance classes (20 m each).
Diversity 17 00285 g004
Table 1. Characteristics of ISSR markers for all individuals of T. chinensis in study area. N, sample size; Na, number of alleles; Ne, effective number of alleles; I, Shannon’s information index; He, expected heterozygosity; uHe, unbiased expected heterozygosity; PPL, percentage of polymorphic loci. All abbreviations defined in Supplementary Table S1.
LocusNNaNeIHeuHePPL
8231071.9091.7040.5660.3930.395-
8241071.8571.6250.5160.3540.356-
8341072.0001.6790.5830.3960.398-
8351072.0001.7820.6120.4250.427-
8401072.0001.8690.6550.4620.465-
8411072.0001.5920.5290.3520.353-
8441072.0001.6950.5800.3950.397-
8731072.0001.7530.6130.4240.426-
8801072.0001.7610.6110.4230.425-
8881072.0001.7250.5930.4070.409-
mean1071.9791.7150.5850.4020.40497.87%
SE-0.0150.0260.0130.0110.011-
Table 2. Genetic diversity of T. chinensis based on SSR markers in study area. N, sample size; Na: number of alleles; Ne: effective number of alleles; I: Shannon’s information index; He: expected heterozygosity; Ho: observed heterozygosity; Fi: individual inbreeding coefficient; Fis: inbreeding coefficient within subpopulations. All abbreviations defined in Supplementary Table S1.
LocusNNaNeIHeHoFiFis
E1109125.481.9510.81770.881−0.0780.137
E210982.991.3820.66550.5140.2290.037
E3109123.421.5900.70770.6790.0410.091
E4109146.132.1290.83690.7160.1460.054
mean10911.54.511.7630.75690.6970.0790.078
Table 3. Characteristics of SSR markers for all individuals of T. chinensis in study area. PCI, polymorphic information content; NE-1P and NE-2P, exclusion probability of first and second parent, respectively; NE-PP, non-exclusion probability; F(Null), null allele frequency estimate. All abbreviations defined in Supplementary Table S1.
LocusNPICNE-1PNE-2PNE-PPF(Null)
E11090.7920.5290.3550.171−0.046
E21090.6180.7420.5700.3800.134
E31090.6630.6910.5170.3210.016
E41090.8150.4860.3190.1410.077
Mean1090.7220.6120.4400.2530.045
Combined--0.8680.9670.997-
Table 4. Mating system parameters for all trees of T. chinensis in study area.
Grouptstmtm − ts
Saplings0.455(0.525)0.492(0.785)0.037
Adult individuals0.369(0.439)0.583(0.553)0.216
All0.210(0.945)0.554(1.468)0.343
Disclaimer/Publisher’s Note: The statements, opinions and data contained in all publications are solely those of the individual author(s) and contributor(s) and not of MDPI and/or the editor(s). MDPI and/or the editor(s) disclaim responsibility for any injury to people or property resulting from any ideas, methods, instructions or products referred to in the content.

