
DNA Barcoding Southwestern Atlantic Skates: A 20-Year Effort in Building a Species Identification Library

 , , , , and
Abstract
1. Introduction
2. Materials and Methods
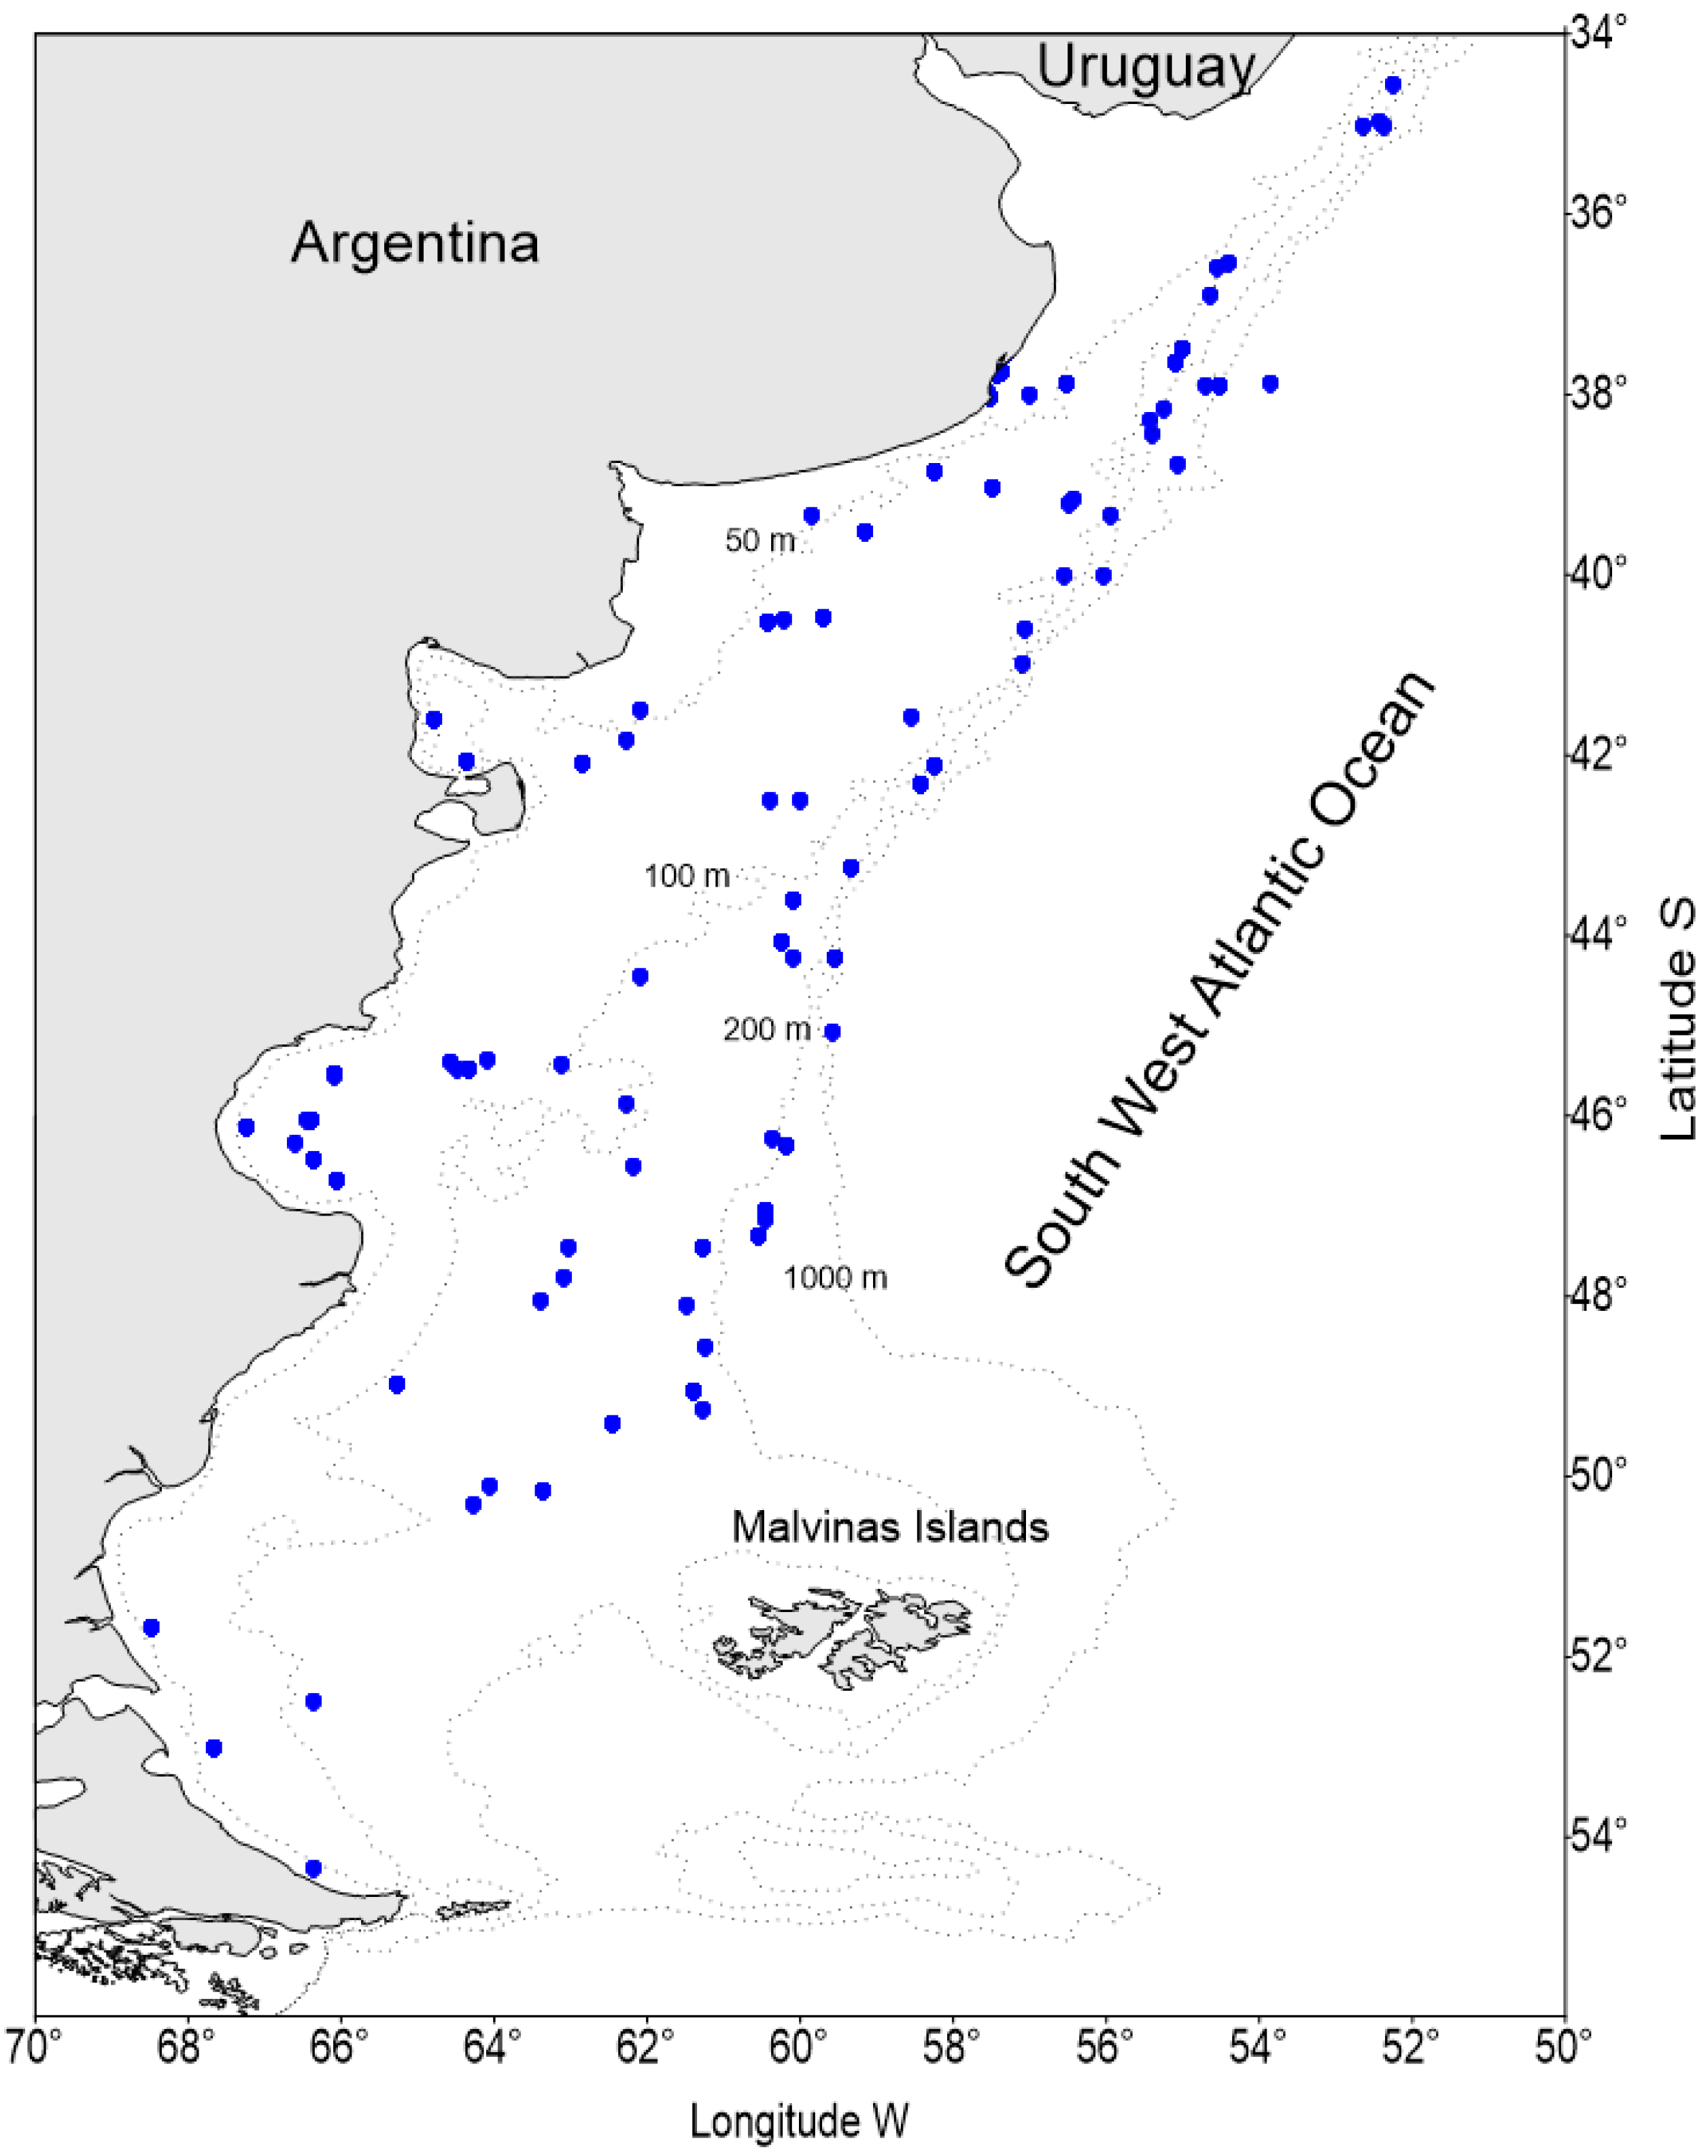
2.1. Sample Collection
2.2. DNA Extraction, COI Amplification, and Sequencing
2.3. Data Analysis
2.3.1. Distance-Based Analyses
2.3.2. Cluster and Phylogenetic Analyses
2.3.3. Lineage Delimitation Analysis
2.3.4. Comparative Analysis of COI Sequences of All Skates Registered in the SWA (BIN Discordance Report)
2.3.5. Population Structure
2.3.6. Repository
3. Results
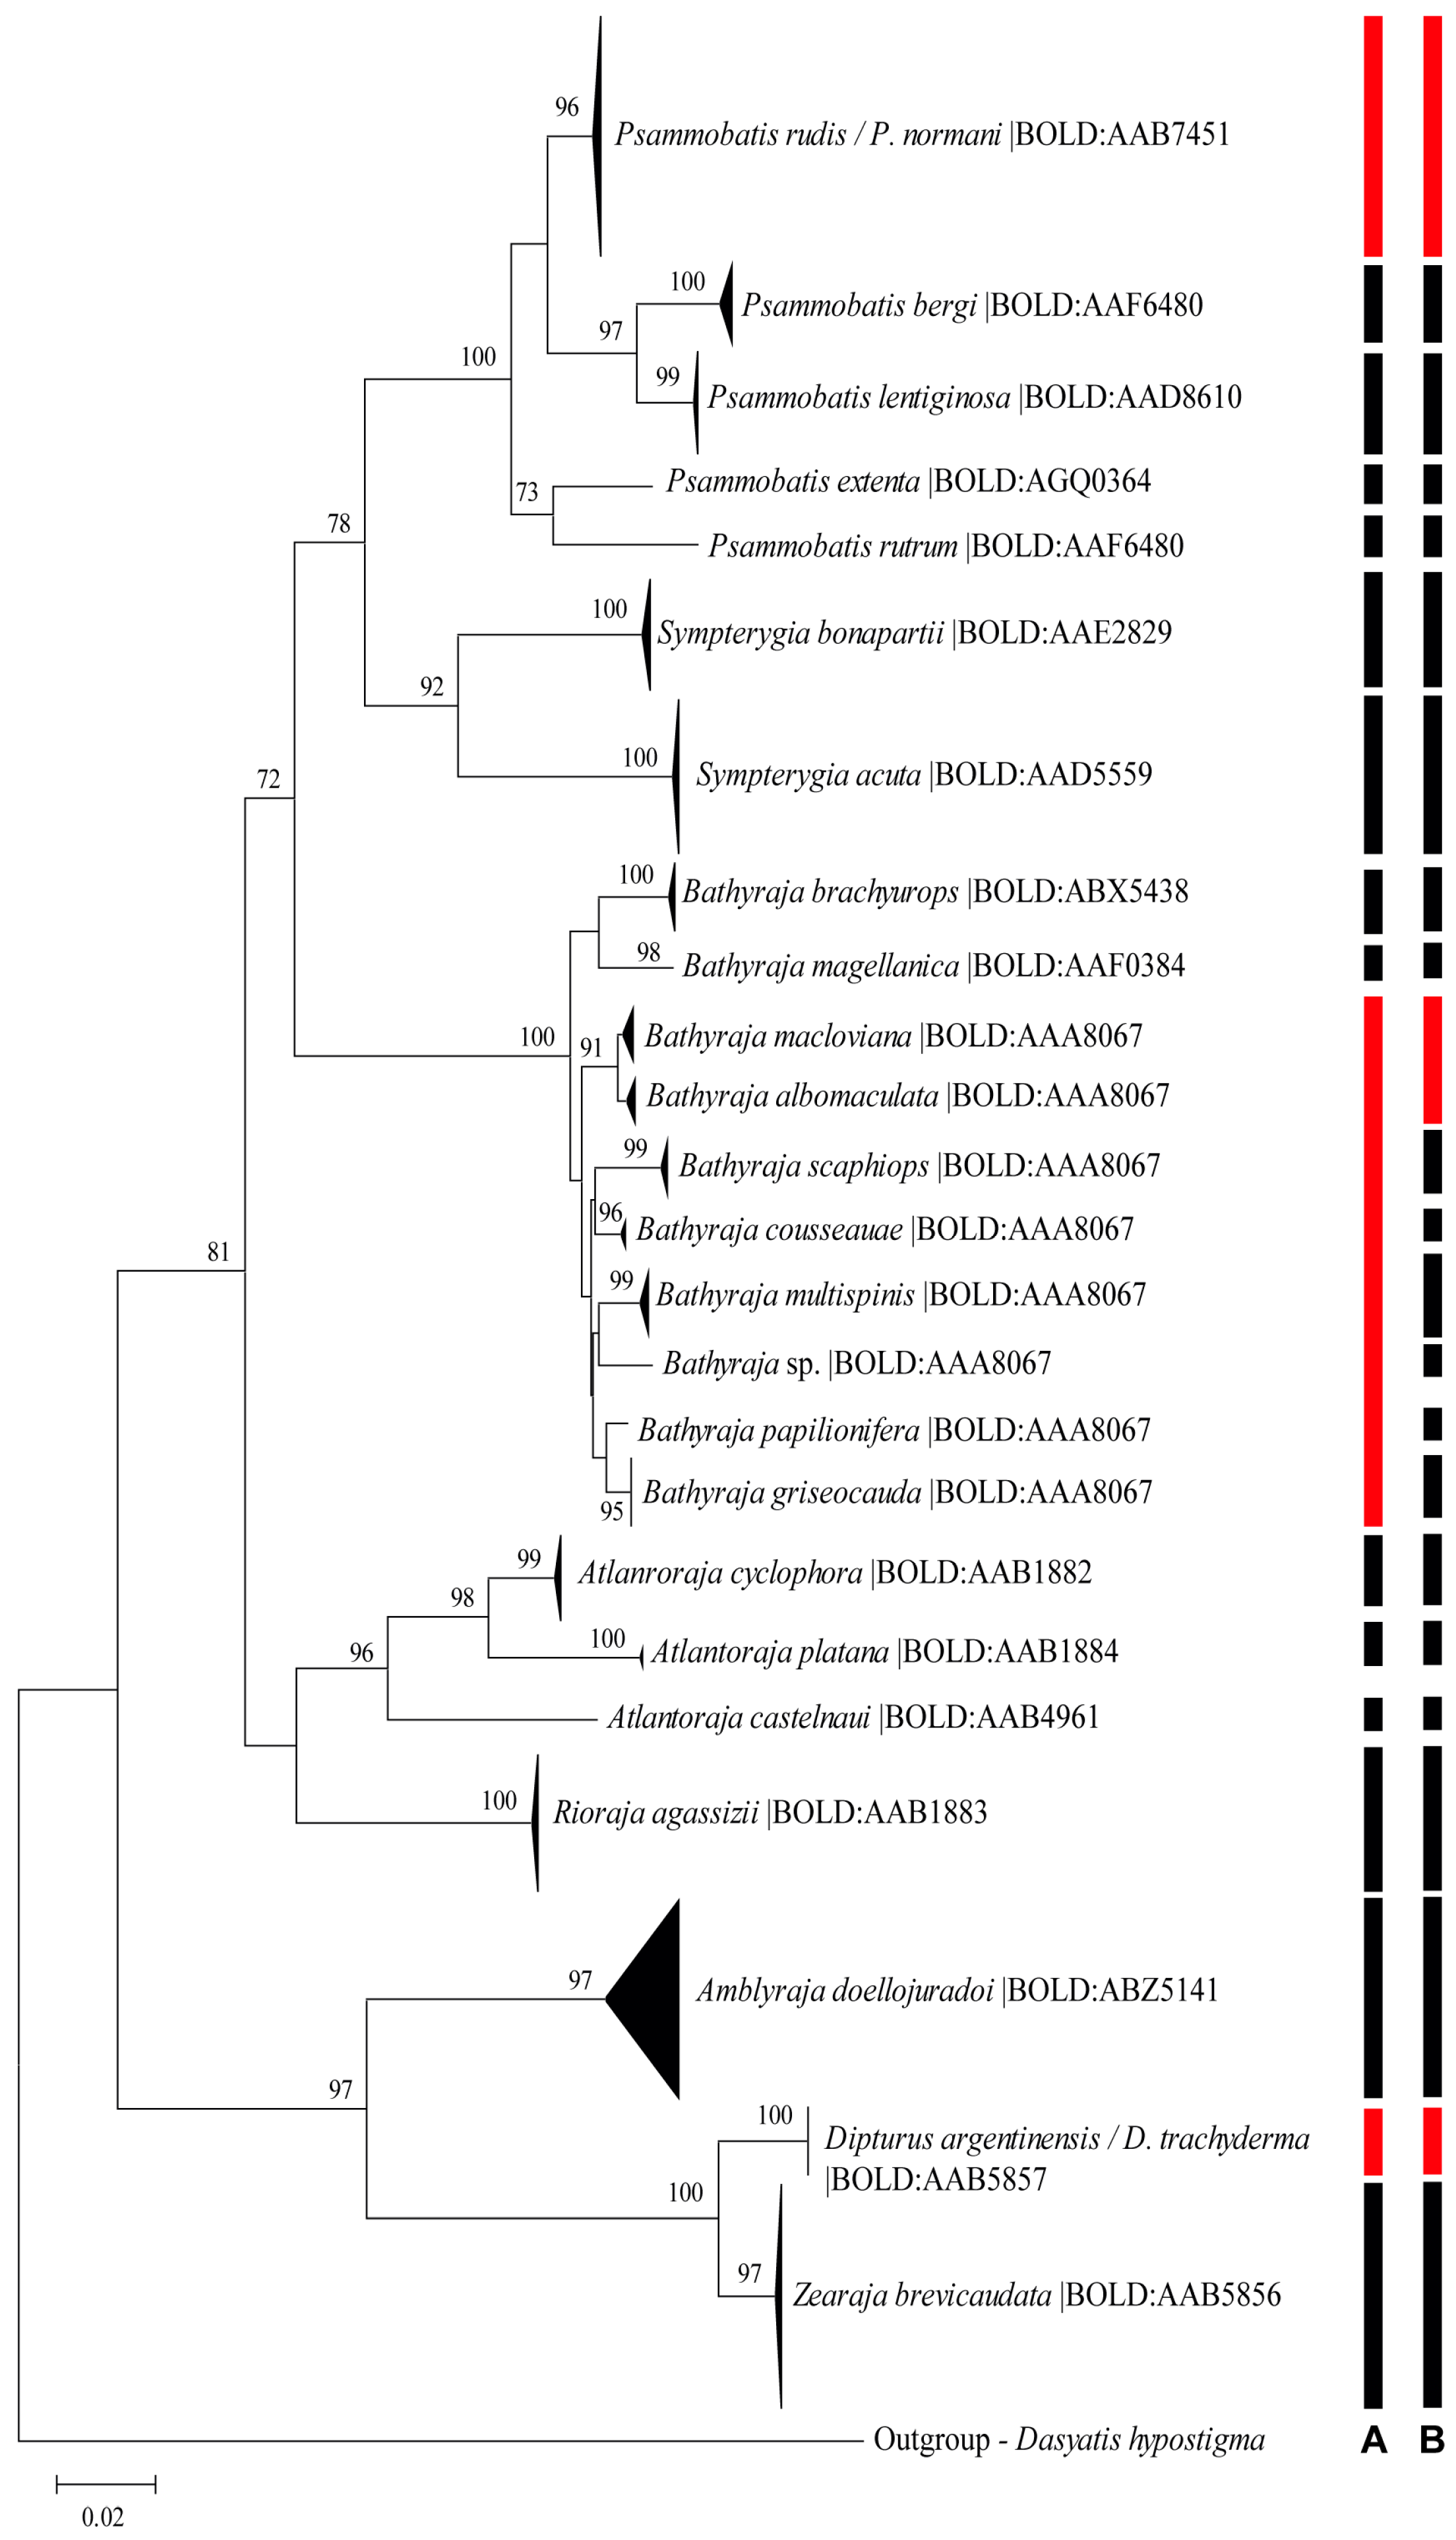
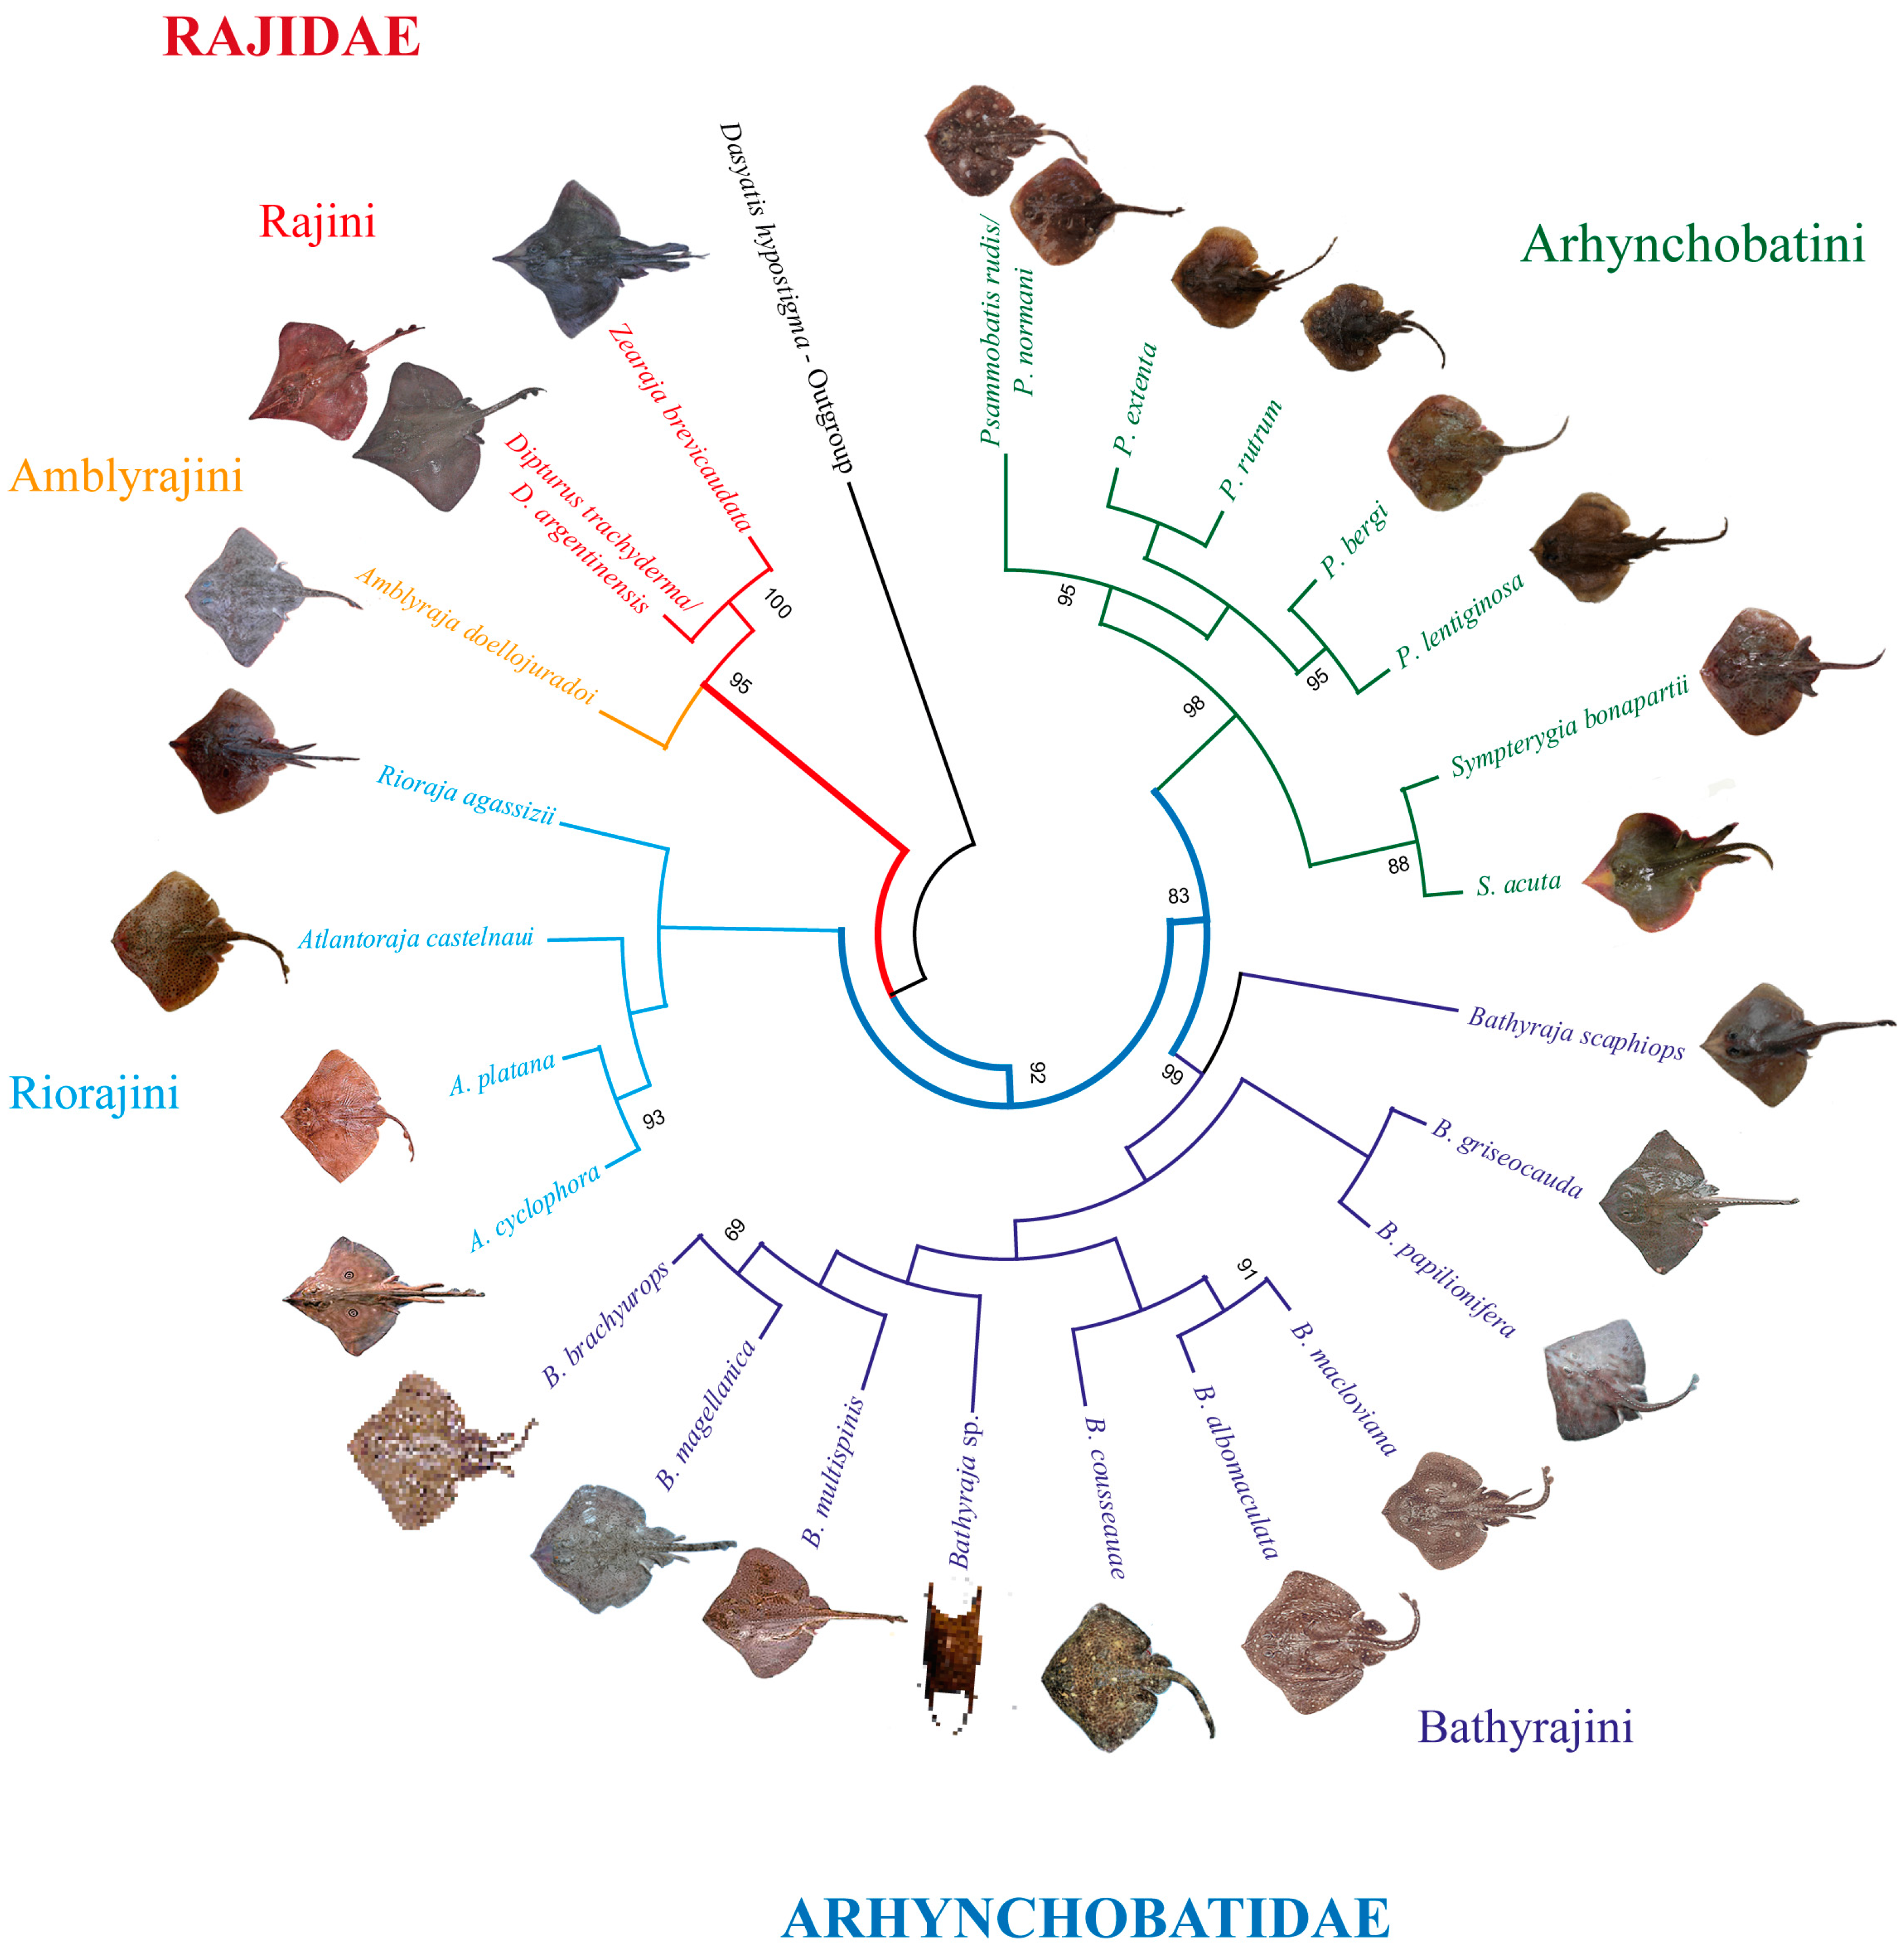
3.1. Cluster, Phylogenetic, and Lineage Delimitation Analyses
3.2. Comparative Analysis of COI Sequences of All Skates Registered in SWA (BIN Discordance Report)
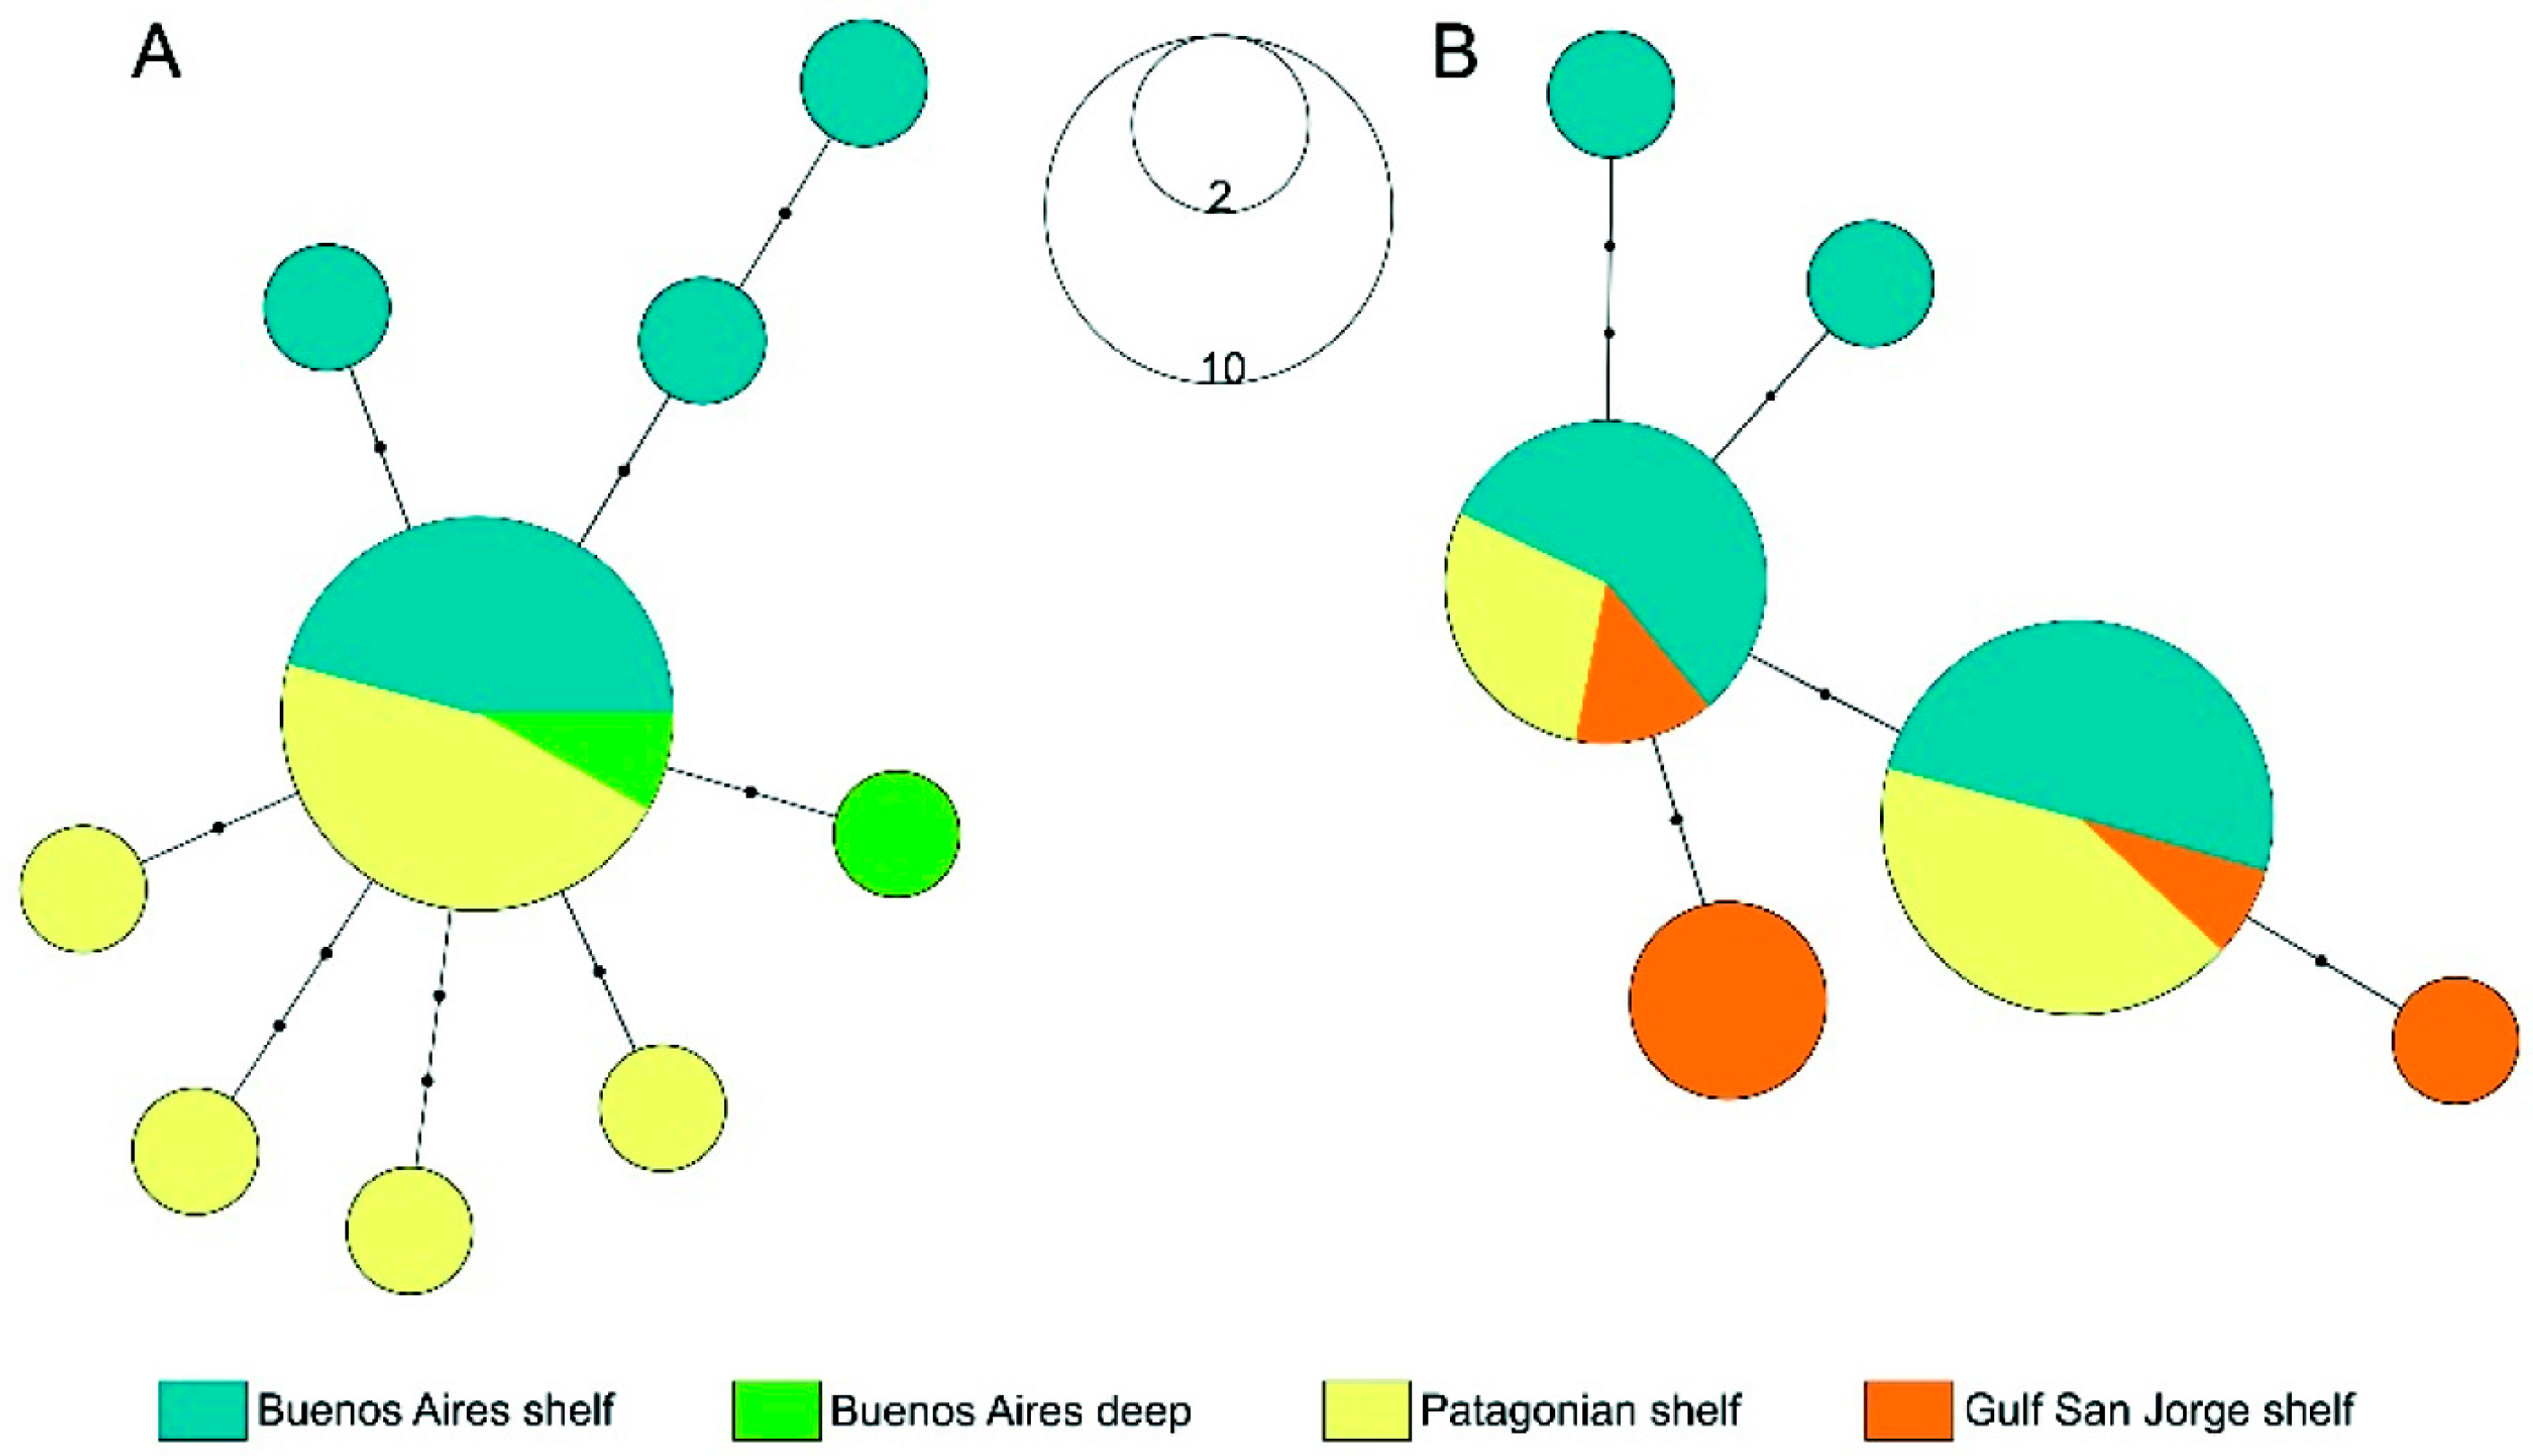
3.3. Population Structure of Some Widespread Species
3.4. Skate Egg Case Identification
4. Discussion
5. Conclusions
Supplementary Materials
Author Contributions
Funding
Institutional Review Board Statement
Informed Consent Statement
Data Availability Statement
Acknowledgments
Conflicts of Interest
References
- McEachran, J.D.; Miyake, T. Phylogenetic interrelationships of skates: A working hypothesis (Condrichthyes: Rajoidei). In Elasmobranchs as Living Resources: Advances in the Biology, Ecology, Systematics and the Status of Fisheries, 1st ed.; Pratt, H.L., Gruber, S.H., Taniuchi, T., Eds.; NOAA: Silver Spring, MD, USA, 1990; pp. 285–304. [Google Scholar]
- Last, P.R.; Gledhill, D.C. The Maugean skate, Zearaja maugeana sp. nov. (Rajiformes: Rajidae)—A micro-endemic, Gondwanan relict from Tasmanian estuaries. Zootaxa 2007, 1494, 45–65. [Google Scholar] [CrossRef]
- Last, P.R.; Séret, B.; Stehmann, M.F.W.; Weigmann, S. Skates, Family Rajidae. In Rays of the World, 1st ed.; Last, P.R., White, W.T., de Carvalho, M.R., Séret, B., Stehmann, M.F.W., Naylor, G.J.P., Eds.; CSIRO Publishing: Melbourne, Australia, 2016; Volume 1, pp. 204–363. [Google Scholar]
- Last, P.R.; Stehmann, M.F.W.; Séret, B.; Weigmann, S. Softnose skates, family Arhynchobatidae. In Rays of the World, 1st ed.; Last, P.R., White, W.T., de Carvalho, M.R., Séret, B., Stehmann, M.F.W., Naylor, G.J.P., Eds.; CSIRO Publishing: Melbourne, Australia, 2016; Volume 1, pp. 364–472. [Google Scholar]
- Weigmann, S. Annotated checklist of the living sharks, batoids and chimaeras (Chondrichthyes) of the world, with a focus on biogeographical diversity. J. Fish. Biol. 2016, 88, 837–1037. [Google Scholar] [CrossRef] [PubMed]
- Weigmann, S.; Didier, D.; Finucci, B.; Naylor, G.J.P.; Séret, B.; Straube, N.; Vaz, D.F.B. 2|Biodiversity, Taxonomy, and Systematics. In The Global Status of Sharks, Rays, and Chimaeras, 1st ed.; Jabado, R.W., Morata, A.Z.A., Bennett, R.H., Finucci, B., Ellis, J.R., Fowler, S.L., Grant, M.I., Barbosa Martins, A.P., Sinclair, S.L., Eds.; International Union for Conservation of Nature and Natural Resources: Gland, Switzerland, 2024; pp. 5–28. [Google Scholar] [CrossRef]
- Séret, B.; Last, P.R.; Weigmann, S.; Stehmann, M.F.W. Legskates, family Anacanthobatidae. In Rays of the World, 1st ed.; Last, P.R., White, W.T., Carvalho, M.R., Séret, B., Stehmann, M.F.W., Naylor, G.J.P., Eds.; CSIRO Publishing: Melbourne, Australia, 2016; Volume 1, pp. 494–508. [Google Scholar]
- Van der Laan, R.; Fricke, R.; Eschmeyer, W.N. Eschmeyer’s Catalog of Fishes: Classification. Available online: http://www.calacademy.org/scientists/catalog-of-fishes-classification/ (accessed on 2 February 2025).
- Compagno, L.J.V. Shark exploitation and conservation. In Elasmobranchs as Living Resources: Advances in the Biology, Ecology, Systematics and the Status of the Fisheries, 1st ed.; Pratt, H.L., Gruber, S.H., Taniuchi, T., Eds.; NOAA Technical Report NMFS 90; Department of Commerce: Springfield, VA, USA, 1990; pp. 391–414. [Google Scholar]
- Pratt, H.L.; Cassey, C. Shark reproductive strategies as a limiting factor in directed fisheries, with a review of Holden’s method of estimating growth parameters. In Elasmobranchs as Living Resources: Advances in the Biology, Ecology, Systematics and the Status of the Fisheries, 1st ed.; Pratt, H.L., Gruber, S.H., Taniuchi, T., Eds.; NOAA Technical Report NMFS 90; Department of Commerce: Springfield, VA, USA, 1990; pp. 97–109. [Google Scholar]
- Musick, J.A. Introduction: Management of sharks and their relatives (Elasmobranchii). In Elasmobranch Fisheries Management Techniques, 1st ed.; Musick, J.A., Bonfil, R., Eds.; Asia Pacific Economic Cooperation Publication: Singapore, 2004; pp. 1–6. [Google Scholar]
- Sánchez, R.P.; Navarro, G.; Calvo, E.; Del Castillo, F. La pesca y comercialización de condrictios en la Argentina. Aportes de la Dirección Nacional de Planificación Pesquera para la elaboración del Plan de Acción Nacional. In Contribuciones Sobre Biología, Pesca y Comercialización de Tiburones en la Argentina. Aportes Para la Elaboración del Plan de Acción Nacional, 1st ed.; Whöler, O.C., Cedrola, P., Cousseau, M.B., Eds.; Consejo Federal Pesquero: Buenos Aires, Argentina, 2011; Volume 1, pp. 151–184. [Google Scholar]
- Davidson, L.N.K.; Krawchuk, M.A.; Dulvy, N.K. Why have global shark and ray landings declined: Improved management or overfishing? Fish Fish. 2016, 17, 438–458. [Google Scholar] [CrossRef]
- Navarro, G.; Rozycki, V.; Monsalvo, M. Estadísticas de la Pesca Marina en la Argentina: Evolución de los Desembarques 2015–2022, 1st ed.; Ministerio de Agricultura, Ganadería y Pesca de la Nación: Ciudad Autónoma de Buenos Aires, Argentina, 2022; p. 163. [Google Scholar]
- Menni, R.C.; Stehmann, M.F.W. Distribution, environment and biology of batoid fishes off Argentina, Uruguay and Brazil. A review. Rev. Mus. Argent. Cienc. Nat. 2000, 2, 69–109. [Google Scholar] [CrossRef]
- Cousseau, M.B.; Figueroa, D.E.; Díaz de Astarloa, J.M.; Mabragaña, E.; Lucifora, L.O. Rayas, Chuchos y Otros Batoideos del Atlántico Sudoccidental (34°S-55°S); Publicaciones Especiales INIDEP: Mar del Plata, Argentina, 2007; 102p. [Google Scholar]
- Díaz de Astarloa, J.M.; Mabragaña, E.; Hanner, R.; Figueroa, D.E. Morphological and molecular evidence for a new species of longnose skate (Rajiformes: Rajidae: Dipturus) from Argentinean waters based on DNA barcoding. Zootaxa 2008, 1921, 35–46. [Google Scholar] [CrossRef]
- Mabragaña, E.; González-Castro, M.; Gabbanelli, V.; Vazquez, D.M.; Díaz de Astarloa, J.M. Polymorphism in Conservative Structures? The Scapulocoracoids in Skates Genus Psammobatis (Chondrichthyes, Arhynchobatidae) and the Validity of P. parvacauda. Front. Mar. Sci. 2020, 7, 291. [Google Scholar] [CrossRef]
- Figueroa, D.E.; Belleggia, M.; Andreoli, G.; Izzo, S.; Bovcon, N.; Pérez-Losada, M.; De Wysiecki, A.M.; Colonello, J.H.; Trucco, M.I. A Faunistic Revision of Longnose Skates of the Genus Dipturus (Rajiformes: Rajidae) from the Southern Southwestern Atlantic Ocean, Based on Morphological and Molecular Evidence. Diversity 2024, 16, 146. [Google Scholar] [CrossRef]
- Coggan, R.A.; Nolan, C.P.; George, M.J.A. Exploratory deep-sea fishing in the Falkland Islands, south-western Atlantic. J. Fish Biol. 1996, 49 (Suppl. A), 298–310. [Google Scholar] [CrossRef]
- Weigmann, S.; Stehmann, M.F.W.; Bürkel, D.L. Order Rajiformes—Skates. In Fishes of the Southern Ocean, 2nd ed.; Gon, O., Gon, J., Eds.; NISC (Pty) Ltd.: Grahamstown, South Africa, in press.
- Dulvy, N.K.; Fowler, S.L.; Musick, J.A.; Cavanagh, R.D.; Kyne, P.M.; Harrison, L.R.; Carlson, J.K.; Davidson, L.N.; Fordham, S.V.; Francis, M.P.; et al. Extinction risk and conservation of the world’s sharks and rays. eLife 2014, 3, e00590. [Google Scholar] [CrossRef]
- Dulvy, N.K.; Pacoureau, N.; Rigby, C.L.; Pollom, R.A.; Jabado, R.W.; Ebert, D.A.; Finucci, B.; Pollock, C.M.; Cheok, J.; Derrick, D.H.; et al. Overfishing drives over one-third of all sharks and rays toward a global extinction crisis. Curr. Biol. 2021, 31, 4773–4787. [Google Scholar] [CrossRef]
- Navarro, G.; Rozycki, V.; Monsalvo, M. Estadísticas de la Pesca Marina en la Argentina: Evolución de los Desembarques 2008–2013, 1st ed.; Ministerio de Agricultura, Ganadería y Pesca de la Nación: Ciudad Autónoma de Buenos Aires, Argentina, 2014; p. 144. [Google Scholar]
- Navarro, G.; Rozycki, V.; Monsalvo, M. Estadísticas de la Pesca Marina en la Argentina: Evolución de los Desembarques 2012–2016, 1st ed.; Ministerio de Agricultura, Ganadería y Pesca de la Nación: Ciudad Autónoma de Buenos Aires, Argentina, 2019; p. 147. [Google Scholar]
- MAGyP, Secretaría de Agricultura, Ganadería y Pesca. Buenos Aires, Argentina. Available online: https://www.magyp.gob.ar/sitio/areas/pesca_maritima/desembarques/lectura.php?imp=1&tabla=especie_flota_2023 (accessed on 29 December 2023).
- Spies, I.B.; Stevenson, D.E.; Orr, J.W.; Hoff, G.R. Molecular systematics of the skate subgenus Arctoraja (Bathyraja: Rajidae) and support for an undescribed species, the leopard skate, with comments on the phylogenetics of Bathyraja. Ichthyol. Res. 2011, 58, 77–83. [Google Scholar] [CrossRef]
- Naylor, G.J.P.; Caira, J.N.; Jensen, K.; Rosana, K.A.M.; White, W.T.; Last, P.R. A DNA sequence-based approach to the identification of shark and ray species and its implications for global elasmobranch diversity and parasitology. Bull. Am. Mus. Nat. Hist. 2012, 367, 1–262. [Google Scholar] [CrossRef] [PubMed]
- Ball, R.E.; Serra-Pereira, B.; Ellis, J.; Genner, M.J.; Iglésias, S.; Johnson, A.F.; Jones, C.S.; Leslie, R.; Lewis, J.; Mariani, S.; et al. Resolving taxonomic uncertainty in vulnerable elasmobranchs: Are the Madeira skate (Raja maderensis) and the thornback ray (Raja clavata) distinct species? Conserv. Genet. 2016, 17, 565–576. [Google Scholar] [CrossRef]
- Spies, I.B.; Gaichas, S.; Stevenson, D.E.; Orr, J.W.; Canino, M.F. DNA-based identification of Alaska skates (Amblyraja, Bathyraja and Raja: Rajidae) using Cytochrome c Oxidase Subunit I (CoI) Variation. J. Fish Biol. 2006, 69, 283–292. [Google Scholar] [CrossRef]
- Smith, P.J.; Steinke, D.; Mcveagh, S.M.; Stewart, A.L.; Struthers, C.D.; Roberts, C.D. Molecular analysis of Southern Ocean skates (Bathyraja) reveals a new species of Antarctic skate. J. Fish Biol. 2008, 73, 1170–1182. [Google Scholar] [CrossRef]
- Ward, R.D.; Holmes, B.H.; White, W.T.; Last, P.R. DNA barcoding Australasian chondrichthyans: Results and potential uses in conservation. Mar. Freshw. Res. 2008, 59, 57–71. [Google Scholar] [CrossRef]
- Holmes, B.H.; Steinke, D.; Ward, R.D. Identification of shark and ray fins using DNA barcoding. Fish. Res. 2009, 95, 280–288. [Google Scholar] [CrossRef]
- Coulson, M.W.; Denti, D.; Guelpen, L.V.; Miri, C.; Kenchington, E.; Bentzen, P. DNA barcoding of Canada’s skates. Mol. Ecol. Resour. 2011, 11, 968–978. [Google Scholar] [CrossRef]
- Mabragaña, E.; Díaz de Astarloa, J.M.; Hanner, R.; Zhang, J.; Castro, M.G. DNA barcoding identifies Argentine fishes from marine and brackish waters. PLoS ONE 2011, 6, e28655. [Google Scholar] [CrossRef]
- Serra-Pereira, B.; Moura, T.; Griffiths, A.M.; Gordo, L.S.; Figueiredo, I. Molecular barcoding of skates (Chondrichthyes: Rajidae) from the Southern Northeast Atlantic. Zool. Scr. 2011, 40, 76–84. [Google Scholar] [CrossRef]
- Ribeiro, A.d.O.; Caires, R.A.; Mariguela, T.C.; Pereira, L.H.G.; Hanner, R.; Oliveira, C. DNA barcodes identify marine fishes of São Paulo state, Brazil. Mol. Ecol. Resour. 2012, 12, 1012–1020. [Google Scholar] [CrossRef] [PubMed]
- Lynghammar, A.; Christiansen, J.S.; Griffiths, A.M.; Fevolden, S.-E.; Hop, H.; Bakken, T. DNA barcoding of the Northern Northeast Atlantic skates (Chondrichthyes, Rajiformes), with remarks on the widely distributed Starry ray. Zool. Scr. 2014, 43, 485–495. [Google Scholar] [CrossRef]
- Gabbanelli, V.; Díaz de Astarloa, J.M.; González-Castro, M.; Vazquez, D.M.; Mabragaña, E. Almost a century of oblivion: Integrative taxonomy allows the resurrection of the longnose skate Zearaja brevicaudata (Marini, 1933) (Rajiformes; Rajidae). Comptes Rendus Biologies 2018, 341, 454–470. [Google Scholar] [CrossRef] [PubMed]
- Gabbanelli, V.; Naylor, G.; Weigmann, S.; Yang, L.; Vazquez, D.M.; Last, P.; Díaz de Astarloa, J.M.; Mabragaña, E. Morphological and molecular evidence reveals the longnose skate Zearaja brevicaudata (Marini, 1933) to be a senior synonym of Dipturus lamillai Concha, Caira, Ebert & Pompert 2019. Zool. Stud. 2022, 61, 76. [Google Scholar] [CrossRef]
- Ward, R.D.; Hanner, R.; Hebert, P.D.N. The Campaign to DNA Barcode all fishes, FISH-BOL. J. Fish Biol. 2009, 74, 329–356. [Google Scholar] [CrossRef]
- Steinke, D.; Hanner, R. The FISH-BOL collaborators’ protocol. Mitochondrial DNA 2010, 21 (Suppl. S2), 10–14. [Google Scholar] [CrossRef]
- Cariani, A.; Messinetti, S.; Ferrari, A.; Arculeo, M.; Bonello, J.J.; Bonnici, L.; Cannas, R.; Carbonara, P.; Cau, A.; Charilaou, C.; et al. Improving the Conservation of Mediterranean Chondrichthyans: The ELASMOMED DNA Barcode Reference Library. PLoS ONE 2017, 12, e0170244. [Google Scholar] [CrossRef]
- Crobe, V.; Ferrari, A.; Hanner, R.; Leslie, R.W.; Steinke, D.; Tinti, F.; Cariani, A. Molecular Taxonomy and Diversification of Atlantic Skates (Chondrichthyes, Rajiformes): Adding More Pieces to the Puzzle of Their Evolutionary History. Life 2021, 11, 596. [Google Scholar] [CrossRef]
- Hubert, N.; Hanner, R.; Holm, E.; Mandrak, N.E.; Taylor, E.; Burridge, M.; Watkinson, D.; Dumont, P.; Curry, A.; Bentzen, P.; et al. Identifying Canadian freshwater fishes through DNA barcodes. PLoS ONE 2008, 3, e2490. [Google Scholar] [CrossRef]
- Last, P.R.; White, W.T.; de Carvalho, M.R.; Séret, B.; Stehmann, M.F.W.; Naylor, G.J.P. Rays of the World, 1st ed.; CSIRO Publishing: Melbourne, Australia, 2016; 790p. [Google Scholar]
- Fricke, R.; Eschmeyer, W.N.; Van der Laan, R. Eschmeyer’s Catalog of Fishes: Genera, Species, References. Available online: http://researcharchive.calacademy.org/research/ichthyology/catalog/fishcatmain.asp (accessed on 3 February 2025).
- Ratnasingham, S.; Hebert, P.D.N. DNA-based registry for all animal species: The barcode index number (BIN) system. PLoS ONE 2013, 8, e66213. [Google Scholar] [CrossRef]
- Puillandre, N.; Lambert, A.; Brouillet, S.; Achaz, G. ABGD, Automatic Barcode Gap Discovery for primary species delimitation. Mol. Ecol. 2012, 21, 1864–1877. [Google Scholar] [CrossRef] [PubMed]
- Fricke, R.; Eschmeyer, W.N.; Fong, J.D. Eschmeyer’s Catalog of Fishes: Genera/Species by Family/Subfamily. Available online: http://researcharchive.calacademy.org/research/ichthyology/catalog/SpeciesByFamily.asp (accessed on 3 February 2025).
- Ivanova, N.V.; de Waard, J.R.; Hebert, P.D.N. An inexpensive, automation friendly protocol for recovering high-quality DNA. Mol. Ecol. Notes 2006, 6, 998–1002. [Google Scholar] [CrossRef]
- Ward, R.D.; Zemlak, T.S.; Innes, B.H.; Last, P.R.; Hebert, P.D.N. DNA barcoding Australia’s fish species. Philos. Trans. R. Soc. B 2005, 360, 1847–1857. [Google Scholar] [CrossRef] [PubMed]
- Ivanova, N.V.; Zemlak, T.S.; Hanner, R.H.; Hebert, P.D.N. Universal primer cocktails for fish DNA barcoding. Mol. Ecol. Notes 2007, 7, 544–548. [Google Scholar] [CrossRef]
- Broughton, R.E.; Milam, J.E.; Roe, B.A. The complete sequence of the zebrafish (Danio rerio) mitochondrial genome and evolutionary patterns in vertebrate mitochondrial DNA. Genome Res. 2001, 11, 1958–1967. [Google Scholar] [CrossRef]
- Kimura, M. A simple method for estimating evolutionary rate of base substitutions through comparative studies of nucleotide sequences. J. Mol. Evol. 1980, 16, 111–120. [Google Scholar] [CrossRef]
- Kumar, S.; Stecher, G.; Suleski, M.; Sanderford, M.; Sharma, S.; Tamura, K. MEGA12: Molecular Evolutionary Genetics Analysis Version 12 for adaptive and green computing. Mol. Biol. Evol. 2024, 41, msae263. [Google Scholar] [CrossRef]
- Rosso, J.J.; Mabragaña, E.; González Castro, M.; Díaz de Astarloa, J.M. DNA Barcoding Neotropical fishes: Recent advances from the Pampa Plain, Argentina. Mol. Ecol. Resour. 2012, 12, 999–1011. [Google Scholar] [CrossRef]
- Felsenstein, J. PHYLIP (Phylogeny Inference Package); Version 3.6; Distributed by the author; Department of Genome Sciences, University of Washington: Seattle, WA, USA, 2005. [Google Scholar]
- Excoffier, L.; Lischer, H.E.L. Arlequin suite ver 3.5: A new series of programs to perform population genetics analyses under Linux and Windows. Mol. Ecol. Res. 2010, 10, 564–567. [Google Scholar] [CrossRef]
- Ratnasingham, S. Hebert PDN BOLD: The Barcode of Life Data System (www.barcodinglife.org). Mol. Ecol. Notes 2007, 7, 355–364. [Google Scholar] [CrossRef]
- Stehmann, M.F.W.; Weigmann, S.; Naylor, G.J.P. First complete description of the dark-mouth skate Raja arctowskii Dollo, 1904 from Antarctic waters, assigned to the genus Bathyraja (Elasmobranchii, Rajiformes, Arhynchobatidae). Mar. Biodivers. 2021, 51, 18. [Google Scholar] [CrossRef]
- Vazquez, D.M.; Awruch, C.A.; Lucifora, L.O.; Díaz de Astarloa, J.M.; Mabragaña, E. Embryonic development timeline in skates (Chondrichthyes: Rajiformes): Sympterygia acuta as the first case study in the family Arhynchobatidae. Zoology 2022, 155, 126057. [Google Scholar] [CrossRef] [PubMed]
- Hebert, P.D.N.; Ratnasingham, S.; deWaard, J.R. Barcoding animal life: Cytochrome c oxidase subunit 1 divergences among closely related species. Proc. Roy. Soc. London Ser. B Biol. Sci. 2003, 270, 96–99. [Google Scholar] [CrossRef] [PubMed]
- Díaz, J.; Villanova, G.V.; Brancolini, F.; del Pazo, F.; Posner, V.M.; Grimberg, A.; Arranz, S.E. First DNA Barcode Reference Library for the Identification of South American Freshwater Fish from the Lower Paraná River. PLoS ONE 2016, 11, e0157419. [Google Scholar] [CrossRef]
- Mabragaña, E.; Delpiani, S.M.; Rosso, J.J.; González-Castro, M.; Deli Antoni, M.Y.; Hanner, R.; Díaz de Astarloa, J.M. Barcoding Antarctic fishes: Species discrimination and contribution to elucidate ontogenetic changes in Nototheniidae. In DNA Barcoding in Marine Perspectives: Assessment and Conservation of Biodiversity, 1st ed.; Trivedi, S., Ansari, A.A., Ghosh, S.K., Eds.; Part III DNA Barcoding of Marine Fishes; Springer: Cham, Switzerland, 2016; pp. 213–242. [Google Scholar]
- Yang, Z.; Landry, J.F.; Hebert, P.D.N. A DNA Barcode Library for North American Pyraustinae (Lepidoptera: Pyraloidea: Crambidae). PLoS ONE 2016, 11, e0161449. [Google Scholar] [CrossRef]
- Pereira, L.H.G.; Hanner, R.; Foresti, F.; Oliveira, C. Can DNA barcoding accurately discriminate megadiverse Neotropical freshwater fish fauna? BMC Genet. 2013, 14, 20. [Google Scholar] [CrossRef]
- González-Castro, M.; Rosso, J.J.; Delpiani, S.M.; Mabragaña, E.; Díaz de Astarloa, J.M. Inferring boundaries among fish species of the new world silversides (Atherinopsidae; genus Odontesthes): New evidences of incipient speciation between marine and brackish populations of Odontesthes argentinensis. Genetica 2019, 147, 217–229. [Google Scholar] [CrossRef]
- Concha, F.J.; Caira, J.N.; Ebert, D.A.; Pompert, J.H.W. Redescription and taxonomic status of Dipturus chilensis (Guichenot, 1848), and description of Dipturus lamillai sp. nov. (Rajiformes: Rajidae), a new species of long-snout skate from the Falkland Islands. Zootaxa 2019, 4590, 501–524. [Google Scholar] [CrossRef]
- Awruch, C.A.; Bell, J.D.; Semmens, J.M.; Lyle, J.M. Life history traits and conservation actions for the Maugean skate (Zearaja maugeana), an endangered species occupying an anthropogenically impacted estuary. Aquat. Conserv. Mar. Freshw. Ecosyst. 2021, 31, 2178–2192. [Google Scholar] [CrossRef]
- Irigoitia, M.M.; Levy, E.; Canel, D.; Timi, J.T. Parasites as tags for stock identification of a highly exploited vulnerable skate Dipturus brevicaudatus (Chondrichthyes: Rajidae) in the south-western Atlantic Ocean, a complementary tool for its conservation. Aquat. Conserv. 2022, 32, 1634–1646. [Google Scholar] [CrossRef]
- Gabbanelli, V. Taxonomía y ecología de las rayas hocicudas de cola corta Zearaja chilensis y cola larga Dipturus argentinensis (Chondrichthyes, Rajidae): Implicancias para su Conservación. Ph.D. Thesis, Universidad Nacional de Mar del Plata, Mar del Plata, Argentina, 2021. [Google Scholar]
- Hughes, L.C.; Cardoso, Y.P.; Sommer, J.A.; Cifuentes, R.; Cuello, M.; Somoza, G.M.; González-Castro, M.; Malabarba, L.R.; Cussac, V.; Habit, E.M.; et al. Biogeography, habitat transitions and hybridization in a radiation of South American silverside fishes revealed by mitochondrial and genomic RAD data. Mol. Ecol. 2020, 29, 738–751. [Google Scholar] [CrossRef] [PubMed]
- González-Castro, M.; Cardoso, Y.P.; Hughes, L.C.; Ortí, G. Hybridization is strongly constrained by salinity during secondary contact between silverside fishes (Odontesthes, Atheriniformes). Hered 2020, 129, 233–243. [Google Scholar] [CrossRef] [PubMed]
- McEachran, J.D. Results of the research cruises of FRV “Walther Herwig” to South America LXI. Revision of the South American skate genus Psammobatis Gunther, 1873 (Elasmobranchii, Rajiformes, Rajidae). Arch. Fisherwiss. 1983, 34, 23–80. [Google Scholar]
- Mabragaña, E. Las Rayas del Género Psammobatis de la Plataforma Argentina: Biología y Ecología. Ph.D. Thesis, Universidad Nacional de Mar del Plata, Mar del Plata, Argentina, 2007. [Google Scholar]
- Mabragaña, E.; Figueroa, D.E.; Scenna, L.B.; Díaz de Astarloa, J.M.; Colonello, J.H.; Delpiani, G. Chondrichthyan egg cases from the southwest Atlantic. J. Fish Biol. 2011, 79, 1261–1290. [Google Scholar] [CrossRef]
- Mabragaña, E.; Giberto, D.A. Feeding ecology and abundance of two sympatric skates, the shortfin sand skate Psammobatis normani McEachran and the smallthorn sand skate P. rudis Günther (Chondrichthyes, Rajidae) in the Southwest Atlantic. ICES J. Mar. Sci. 2007, 64, 1017–1027. [Google Scholar] [CrossRef]
- Cousseau, M.B.; Pequeño, G.; Mabragaña, E.; Lucifora, L.O.; Martínez, P.; Giussi, A. The Magellanic Province and its fish fauna (South America): Several provinces or one? J. Biogeogr. 2020, 47, 220–234. [Google Scholar] [CrossRef]
- Sabadin, D.E.; Lucifora, L.O.; Barbini, S.A.; Figueroa, D.E.; Kittlein, M. Towards regionalization of the chondrichthyan fauna of the Southwest Atlantic: A spatial framework for conservation planning. ICES J. Mar. Sci. 2020, 77, 1893–1905. [Google Scholar] [CrossRef]
- Pequeño, G.; Lamilla, J. Batoideos comunes a las costas de Chile y Argentina-Uruguay (Pisces: Chondrichthyes). Rev. Biol. Mar. Oceanogr. 1993, 28, 203–217. [Google Scholar]
- Barbosa dos Santos, F.; Gomes Leite, U. Morfologia juvenil de quatro espécies do gênero Raja (Linneaus, 1758) das regiões sudeste do Brasil (Chondrichthyes, Batoidei, Rajidae). Biociências 1998, 6, 125–146. [Google Scholar]
- Lenain, V.M.; Matusevich, F.; Gabbanelli, V.; Vazquez, D.M.; Awruch, C.A.; Díaz de Astarloa, J.M.; Mabragana, E. First Reports on Reproductive Traits of the Endemic Southwestern Atlantic Rio Skate Rioraja agassizii (Rajiformes, Arhynchobatidae) in Captivity. Aquat. Conserv. 2024, 34, e70022. [Google Scholar] [CrossRef]
- Delpiani, G.; Delpiani, S.M.; Deli Antoni, M.Y.; Covatti Ale, M.; Fischer, L.; Lucifora, L.O.; Díaz de Astarloa, J.M. Are we sure we eat what we buy? Fish mislabelling in Buenos Aires province, the largest sea food market in Argentina. Fish Res. 2020, 221, 105373. [Google Scholar] [CrossRef]
- Griffiths, A.M.; Miller, D.D.; Egan, A.; Fox, J.; Greenfield, A.; Mariani, S. DNA barcoding unveils skate (Chondrichthyes: Rajidae) species diversity in ‘Ray’ products sold across Ireland and the UK. PeerJ 2013, 1, e129. [Google Scholar] [CrossRef] [PubMed]
- Senapati, D.; Bhattacharya, M.; Kar, A.; Chini, D.S.; Das, B.K.; Patra, B.C. Environmental DNA (eDNA): A Promising Biological Survey Tool for Aquatic Species Detection. Proc. Zool. Soc. 2019, 72, 211–228. [Google Scholar] [CrossRef]
- Taberlet, P.; Bonin, A.; Zinger, L.; Coissac, E. Environmental DNA: For Biodiversity Research and Monitoring; Oxford University Press: Oxford, UK, 2018. [Google Scholar] [CrossRef]
- Dulvy, N.K.; Acuña, E.; Bustamante, C.; Herman, K.; Pompert, J.; Velez-Zuazo, X. Bathyraja schroederi. The IUCN Red List of Threatened Species 2020: E.T63137A3121362. Available online: https://www.iucnredlist.org/species/63137/3121362 (accessed on 21 February 2025).
- Vazquez, D.M.; Mabragaña, E.; Gabbanelli, V.; Díaz de Astarloa, J.M. Exploring nursery sites for oviparous chondrichthyans in the southwest Atlantic (36°-41°S). Mar. Biol. Res. 2016, 12, 715–725. [Google Scholar] [CrossRef]
- Ferrette, B.L.d.S.; Domingues, R.R.; Rotundo, M.M.; Miranda, M.P.; Bunholi, I.V.; De Biasi, J.B.; Oliveira, C.; Foresti, F.; Mendonça, F.F. DNA Barcode Reveals the Bycatch of Endangered Batoids Species in the Southwest Atlantic: Implications for Sustainable Fisheries Management and Conservation Efforts. Genes 2019, 10, 304. [Google Scholar] [CrossRef]
- Hanner, R.; Becker, S.; Ivanova, N.V.; Steinke, D. FISH-BOL and seafood identification: Geographically dispersed case studies reveal systemic market substitution across Canada. Mitochond DNA 2011, 22, 106–122. [Google Scholar] [CrossRef]
- Hanner, R.H.; Naaum, A.M.; Shivji, M.S. DNA-based authentication of shark products and implications for conservation and management. In Seafood Authenticity and Traceability; Naaum, A.M., Hanner, R.H., Eds.; Academic Press: San Diego, CA, USA, 2016; pp. 171–179. ISBN 978-0-12-801592-6. [Google Scholar]
- Bornatowski, H.; Braga Rennó, R.; Kalinowski, C.; Simões Vitule, J.R. “Buying a Pig in a Poke”: The Problem of Elasmobranch Meat Consumption in Southern Brazil. Soc. Ethnobiol. 2015, 6, 196–202. [Google Scholar] [CrossRef]
- Chang, C.H.; Lin, H.Y.; Ren, Q.; Lin, Y.S.; Shao, K.T. DNA barcode identification of fish products in Taiwan: Government-commissioned authentication cases. Food Control 2016, 66, 38–43. [Google Scholar] [CrossRef]
- Dufflocq, P.; Larraín, M.A.; Araneda, C. Species substitution and mislabeling in the swordfish (Xiphias gladius) market in Santiago, Chile: Implications in shark conservation. Food Control 2022, 133, 108607. [Google Scholar] [CrossRef]
- Armani, A.; Guardone, L.; Castellana, R.; Giandolfini, D.; Guidi, A.; Castiglieco, L. DNA barcoding reveals commercial and health issues in ethnic seafood sold on the Italian market. Food Control 2015, 55, 206–214. [Google Scholar] [CrossRef]
- Williams, M.; Hernandez-Jover, M.; Shokoofeh, S. Fish substitutions which may increase human health risks from zoonotic seafood borne parasites: A review. Food Control 2020, 118, 107429. [Google Scholar] [CrossRef]

 —B. brachyurops,
  —Psammobatis lentiginosa,
  —P. normani,
  —P. rudis,
  —Rioraja agassizii,
  —Sympterygia acuta,
  —Zearaja brevicaudata, and
  —Bathyraja sp.
—B. brachyurops, —Psammobatis lentiginosa, —P. normani, —P. rudis, —Rioraja agassizii, —Sympterygia acuta, —Zearaja brevicaudata, and —Bathyraja sp.
—Bathyraja sp.
—B. brachyurops, —Psammobatis lentiginosa, —P. normani, —P. rudis, —Rioraja agassizii, —Sympterygia acuta, —Zearaja brevicaudata, and —Bathyraja sp.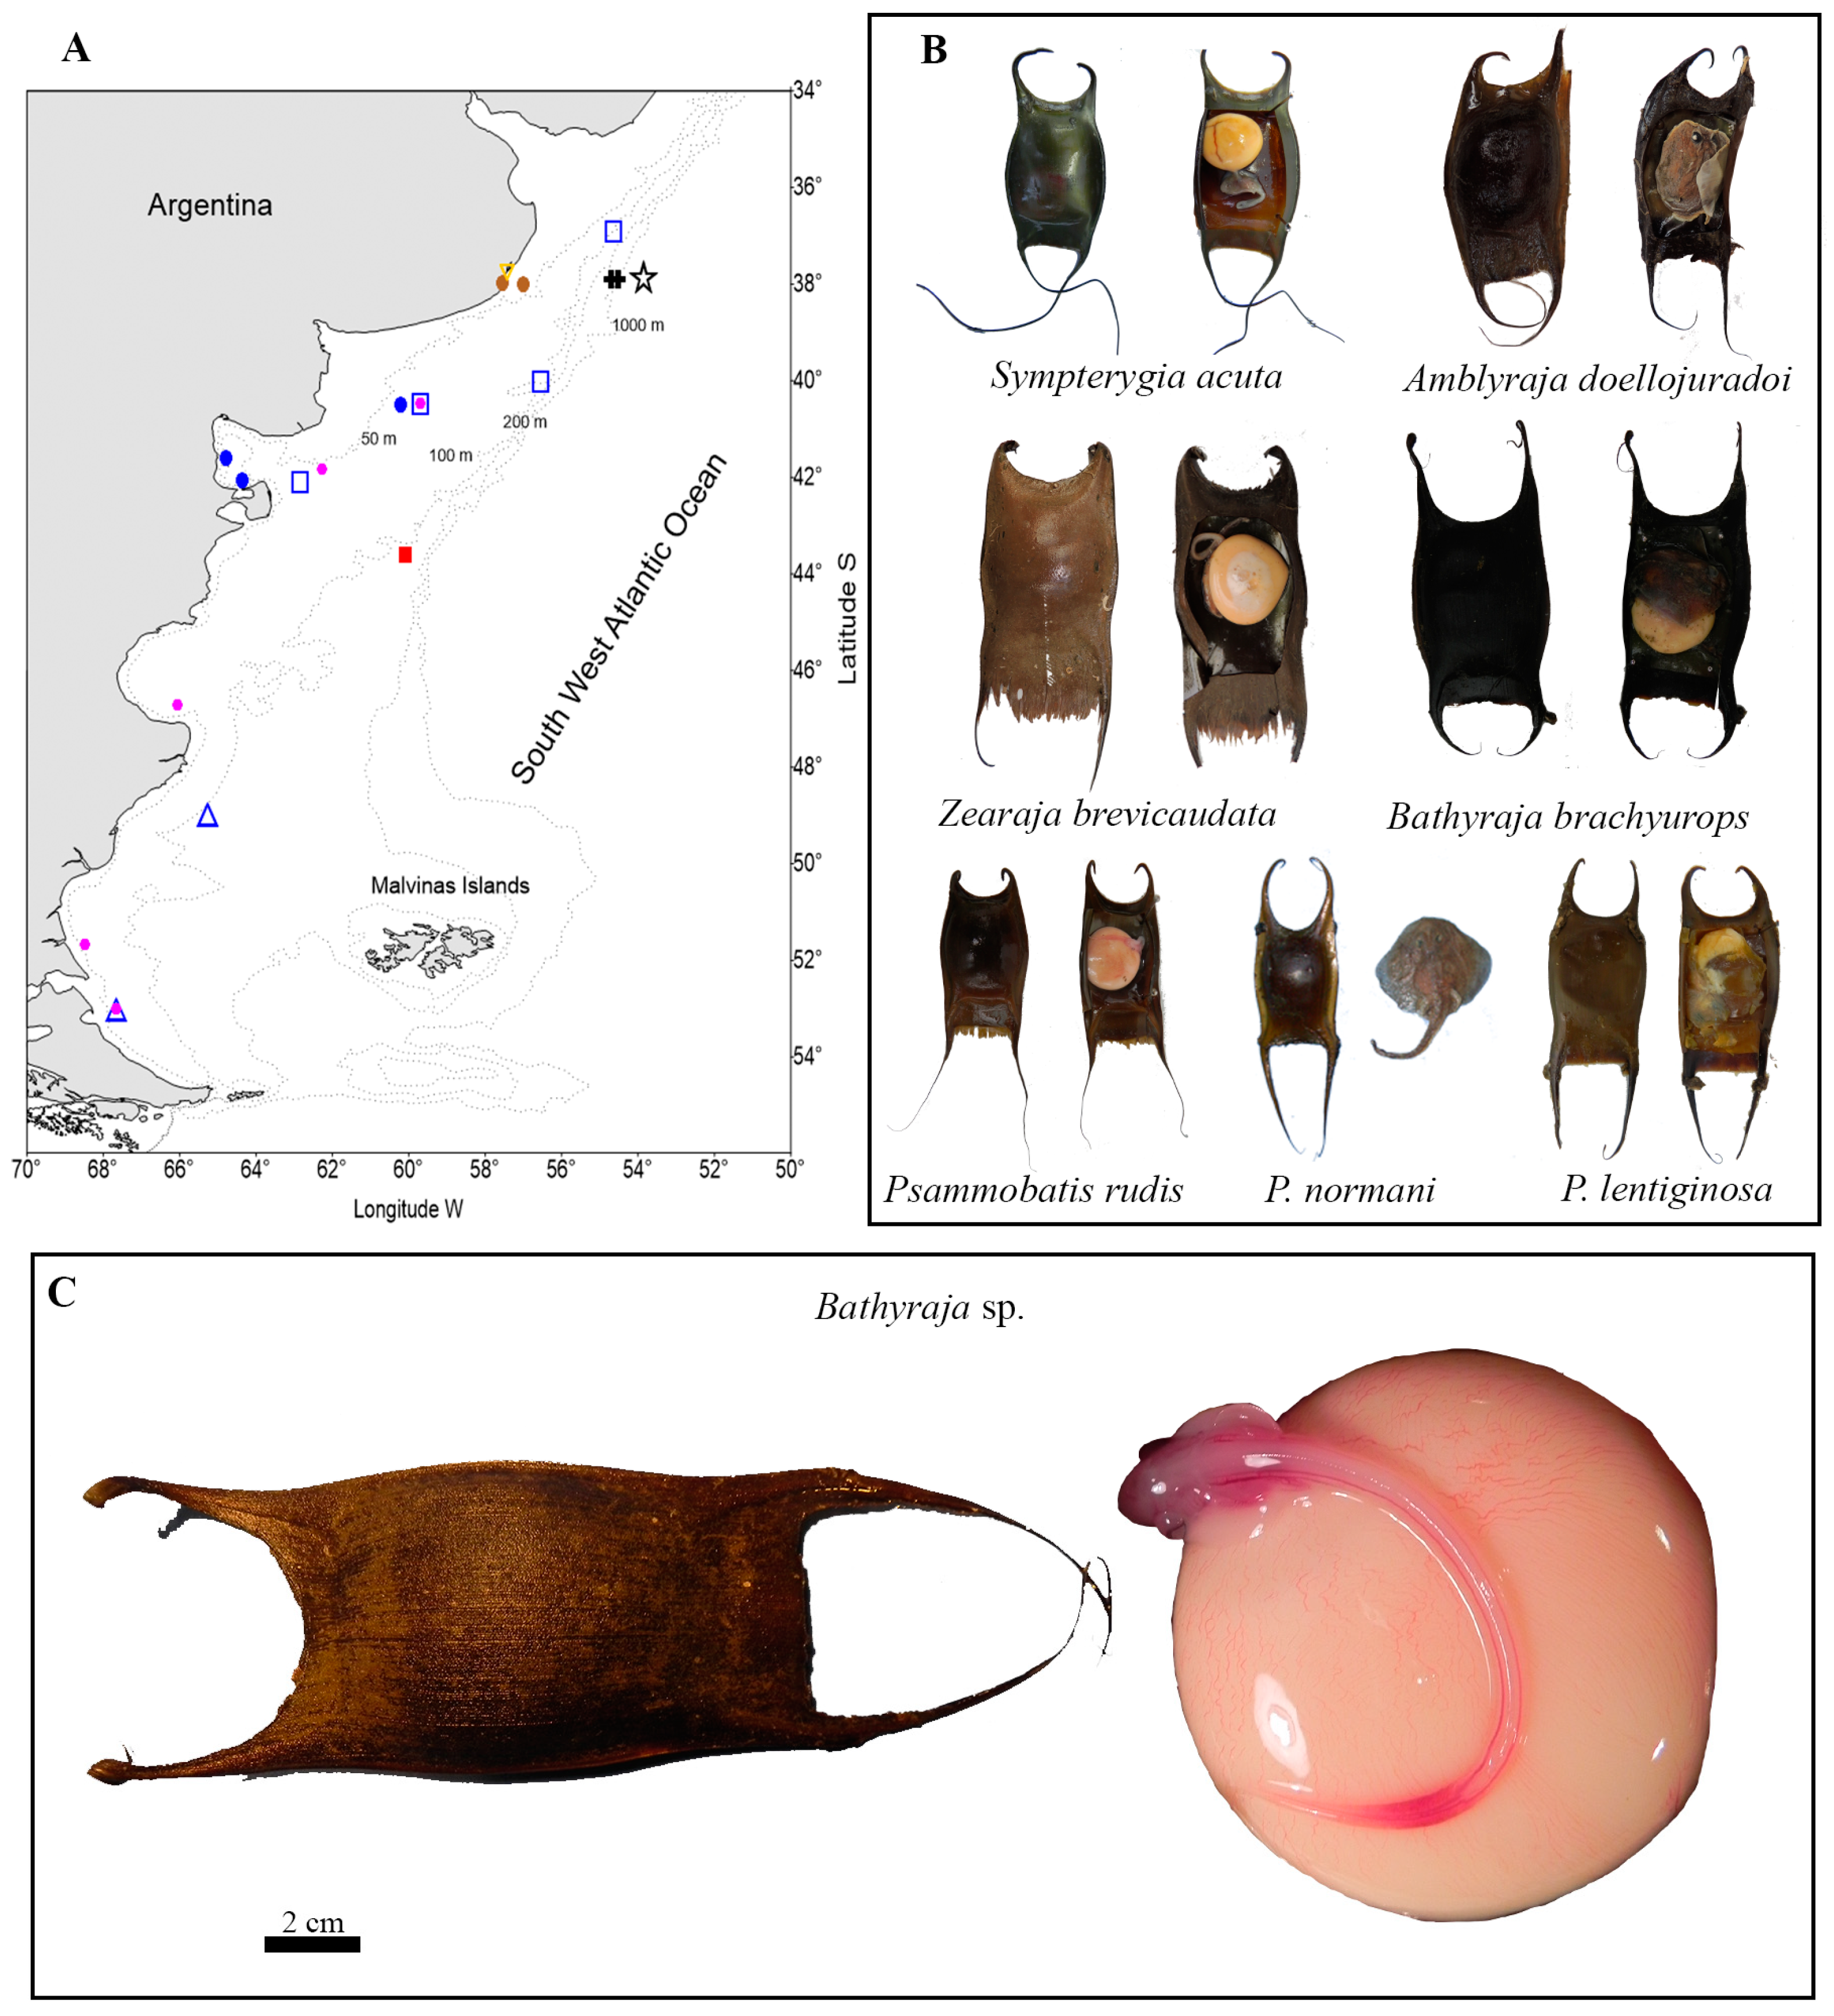

| a | |||||||
| n | Taxa | Comparisons | Min Dist (%) | Mean Dist (%) | Max Dist (%) | SE Dist (%) | |
| Within Species | 211 | 20 | 1404 | 0.00 | 0.19 | 1.46 | 0.00 |
| Within Genus | 178 | 5 | 2518 | 0.15 | 3.52 | 8.36 | 0.00 |
| Within Family | 217 | 1 | 19,514 | 0 | 14.45 | 20.49 | 0.00 |
| b | |||||||
| n | Taxa | Comparisons | Min Dist (%) | Mean Dist (%) | Max Dist (%) | SE Dist (%) | |
| Within Species | 211 | 20 | 1404 | 0.00 | 0.19 | 1.48 | 0.00 |
| Within Genus | 178 | 5 | 2518 | 0.15 | 3.65 | 8.98 | 0.00 |
| Within Family | 217 | 1 | 19,514 | 0 | 16.44 | 24.57 | 0.00 |
| Species | Mean Intra-Sp | Max Intra-Sp | Nearest Neighbor | Nearest Species | Distance to NN |
|---|---|---|---|---|---|
| Amblyraja doellojuradoi | 0.24 | 1.12 | FARG568-09 | Zearaja brevicaudata | 11.19 |
| Atlantoraja castelnaui | N/A | 0 | FARG427-08 | Atlantoraja platana | 7.89 |
| Atlantoraja cyclophora | 0.19 | 0.31 | FARG426-08 | Atlantoraja platana | 4.22 |
| Atlantoraja platana | 0 | 0 | FARG475-08 | Atlantoraja cyclophora | 4.22 |
| Bathyraja albomaculata | 0.09 | 0.16 | FARG117-06 | Bathyraja macloviana | 0.31 * |
| Bathyraja brachyurops | 0.2 | 0.47 | FARGB450-11 | Bathyraja macloviana | 2.67 |
| Bathyraja cousseauae | 0.15 | 0.15 | FARG501-08 | Bathyraja papilionifera | 1.24 * |
| Bathyraja griseocauda | 0 | 0 | FARG501-08 | Bathyraja papilionifera | 0.93 * |
| Bathyraja macloviana | 0.42 | 0.95 | FARG145-06 | Bathyraja albomaculata | 0.31 * |
| Bathyraja magellanica | 0.18 | 0.46 | CEGAR056-14 | Bathyraja sp. | 2.71 |
| Bathyraja multispinis | 0.04 | 0.15 | FARG501-08 | Bathyraja papilionifera | 1.55 * |
| Bathyraja papilionifera | N/A | 0 | FARG258-06 | Bathyraja griseocauda | 0.93 * |
| Bathyraja scaphiops | 0.11 | 0.34 | FARG172-06 | Bathyraja cousseauae | 1.89 * |
| Bathyraja sp. | N/A | 0 | FARG172-06 | Bathyraja cousseauae | 1.61 * |
| Dipturus argentinensis | 0,09 | 0,31 | SWAS007-24 | Dipturus trachyderma | 0 * |
| Dipturus trachyderma | N/A | 0 | FARG019-06 | Dipturus argentinensis | 0 * |
| Psammobatis bergi | 0.04 | 0.18 | FARG463-08 | Psammobatis lentiginosa | 2.73 |
| Psammobatis extenta | N/A | 0 | SWAS001-24 | Psammobatis rutrum | 4.71 |
| Psammobatis lentiginosa | 0.41 | 1.48 | FARG737-09 | Psammobatis bergi | 2.73 |
| Psammobatis normani | 0.15 | 0.6 | FARG479-08 | Psammobatis rudis | 0.15 * |
| Psammobatis rudis | 0.09 | 0.33 | FARG390-08 | Psammobatis normani | 0.15 * |
| Rioraja agassizii | 0.3 | 0.77 | FARG475-08 | Atlantoraja cyclophora | 8.77 |
| Sympterygia acuta | 0.25 | 0.71 | FARG215-06 | Sympterygia bonapartii | 7.36 |
| Sympterygia bonapartii | 0.02 | 0.18 | FARG716-09 | Sympterygia acuta | 7.36 |
| Zearaja brevicaudata | 0.17 | 0.62 | FARG127-06 | Dipturus argentinensis | 2.79 |
| Species/Site | 34 | 58 | 85 | 86 | 97 | 163 | 184 | 197 | 208 | 232 | 268 | 298 | 340 | 352 |
| Base | G | G | A | A | T | G | C | G | G | T | T | C | C | A |
| B. albomaculata | . | . | . | . | . | . | . | . | . | . | . | . | . | . |
| B. cousseauae | . | . | . | . | . | . | . | . | . | . | . | . | . | . |
| B. griseocauda | . | . | . | . | . | . | . | . | . | . | . | . | . | . |
| B. macloviana | . | . | . | . | . | . | . | . | . | . | . | . | . | . |
| B. meridionalis | . | . | . | . | . | . | . | . | . | . | . | . | . | . |
| B. multispinis | . | C | . | . | . | . | . | A | . | C | . | . | . | . |
| B. papilionifera | . | . | . | . | . | A | . | . | . | . | . | . | . | . |
| B. scaphiops | A | . | . | . | . | . | T | . | . | . | . | T | G | T |
| B. eatoni | . | . | . | . | . | . | . | . | . | . | C | . | . | . |
| B. maccaini | . | . | G | . | . | . | . | . | . | . | . | . | . | . |
| Bathyraja sp. | . | A | T | T | G | . | . | . | A | . | . | . | . | G |
| Species/Site | 397 | 409 | 415 | 439 | 463 | 469 | 490 | 520 | 529 | 568 | 598 | 603 | 610 | 628 |
| Base | G/T | C | C | T | A | A | A | C | A | C | C | C | C | G |
| B. albomaculata | . | . | . | C | . | . | . | . | . | . | . | . | . | . |
| B. cousseauae | . | . | . | . | . | . | . | . | . | . | . | . | T | . |
| B. griseocauda | . | T | . | . | . | . | . | . | . | . | . | . | . | . |
| B. macloviana | . | . | . | . | G | . | . | . | . | . | . | . | . | . |
| B. meridionalis | . | . | . | . | . | . | G | . | . | . | T | . | . | . |
| B. multispinis | A | . | T | . | . | . | . | . | . | T | . | . | . | . |
| B. papilionifera | C | . | . | . | . | . | . | . | . | . | . | A | . | . |
| B. scaphiops | . | . | . | . | . | . | . | T | . | . | . | . | . | A |
| B. eatoni | . | . | . | . | . | C | . | . | . | T | . | . | . | T |
| B. maccaini | . | . | . | . | . | . | . | . | T | . | T | . | . | . |
| Bathyraja sp. | . | . | . | . | . | . | . | . | . | . | - | - | - | - |
| Species | BIN | Average/Max Distance P-Dist (%) | Distance to the Nearest P-Dist (%) | Nearest Member | BIN |
|---|---|---|---|---|---|
| Amblyraja doellojuradoi Amblyraja georgiana | ABZ5141 210 [186 public] | 0.43%/2.4% | 1.94% | Amblyraja radiata | AAA4500 |
| Amblyraja taaf | |||||
| Atlantoraja castelnaui | AAB4961 35 (29) | 0.11%/0.49% | 7.13% | Atlantoraja platana | AAB1884 |
| Atlantoraja cyclophora | AAB1882 36 (29) | 0.26%/0.96% | 3.56% | Atlantoraja platana | AAB1884 |
| Atlantoraja platana | AAB1884 29 (24) | 0.06%/0.336% | 3.94% | Atlantoraja cyclophora | AAB1882 |
| Bathyraja albomaculata | AAA8067 307 (256) | 1.86%/4.65% | 1.92% | Bathyraja interrupta | ABY6293 |
| Bathyraja cousseauae | |||||
| Bathyraja eatonii | |||||
| Bathyraja griseocauda Bathyraja maccaini | |||||
| Bathyraja macloviana | |||||
| Bathyraja meridionalis | |||||
| Bathyraja multispinis | |||||
| Bathyraja papilionifera | |||||
| Bathyraja scaphiops | |||||
| Bathyraja sp. | |||||
| Bathyraja brachyurops | ABX5438 9 (9) | 0.19%/0.47% | 2.23% | Bathyraja sp. | AAA8067 |
| Bathyraja magellanica | AAF0384 5 (5) | 0.18%/0.46% | 2.23% | Bathyraja sp. | AAA8067 |
| Dipturus argentinensis | AAB5857 216(210) | 0.61%/2.34% | 2.69% | Dipturus sp. | AAB4430 |
| Dipturus trachyderma | |||||
| Psammobatis bergi | AAF6480 10 (9) | 0.03%/0.18% | 2.66% | Psammobatis lentiginosa | AAD8610 |
| Psammobatis extenta | AGQ0364 (1) | N/A | |||
| Psammobatis lentiginosa | AAE0763 10 (1) | 0.18%/0.35% | 4.59% | Psammobatis normani | AAB7451 |
| Psammobatis normani | AAB7451 83 (69) | 0.26%/1.28% | 3.41% | Psammobatis lentiginosa | AAD8610 |
| Psammobatis rudis | |||||
| Rioraja agassizii | AAB1883 29 (23) | 0.34%/1.12% Rioraja agassizii (26), Atlantoraja cyclophora (3) * | 8.06% | Atlantoraja cyclophora | AAB1882 |
| Sympterygia acuta | AAD5559 23 (23) | 0.24%/0.77% | 7.54% | Sympterygia bonapartii | AAE2829 |
| Sympterygia bonapartii | AAE2829 13 (13) | 0.02%/0.18% | 3.93% | Sympterygia brevicaudata | ADN1186 |
| Zearaja brevicaudata | AAB5856 94 (43) | 0.24%/1.5% | 2.7% | Dipturus argentinensis | AAB5856 |
| Species/Site | 178 | 316 | 337 | 346 | 532 | 577 | 595 |
| Amblyraja. doellojuradoi Amblyraja georgiana | G A | CG T | C T | A G | A G | C A | T C |
| Amblyraja taaf | A | T | C | G | G | A | C |
| Species | Group | n | Nh | S | Hh | Tajima’s D | p-Value |
|---|---|---|---|---|---|---|---|
| Amblyraja doellojuradoi | Buenos Aires shelf | 10 | 5 | 6 | 0.6667 | −1.79631 * | 0.015 |
| Buenos Aires deep | 3 | 2 | 1 | 0.6667 | 0.00001 | 0.984 | |
| Patagonian shelf | 9 | 4 | 2 | 0.4167 | −0.58325 | 0.303 | |
| Zearaja brevicaudata | Buenos Aires shelf | 12 | 4 | 4 | 0.6818 | −0.74109 | 0.259 |
| San Jorge Gulf shelf | 7 | 4 | 3 | 0.8 | 0.60031 | 0.705 | |
| Patagonian shelf | 6 | 2 | 1 | 0.4762 | 0.55902 | 0.844 |
| A | BAS | BAD | PS | |
| BAS | - | |||
| BAD | 0.05263 | - | ||
| PS | −0.06557 | 0.02567 | - | |
| B | BAS | SJSG | PS | |
| BAS | - | |||
| SJSG | 0.13216 * | - | ||
| PS | −0.03526 | 0.23179 * | - |
| Prior Morphological Identification | Sample Size | Species Matched |
|---|---|---|
| Amblyraja doellojuradoi | 3 | Yes |
| Bathyraja brachyurops | 2 | Yes |
| Psammobatis lentiginosa | 4 | Yes |
| Psammobatis normani | 5 | Yes |
| Psammobatis rudis | 3 | Yes |
| Rioraja agassizii | 1 | Yes |
| Sympterygia acuta | 2 | Yes |
| Zearaja brevicaudata | 9 | Yes |
| Unidentified | 1 | Rioraja agassizii |
| Unidentified | 1 | Bathyraja sp. |
Disclaimer/Publisher’s Note: The statements, opinions and data contained in all publications are solely those of the individual author(s) and contributor(s) and not of MDPI and/or the editor(s). MDPI and/or the editor(s) disclaim responsibility for any injury to people or property resulting from any ideas, methods, instructions or products referred to in the content. |
© 2025 by the authors. Licensee MDPI, Basel, Switzerland. This article is an open access article distributed under the terms and conditions of the Creative Commons Attribution (CC BY) license (https://creativecommons.org/licenses/by/4.0/).
Share and Cite
Mabragaña, E.; Gabbanelli, V.; Matusevich, F.; Vazquez, D.M.; Delpiani, S.M.; Lenain, V.M.; Rosso, J.J.; González-Castro, M.; Hanner, R.; Díaz de Astarloa, J.M. DNA Barcoding Southwestern Atlantic Skates: A 20-Year Effort in Building a Species Identification Library. Diversity 2025, 17, 311. https://doi.org/10.3390/d17050311
Mabragaña E, Gabbanelli V, Matusevich F, Vazquez DM, Delpiani SM, Lenain VM, Rosso JJ, González-Castro M, Hanner R, Díaz de Astarloa JM. DNA Barcoding Southwestern Atlantic Skates: A 20-Year Effort in Building a Species Identification Library. Diversity. 2025; 17(5):311. https://doi.org/10.3390/d17050311
Chicago/Turabian StyleMabragaña, Ezequiel, Valeria Gabbanelli, Florencia Matusevich, Diego Martín Vazquez, Sergio Matías Delpiani, Victoria Malvina Lenain, Juan José Rosso, Mariano González-Castro, Robert Hanner, and Juan Martín Díaz de Astarloa. 2025. "DNA Barcoding Southwestern Atlantic Skates: A 20-Year Effort in Building a Species Identification Library" Diversity 17, no. 5: 311. https://doi.org/10.3390/d17050311
APA StyleMabragaña, E., Gabbanelli, V., Matusevich, F., Vazquez, D. M., Delpiani, S. M., Lenain, V. M., Rosso, J. J., González-Castro, M., Hanner, R., & Díaz de Astarloa, J. M. (2025). DNA Barcoding Southwestern Atlantic Skates: A 20-Year Effort in Building a Species Identification Library. Diversity, 17(5), 311. https://doi.org/10.3390/d17050311