Abstract
A three-magnet array unilateral NMR sensor with a homogeneous sensitive spot was employed for assessing aging of the turbine oils used in two different power stations. The Carr-Purcell-Meiboom-Gill (CPMG) sequence and Inversion Recovery-prepared CPMG were employed for measuring the 1H-NMR transverse and longitudinal relaxation times of turbine oils with different service status. Two signal components with different lifetimes were obtained by processing the transverse relaxation curves with a numeric program based on the Inverse Laplace Transformation. The long lifetime components of the transverse relaxation time T2eff and longitudinal relaxation time T1 were chosen to monitor the hydraulic fluid aging. The results demonstrate that an increase of the service time of the turbine oils clearly results in a decrease of T2eff,long and T1,long. This indicates that the T2eff,long and T1,long relaxation times, obtained from the unilateral magnetic resonance measurements, can be applied as indices for degradation of the hydraulic fluid in power station turbines.1. Introduction
Since the discovery of their excellent anti-wear and fire resistance properties in the 1940s, the use of phosphate ester hydraulic fluids by industry has steadily increased [1,2]. In power systems, phosphate esters are used primarily as fire-resistant base-stocks in turbines for speed governing, lubricating, radiating, cleaning and vibration damping [3]. In operation at high temperatures, in the presence of oxygen, water vapor and catalytically active metals, these synthetic oils are severely stressed. These conditions may lead to a rapid degradation of their oxidation and the hydrolysis resistance, which may cause corrosion and even failure of the system [4–6]. In order to prevent change of viscosity, formation of deposits and corrosion, oil degradation must be minimized [7]. Therefore, the hydraulic system is usually equiped with a by-pass regenerating unit [3] to remove acidic substances and water, as well as solid particulate contaminants. During the aging process, the oil continuously degrades and is regenerated until it is non-renewable by accumulation of degradation products. It is very expensive (about 110,000 USD) to replace the oil in power plant turbines [8]. Consequently, a quality control measurement is needed for safe and economic operation of the power system.
With deterioration [8] of phosphate ester fire resistant oils the color deepens and precipitates are produced in severe cases. During aging, the acidity, water content, viscosity, dielectric constant, foam characteristic, and air release property, etc. may all change [7,9].
Traditionally phosphate ester aging was evaluated by observing color and turbidity changes [3]. This method is less rigorous, and sometimes led to major accidents and resulted in irreparable damage and significant economic losses. More recently turbine operators are required to test the appearance, acidity, resistivity and mechanical impurities of the oil at least once a week, and measure the moisture content, flash point and viscosity at least once per season [9]. Some sites even test the thermo-oxidative stability and corrosivity under simulated aging conditions, where the increase of acidity and viscosity, the formation of sludge and corrosion against various metals are controlled [7]. However, such a test program is expensive and time consuming and cannot be applied to a large number of samples in the surveillance of used oils.
NMR has been used in the past to investigate materials aging and degradation. A prominent and most practical example is the development of unilateral magnetic resonance (UMR), where the NMR experiment is carried out in the inhomogeneous field produced on one side of a portable magnet. UMR has become a powerful technique in different areas of application. New applications [10] have been developed in well-logging [11], biomedicine [12], material analysis [13] and characterization of food products [14]. Since UMR is simpler and much less expensive than traditional NMR, and produces reliable information, the development of new UMR sensors and applications should continue in the near future.
This paper presents a magnetic resonance method for phosphate ester analysis employing a three-magnet array [15,16] as a sensor. The intention of this work is to develop a rapid and simple method for estimating the degree of degradation of phosphate ester hydraulic fluids in power plant turbines. We have demonstrated that the new sensor produces reliable results and can be employed to follow the oil aging process. In the following sections, the features of the magnet and measurements on phosphate ester fire resistant oils are discussed.
2. Experimental Section
2.1. Magnet
Magnets of different types can be employed for this measurement. Closed or semi-closed magnets allow more sensitive measurements than unilateral magnets, but require of a more complicated design and adjusting process and are more sensitive to temperature variation. Unilateral magnets are in general very simple to build and can also produce reliable results.
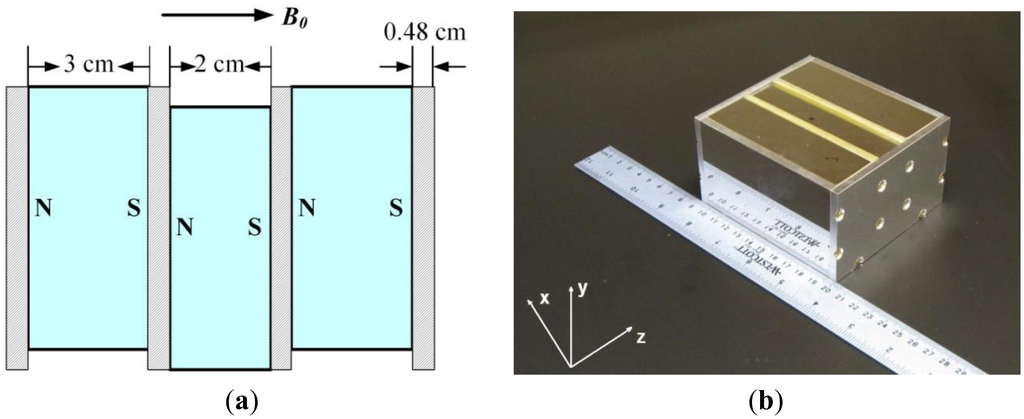
Figure 1 shows the structure of the three-magnet array unilateral magnet developed by the UNB MRI Centre in Canada. It is a simple array of three magnet blocks with the magnetic field oriented in the same direction. A vertical displacement of the central block allows generating a homogeneous spot [15] or an extended constant gradient [16]. The design is compact and safe and the weight of the magnet array is 5 kg. The mathematical equations to describe the magnetic field distribution are relatively simple, which makes easy the simulation. It should be marked that the magnetic field homogeneity (around 1% of B0) for the homogeneous spot design is still far away from the values employed for classic NMR experiments. The major advantages of this magnet are its simplity and the relatively remote homogenenous spot. The static magnetic field B0 is parallel to its surface (along z axis in Figure 1) which allows employment of a very simple surface coil with good sensitivity. The size of the measurement spot results from the combination of B0 distribution, bandwidth of the excitation RF pulses, bandwidth of the receiver and parameters of the surface coil like size, shape and quality factor (Q).
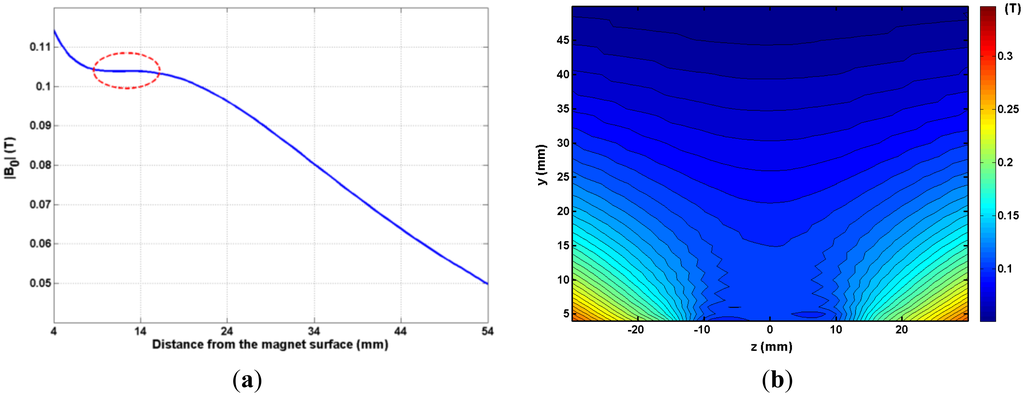
In order to adjust and characterize the magnet, magnetic field measurements were undertaken employing a three axis Hall effect magnetic field probe (Lake-Shore Cryotronics Inc., OH, USA) and a computer controlled three axis plotter (Velmex Inc., MI, USA). Figure 2a plots the magnetic field magnitude as a function of distance from the centre of the magnet. The sensitive spot of the magnet array is 8 mm to 17 mm from the magnet surface. The proton resonance frequency at this position is 4.485 MHz. Figure 2b shows a contour plot of the magnetic field along the yz plane over the magnet (x = 0).
2.2. RF Coil
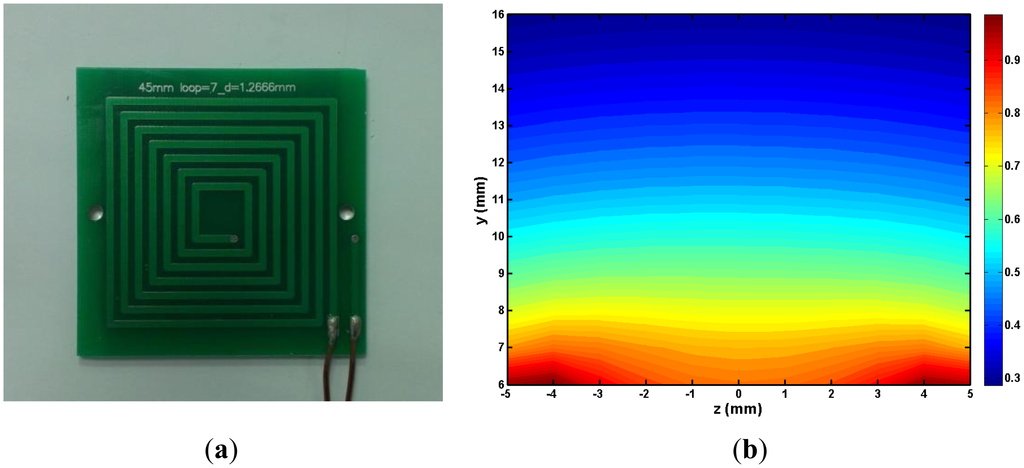
A square spiral RF coil, 45 mm in length with 7 turns, fabricated on a 1.2 mm thick printed circuit board (Figure 3a) was employed for the measurements since the RF field B1 is required to be perpendicular to the static magnetic field B0.The lead width was 1.5 mm and the spacing 1.27 mm. The resistance and inductance of the coil were 0.41 Ω and 1.439 μH, respectively. The loaded quality factor (QL), measured with the coil placed on the magnet was 30. The RF coil was tuned 4.485 MHz, which is the proton resonance frequency at the centre of the spot. The dead time of the coil is 35 us. The RF field above the coil, simulated employing the simulation software Maxwell 3D (Ansoft, Pittsburgh, PA, USA), is shown in Figure 3b. A 4.766 mm (3/16″) fiberglass spacer was placed between the coil and the magnet to assure a better use of the homogeneous spot of the magnet and the B1 of the coil. The distance from the RF coil upper surface to the sensitive spot is 2 mm to 11 mm.
2.3. Experiment Details
Two groups of turbine phosphate ester hydraulic fluids (Table 1), in service at two different power stations, were employed for the measurements. They were housed in five cylindrical glass vessels. The dimensions (4 cm in diameter and 7 cm in length) of the glass vessels were chosen to guarantee full coverage of the measurement spot (1 cm along z axis, 1 cm along y axis and 2 cm along x axis) with the sample.

All measurements were carried out with a Kea2 console (Magritek, Wellington, New Zealand), connected to a RF power amplifier (TOMCO Technologies, Stepney, Australia) at 17 ± 0.3 °C. The 1H NMR transverse relaxation time (T2eff) [17] and longitudinal relaxation time (T1) were obtained with the standard Carr-Purcell-Meiboom-Gill (CPMG) sequence and T1 Inversion Recovery with CPMG T1 IR Add sequence, respectively. For the CPMG sequence, the 90° pulse width was 8 μs, the attenuations of the 90° and 180° pulse were −18 dB and −12 dB, the echo time was 150 μs, the number of echoes was 2,048, the repetition time was 400 ms, and 256 scans were averaged. The total measurement time was 5 min. For the T1 IR Add sequence, the time between the first 180° pulse and the 90° pulse was varied from 1 ms to 400 ms by log spacing with 40 steps, the number of echoes was 32, and other parameters were the same as in the CPMG sequence. The total measurement time was 3 h.
3. Results and Discussion
3.1. Transverse Relaxation Time Measurements
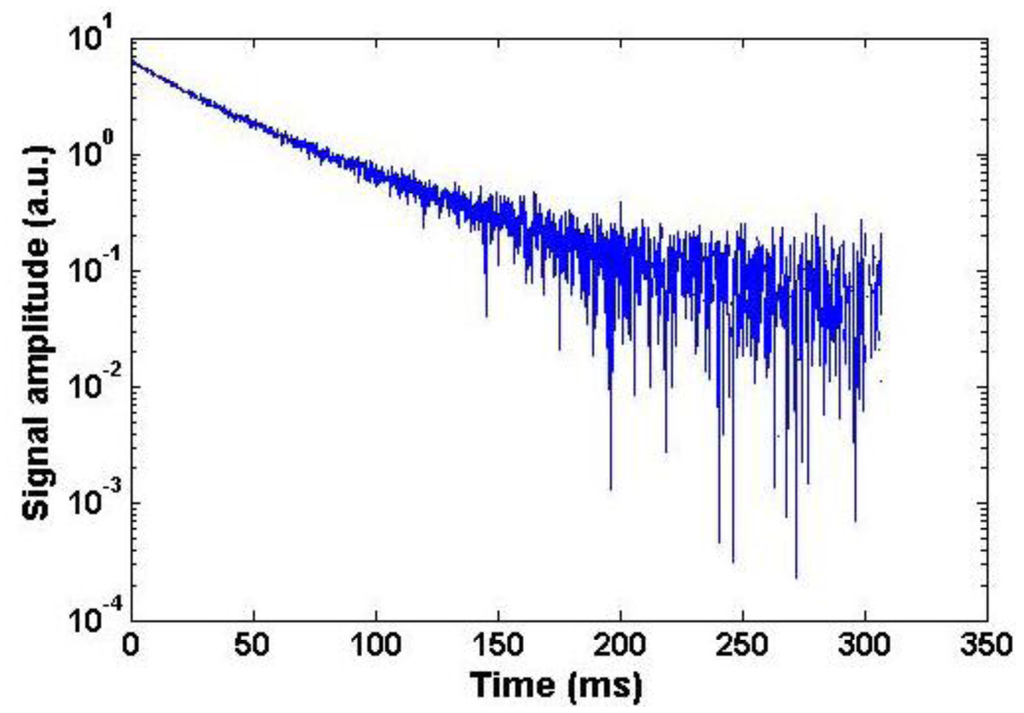
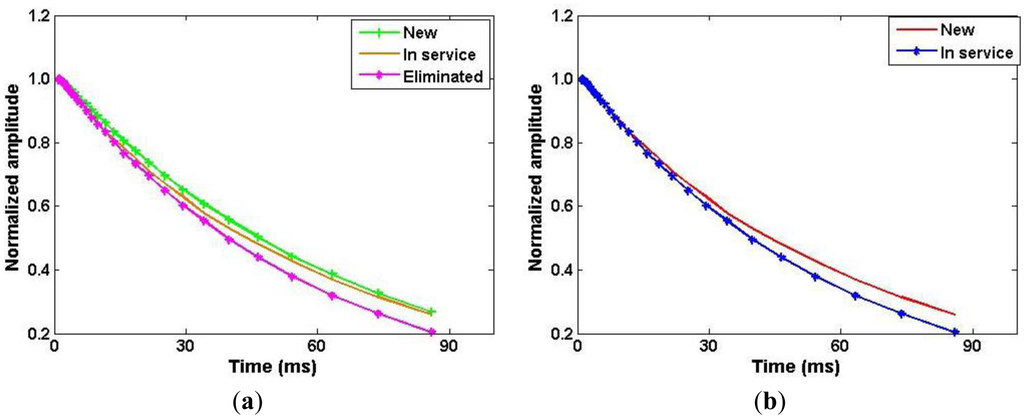
Once the CPMG decay from the sample (Figure 4) was obtained, an Inverse Laplace Transformation (ILT) of the CPMG data was performed with the Contin program [18]. In Figure 5 the T2eff distributions of two groups of turbine oils are shown. The amplitude of the short lifetime component is approximately three times less than the long component, so that the CPMG decay is dominated by the longer transverse relaxation time, T2eff,long. The measurement was repeated five times for each sample to check the reproducibility of the method. As the reproducibility of the long component is much better than the short component, only T2eff,long will be discussed hereafter.
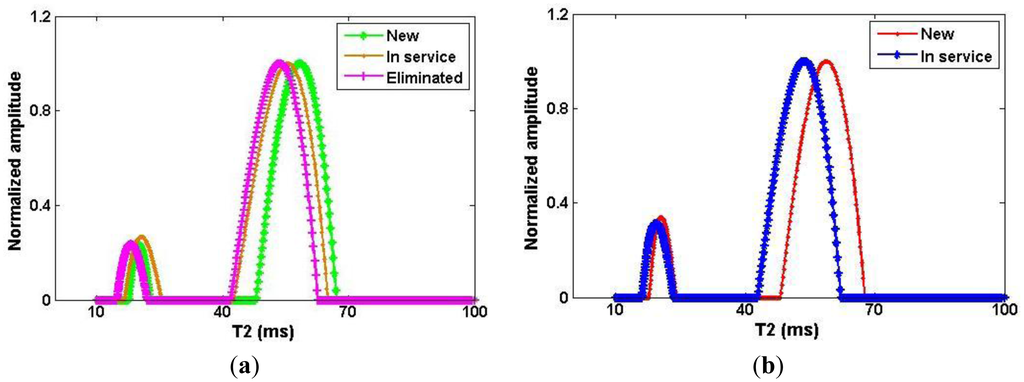
In Figure 5, all of the T2eff distribution curves have two symmetric peaks that are well separated. This behavior allows a much simpler bi-exponential fitting to be employed. In addition to more reliable results the simplicity of the bi-exponential fitting (Equation (1)) [19] makes it better option for practical measurements. Only the T2eff,long obtained from the bi-exponential fit was chosen for display to show the contribution of the more representative component inside the oil (Table 2). The aging status of different turbine oils can be distinguished in the measured T2eff,long and an increase in service time yields a decrease in transverse relaxation time T2eff,long. The differences in T2eff,long are not large but they are reproducible and reliable:
3.2. Longitudinal Relaxation Time Measurements
Since in an inhomogeneous magnetic environment it is practically impossible to obtain FID signals, inversion recovery as described by Hurliman in [20] with CPMG added, as implemented in the Prospa software (Magritek, Wellington, New Zealand) was employed as the sequence for measuring T1 of the oils. The CPMG echo train was summed on the spectrometer before being returned to the software Prospa. The integrals of the CPMG echoes were fitted to Equation (2):
For clarity, only the first 30 points of the curves are shown in Figure 6. As the reproducibility of the short component was not reliable, only the long component T1,long was chosen to represent the longitudinal relaxation time of the turbine oils. From Table 3, an increase in the service time yields a decrease in longitudinal relaxation time.
4. Conclusions
The aging status of phosphate ester hydraulic fluids with different service times, from two different power stations, has been studied by 1H relaxation time measurements with a three-magnet array unilateral magnet as a sensor. We demonstrate that the aging results in a decrease in T2eff,long and T1,long relaxation times. Therefore, T2eff,long and T1,long can be used as the indices of turbine oil aging. This method is simple and produces reliable results. The next step will focus on the measurements of more turbine oils to establish a statistical data base and measurements of other sample parameters, such as molecular diffusion, with unilateral magnetic resonance. We propose this method to predict when the turbine oils should be eliminated to prevent unexpected accidents in power stations.
Acknowledgments
This work was financially supported by the National Natural Science Foundation of China (No. 51107150 and 51377186). Pan Guo thanks the scholarship fund from China Scholarship Council for a visiting fellowship at UNB. We thank Bruce J. Balcom for providing the magnet. We thank the Zhejiang electric power company for supplying the turbine oils.
Author Contributions
Pan Guo built the RF probe, finished all the measurements, processed the data and wrote the paper; Wei He provided the idea of measuring turbine oils and supplied the samples; Juan C. García-Naranjo built the magnet and measured the magnetic field.
Conflicts of Interest
The authors declare no conflict of interest.
References
- Rudnick, L.R.; Zaweski, E.F. Phosphate Esters. In Synthetic Lubricants and High-Performance Functional Fluid, 2nd ed.; Marino, M.P., Placek, D.G., Eds.; Marcel Dekker Inc.: New York, NY, USA, 1997; pp. 103–140. [Google Scholar]
- Wright, J. Phosphate ester fluids-benefits and limitations. Mach. Lubric. 2009, 11, 1. [Google Scholar]
- Liu, Y.L. The development and present situation of domestic turbine oils criteria in service. Lubric. Oil 2006, 21, 9–13. [Google Scholar]
- Beatty, D.; Greaves, M. PAGs are rising to the top of the synthetic market. Mach. Lubric. 2006, 9, 1. [Google Scholar]
- Sibul, B.; Crandall, L. EHC Fluid Contamination is a Major Cause of Turbine Forced Outages. Steam Turbine High Pressure System Fluid Solution, Available online: http://www.sibul.com/articles_details.php?article_id=3 (accessed on 1 November 2013).
- Yan, B.; Lai, X.D.; Long, J.H.; Huang, X.; Hao, F. Dynamic characteristics analysis of an oil turbine. Proc. Eng. 2012, 28, 12–17. [Google Scholar]
- Bartl, P.; Zuber, K.; Leipold, M.; Zeman, A. Quality control of used synthetic aviation turbine oils by analytical methods i. determination of the antioxidative capacity by HPLC and GC. Fresenius' Zeitschrift für Anal. Chem. 1983, 314, 25–28. [Google Scholar]
- Zhang, X.M.; Yuan, J.; Chen, B.; Li, P.; Zhang, Y.B.; Wang, L.C. Cause of quality degradation and dehydration purification technology of phosphate ester fire-resistant oil. Environ. Sci. Technol. 2012, 35, 129–133. [Google Scholar]
- Dong, Z.Q. The operation and maintenance for the oil used in regulating system of steam turbine. North. Electr. Power Technol. 2001, 3, 12–14. [Google Scholar]
- Blümich, B.; Perlo, J.; Casanova, F. Mobile single-sided NMR. Progr. Nuclear Magn. Resonance Spectrosc. 2008, 52, 197–269. [Google Scholar]
- Kleinberg, R.L.; Sezginer, A.; Griffin, D.D.; Fukuhara, M. Novel NMR apparatus for investigating an external sample. J. Magn. Resonance 1992, 97, 466–485. [Google Scholar]
- Haken, R.; Blumich, B. Anisotropy in tendon investigated in vivo by a portable NMR scanner, the NMR-MOUSE. J. Magn. Resonance 2000, 144, 195–199. [Google Scholar]
- Xu, Z.; Zhao, S.J.; Guo, P. A portable NMR sensor used for assessing the aging status of silicone rubber insulator. Appl. Magn. Resonance 2013, 44, 1405–1417. [Google Scholar]
- Rahmatallah, S.; Li, Y.; Seton, H.C.; Gregory, J.S.; Aspden, R.M. Measurement of relaxation times in foodstuffs using a one-sided portable magnetic resonance probe. Eur. Food Res. Technol. 2006, 222, 298–301. [Google Scholar]
- Marble, A.E.; Mastikhin, I.V.; Colpitts, B.G.; Balcom, B.J. A compact permanent magnet array with a remote homogeneous field. J. Magn. Resonance 2007, 186, 100–104. [Google Scholar]
- Garcia-Naranjo, J.C.; Mastikhin, I.V.; Colpitts, B.G.; Balcom, B.J. A unilateral magnet with an extended constant magnetic field gradient. J. Magn. Resonance 2010, 207, 337–344. [Google Scholar]
- Hurlimann, M.D.; Griffin, D.D. Spin dynamics of carr-purcell-meiboom-gill-like sequences in grossly inhomogeneous B0 and B1 fields and application to NMR well logging. J. Magn. Resonance 2000, 143, 120–135. [Google Scholar]
- Provencher, S.W. A constrained regularization method for inverting data represented by linear algebraic or integral equations. Commun. Comput. Phys. 1982, 27, 213–227. [Google Scholar]
- Chelcea, R.I.; Fechete, R.; Culea, E.; Demco, D.E.; Blumich, B. Distributions of transverse relaxation times for soft-solids measured in strongly inhomogeneous magnetic fields. J. Magn. Resonance 2009, 196, 178–190. [Google Scholar]
- Hurlimann, M.D. Diffusion and relaxation effects in general stray field NMR experiments. J. Magn. Resonance 2001, 148, 367–378. [Google Scholar]
© 2014 by the authors; licensee MDPI, Basel, Switzerland. This article is an open access article distributed under the terms and conditions of the Creative Commons Attribution license ( http://creativecommons.org/licenses/by/3.0/).