Figure 20.
Random vibration applied on crystal oscillator 0 < |ξ| < π, 0 < |β| < π. (a) Fixed oscillator; (b) Oscillator on gyroscopic mounting.
Mechanical random vibration of the Ariane 4 launch vehicle is shown in
Figure 20a [
32]. Generally, this load is defined by Acceleration Spectral Density (ASD) in (g
2/Hz). Since random vibration is a combination of all the frequencies at the same time, it is necessary to configure this load in the time domain. According to the Parseval’s law, g
rms is equal to 1σ of random vibration. Thus the random vibration in time domain can be shown according to
Figure 21b by calculation of g
rms from ASD.
On the other hand, there could be an infinite number of input ASD curves which have the same area, and therefore the same grms. Therefore, beside analysis in time domain, it is necessary to analyze the random vibration in the frequency domain.
Figure 21.
Mechanical random vibration for the Ariane 4 launch vehicle. (
a) ASD (g
2/Hz); Adapted from [
32]. (
b) Time domain representation.
5.4.1. Random Vibration in Time Domain
(b) Impact on crystal oscillator short-term stability
Random vibration causes short-term instability as frequency jitter and phase noise in oscillator output.
Frequency jitter, Phase jitter and Phase Noise Gyro Effect on frequency and phase where: Critical state is β = 0 and ξ = φ. Maximum gyro effect appears when β = kπ and ξ − φ = kπ (k = 0, 1 …).
(c) Results and Analysis
To analyze the effects of gyroscopic mounting on random vibration, it is necessary to determine three unknown parameters; angles ξ, β and φ, as shown in
Figure 20.
If ξ = φ and β = 0, thus
and
coincide each other, therefore this mounting shows the best positive effects for low elevation angle φ. If ξ – φ = π/2 or β = π/2, then
and
are perpendicular to each other, in this case gyroscopic mounting shows the worst performance. These results are shown in
Figure 22 and
Figure 23.
Figure 22.
Maximum instability (ξ = φ) caused by random vibration for ƒRV = 2000 (Hz). (a) Frequency jitter of fixed oscillator; (b) Frequency jitter of gyroscopic mounting; (c) Phase noise of fixed oscillator; (d) Phase noise of gyroscopic mounting.
Figure 22.
Maximum instability (ξ = φ) caused by random vibration for ƒRV = 2000 (Hz). (a) Frequency jitter of fixed oscillator; (b) Frequency jitter of gyroscopic mounting; (c) Phase noise of fixed oscillator; (d) Phase noise of gyroscopic mounting.
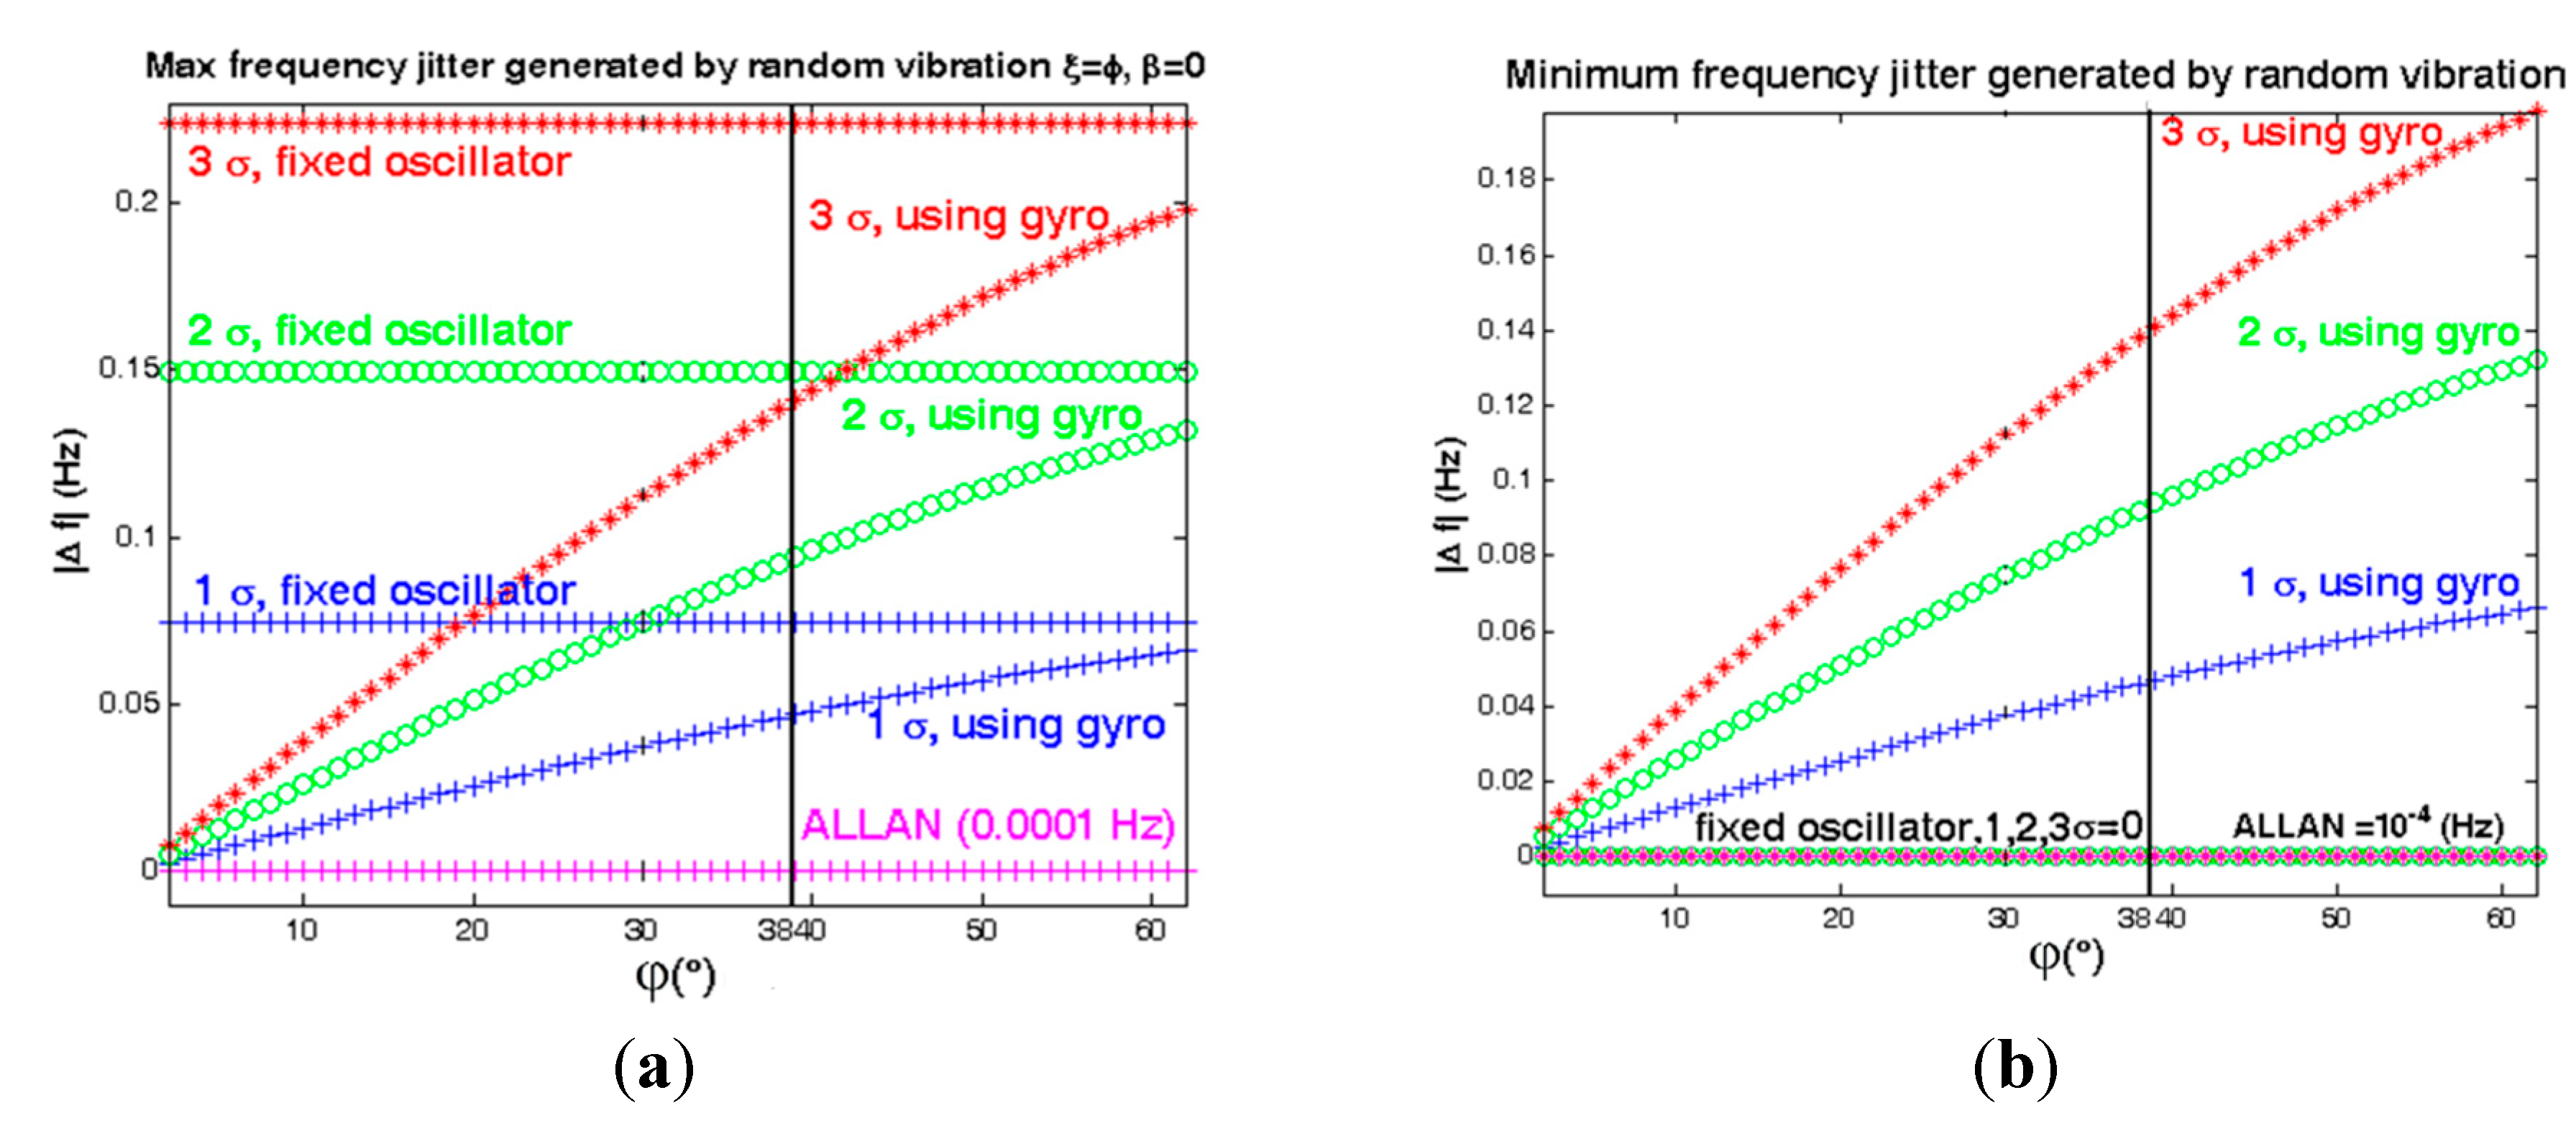
Figure 23.
Comparison between system instability in different states. (a) Maximum state ξ = φ, β = 0; (b) Minimum state, ξ − φ = 90°or β = 90°.
Figure 23.
Comparison between system instability in different states. (a) Maximum state ξ = φ, β = 0; (b) Minimum state, ξ − φ = 90°or β = 90°.
According to
Figure 22 and
Figure 23 and
Table 8, the maximum effects of gyroscopic mounting on frequency jitter can be obtained when β = 0 and φ = 2.6°. In this case, gyroscopic mounting reduces the frequency jitter to near the safety margin of the Allan deviation. Maximum effect on phase noise appears for β = 0 and φ = 2° and this positive effect continues up to β = 60°. Drawbacks start from β > 60° and its maximum value occurs for β = 90° and φ = 38°. With regard to the distribution shown in
Figure 5 for elevation angle φ, the average frequency jitter and phase noise are as shown in
Figure 24 and summarized in
Table 9.
Table 8.
Maximum effects and drawbacks of gyroscopic mounting on random vibration.
Table 8.
Maximum effects and drawbacks of gyroscopic mounting on random vibration.
| Random Vibration Induced Instability |
|---|
| 2.6° < φ < 38°, RV = 3σ, ξ = φ, β = 0 | Fixed Oscillator | Using Gyro | Allan | Gyro Effect |
|---|
| Max gyro effect on Δƒ | 2.24 × 10⁻¹ (Hz) | 7.80 × 10⁻³ (Hz) | 1 × 10⁻⁴ (Hz) | −2.16 × 10⁻¹ (Hz) (96.42%) |
| Max gyro drawback on Δƒ | 3.90 × 10⁻³ (Hz) | 1.14 × 10⁻¹ (Hz) | 1 × 10⁻⁴ (Hz) | +1.10 × 10⁻¹ (Hz) |
| Max gyro effect on £(ƒ) | −85.03 (dBc/Hz) | −114.17 (dBc/Hz) | −152.04(dBc/Hz) | −29.14 (dB) |
| Max gyro drawback on £(ƒ) | −120.19 (dBc/Hz) | −91.31 (dBc/Hz) | −152.04(dBc/Hz) | +28.88 (dB) |
Figure 24.
Average instability caused by random vibration. (a) Frequency jitter; (b) Phase noise.
Figure 24.
Average instability caused by random vibration. (a) Frequency jitter; (b) Phase noise.
Table 9.
Average efficiency of gyroscopic mounting for random vibration.
Table 9.
Average efficiency of gyroscopic mounting for random vibration.
| β = 0, 2° < |φ| < 62° | Fixed Oscillator | Using Gyro | Gyro Effect |
|---|
| Δƒ | 1σ (68.3%) | 0.0697 (Hz) | 0.0273 (Hz) | 0.0424 (Hz) |
| 2σ (95.6%) | 0.1394 (Hz) | 0.0546 (Hz) | 0.0847 (Hz) |
| 3σ (99.7%) | 0.2091 (Hz) | 0.0819 (Hz) | 0.1271 (Hz) |
| £(ƒ) | 1σ (68.3%) | −88.16 (dBc/Hz) | −96.89 (dBc/Hz) | −8.73 (dB) |
| 2σ (95.6%) | −82.55 (dBc/Hz) | −91.28 (dBc/Hz) | −8.73 (dB) |
| 3σ (99.7%) | −79.27 (dBc/Hz) | −87.99 (dBc/Hz) | −8.73 (dB) |
5.4.2. Random Vibration in Frequency Domain
(b) Impact on crystal oscillator short-term stability
Frequency jitter, Phase Jitter and Phase Noise Gyro Effect on frequency and phase where: 20 < ƒ
v < 2000 (Hz), RV: according to Equations (28)–(31), 0 < |β| < π, 0 < |ξ| < π, 0 < |φ| < π/2, Critical state or maximum gyroscopic mounting effect appears when: β = kπ & ξ − φ = kπ (k = 0, 1).
(c) Results and Analysis
According to
Figure 20, when random vibration is applied in the same direction as the g-sensitivity vector,
i.e.,
and
coincide each other and therefore ξ = φ and β = 0, the maximum instability induces to oscillator output which is shown in
Figure 25a,c. In this case, the gyroscopic mounting presents its maximum effect as shown in
Figure 25b,d. This positive effect is in the maximum state for low elevation angle φ.
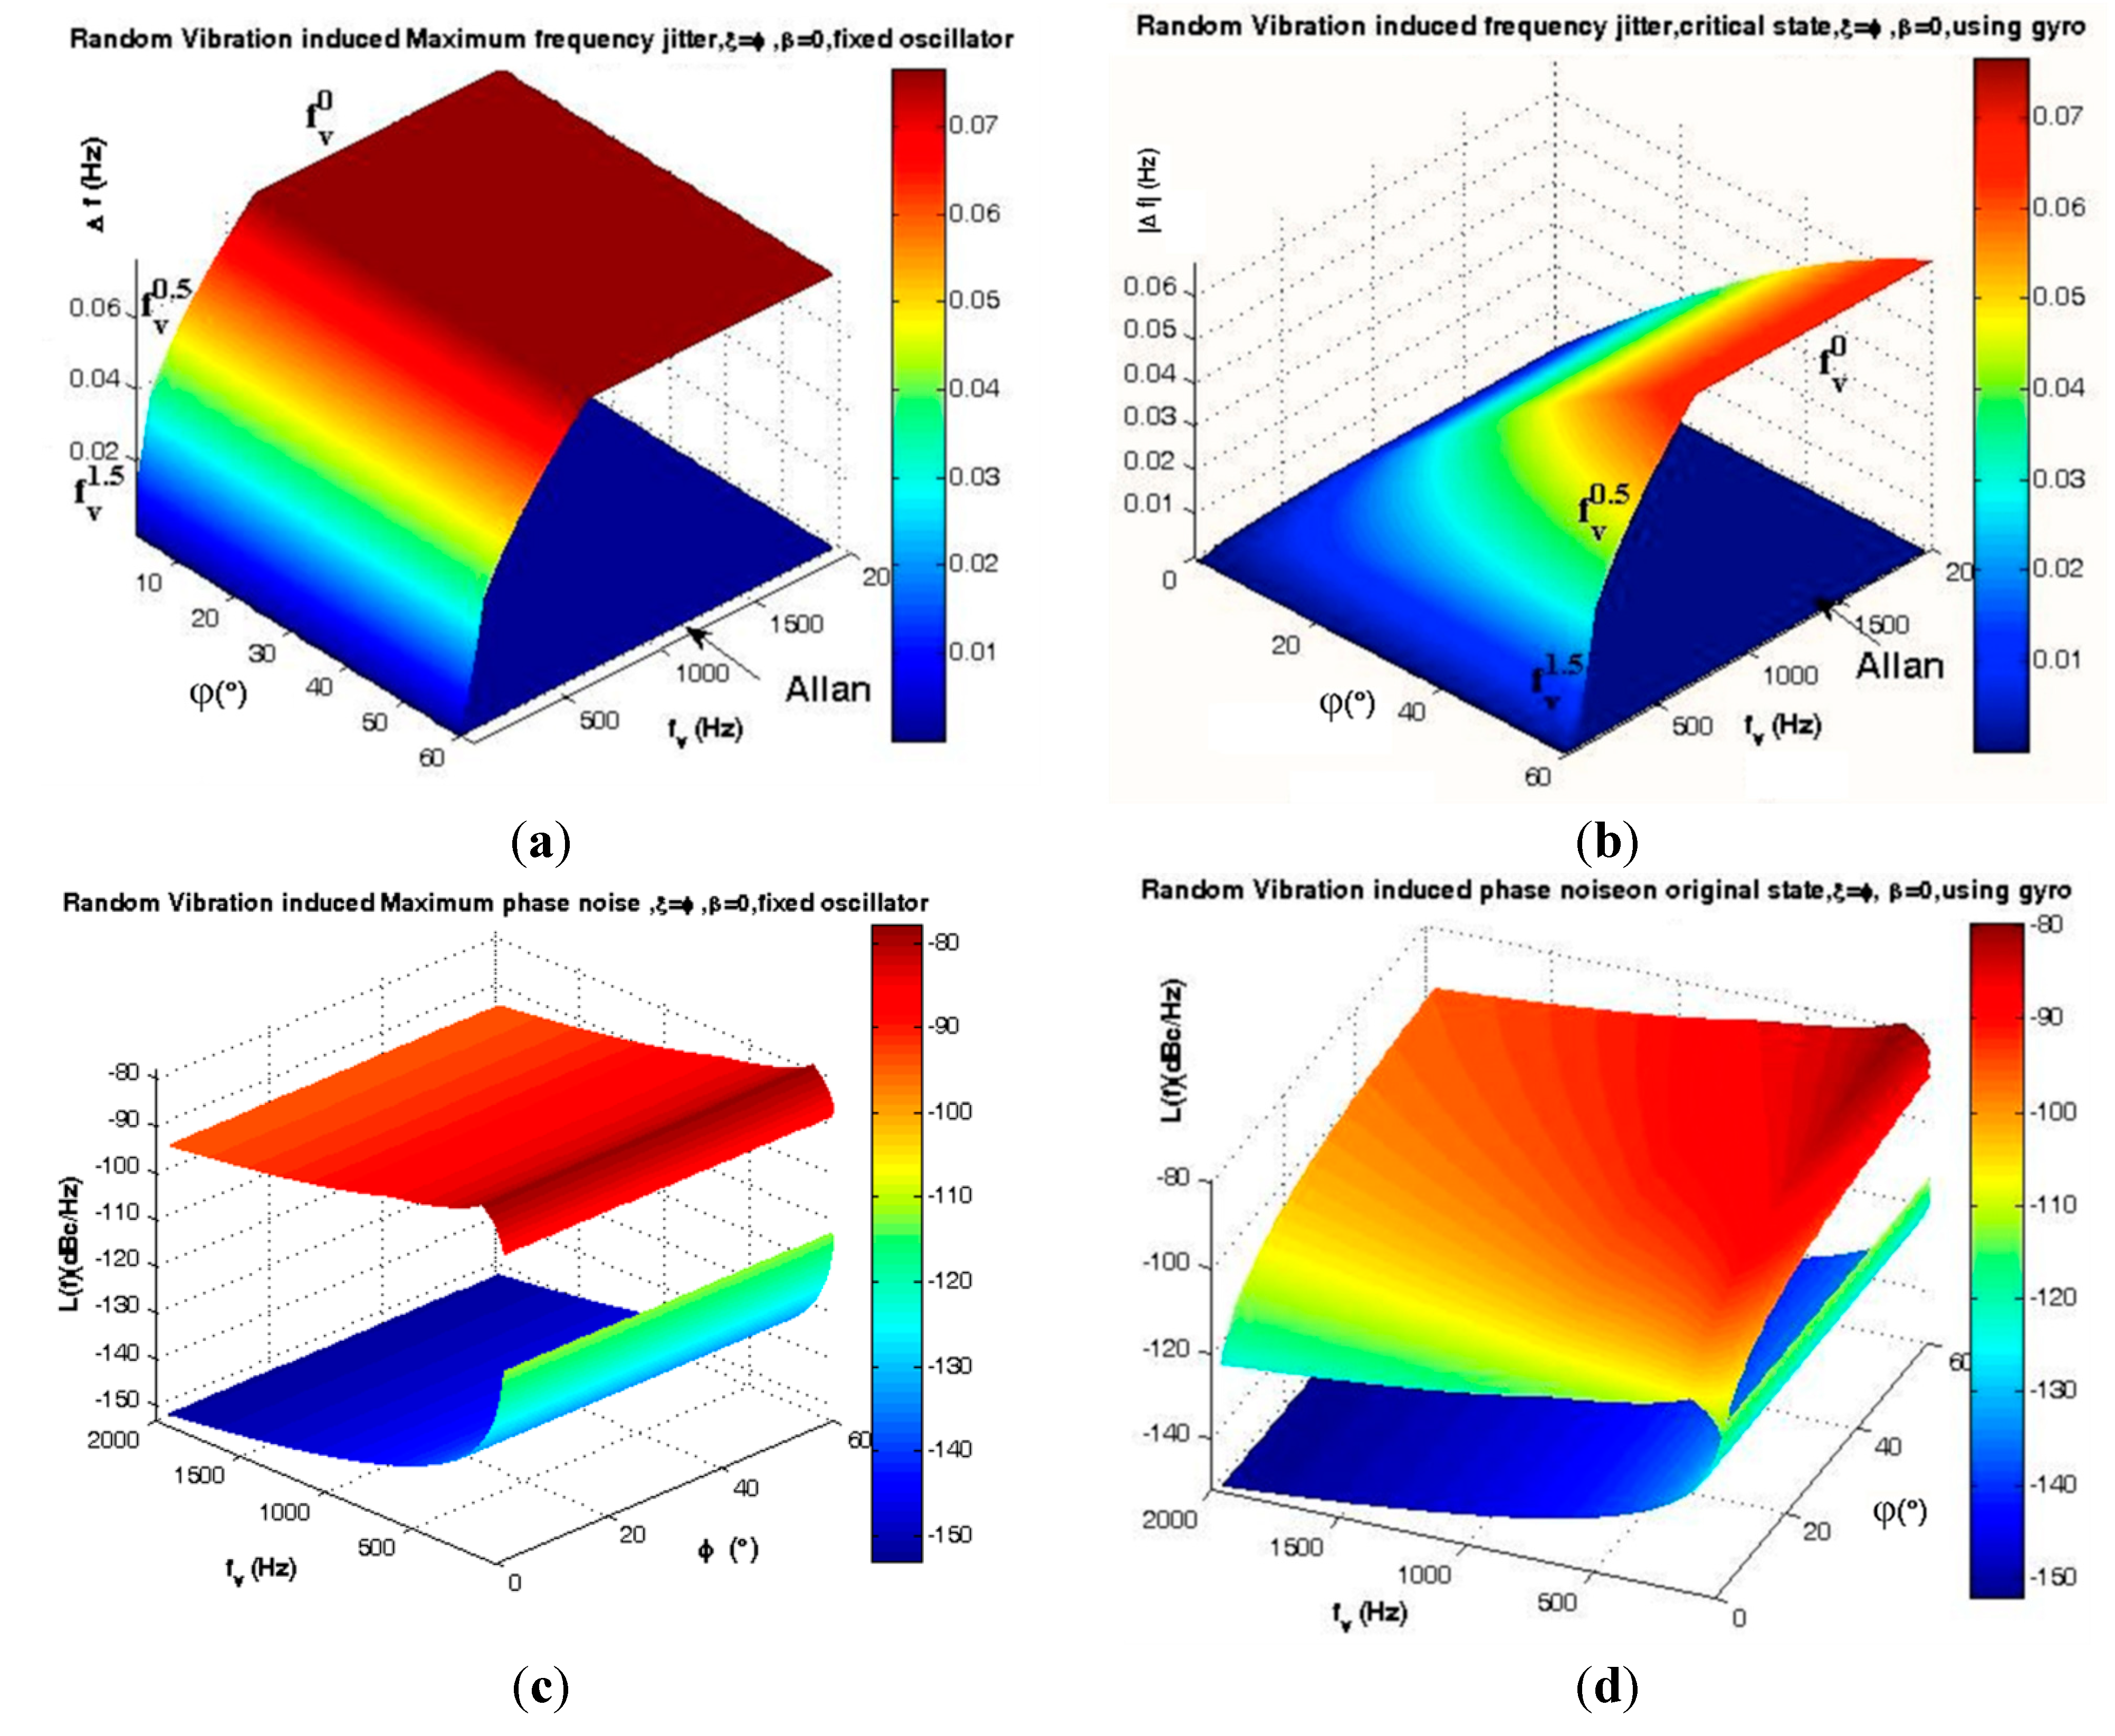
Figure 25.
Analysis of random vibration in frequency domain for ξ = φ, β = 0. (a) Frequency jitter of fixed oscillator; (b) Frequency jitter of gyroscopic mounting; (c) Phase noise of fixed oscillator; (d) Phase noise of gyroscopic mounting.
Figure 25.
Analysis of random vibration in frequency domain for ξ = φ, β = 0. (a) Frequency jitter of fixed oscillator; (b) Frequency jitter of gyroscopic mounting; (c) Phase noise of fixed oscillator; (d) Phase noise of gyroscopic mounting.
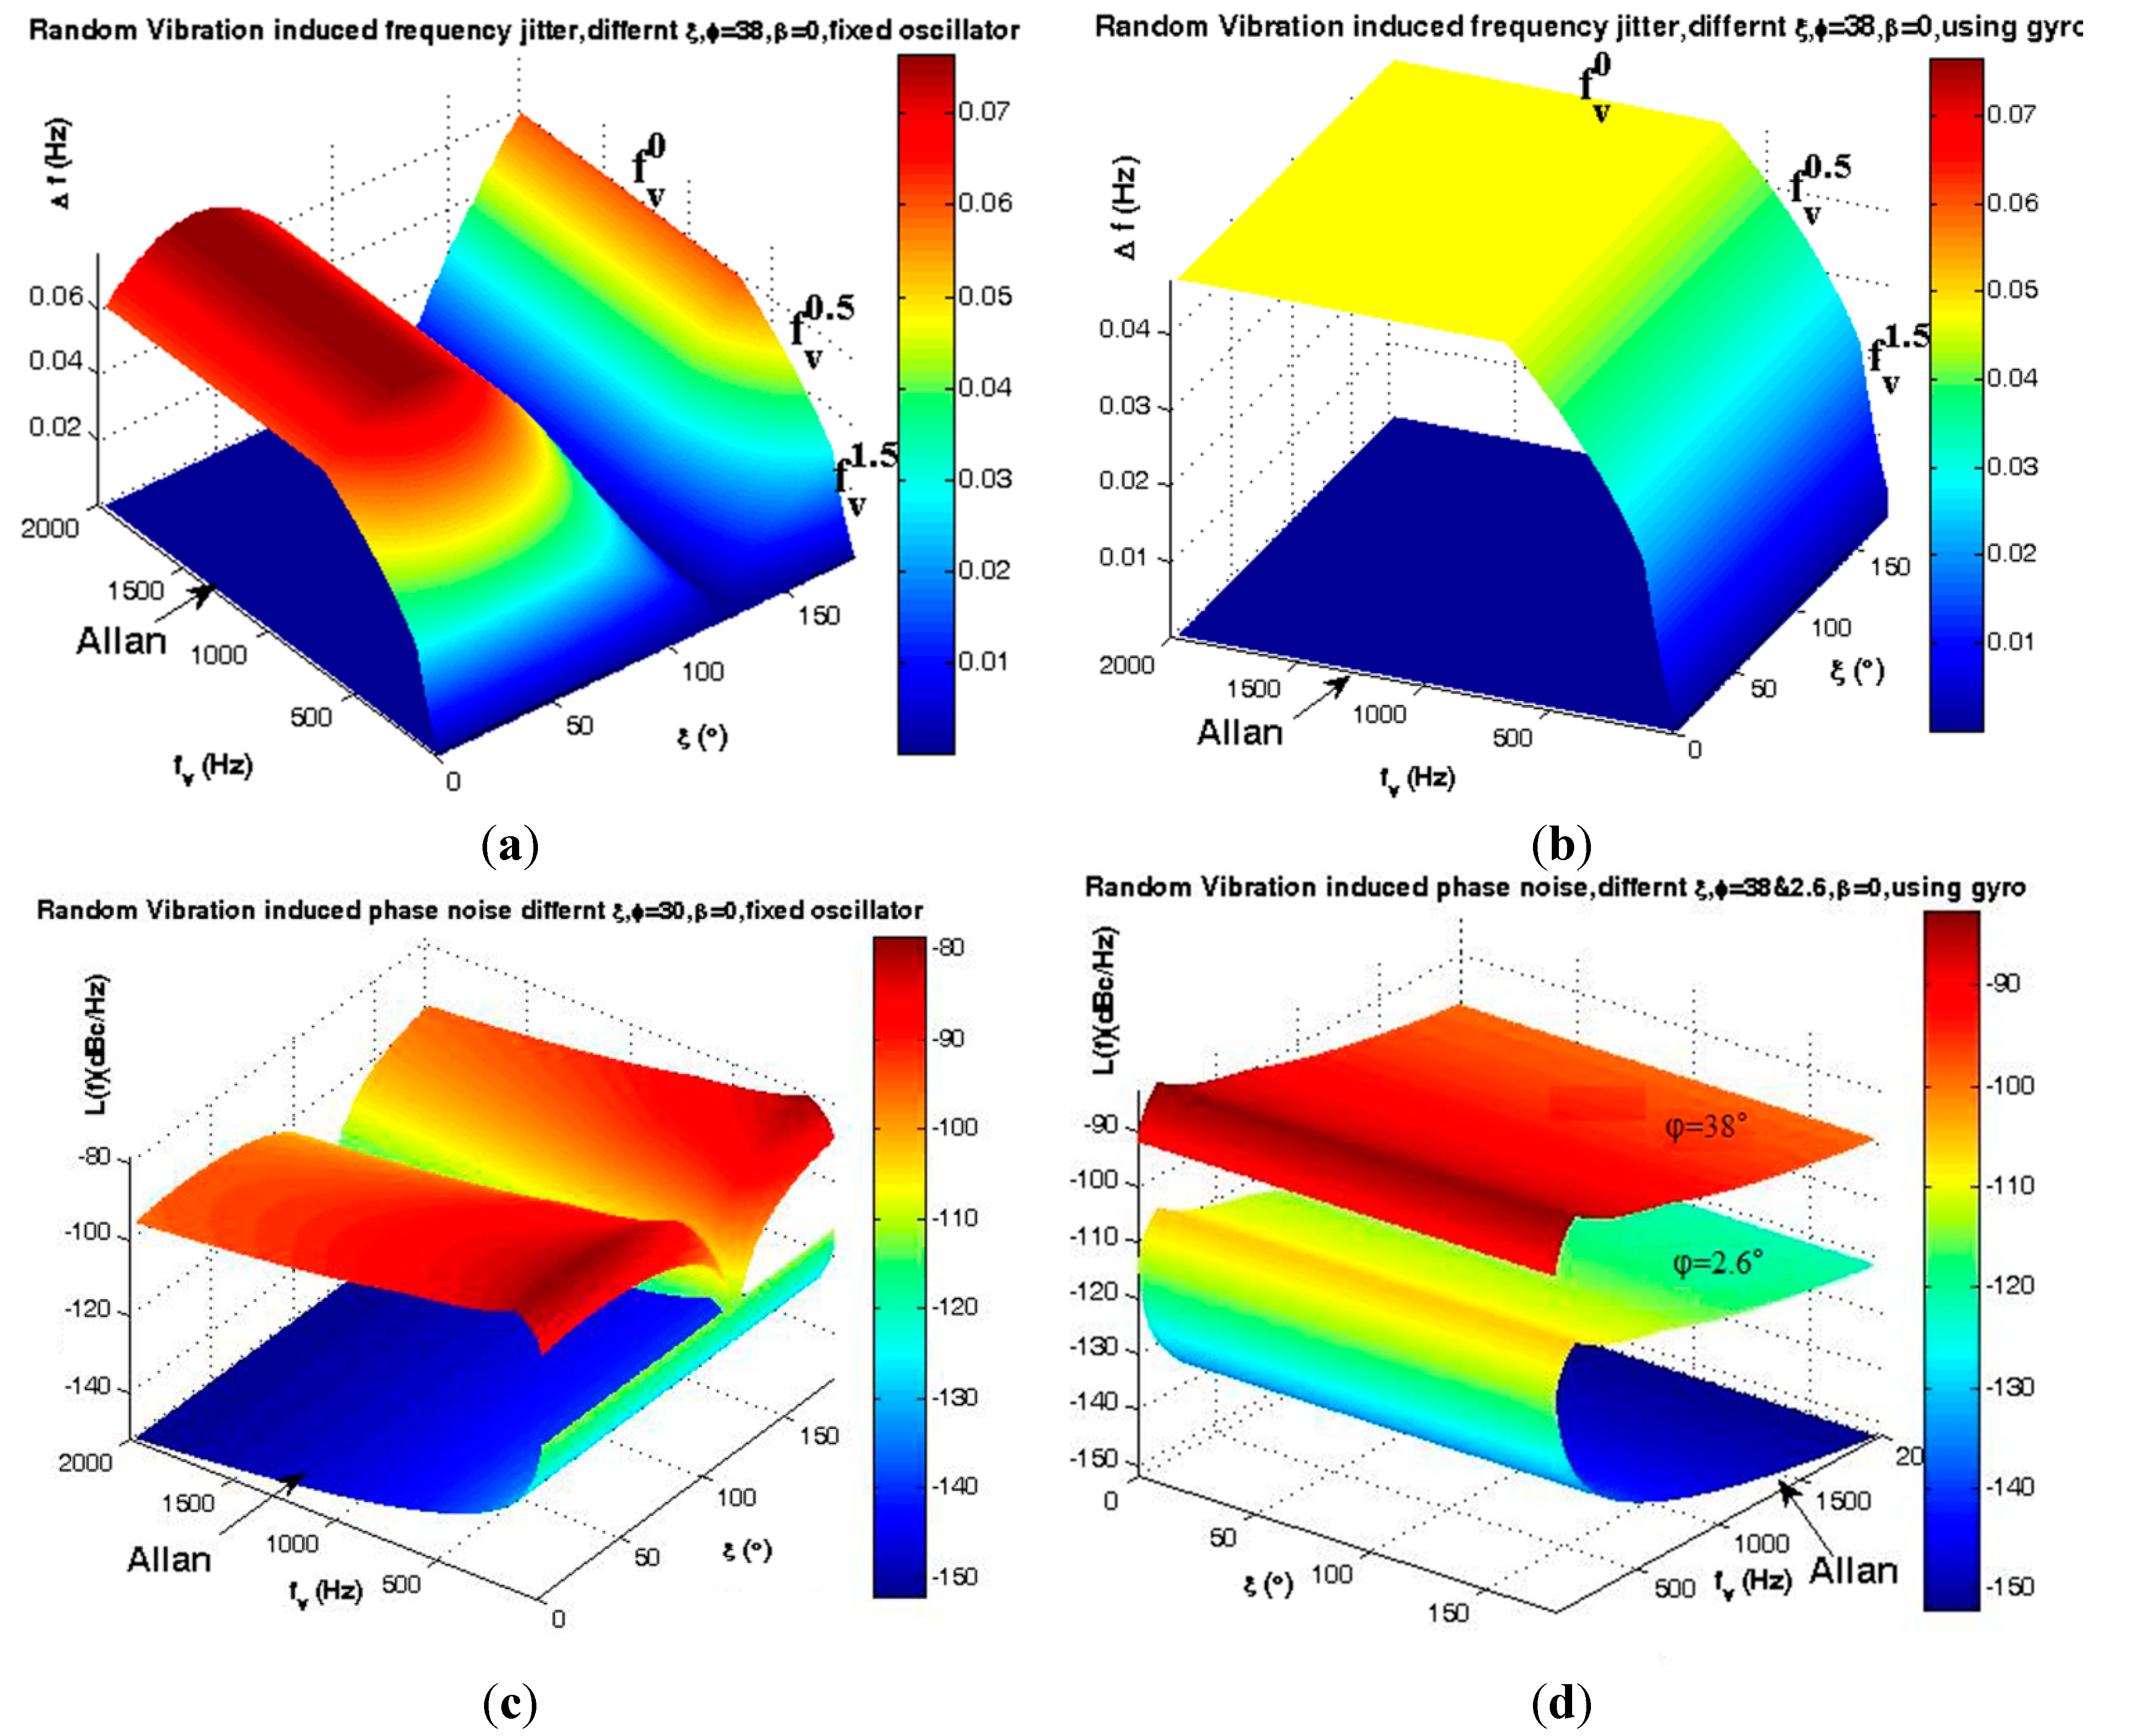
According to
Figure 20, in practice random vibration could be applied in any direction
i.e., 0° < |ξ| < 180°. In this case, the dynamic load induces instability in the oscillator output, which is shown in
Figure 26a,c and the gyroscopic mounting presents its maximum effect, which is shown in
Figure 26b,d. In this case, when ξ − φ = 90° or β = 90°, gyroscopic mounting induces its maximum drawback which is limited to the angles close to the specified margin of ξ − φ = 90°. As shown in
Figure 26d, better effects appear for low elevation angle φ.
Figure 26.
Analysis of random vibration in frequency domain for 0° < |ξ | < 180°, β = 0, φ = 2σ = 38°.(a) Frequency jitter of fixed oscillator; (b) Frequency jitter of gyroscopic mounting; (c) Phase noise of fixed oscillator; (d) Phase noise of gyroscopic mounting.
Figure 26.
Analysis of random vibration in frequency domain for 0° < |ξ | < 180°, β = 0, φ = 2σ = 38°.(a) Frequency jitter of fixed oscillator; (b) Frequency jitter of gyroscopic mounting; (c) Phase noise of fixed oscillator; (d) Phase noise of gyroscopic mounting.


