Abstract
This paper focuses on optimal sensor positioning for monitoring activities of daily living and investigates different combinations of features and models on different sensor positions, i.e., the side of the waist, front of the waist, chest, thigh, head, upper arm, wrist, and ankle. Nineteen features are extracted, and the feature importance is measured by using the Relief-F feature selection algorithm. Eight classification algorithms are evaluated on a dataset collected from young subjects and a dataset collected from elderly subjects, with two different experimental settings. To deal with different sampling rates, signals with a high data rate are down-sampled and a transformation matrix is used for aligning signals to the same coordinate system. The thigh, chest, side of the waist, and front of the waist are the best four sensor positions for the first dataset (young subjects), with average accuracy values greater than 96%. The best model obtained from the first dataset for the side of the waist is validated on the second dataset (elderly subjects). The most appropriate number of features for each sensor position is reported. The results provide a reference for building activity recognition models for different sensor positions, as well as for data acquired from different hardware platforms and subject groups.
1. Introduction
The Body Sensor Network (BSN) has recently been an emerging technology that provides a platform for pervasive healthcare monitoring [1]. The technology is believed to play an important part in improving the quality of life for elderly people and patients. In healthcare monitoring, wearable sensors have been employed for several applications including energy expenditure estimation [2,3,4] and analysis [5,6], fall detection [7], fall risk assessment [8], activities of daily living (ADLs) classification [9,10], motor rehabilitation [11], and cardiac monitoring [12].
Activity recognition is particularly useful in pervasive sensing systems. For fall monitoring, accurate activity classification can enhance the performance of fall detection algorithms [7]. Recognition of lying postures, e.g., supine, lying on the right side, prone, and lying on the left side, is useful for developing a system for preventing pressure ulcers [13]. Accelerometers and gyroscopes are widely used as wearable sensors for activity classification. In [14,15], seven activities, i.e., walking, sitting, standing, jogging, biking, walking upstairs, and walking downstairs, were classified using an accelerometer and a gyroscope. ADL classification using an accelerometer was reported to yield better performance than a gyroscope for all activities, except for walking upstairs and walking downstairs, and the overall recognition accuracy was not improved with the additional use of the gyroscope. Compared to a gyroscope, an accelerometer requires less power [16,17] and is thus a more suitable sensor as power constraint is one of the challenging issues in a BSN application. Other problems and requirements for the effective development of a BSN application can be found in [18].
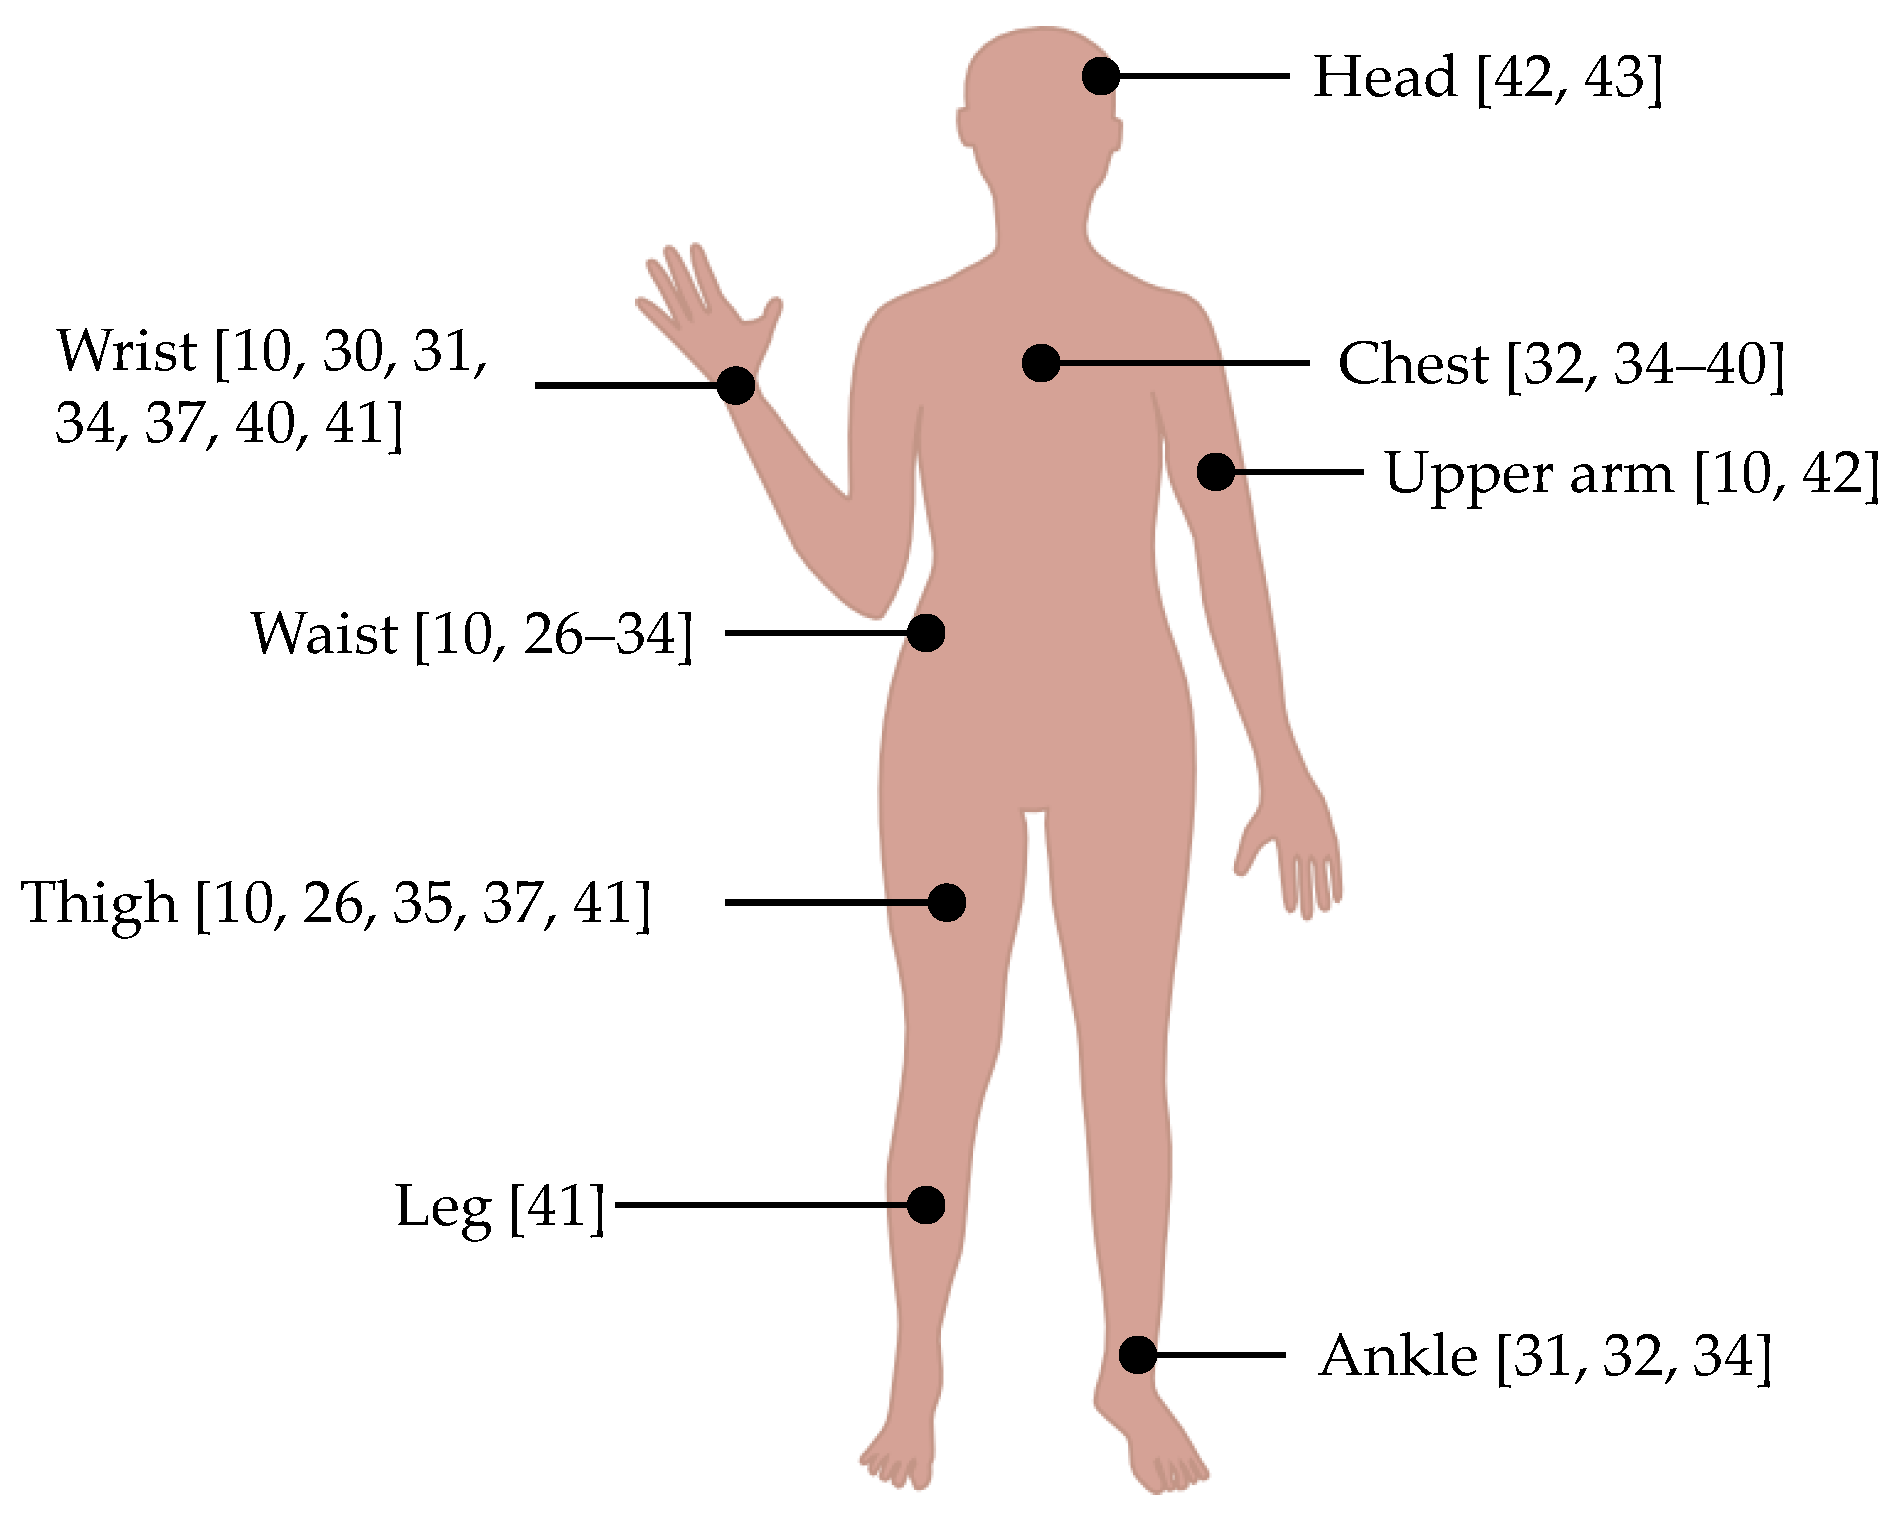
In several studies [19,20,21], multiple sensors have been used either to improve detection accuracy and/or to find an optimal placement. Although higher classification accuracy has been reported with the use of multiple sensors [20], multi-sensor fusion will introduce several research challenges, as discussed in [22]. Taking usability into consideration, a smaller number of sensors is preferable. As depicted in Figure 1, a large variety of sensor positions have been examined in previous studies. In order to find an optimal sensor position, Gjoreski et al. [19] placed tri-axial accelerometers on subject’s chest, waist, thigh, and ankle. Several types of ADLs (e.g., lying, sitting, standing, sitting on the ground, sitting/lying down, standing up, and all fours on the ground) and falls (e.g., tripping, falling slowly, falling from a chair slowly, and falling from a chair quickly) were classified using statistical features, e.g., mean, root mean square, and standard deviation. With only one sensor, the accuracy values of 75% and 77% were achieved at the chest and waist, respectively. Atallah et al. [21] investigated the optimal sensor positions by placing tri-axial accelerometers on different parts of subjects’ bodies. Three feature selection algorithms, i.e., Relief, Simba, and minimum redundancy maximum relevance (mRMR), were used for measuring feature importance. These algorithms gave the same four highest ranked features. With only four features, k nearest neighbor (kNN)yielded reasonable results for distinguishing five levels of activities, i.e., very low, low, medium, high, and transactional activities. In [20], an ADL classification experiment was conducted based on five tri-axial accelerometers placed on the chest, waist, thigh, lower back, and ankle. Eleven types of features were used for classifying seven types of ADLs, i.e., lying, sitting, standing, walking, walking upstairs, walking downstairs, and jogging. Four machine-learning algorithms, i.e., decision tree (J48), naïve Bayes (NB), neural network (NN), and support vector machine (SVM), were evaluated by using a Waikato environment for knowledge analysis (WEKA) Experimenter. With a single sensor, J48 and NB yielded the best accuracy values when the sensor was placed on the ankle, while SVM appeared to be the best classifier for all other positions. Out of the four positions, the waist was reported as the best single position, with an accuracy value of 97.81%. In some studies [23,24,25], other criteria besides accuracy (e.g., computation cost, power consumption, and sensor redundancy) are also considered in the data analysis step. The experiments in these studies involved multiple sensor nodes and were beyond the scope of this study.
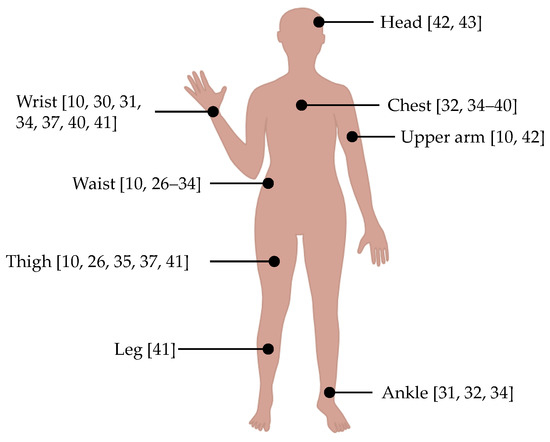
Figure 1.
Different positions for sensor placement. Waist [10,26,27,28,29,30,31,32,33,34]; Chest [32,34,35,36,37,38,39,40]; Wrist [10,30,31,34,37,40,41]; Upper arm [10,42]; Head [42,43]; Thigh [10,26,35,37,41]; Leg [41]; Ankle [31,32,34].
Different studies focused on different types of ADLs, subject groups, hardware, and environment settings. Evaluating an algorithm on a different subject group or hardware platform usually involves collecting new data. Most of the time, the classification performances are thus not directly comparable. However, it has been learned from previous studies that a combination of features obtained from feature selection algorithms and different classification models can be used for discovering the appropriate models and features for classifying ADLs. The main objectives of this paper are twofold:
- To investigate three different factors that affect ADL classification, i.e. sensor positions, features, and classification models.
- To explore the possibility of applying a model trained from data collected in a different experimental setting (e.g., a subject group, a sampling rate, and hardware).
In this study, we focus on optimal sensor positioning for monitoring elderlies’ activities such as sleep postures, sitting, standing, and walking. Collecting data from elderlies (vulnerable subjects) has some limitations. They are uncomfortable with performing certain activities and/or are not able to perform certain activities for a long period of time. Walking upstairs/downstairs, for example, is not included in this study, as many of the elderlies would require assistance to perform these activities and trading the classification accuracy of walking upstairs/downstairs for that of other activities would not benefit a monitoring system for elderlies as a whole. To address the above two objectives, two datasets are used. The first dataset is collected from young subjects using tri-axial accelerometers placed on different body parts. The second dataset is collected from elderly subjects using a different hardware platform and a different sampling rate. By using the data collected from young subjects, we first study various combinations of features and models on different sensor positions and analyze how the three factors (i.e., sensor positions, features, and classification models) affect the ADL classification. The best obtained model is then applied on the dataset collected from elderly subjects.
2. Data Descriptions
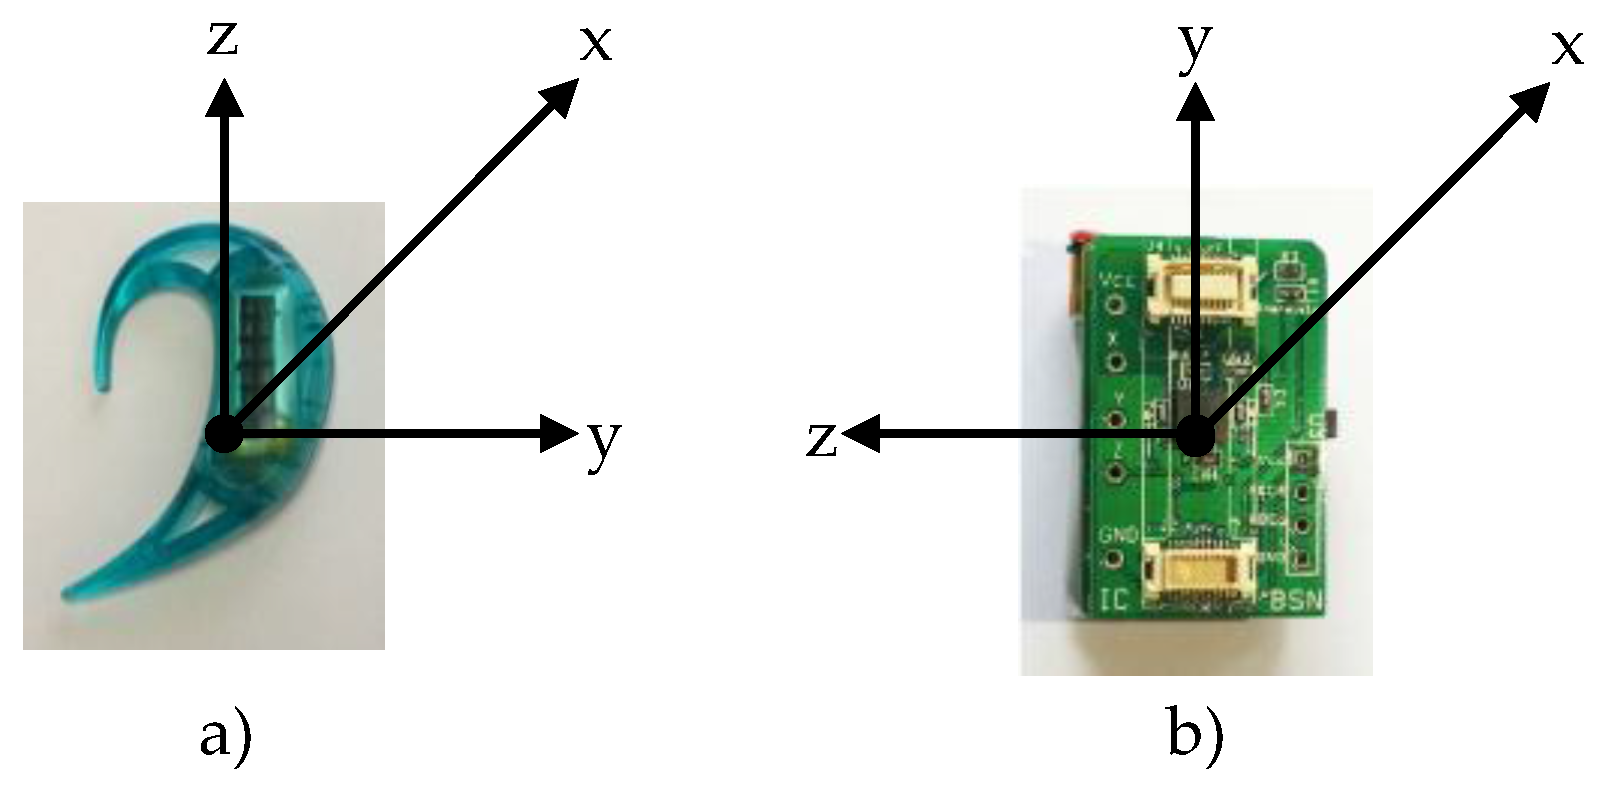
This study involves two datasets, i.e., DS1 for deriving appropriate combinations of features and activity classification models on different sensor positions and DS2 for assessing the performance of pre-trained models when applied to data obtained using another data collection scenario. Wireless ear-worn activity recognition (e-AR) sensors [44] and a BSN node [45] developed by Imperial College were used for collecting DS1 and DS2, respectively. An e-AR sensor uses a Nordic nRF24LU1P processor with an IEEE 802.15.4 (2.4 GHz) integrated radio transceiver. A BSN node is based on a TI MSP430F1611 processor and equipped with a separate radio transceiver (Chipcon CC2420, Chipcon Co. Ltd., Oslo, Norway). Figure 2 shows an e-AR sensor and a BSN node along with the coordinate systems of their embedded tri-axial accelerometers.

Figure 2.
An ear-worn activity recognition (e-AR) sensor (a) and a Body Sensor Network (BSN) node (b) along with their coordinate systems.
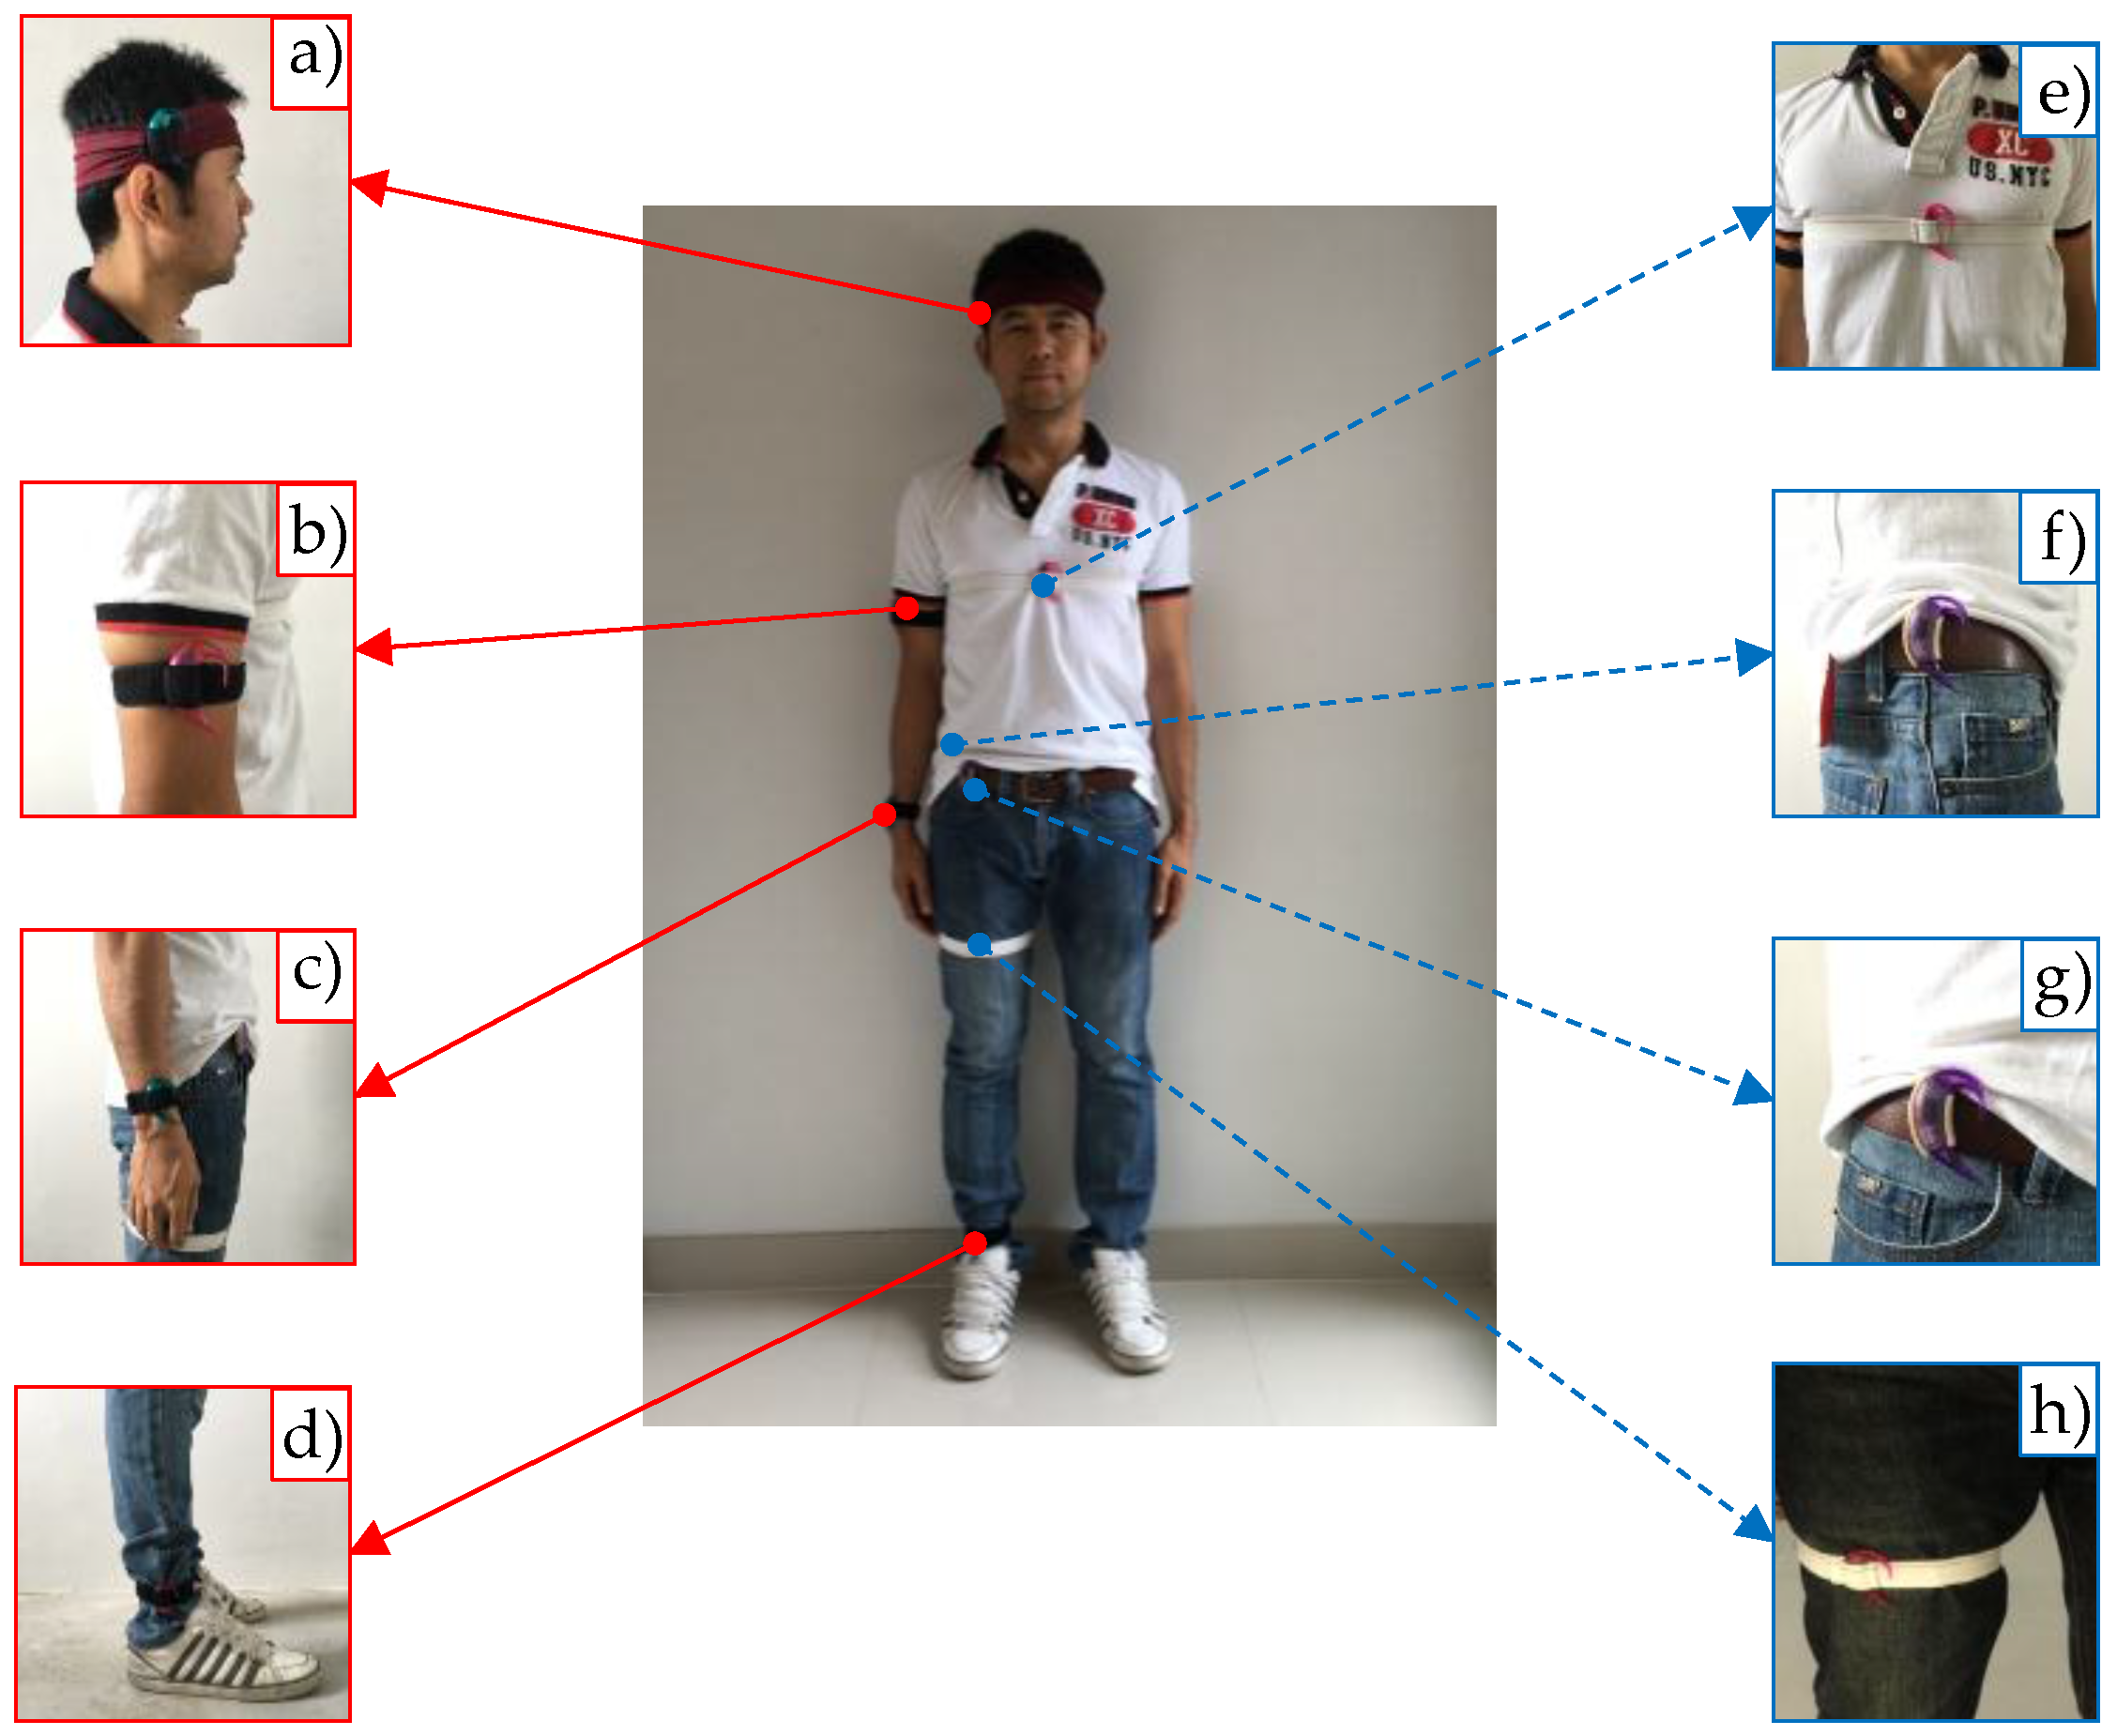
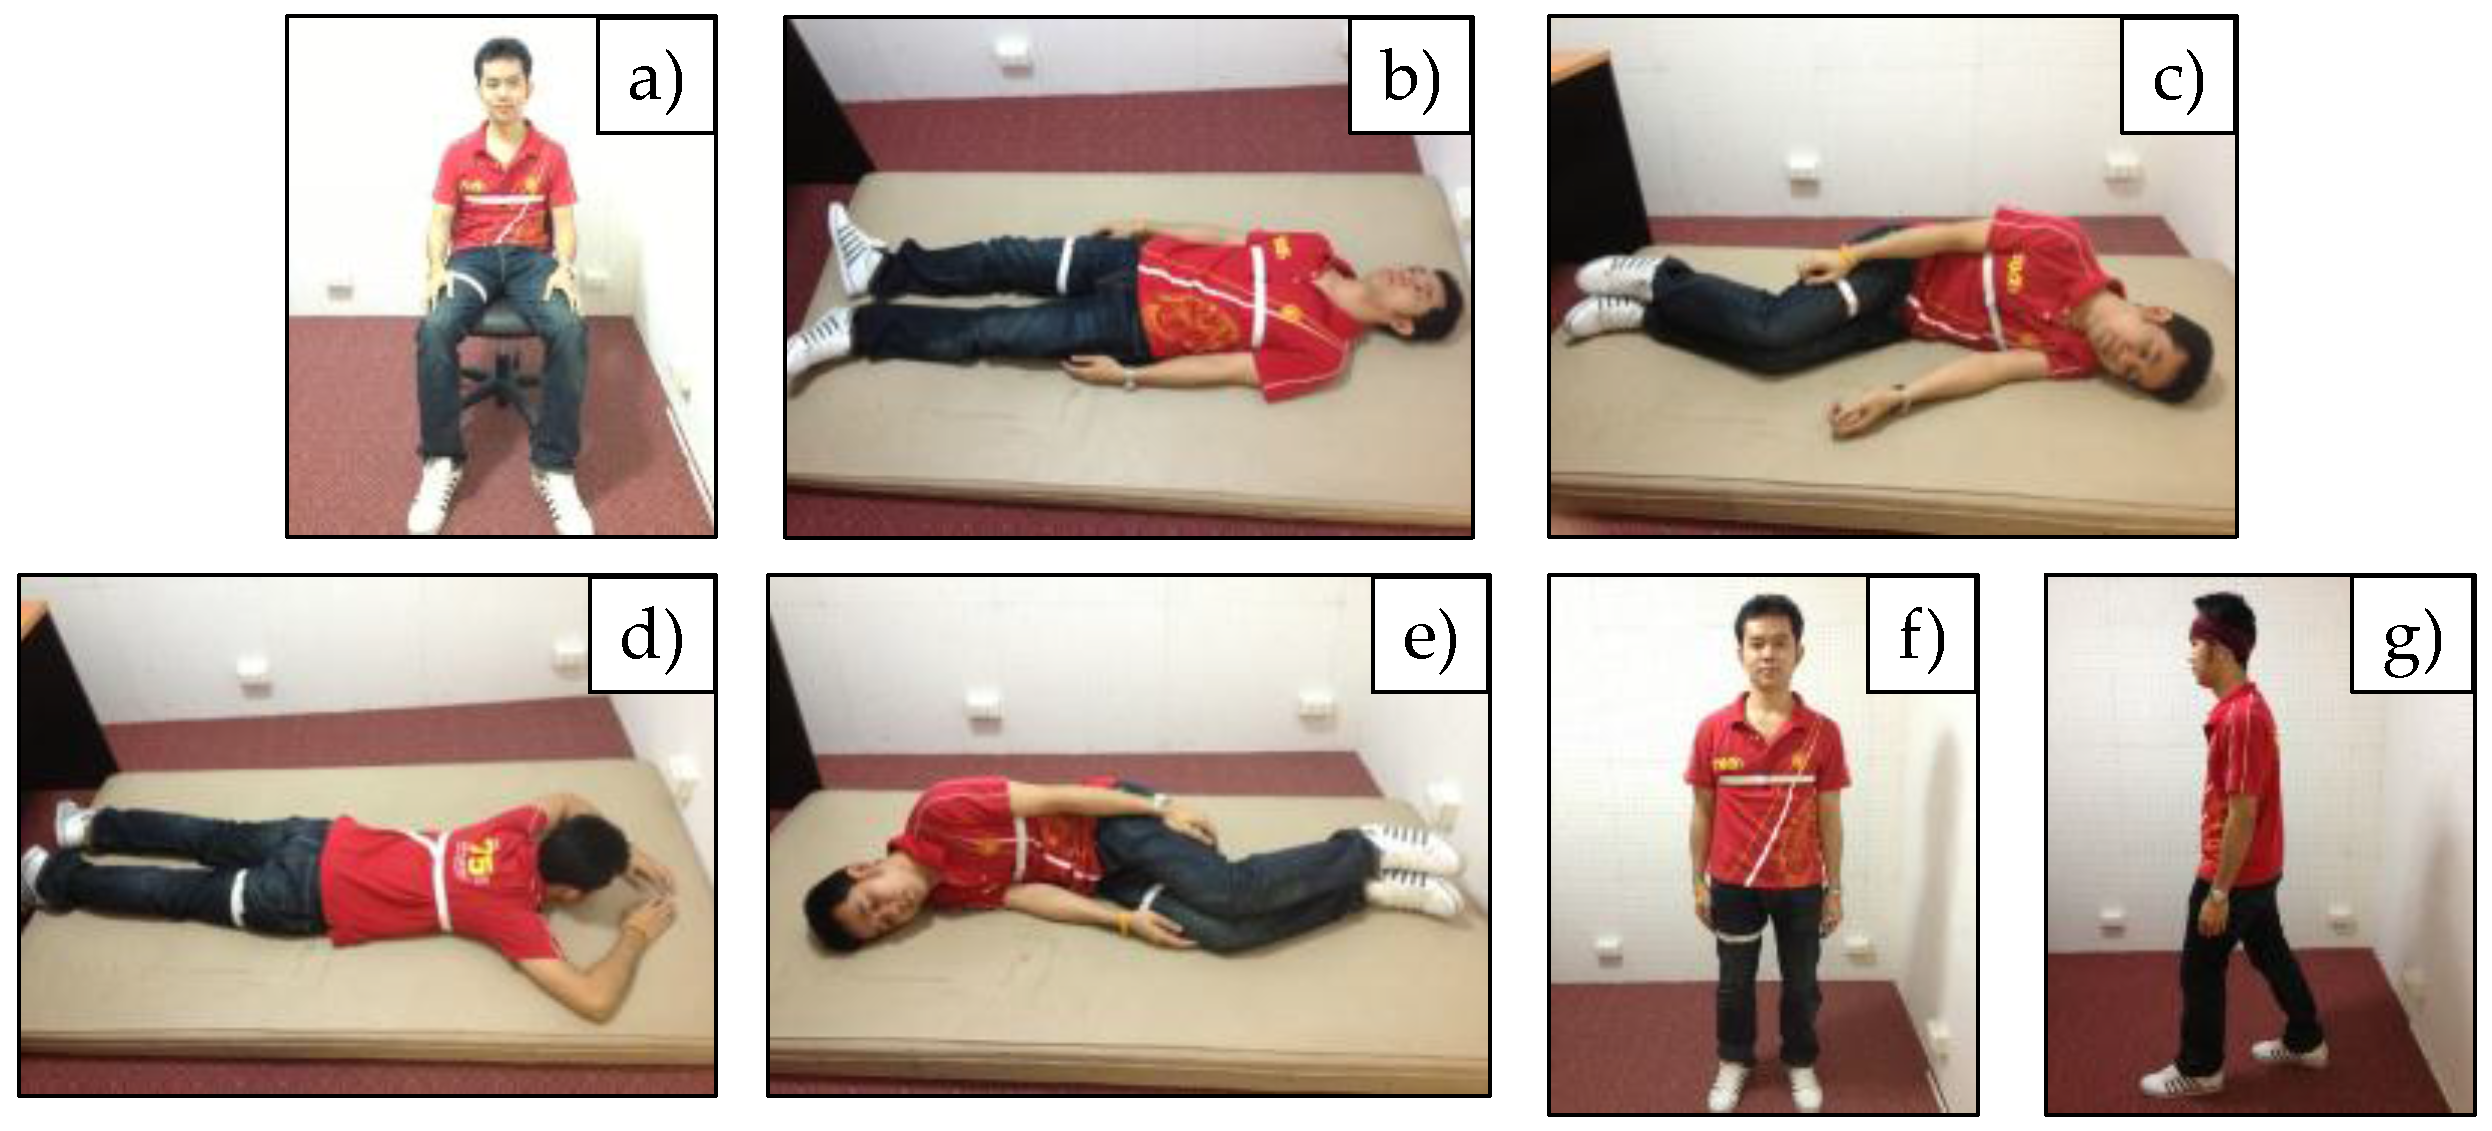
The dataset DS1 was collected (using e-AR sensors) from 12 subjects (6 male and 6 female), aged between 23–45 years. Acceleration signals were sampled at 15 Hz and transmitted to a computer through a receiver board. As shown in Figure 3, the e-AR sensors were placed on eight different body positions, i.e., (a) the side of the head, (b) the upper arm, (c) the wrist, (d) the ankle, (e) the chest, (f) the side of the waist, (g) the front of the waist, and (h) the thigh. The twelve subjects were asked to perform a sequence of seven activities, i.e., (a) sitting on a chair, (b) supine, (c) lying on the left side, (d) prone, (e) lying on the right side, (f) standing, and (g) walking, as shown in Figure 4. Each subject performed each activity for approximately 15 s.
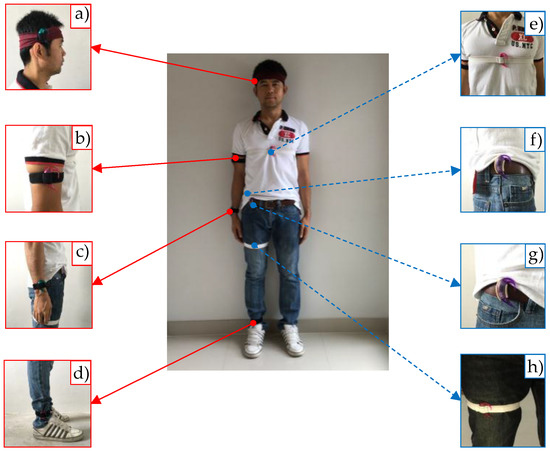
Figure 3.
Sensor placements.
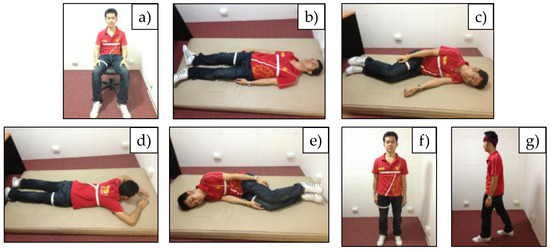
Figure 4.
A young subject performing a sequence of seven activities.
The dataset DS2 was collected (using a BSN node) from 48 healthy elderly subjects (20 males and 28 females), with an average age of 67.52 years. Acceleration signals were sampled at 50 Hz. The subjects were asked to perform a routine of six activities, i.e., (a) sitting on a branch, (b) standing, (c) walking, (d) supine, (e) lying on the left side, and (f) lying on the right side, which are shown in Figure 5, with a tri-axial accelerometer being attached only to the side of the waist. Compared to the activities considered in DS1, prone was excluded since it was uncomfortable for the elderly subjects.
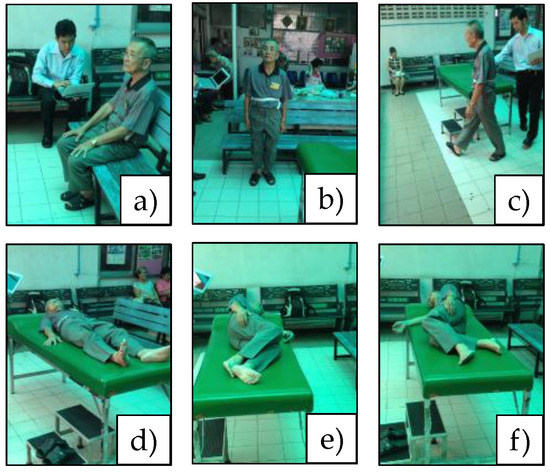
Figure 5.
An elderly subject performing a sequence of six activities.
The study was approved by the Ethical Committee for Human Research of the National Science and Technology Development Agency (NSTDA), Thailand (document number 0010/2558), and informed consent was obtained from subjects prior to their participation.
3. Data Analysis
3.1. Feature Extraction
Prior to feature extraction, data preprocessing is required. For instance, to handle different sampling rates, acceleration signals with a high data rate were down-sampled. To cater for different device coordinate systems, a transformation matrix was used for aligning signals to the same coordinate system. To deal with noises in acceleration signals, a median filter technique was employed. To cater for inter-subject and hardware variations, acceleration signals were normalized by subtracting the median values of signals acquired during standing. Table 1 describes the features used in this study along with the feature extraction functions. The functions are applied on normalized data using a fix-sized window of 1 s, shifted by 0.5 s at each time step.

Table 1.
List of features and their equations.
3.2. Feature Selection
Compared to other approaches to feature selection, a feature ranking approach, in general, requires lower computation complexity and entails a lower risk of overfitting [46]. In [21], three feature selection algorithms were examined, i.e., Relief, Simba, and mRMR, and it was reported that these algorithms yielded similar feature importance, especially for the first four highest ranked features. Relief-F [47], which is an extended version of Relief [48], was reported as the best feature selection algorithm in [49] compared to Fast Correlation Based Filter and Correlation Based Feature Selection. It was one of the most widely used feature selection algorithms, with low computational time [50] and the ability to deal with incomplete and noisy data, and can be used for evaluating feature quality in multi-class problems [51].
In this study, Relief-F was used to determine the most appropriate feature sets. The algorithm ranks individual features according to feature relevance scores. It randomly selects an instance R and finds the nearest sample H from the same class and the nearest sample M from a different class. Given a feature A and its feature relevance score W[A], instead of looking for the nearest sample M from only one different class, Relief-F searches one M for each different class C and averages their contributions to updating W[A] by
where n is the number of instances used for approximating the probabilities; given a sample x, Δ(A(R), A(x)) is the difference between the value of the feature A of the instance R and the value of that of x; class(R) denotes the class to which R belongs; and M(C) and P(C) denote the nearest sample in the class C and the probability of the class C, respectively.
3.3. Classification Algorithms
The following classification algorithms are used in this study.
- Bayesian network (BN) [52]: BN is a directed acyclic graphical model describing relationships between features and classes. Each node in a graph corresponds to a feature, and a directed edge between two nodes represents a causal relationship between them. By observing feature values and the class of each element in the set of data samples, one can construct such a network and use it to compute the probability of each class given an unseen sample. The class with the highest probability will be assigned to the sample. In our experiment, conditional probability tables are estimated by using a simple estimator, and network structures are learned from the data distribution by using the K2 search algorithm along with Bayesian scores.
- Naïve Bayes (NB) [53]: NB is a simple Bayes’ theorem-based probabilistic classifier with independent assumptions among features.
- Pruned decision tree (J48) [54]: J48 is a Java implementation of the C4.5 decision tree algorithm. C4.5 determines ‘information gain’ of each feature by comparing entropies of the data before and after considering the feature. C4.5 tries to construct a decision tree in which each node tests a feature value. Although the algorithm is proved to be very useful, features with many possible values could lead to overfitting. This problem could often be resolved by pruning some branches of the tree.
- Partial-tree rule learning (PART) [55]: PART uses the C4.5 decision algorithm to create a set of classification rules. However, unlike the ordinary C4.5, PART does not expand (or grow) a tree from the root to leaf nodes. It uses only a partially created tree that contains nodes with the lowest entropy to generate a set of rules. The instances covered by the created rules are then removed from the dataset. The process is repeated until all instances are covered.
- Instance-based learning [56]: Instead of building a classification model, an instance-based learning algorithm uses a set of given data as part of the classifier. The idea is built around an algorithm called k nearest neighbor (kNN). kNN treats each sample as a point in an M-dimensional space, where each dimension corresponds to one feature. It is assumed that elements of the same class should be close to each other (since they have similar properties, i.e. similar feature values). To classify an unseen sample, kNN finds k nearest data samples (or ‘neighbors’) and assigns the majority class of those samples to it.
- Multi-layered perceptron [57]: Sometimes referred to as neural network (NN), the algorithm classifies data samples using a layered structure (network) of small processing units, i.e., perceptrons. A perceptron takes in multiple inputs and produces a single output using a simple calculation function. Each input is associated with a computational weight. To classify a data sample, perceptrons in the first layer consider feature values of the samples and forward the output results to those in the next layer. Each perceptron in a subsequent layer produces an output by considering the results obtained from all perceptrons in its previous layer along with their corresponding weights. The process is repeated until the last layer is reached. A class is assigned to an unseen data sample based on the results of the last layer. The network can be trained to adapt itself to solve specific problems by continually adjusting the weight of each input to each perceptron.
- Support vector machine (SVM) [58]: SVM is a supervised machine learning algorithm, which can be used for both classification or regression analysis. Its basic principle is to define decision boundaries between a set of objects having different class memberships by constructing hyper planes in a multidimensional space. In our experiment, SVM is trained by applying a sequential minimal optimization algorithm with a polynomial kernel being used as a support vector.
In our experiments, we set the number k of neighbors for instance-based learning to 1 and 3. The performance of the eight algorithms, i.e., BN, NB, J48, PART, 1NN, 3NN, NN, and SVM, are compared. The classification models were developed in Java using WEKA application program interface with their default parameters.
4. Results
4.1. Validation Using DS1 (Young Subjects)
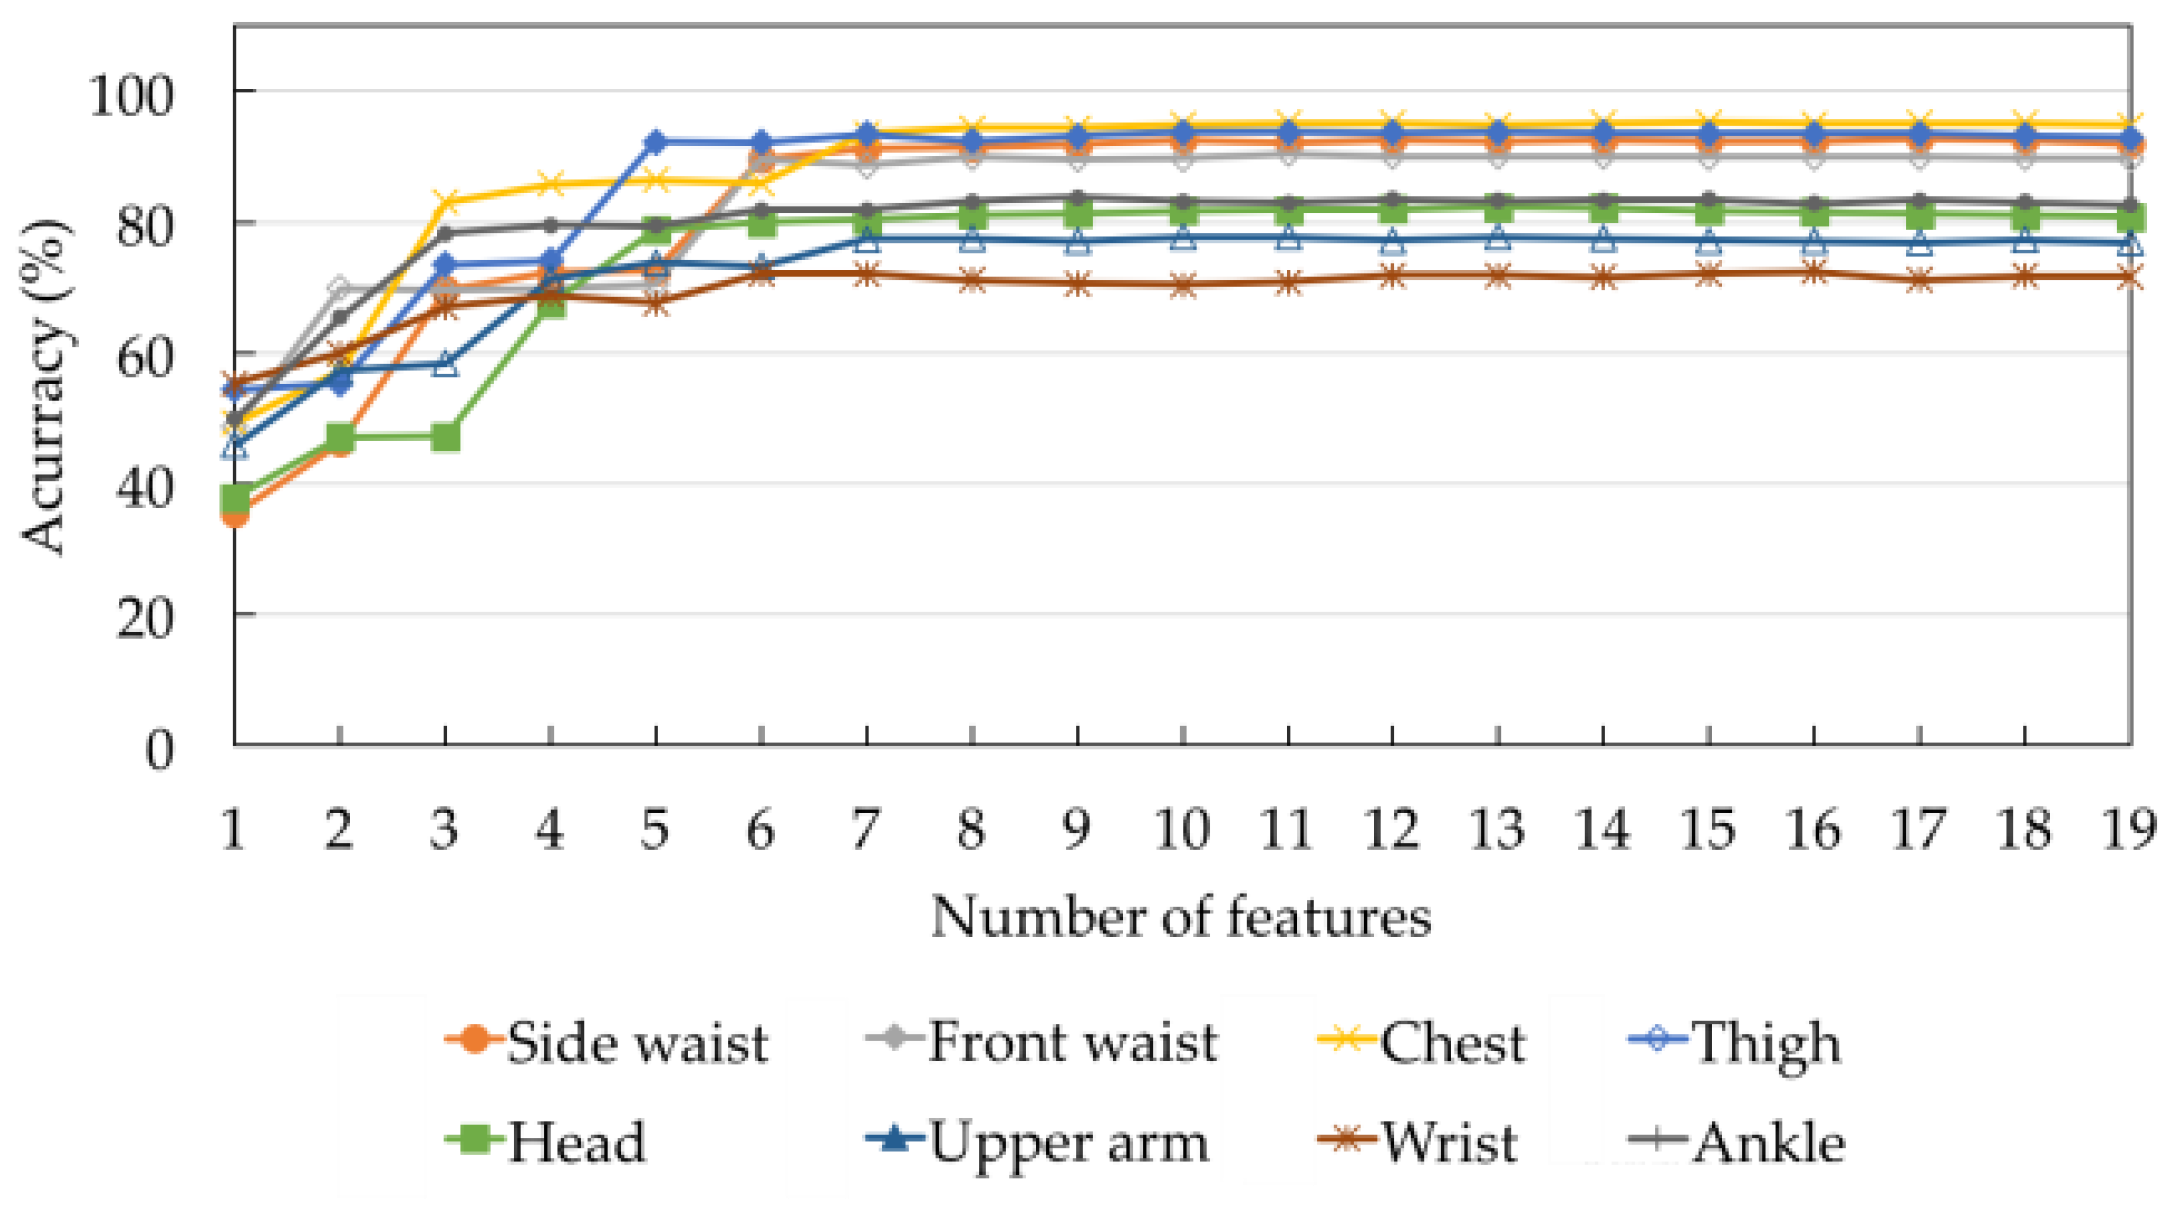
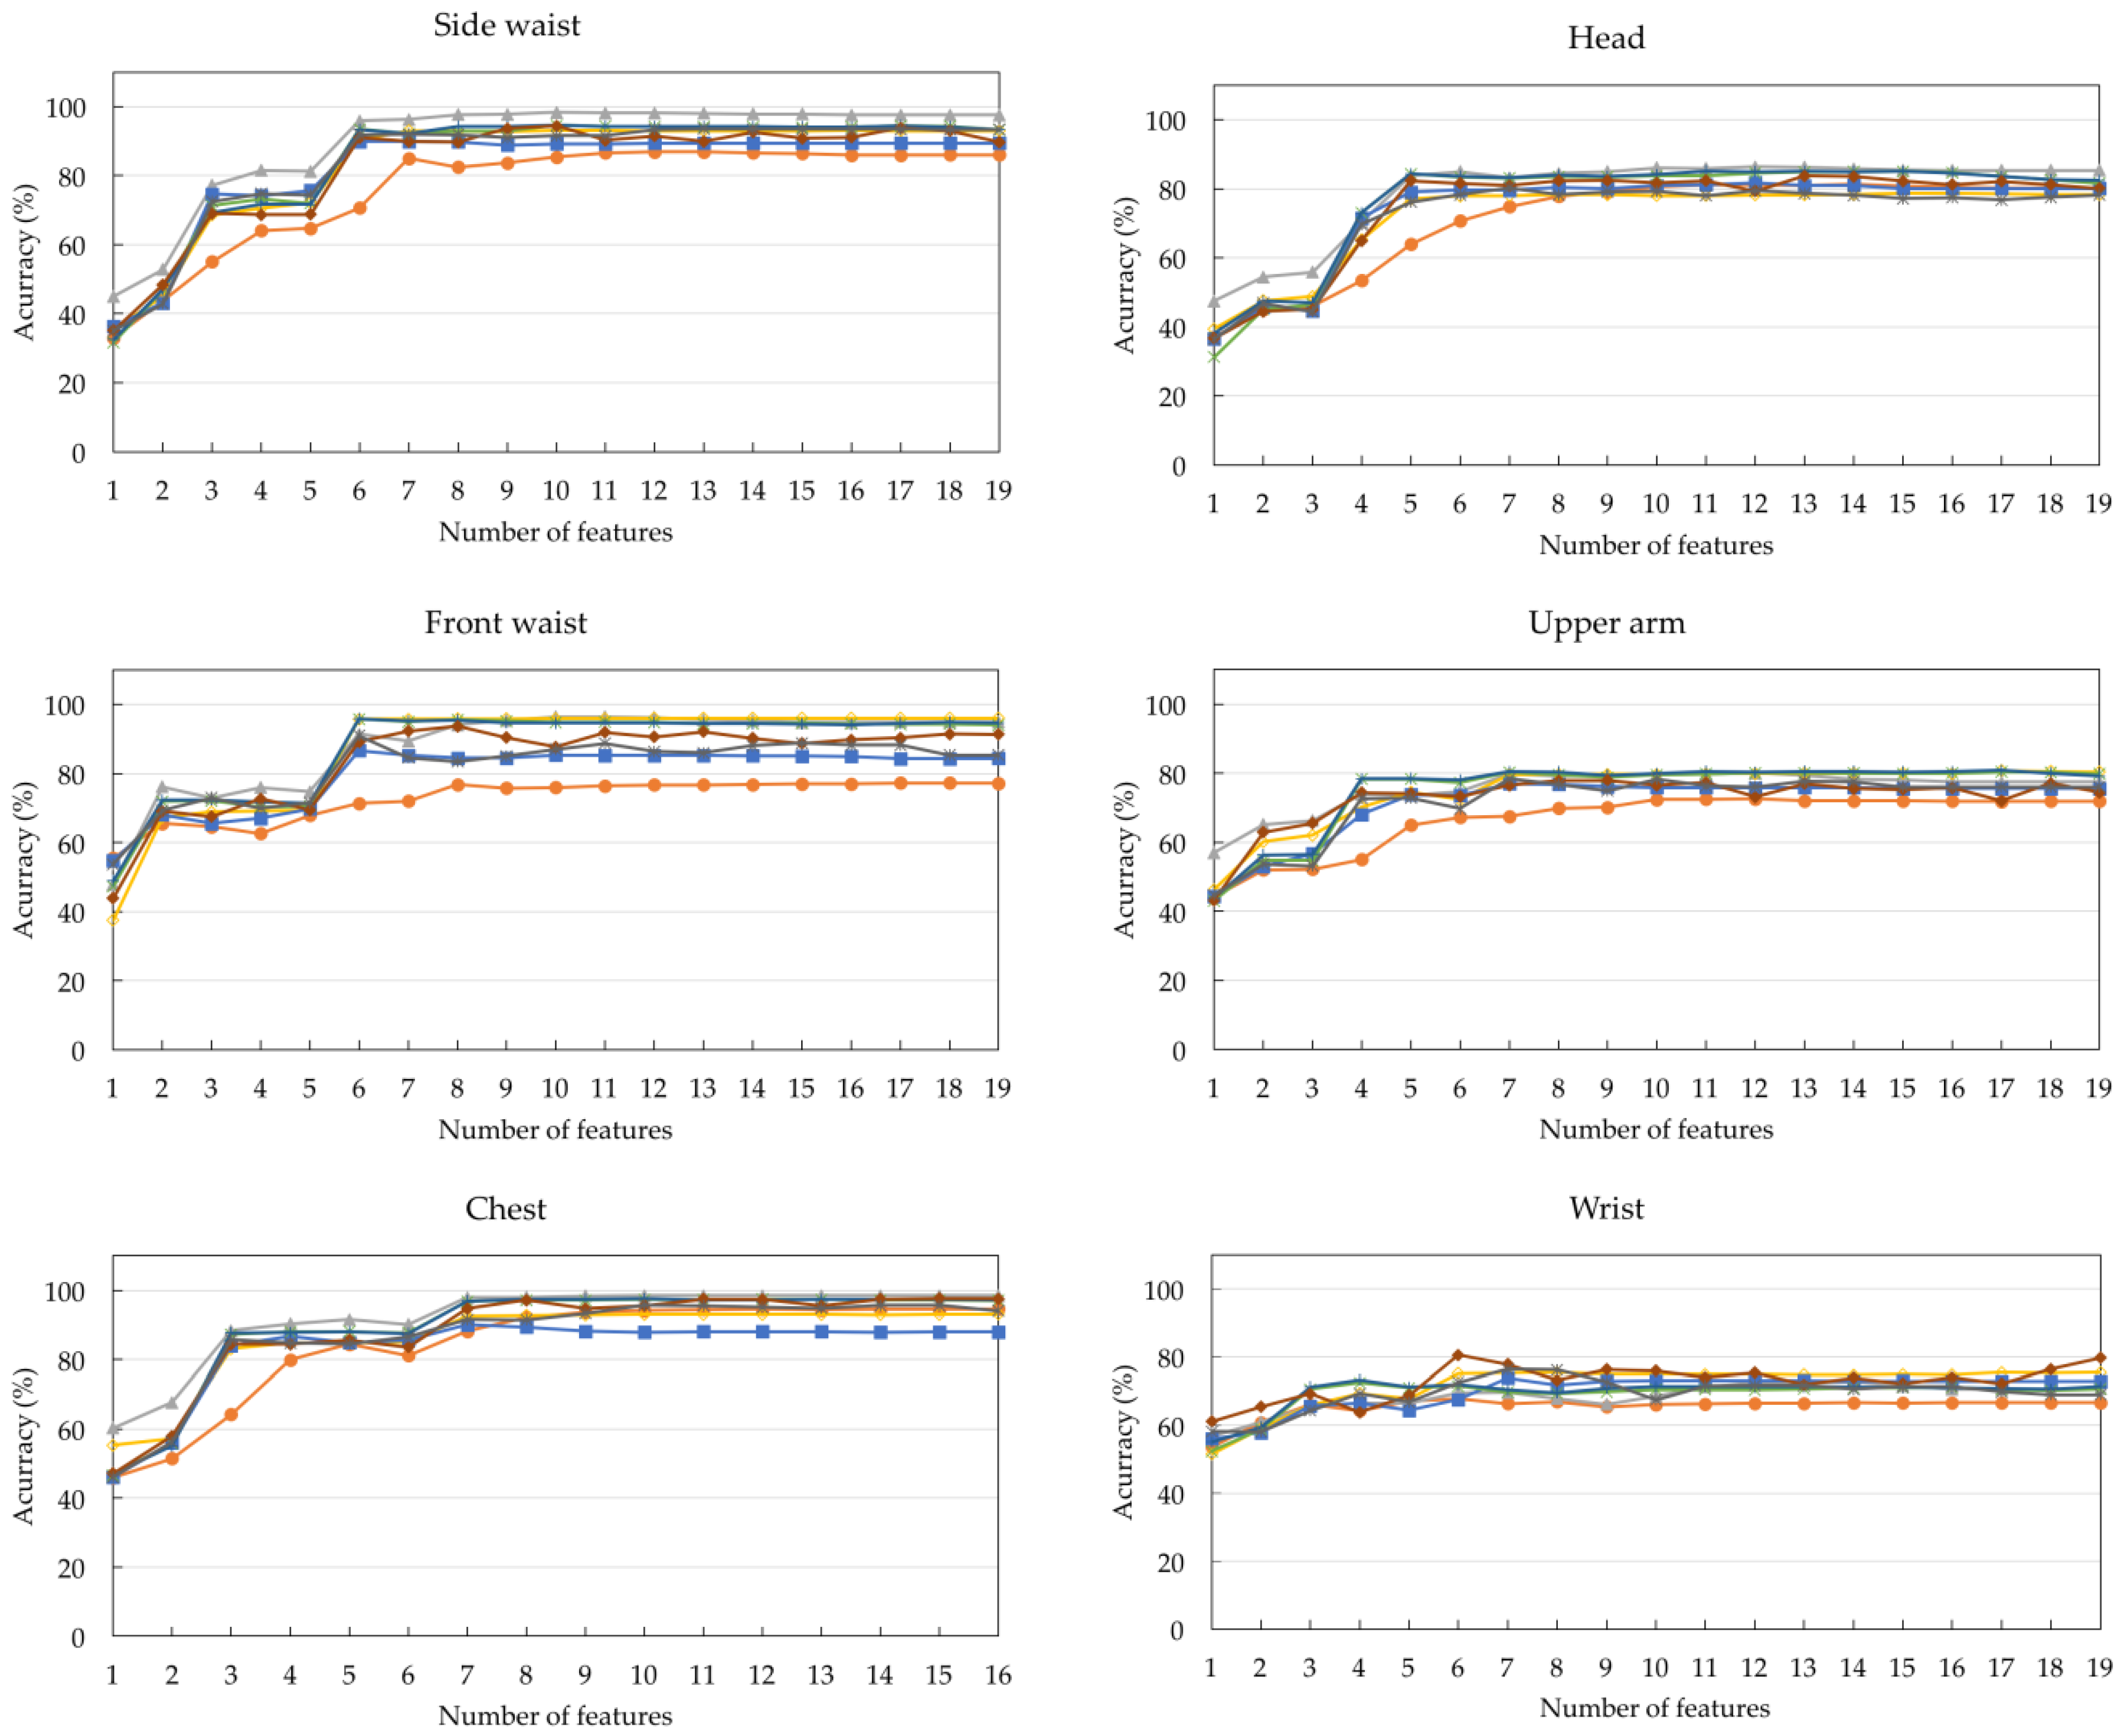
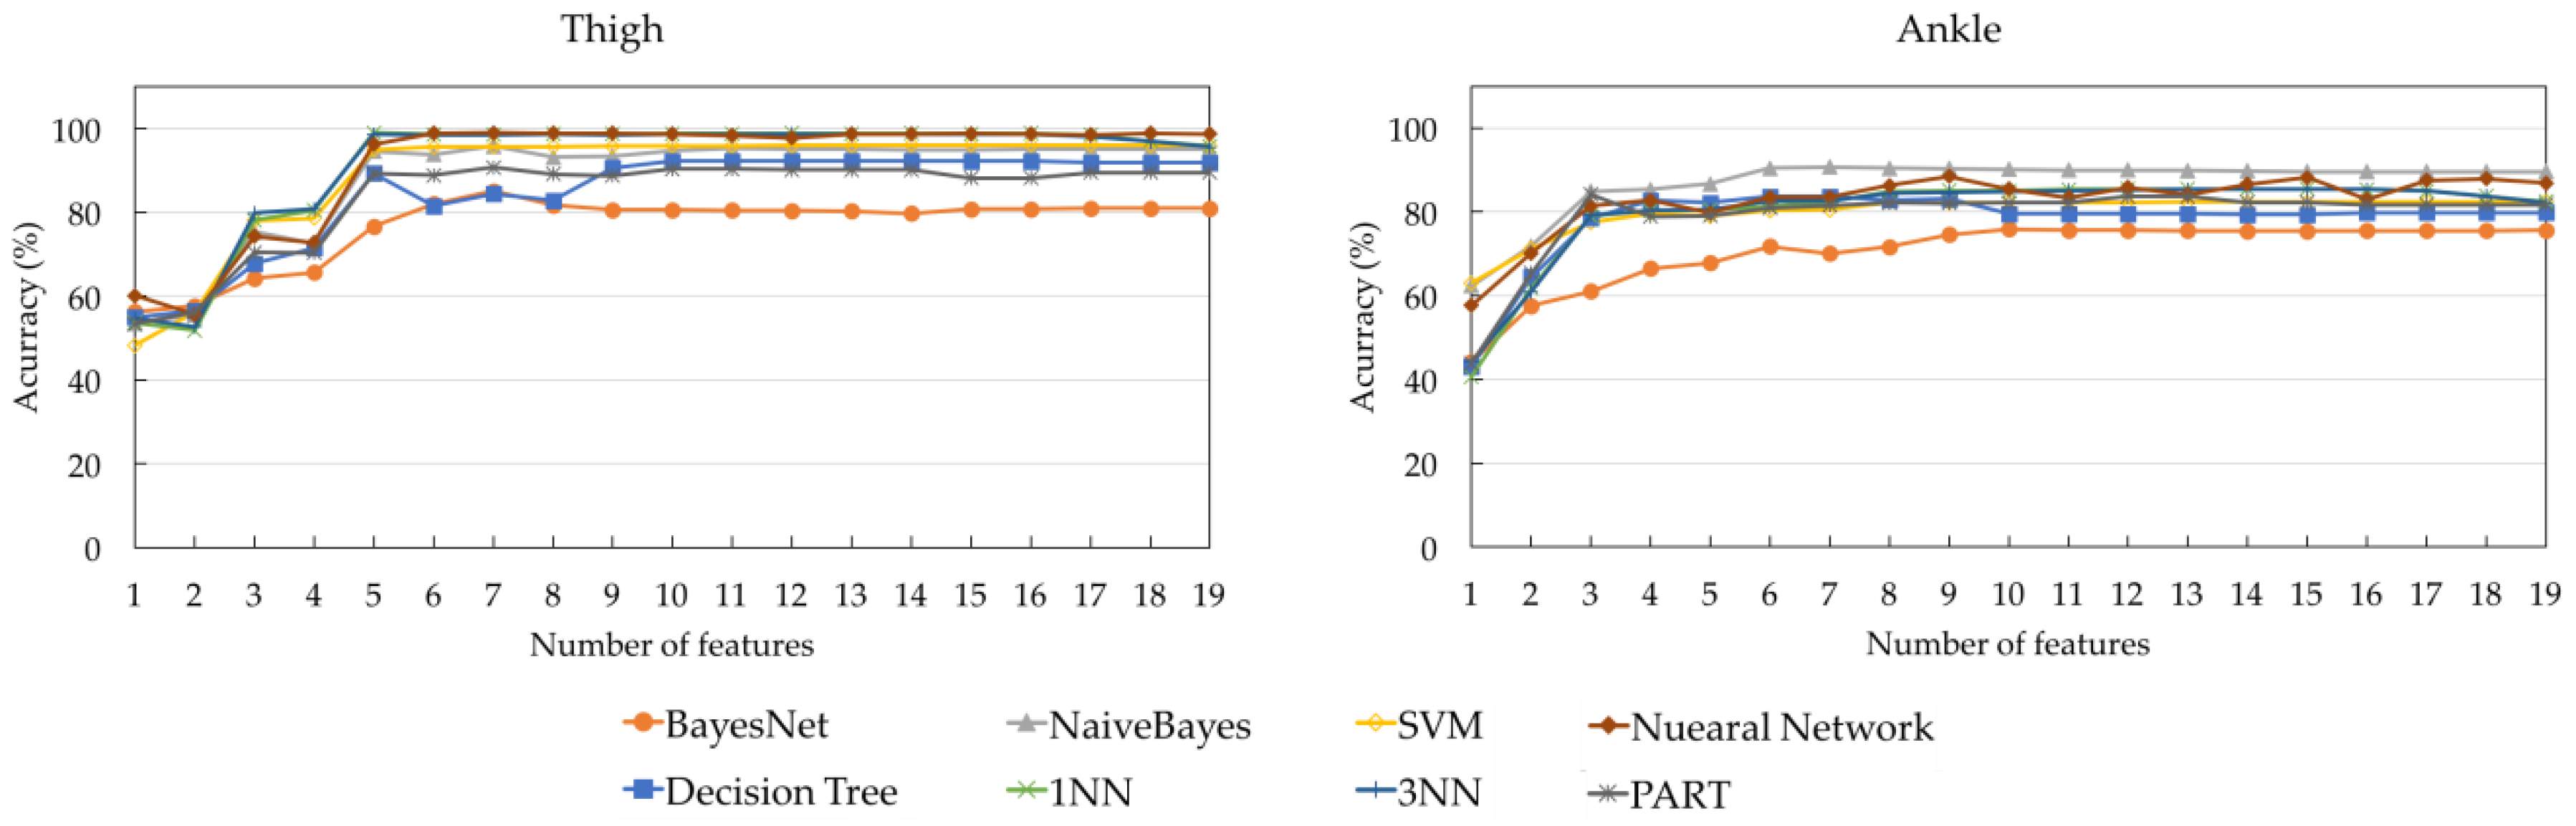
Table 2 shows the ranks of the 19 features obtained by applying the Relief-F feature selection algorithm to DS1. A smaller number indicates a better feature rank. The top two features used for all positions are the mean and the maximum values along the upward axis (F3 and F9). Considering the top four features, the maximum value along the x-axis (F7) and the minimum values along the upward axis (F12) are the next most commonly used features, followed by the mean along the x-axis (F1). The correlation across the three axes (F17, F18, and F19) are the three lowest ranked features for all sensor positions. Since the number of subjects in DS1 is 12, six-fold cross validation was used to evaluate the eight classification algorithms. For each fold, the models were trained based on the data acquired from ten subjects and evaluated on the data acquired from the two remaining unseen subjects. For each integer f such that 1 ≤ f ≤ 19, Figure 6 shows the average accuracy values of the eight classification algorithms across all sensor positions when the top f features for each sensor position were used. With only one feature, the accuracy values are relatively low for all sensor positions. The values can be improved by increasing the number of features. As there is no significant improvement on classification accuracy with further additional features, five to seven features are considered to be appropriate. The accuracy values of different classification algorithms across the eight sensor positions are shown in Figure 7. Table 3 summarizes the model settings with the best classification accuracy across the different sensor positions. The thigh yields the highest accuracy value of 99%, using 1NN with five features. NB is the best model for the side of the waist, front of the waist, chest, head, and ankle, with accuracy values of 98.34%, 96.45%, 98.50%, 86.38%, and 90.70%, respectively. 3NN and NN are the best models for the upper arm and wrist, with accuracy values of 80.83% and 80.60%, respectively.
Table 2.
The feature rankings obtained from Relief-F on Dataset 1 (DS1).
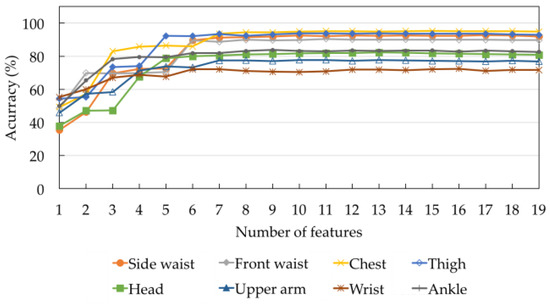
Figure 6.
The average accuracy of the eight classification models across all sensor positions on DS1.
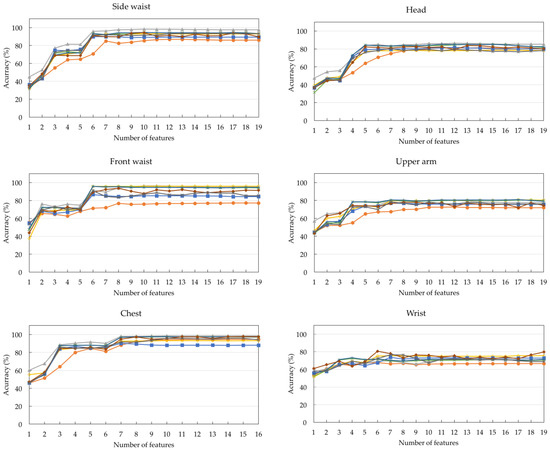
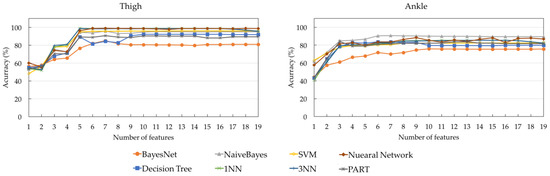
Figure 7.
Accuracy of different classification algorithms across all sensor positions.
Table 3.
Settings with the highest accuracy for different sensor positions.
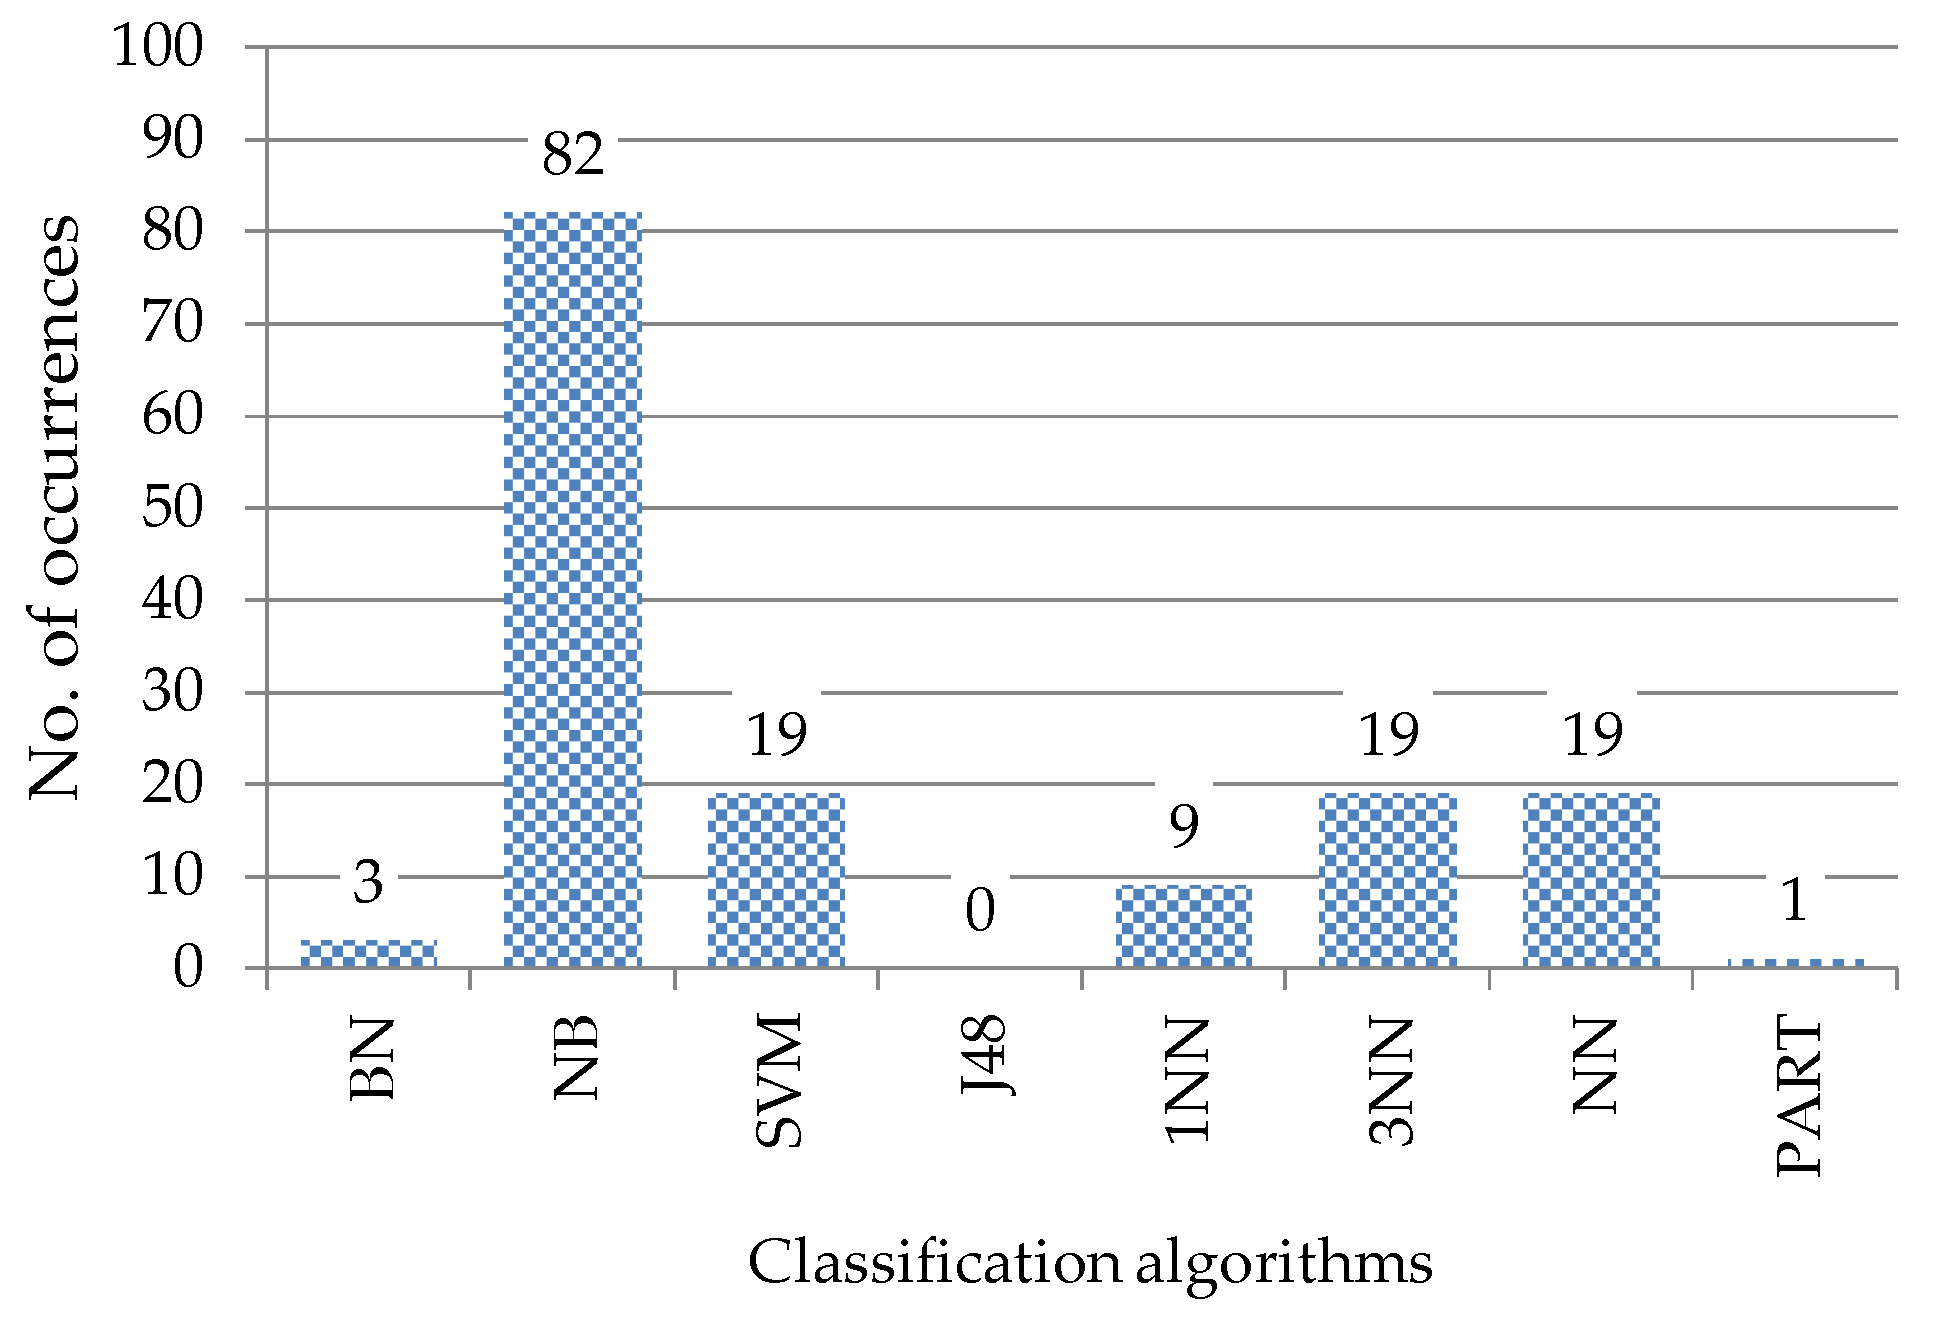
Table 4 shows the best algorithms versus different numbers of features and sensor positions. For all sensor positions except for the thigh, upper arm, and wrist, the best algorithms do not change when more than 12 features are used. It is well known that the best classification algorithm is data-dependent. The algorithm that occurs most often for a sensor position can be regarded as a generally suitable algorithm for that sensor position. From the results, NB is a generally suitable algorithm for the side of the waist, chest, head, and ankle, while 1NN, 3NN, and NN are generally suitable algorithms for the thigh, upper arm, and wrist, respectively. Apart from the front of the waist, the generally suitable algorithms are also the algorithms that yield the best classification accuracy, shown in Table 3. For the front of the waist, although SVM occurs most often as the best algorithm, it occurs only when more than the top six features are used. When a fewer number of features are used, NB is considered a generally suitable algorithm for this position. Figure 8 summarizes the frequency with which different algorithms appear as the best models across all experimental settings. In general, NB is considered the best algorithm for this dataset, followed by SVM, 3NN, and NN.
Table 4.
Best algorithms for different numbers of features and sensor positions.
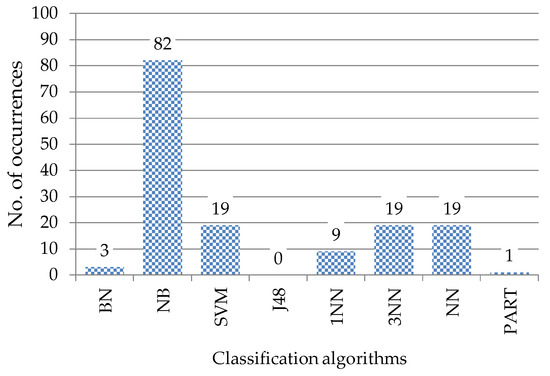
Figure 8.
The number of occurrences of the eight classification algorithms in Table 4.
The class-specific accuracy values for the best models shown in Table 3 are detailed in Table 5. The limbs, i.e., the upper arm and wrist, are not suitable positions since they yield low accuracy for several activities (with the average accuracy being less than 85%). Average accuracy values greater than 96% are obtained from four sensor positions, i.e., the side of the waist, front of the waist, chest, and thigh. Lying postures are most difficult to classify when sensors are placed on the limbs, i.e., the upper arm, wrist, and ankle. When different subjects perform the same lying posture, their limb positions may be different. Sitting is most difficult to classify when a sensor is placed on the head; it is often misclassified as standing when a subject is sitting upright. Although the thigh appears to be the position that yields the highest average accuracy in this experiment, users may sit with different positions of their legs in realistic scenarios. In many other related works [10,21,59,60,61], a common suggestion is to place the sensor at the waist as this location is less affected by peripheral body motions than the upper or lower limbs. In terms of usability, wearing a sensor at the waist is more comfortable compared to the thigh, particularly for elderlies.
Table 5.
The activities of daily living (ADL) classification results obtained from the best models on DS1.
4.2. Validation Using DS2 (Elderly Subjects)
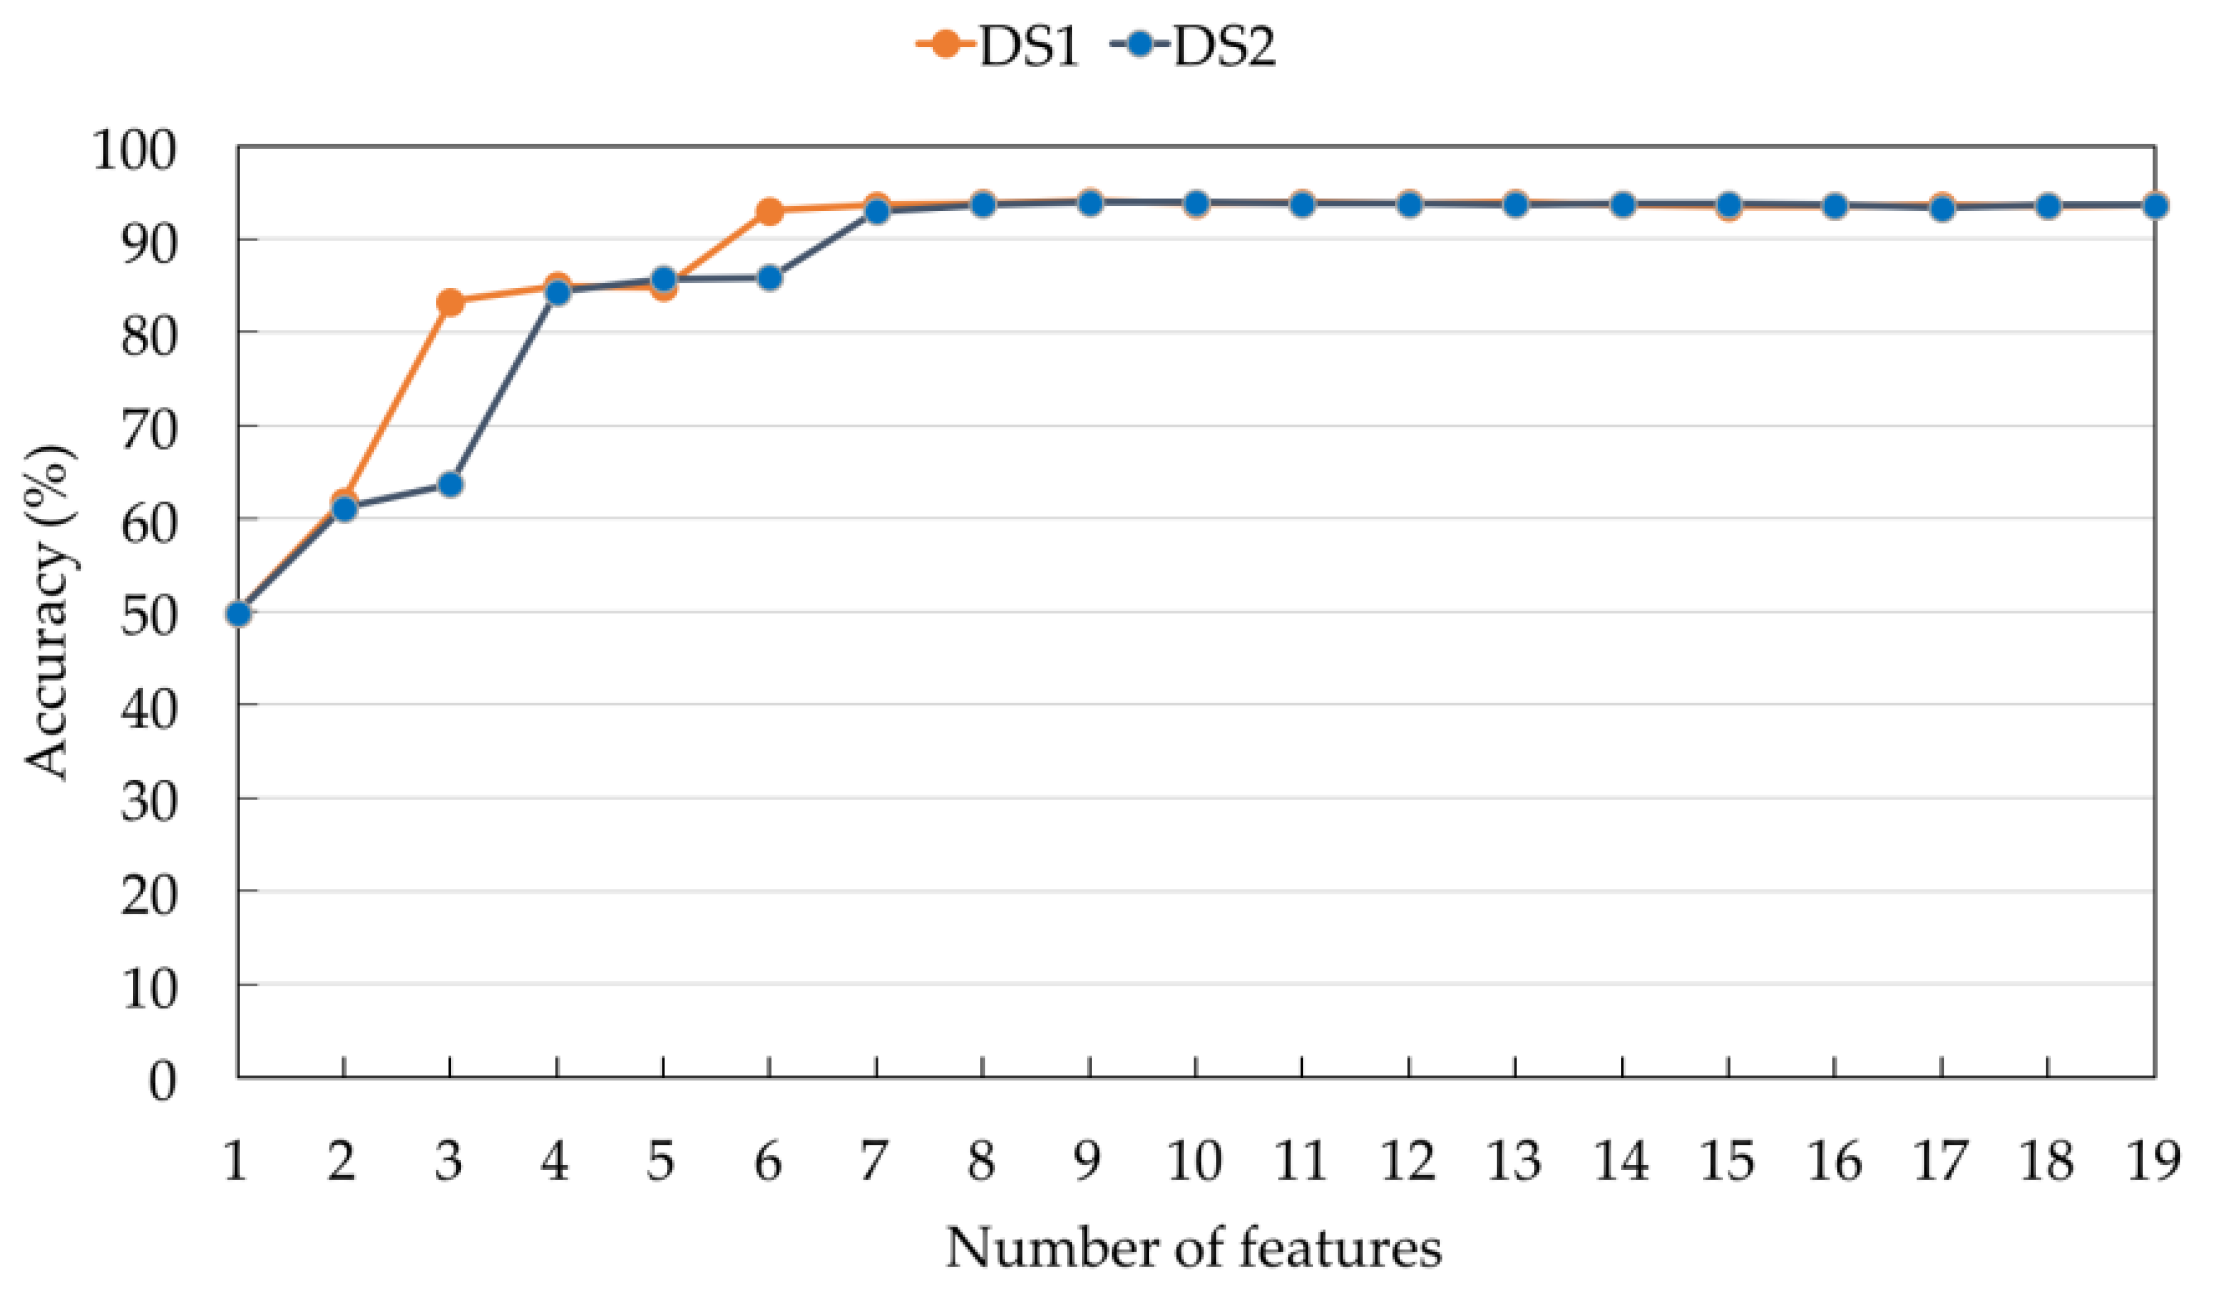
Feature ranking in the dataset DS2 and the possibility of applying a classifier trained from DS1 to DS2 were next investigated. Acceleration signals in DS2 were collected at a sampling rate of 50 Hz using a BSN node placed only on the side of the waist. The signals were down-sampled to approximately 15 Hz. A median filter technique was used to eliminate noise. To ensure that the features extracted from the two devices are comparable, the coordinate system of the BSN node was aligned with that of an e-AR sensor. After the matrix transformation, the Relief-F feature selection algorithm was applied to DS2. Table 6 compares the ranks of the 19 features obtained from DS1 when a sensor was placed on the side of the waist (cf. the first row of Table 2) and those obtained from DS2. At the side of the waist, the most appropriate number of features is ten (cf. Table 3). According to Table 6, all ten highest ranked features for DS1 also appear among the ten highest ranked features for DS2. Six ADL types are common to DS1 and DS2 (cf. Section 2), i.e., sitting, standing, walking, supine, lying on the left side, and lying on the right side. Figure 9 shows the average accuracy values of the eight classification models for these six common ADL types when the top f features were used for each integer f such that 1 ≤ f ≤ 19. Except for the case when the top three and the top six features are used, the average accuracy values on DS1 and DS2 are almost the same. Based on Table 6 and Figure 9, it is expected that the top ten features used in the best model at the side of the waist for DS1 are also appropriate for DS2.
Table 6.
The feature rankings obtained from Relief-F on DS1 and Dataset 2 (DS2) for the side of the waist.
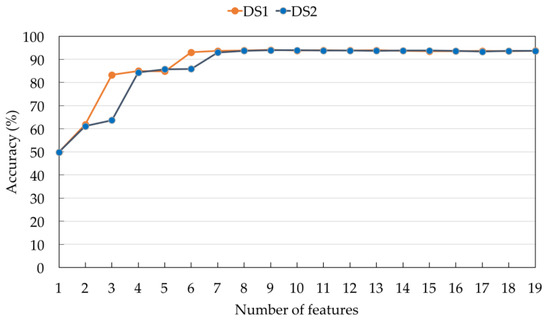
Figure 9.
Comparison of average accuracy using feature ranking obtained from DS1 and DS2.
The best model at the side of the waist for DS1, i.e., NB, is validated on DS2 by using the top ten features derived from DS1 for the side of the waist. Table 7 shows the ADL classification results. The accuracy values of all ADL types are greater than 92%. The average accuracy is 95.77%, which is only slightly lower than the average accuracy obtained on DS1 using the same model and features (98.34%, cf. the first row of Table 3).
Table 7.
The ADL classification results on DS2 using Naïve Bayes (NB) with the top ten features derived from DS1.
4.3. Comparison with a Transfer Learning Method
A transfer learning was defined as the ability to extend what has been learned in one context to new contexts [62]. A summary of several existing works on activity recognition using transfer learning can be found in [63]. A recent work that is closely related to our study is presented in [64], in which three different asynchronous data mapping (ADM) algorithms, i.e., brute force ADM (BFADM), clustering-based ADM (CADM), and motif-based ADM (MADM), were introduced for supporting knowledge transfer in wearable systems. Tri-axial accelerometers (embedded in smartphones) with four different sampling rates, i.e., 50, 100, 150, and 200 Hz, were used for activity recognition. Nine young subjects were asked to perform six types of ADLs, i.e., walking, sitting, standing, walking downstairs, walking upstairs, and biking, while wearing eight smartphones (two phones for each sampling rate) on their waists. Three experiments were conducted, i.e., inter-subject, inter-device, and inter-model. The inter-subject experiment used data collected from eight subjects to train classification models and evaluated them with the remaining subject. The inter-device and inter-model experiments used data collected from one phone to train models, which were then tested using signals from another phone with the same sampling rate and signals from another phone with a different sampling rate, respectively. The classification models were trained and tested based on normalized cross-correlation with the resulting values lying between −1 and 1. Three classification algorithms were used, i.e., kNN, decision tree, and random forest. Among the three mapping algorithms, BFADM yielded the highest accuracy using random forest. It was concluded in [64] that the recognition accuracy of their approach could be affected by sampling frequency variation, device variation, and subject variation. In addition, cross-correlation is a poor measure to capture subject variation. Another limitation of their approach is the ability to handle static activities, especially when device orientations are different (since it relies on signal motifs, which are subsequences that occur repeatedly in time series). In our study, we use signal resampling to handle the difference in sampling frequency, data normalization to handle inter-subject variation, and data transformation to handle the difference in sensor orientations. Table 8 compares the experimental settings and classification accuracy in our study with those in [64].
Table 8.
Comparison between our work and the work presented in [64].
5. Conclusions
This study presents an analysis of the optimal settings for activity classification in terms of sensor positions, features, and classifiers and assesses the possibility of applying a trained model to data acquired from a different experimental scenario. Focusing on monitoring basic activities performed by elderlies, only four lying postures, sitting, standing, and walking, are considered.
In the first experiment, activity classification was performed on a dataset collected from young subjects using e-AR sensors attached to eight different parts of the subjects’ bodies, i.e., the side of the waist, front of the waist, chest, thigh, head, upper arm, wrist, and ankle. Nineteen features were extracted and their importance was measured by using the Relief-F feature selection algorithm. Different combinations of features and eight classification algorithms on different sensor positions were investigated. For each sensor position, the best classification model and the most appropriate features were reported. The mean and the maximum values along the upward axis were the top two common features used for all sensor positions. Among the eight positions, the side of the waist, front of the waist, chest, and thigh were the optimal sensor positions. NB outperforms other classifiers for most feature combinations. The NB algorithm with ten to eleven features was the best model for the side of the waist, front of the waist, and chest, while the 1NN algorithm with five features was the best model for the thigh.
In the second experiment, the dataset was collected from the elderly subjects using a BSN node placed on the side of the waist. To process the signals from different environment settings, signals with high sampling rates were down-sampled and coordinate systems were aligned to the same direction. The experimental results show that the best model derived from the young-subject dataset can still perform with high classification accuracy when applied to the elderly-subject dataset. This demonstrates that data collection effort could be saved when a new hardware platform is developed, i.e., classification models obtained from a previous data collection scenario could be applicable on a new hardware platform, provided that appropriate data preprocessing has been performed.
Acknowledgments
This work was supported by the Thailand Research Fund (TRF), under the Royal Golden Jubilee Ph.D. Program Grant No. PHD/0247/2552, the National Research University Project, funded by the Thailand Office of Higher Education Commission, the Centre of Excellence in Intelligent Informatics, Speech and Language Technology and Service Innovation (CILS), Thammasat University, and the Anandamahidol Foundation.
Author Contributions
N.P. and S.T. conceived and designed the experiments; I.A. wrote software for data collection; N.P. performed the experiments; N.P., S.T. and E.N. analyzed the data; N.P., S.T., E.N. and I.A. wrote the paper.
Conflicts of Interest
The authors declare no conflict of interest.
Abbreviations
The following abbreviations are used in this manuscript:
| BSN | Body sensor network |
| ADL | Activity of daily living |
| BN | Bayesian network |
| NB | Naïve Bayes |
| PART | Partial-tree rule learning |
| kNN | k nearest neighbors |
| NN | Neural network |
| SVM | Support vector machine |
References
- Yang, G.-Z. Body Sensor Networks; Springer: London, UK, 2006. [Google Scholar]
- Bouten, C.; Sauren, A.; Verduin, M.; Janssen, J. Effects of placement and orientation of body-fixed accelerometers on the assessment of energy expenditure during walking. Med. Biol. Eng. Comput. 1997, 35, 50–56. [Google Scholar] [CrossRef] [PubMed]
- Swartz, A.; Strath, S.; Bassett, D.J.; O’Brien, W.; King, G.; Ainsworth, B. Estimation of energy expenditure using csa accelerometers at hip and wrist sites. Med. Sci. Sports Exerc. 2000, 32, S450–S456. [Google Scholar] [CrossRef] [PubMed]
- Crouter, S.E.; Clowers, K.G.; Bassett, D.R. A novel method for using accelerometer data to predict energy expenditure. J. Appl. Physiol. 2006, 100, 1324–1331. [Google Scholar] [CrossRef] [PubMed]
- Mayagoitia, R.E.; Lötters, J.C.; Veltink, P.H.; Hermens, H. Standing balance evaluation using a triaxial accelerometer. Gait Posture 2002, 16, 55–59. [Google Scholar] [CrossRef]
- Moe-Nilssen, R.; Helbostad, J.L. Trunk accelerometry as a measure of balance control during quiet standing. Gait Posture 2002, 16, 60–68. [Google Scholar] [CrossRef]
- Pannurat, N.; Theekakul, P.; Thiemjarus, S.; Nantajeewarawat, E. Toward real-time accurate fall/fall recovery detection system by incorporating activity information. In Proceedings of the IEEE-EMBS International Conference on Biomedical and Health Informatics, Hong Kong, Shenzhen, China, 5–7 January 2012; pp. 196–199. [Google Scholar]
- King, R.C.; Atallah, L.; Wong, C.; Miskelly, F.; Yang, G.Z. Elderly risk assessment of falls with bsn. In Proceedings of the International Conference on Body Sensor Networks, Singapore, 7–9 June 2010; pp. 30–35. [Google Scholar]
- Ravi, N.; Dandekar, N.; Mysore, P.; Littman, M.L. Activity recognition from accelerometer data. In Innovative Applications of Artificial Intelligence; AAAI Press: Pittsburgh, PA, USA, 2005; Volume 3, pp. 1541–1546. [Google Scholar]
- Bao, L.; Intille, S.S. Activity recognition from user-annotated acceleration data. In Proceedings of the Second International Conference on Pervasive Computing, Vienna, Austria, 21–23 April 2004; pp. 1–17. [Google Scholar]
- Fortino, G.; Gravina, R. Rehab-aaservice: A cloud-based motor rehabilitation digital assistant. In Proceedings of the Eighth International Conference on Pervasive Computing Technologies for Healthcare, Oldenburg, Germany, 20–23 May 2014; pp. 305–308. [Google Scholar]
- Covello, R.; Fortino, G.; Gravina, R.; Aguilar, A.; Breslin, J.G. Novel method and real-time system for detecting the cardiac defense response based on the ecg. In Proceedings of the IEEE International Symposium on Medical Measurements and Applications, Gatineau, QC, Canada, 4–5 May 2013; pp. 53–57. [Google Scholar]
- Nuksawn, L.; Nantajeewarawat, E.; Thiemjarus, S. Real-time sensor- and camera-based logging of sleep postures. In Proceedings of the International Computer Science and Engineering Conference, Chiang Mai, Thailand, 23–26 November 2015; pp. 1–6. [Google Scholar]
- Shoaib, M.; Bosch, S.; Incel, O.D.; Scholten, H.; Havinga, P.J.M. Fusion of smartphone motion sensors for physical activity recognition. Sensors 2014, 14, 10146–10176. [Google Scholar] [CrossRef] [PubMed]
- Shoaib, M.; Bosch, S.; Incel, O.D.; Scholten, H.; Havinga, P.J.M. Complex human activity recognition using smartphone and wrist-worn motion sensors. Sensors 2016, 16, 426. [Google Scholar] [CrossRef] [PubMed]
- Godfrey, A.; Bourke, A.K.; Ólaighin, G.M.; van de Ven, P.; Nelson, J. Activity classification using a single chest mounted tri-axial accelerometer. Med. Eng. Phys. 2011, 33, 1127–1135. [Google Scholar] [CrossRef] [PubMed]
- Casson, A.J.; Vazquez Galvez, A.; Jarchi, D. Gyroscope vs. Accelerometer measurements of motion from wrist ppg during physical exercise. ICT Express 2016, 2, 175–179. [Google Scholar] [CrossRef]
- Fortino, G.; Giannantonio, R.; Gravina, R.; Kuryloski, P.; Jafari, R. Enabling effective programming and flexible management of efficient body sensor network applications. IEEE Trans. Hum. Mach. Syst. 2013, 43, 115–133. [Google Scholar] [CrossRef]
- Gjoreski, H.; Lustrek, M.; Gams, M. Accelerometer placement for posture recognition and fall detection. In Proceedings of the Seventh International Conference on Intelligent Environments, Nottingham, UK, 25–28 July 2011; pp. 47–54. [Google Scholar]
- Cleland, I.; Kikhia, B.; Nugent, C.; Boytsov, A.; Hallberg, J.; Synnes, K.; McClean, S.; Finlay, D. Optimal placement of accelerometers for the detection of everyday activities. Sensors 2013, 13, 9183–9200. [Google Scholar] [CrossRef] [PubMed]
- Atallah, L.; Lo, B.; King, R.; Yang, G. Sensor positioning for activity recognition using wearable accelerometers. IEEE Trans. Biomed. Circuits Syst. 2011, 5, 320–329. [Google Scholar] [CrossRef] [PubMed]
- Gravina, R.; Alinia, P.; Ghasemzadeh, H.; Fortino, G. Multi-sensor fusion in body sensor networks: State-of-the-art and research challenges. Inf. Fusion 2017, 35, 68–80. [Google Scholar] [CrossRef]
- Ghasemzadeh, H.; Panuccio, P.; Trovato, S.; Fortino, G.; Jafari, R. Power-aware activity monitoring using distributed wearable sensors. IEEE Trans. Hum. Mach. Syst. 2014, 44, 537–544. [Google Scholar] [CrossRef]
- Thiemjarus, S.; Pansiot, J.; Mcllwraith, D.G.; Lo, B.P.L.; Yang, G.-Z. An integrated inferencing framework for context sensing. In Proceedings of the Fifth International Conference on Information Technology and Applications in Biomedicine, Shenzhen, China, 30–31 May 2008; pp. 270–274. [Google Scholar]
- Thiemjarus, S.; James, A.; Yang, G.-Z. An eye hand data fusion framework for pervasive sensing of surgical activities. Pattern Recognit. 2012, 45, 2855–2867. [Google Scholar] [CrossRef]
- Yeoh, W.S.; Pek, I.; Yong, Y.H.; Chen, X.; Waluyo, A.B. Ambulatory monitoring of human posture and walking speed using wearable accelerometer sensors. In Proceedings of the Thirtieth Annual International Conference of the IEEE Engineering in Medicine and Biology Society, Vancouver, BC, Canada, 20–25 August 2008; pp. 5184–5187. [Google Scholar]
- Mathie, M.J.; Coster, A.C.F.; Lovell, N.H.; Celler, B.G. Detection of daily physical activities using a triaxial accelerometer. Med. Biol. Eng. Comput. 2003, 41, 296–301. [Google Scholar] [CrossRef] [PubMed]
- Baek, J.; Lee, G.; Park, W.; Yun, B.-J. Accelerometer signal processing for user activity detection. In Knowledge-Based Intelligent Information and Engineering Systems; Negoita, M., Howlett, R., Jain, L., Eds.; Springer: Berlin/Heidelberg, Germany, 2004; Volume 3215, pp. 610–617. [Google Scholar]
- Meijer, G.A.L.; Westerterp, K.R.; Verhoeven, F.M.H.; Koper, H.B.M.; Hoor, F.T. Methods to assess physical activity with special reference to motion sensors and accelerometers. IEEE Trans. Biomed. Eng. 1991, 38, 221–229. [Google Scholar] [CrossRef] [PubMed]
- Maurer, U.; Smailagic, A.; Siewiorek, D.P.; Deisher, M. Activity recognition and monitoring using multiple sensors on different body positions. In Proceedings of the International Workshop on Wearable and Implantable Body Sensor Networks, Cambridge, MA, USA, 3–5 April 2006; pp. 113–116. [Google Scholar]
- Tamura, T.; Fujimoto, T.; Muramoto, H.; Huang, J.; Sakaki, H.; Togawa, T. The design of an ambulatory physical activity monitor and it application to the daily activity of the elderly. In Proceedings of the Seventeenth IEEE Annual Conference on Engineering in Medicine and Biology Society, Montreal, QC, Canada, 20–23 September 1995; pp. 1591–1592. [Google Scholar]
- Mehmood, A.; Raza, A.; Nadeem, A.; Saeed, U. Study of multi-classification of advanced daily life activities on shimmer sensor dataset. Int. J. Commun. Networks Inf. Secur. 2016, 8, 86–92. [Google Scholar]
- Gupta, P.; Dallas, T. Feature selection and activity recognition system using a single triaxial accelerometer. IEEE Trans. Biomed. Eng. 2014, 61, 1780–1786. [Google Scholar] [CrossRef] [PubMed]
- Leutheuser, H.; Schuldhaus, D.; Eskofier, B.M. Hierarchical, multi-sensor based classification of daily life activities: Comparison with state-of-the-art algorithms using a benchmark dataset. PLoS ONE 2013, 8, e75196. [Google Scholar]
- Lyons, G.M.; Culhane, K.M.; Hiltob, D.; Grace, P.A.; Lyons, D. A description of an accelerometer-based mobility monitoring technique. Med. Eng. Phys. 2005, 27, 497–504. [Google Scholar] [CrossRef] [PubMed]
- Lara, Ó.D.; Pérez, A.J.; Labrador, M.A.; Posada, J.D. Centinela: A human activity recognition system based on acceleration and vital sign data. Pervasive Mob. Comput. 2012, 8, 717–729. [Google Scholar] [CrossRef]
- McGlynn, D.; Madden, M.G. An ensemble dynamic time warping classifier with application to activity recognition. In Research and Development in Intelligent Systems XXVII; Bramer, M., Petridis, M., Hopgood, A., Eds.; Springer: London, UK, 2011; pp. 339–352. [Google Scholar]
- Khan, A.M.; Lee, Y.K.; Lee, S.Y.; Kim, T.S. A triaxial accelerometer-based physical-activity recognition via augmented-signal features and a hierarchical recognizer. IEEE Trans. Inf. Technol. Biomed. 2010, 14, 1166–1172. [Google Scholar] [CrossRef] [PubMed]
- Ermes, M.; Parkka, J.; Cluitmans, L. Advancing from offline to online activity recognition with wearable sensors. In Proceedings of the Thirtieth Annual International Conference of the IEEE Engineering in Medicine and Biology Society, Vancouver, BC, Canada, 20–25 August 2008; pp. 4451–4454. [Google Scholar]
- Parkka, J.; Ermes, M.; Korpipaa, P.; Mantyjarvi, J.; Peltola, J.; Korhonen, I. Activity classification using realistic data from wearable sensors. IEEE Trans. Inf. Technol. Biomed. 2006, 10, 119–128. [Google Scholar] [CrossRef] [PubMed]
- Ahmadi, A.; Mitchell, E.; Richter, C.; Destelle, F.; Gowing, M.; Moran, K. Toward automatic activity classification and movement assessment during a sports training session. IEEE Inter. Things J. 2015, 2, 23–32. [Google Scholar] [CrossRef]
- Min, J.K.; Cho, S.B. Activity recognition based on wearable sensors using selection/fusion hybrid ensemble. In Proceedings of the IEEE International Conference on Systems, Man and Cybernetics, Anchorage, AK, USA, 9–12 October 2011; pp. 1319–1324. [Google Scholar]
- Menz, H.B.; Lord, S.R.; Fitzpatrick, C. Age-related differences in walking stability. Age Ageing 2003, 32, 137–142. [Google Scholar] [CrossRef] [PubMed]
- Gaglione, A.; Chen, S.; Lo, B.; Yang, G.Z. A low-power opportunistic communication protocol for wearable applications. In Proceedings of the Twelfth International Conference on Wearable and Implantable Body Sensor Networks, Cambridge, MA, USA, 9–12 June 2015; pp. 1–6. [Google Scholar]
- Bsn Development kit v.3. Available online: http://vip.doc.ic.ac.uk/bsn/a1892.html (accessed on 10 March 2017).
- Yang, G.-Z. Body Sensor Networks, 2nd ed.; Springer: London, UK, 2014. [Google Scholar]
- Kononenko, I. Estimating attributes: Analysis and extensions of relief. In Proceedings of the European Conference on Machine Learning on Machine Learning, Catania, Italy, 6–8 April 1994; pp. 171–182. [Google Scholar]
- Kira, K.; Rendell, L.A. A practical approach to feature selection. In Proceedings of the Ninth International Workshop on Machine Learning; Morgan Kaufmann Publishers Inc.: Burlington, MA, USA, 1992; pp. 249–256. [Google Scholar]
- Howcroft, J. Evaluation of Wearable Sensors as an Older Adult Fall Risk Assessment Tool; UWSpace: Waterloo, ON, Canada, 2016. [Google Scholar]
- Zhang, M.; Sawchuk, A.A. A feature selection-based framework for human activity recognition using wearable multimodal sensors. In Proceedings of the Sixth International Conference on Body Area Networks; ICST: Beijing, China, 2011; pp. 92–98. [Google Scholar]
- Liu, H.; Motoda, H. Computational Methods of Feature Selection; CRC Press: Boca Raton, FL, USA, 2007. [Google Scholar]
- Cooper, G.F.; Herskovits, E. A bayesian method for the induction of probabilistic networks from data. Mach. Learn. 1992, 9, 309–347. [Google Scholar] [CrossRef]
- George, H.J.; Langley, P. Estimating continuous distributions in bayesian classifiers. In Proceedings of the Eleventh Conference on Uncertainty in Artificial Intelligence, Montreal, QC, Canada, 18–20 August 1995; pp. 338–345. [Google Scholar]
- Quinlan, R. C4.5: Programs for Machine Learning; Morgan Kaufmann Publishers: San Mateo, CA, USA, 1993. [Google Scholar]
- Frank, E.; Witten, I.H. Generating accurate rule sets without global optimization. In Proceedings of the Fifteenth International Conference on Machine Learning; Morgan Kaufmann Publishers Inc.: Burlington, MA, USA, 1998; pp. 144–151. [Google Scholar]
- Aha, D.; Kibler, D. Instance-based learning algorithms. Mach. Learn. 1991, 6, 37–66. [Google Scholar] [CrossRef]
- Haykin, S. Neural Networks: A Comprehensive Foundation; Prentice Hall PTR: Upper Saddle River, NJ, USA, 1998. [Google Scholar]
- Platt, J. Fast training of support vector machines using sequential minimal optimization. In Advances in Kernel Methods—Support Vector Learning; Schoelkopf, B., Burges, C., Smola, A., Eds.; MIT Press: Cambridge, MA, USA, 1999. [Google Scholar]
- Kangas, M.; Konttila, A.; Winblad, I.; Jamsa, T. Determination of simple thresholds for accelerometry-based parameters for fall detection. In Proceedings of the Twenty-Ninth Annual International Conference of the IEEE Engineering in Medicine and Biology Society, Lyon, France, 22–26 August 2007; pp. 1367–1370. [Google Scholar]
- Kumahara, H.; Tanaka, H.; Schutz, Y. Daily physical activity assessment: What is the importance of upper limb movements vs. whole body movements? Int. J. Obes. 2004, 28, 1105–1110. [Google Scholar] [CrossRef] [PubMed]
- Bianchi, F.; Redmond, S.J.; Narayanan, M.R.; Cerutti, S.; Lovell, N.H. Barometric pressure and triaxial accelerometry-based falls event detection. IEEE T. Neur. Sys. Reh. Eng. 2010, 18, 619–627. [Google Scholar] [CrossRef] [PubMed]
- Byrnes, J.P. Cognitive Development and Learning in Instructional Contexts; Allyn and Bacon: Boston, MA, USA, 1996. [Google Scholar]
- Cook, D.; Feuz, K.D.; Krishnan, N.C. Transfer learning for activity recognition: A survey. Knowl. Inf. Syst. 2013, 36, 537–556. [Google Scholar] [CrossRef] [PubMed]
- Saeedi, R.; Ghasemzadeh, H.; Gebremedhin, A.H. Transfer learning algorithms for autonomous reconfiguration of wearable systems. In Proceedings of the IEEE International Conference on Big Data, Washington, DC, USA, 5–8 December 2016; pp. 563–569. [Google Scholar]

© 2017 by the authors. Licensee MDPI, Basel, Switzerland. This article is an open access article distributed under the terms and conditions of the Creative Commons Attribution (CC BY) license (http://creativecommons.org/licenses/by/4.0/).