Screen-Printed Voltammetric Biosensors for the Determination of Copper in Wine


Abstract
:1. Introduction
2. Materials and Methods
2.1. Reagents
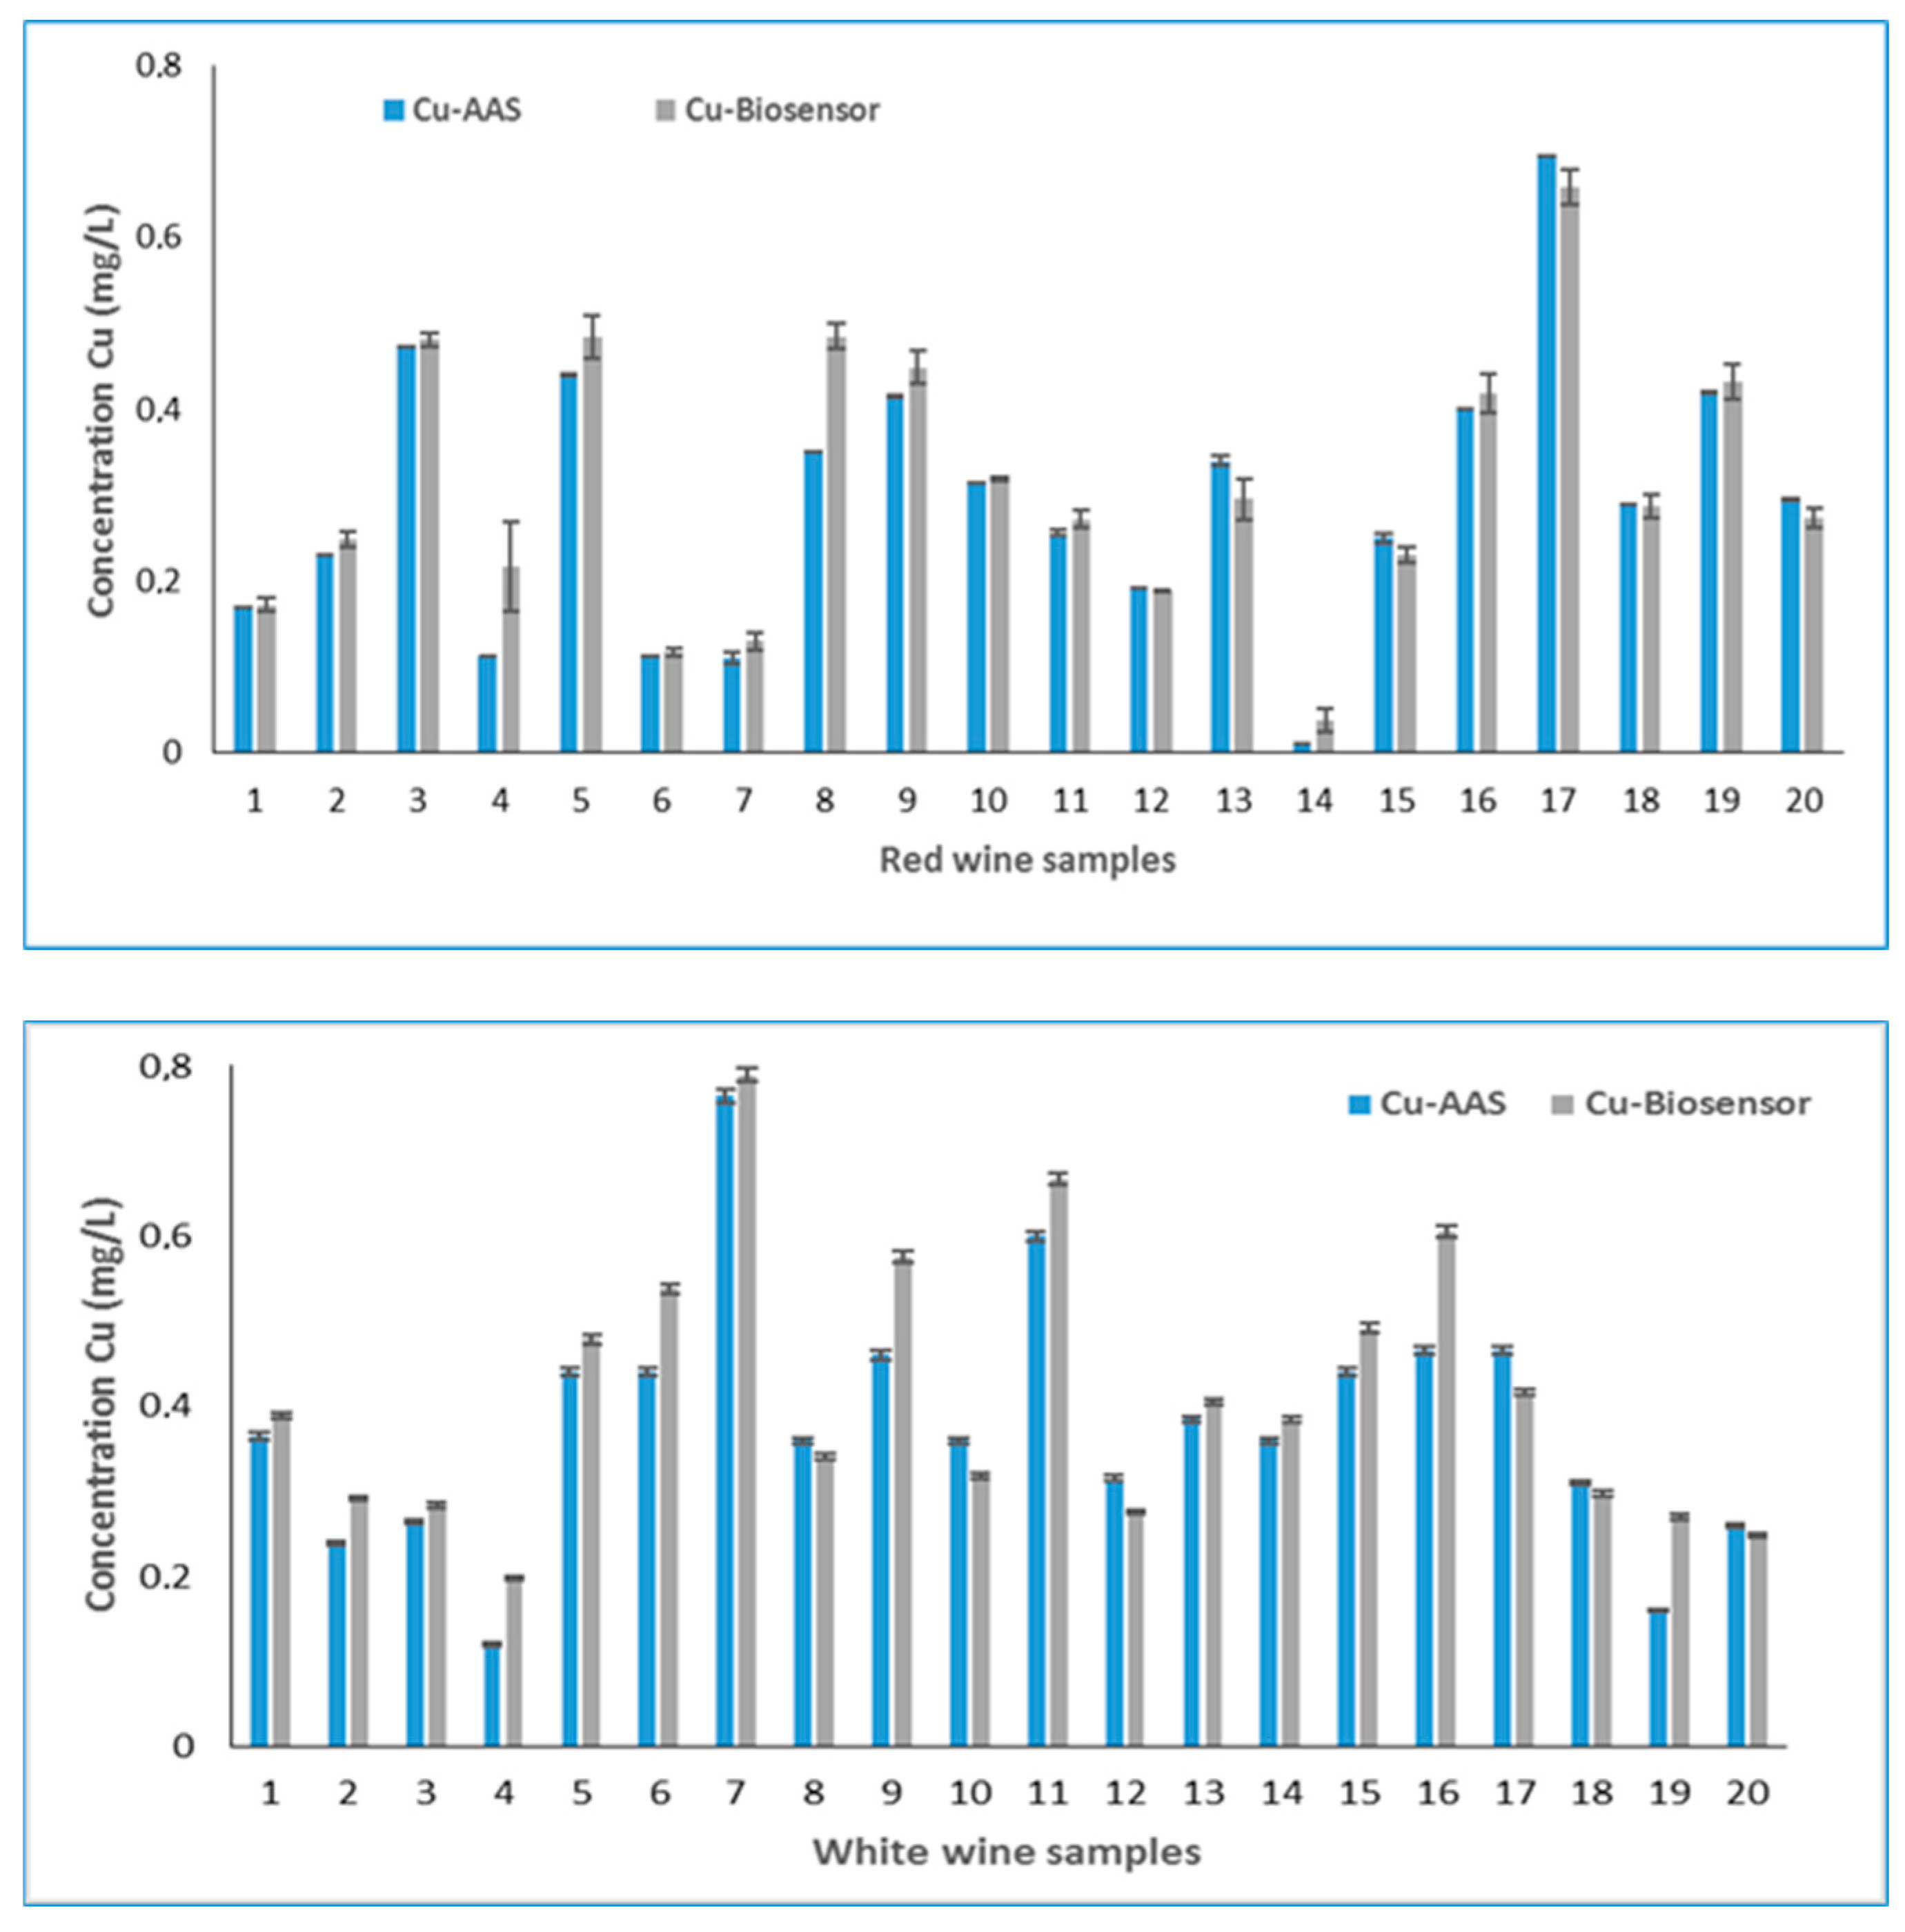
2.2. Samples
2.3. Electrochemical Measurements
2.4. Atomic Adsorption Spectrometry
2.5. Scanning Electron Microscopic Analysis
2.6. Immobilization of Biological Element on SPE and Development of Biosensor
2.7. Statistical Analysis
3. Results
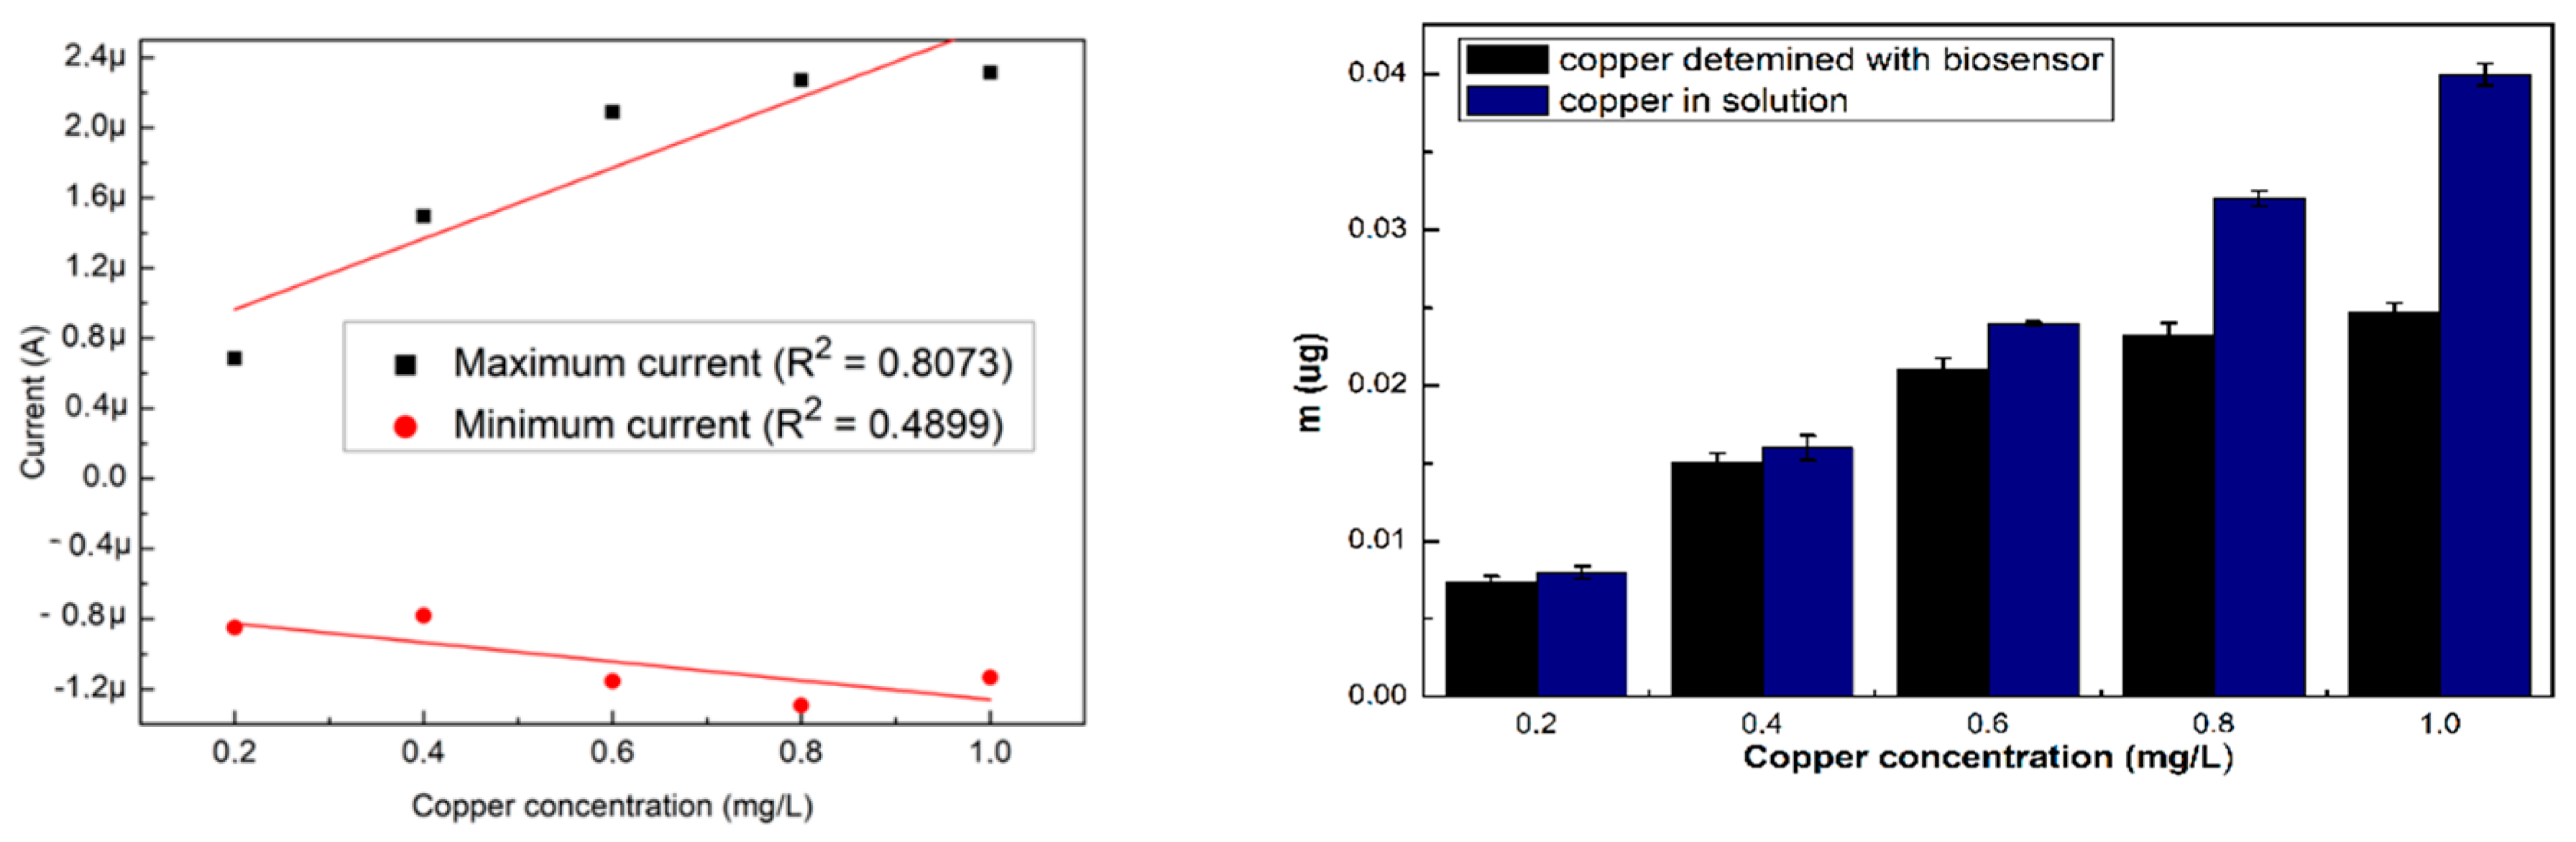
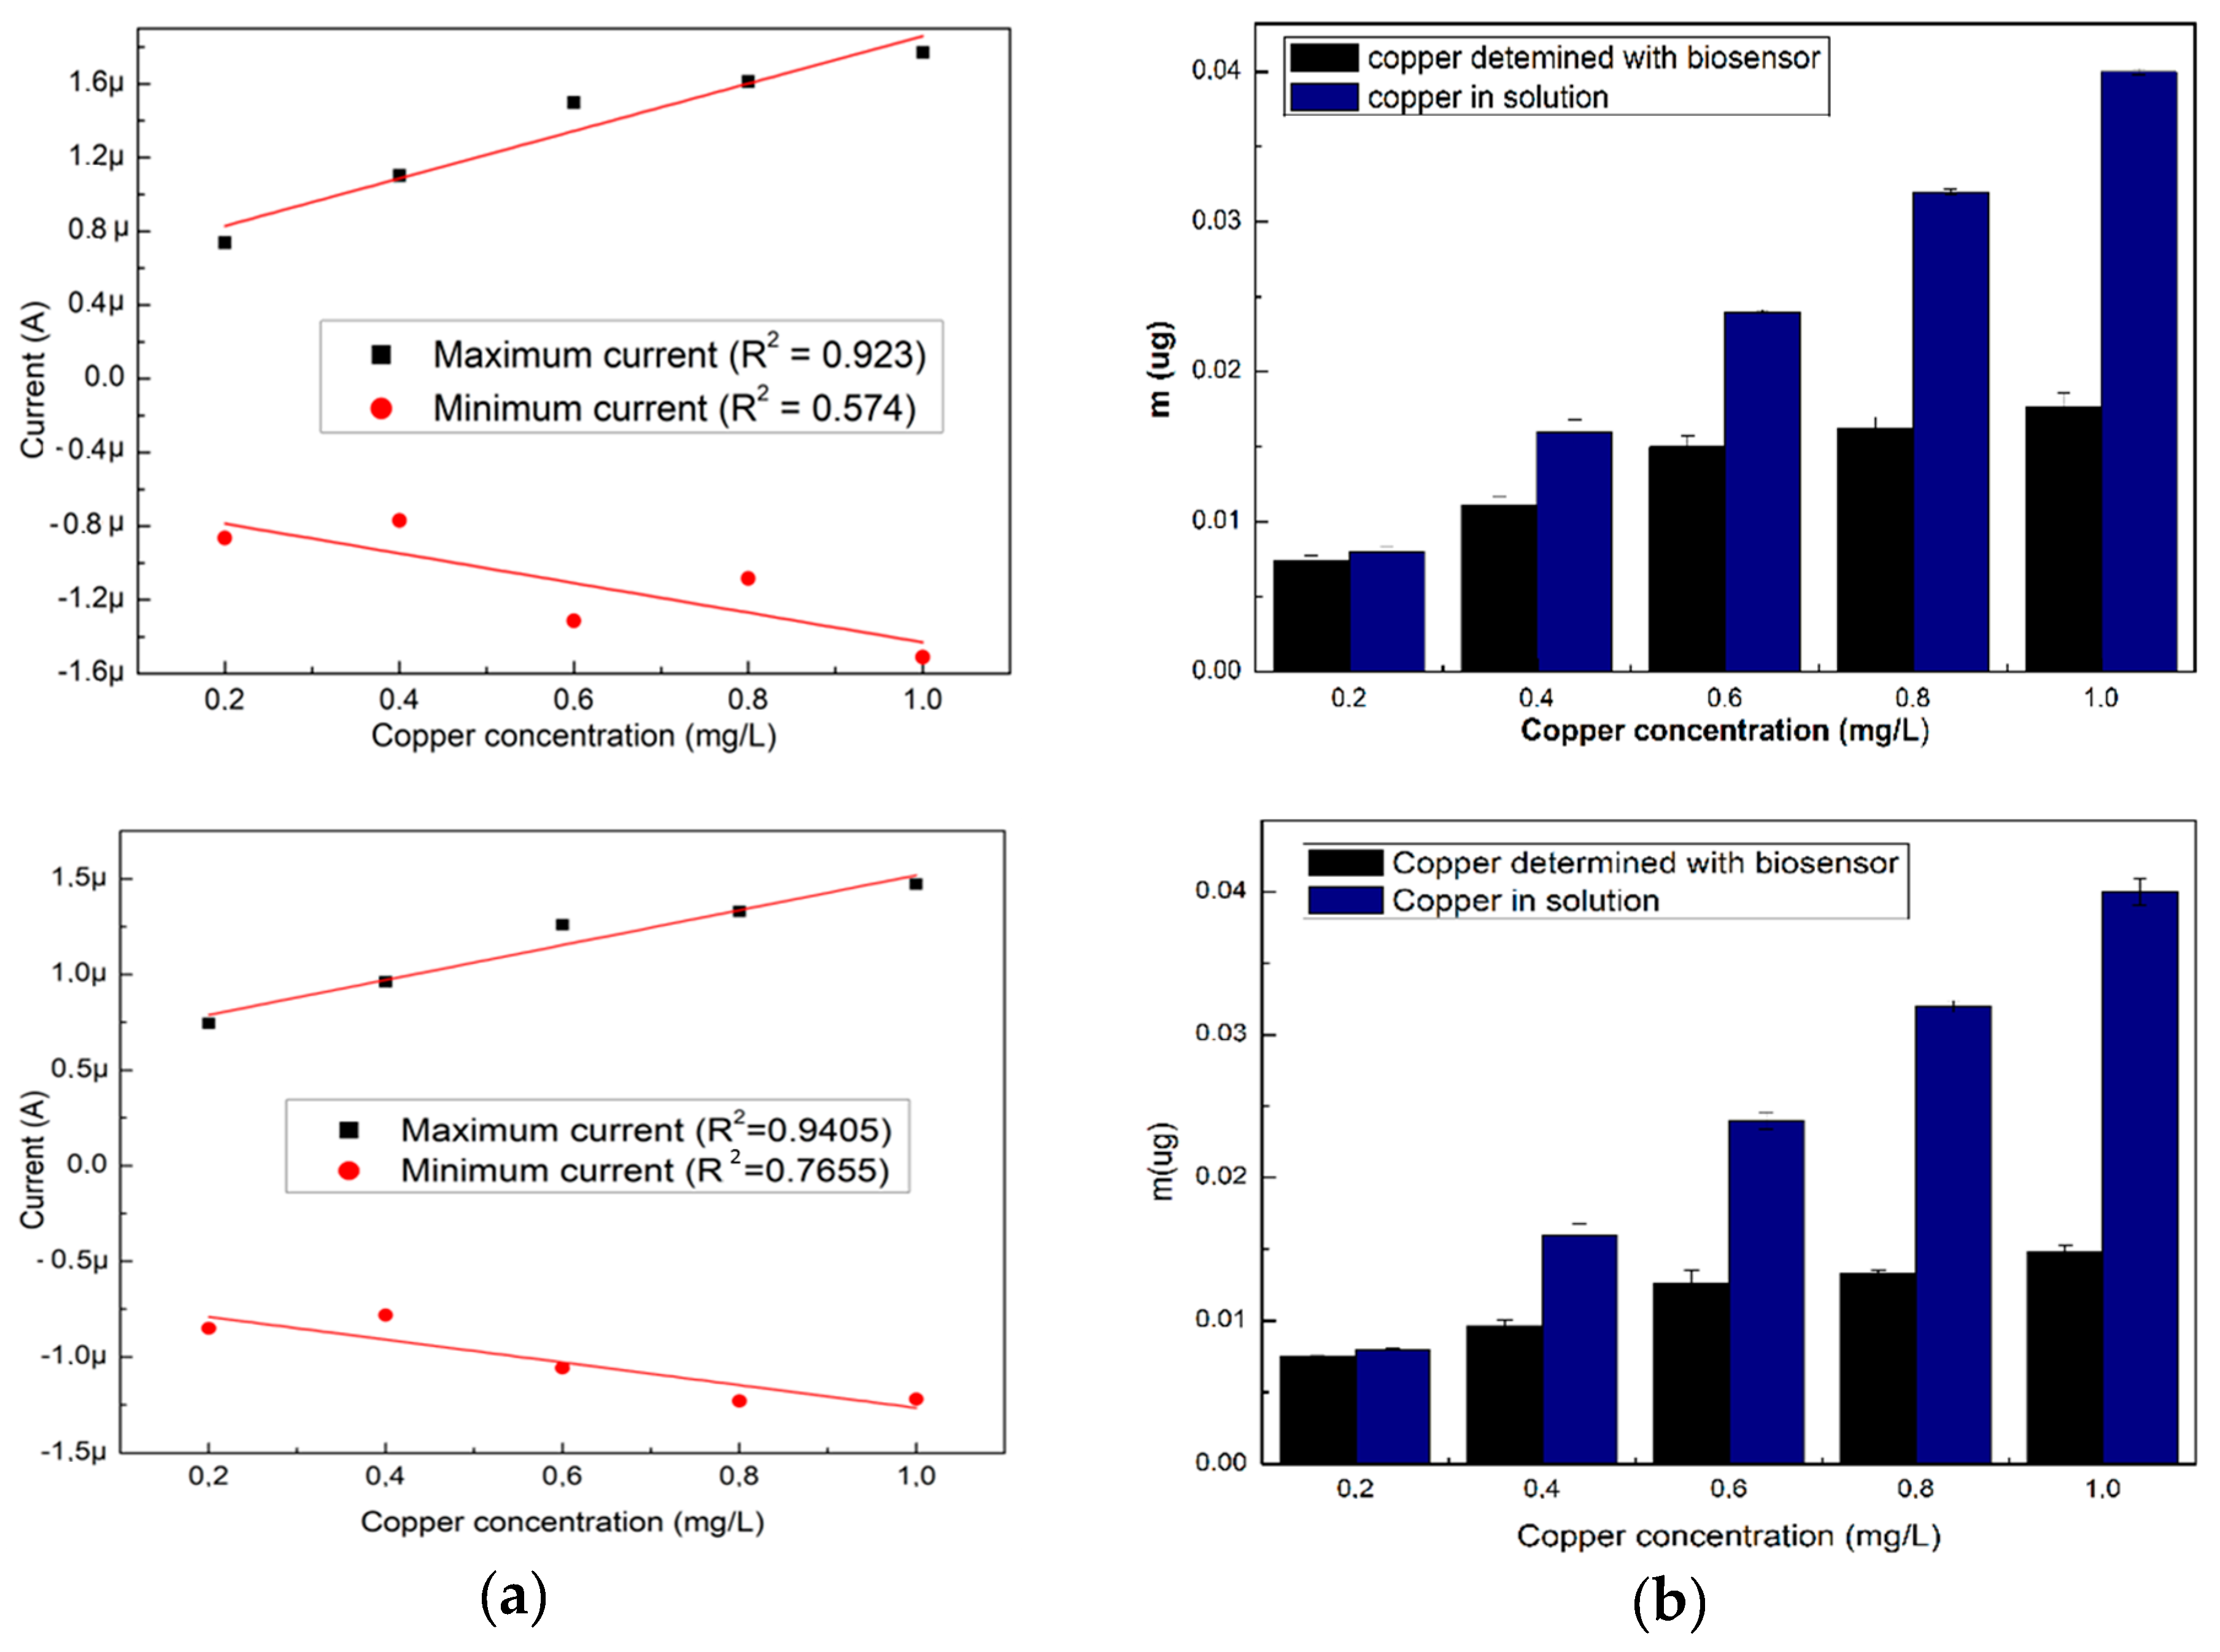
Analytical Performance of the Biosensor
4. Discussion
5. Conclusions
Author Contributions
Funding
Conflicts of Interest
References
- Kailas, H.K. Analysis of iron and copper from wine samples. WJPPS 2015, 4, 2229–2233. [Google Scholar]
- Rousseva, M.; Kontoudakis, N.; Schmidtke, L.M.; Scollary, G.R.; Clark, A.C. Impact of wine production on the fractionation of copper and iron in Chardonnay wine: Implications for oxygen consumption. Food Chem. 2016, 203, 440–447. [Google Scholar] [CrossRef] [PubMed]
- Da Costa Silva, L.M.; Dos Santos, V.P.S.; Salgado, A.M.; Pereira, K.S. Biosensors for contaminants monitoring in food and environment for human and environmental health. In State of the Art in Biosensors-Environmental and Medical Applications; InTech: London, UK, 2013. [Google Scholar]
- Vopálenská, I.; Váchová, L.; Palková, Z. New biosensor for detection of copper ions in water based on immobilized genetically modified yeast cells. Biosens. Bioelectron. 2015, 72, 160–167. [Google Scholar] [CrossRef] [PubMed]
- Wang, R.; Wang, W.; Ren, H.; Chae, J. Detection of copper ions in drinking water using the competitive adsorption of proteins. Biosens. Bioelectron. 2014, 57, 179–185. [Google Scholar] [CrossRef] [PubMed]
- Feier, B.; Băjan, I.; Fizeșan, I.; Floner, D.; Cristea, C.; Geneste, F.; Săndulescu, R. Highly Selective Electrochemical Detection of Copper(II) Using N, N′-bis (acetylacetone) ethylenediimine as a Receptor. Int. J. Electrochem. Sci. 2015, 10, 121–139. [Google Scholar]
- Masullo, T.; Puccio, R.; Di Pierro, M.; Tagliavia, M.; Censi, P.; Vetri, V.; Colombo, P. Development of a biosensor for copper detection in aqueous solutions using an anemonia sulcata recombinant GFP. Appl. Biochem. Biotechnol. 2014, 172, 2175–2187. [Google Scholar] [CrossRef] [PubMed]
- See, W.P.; Nathan, S.; Lee, Y.H. A disposable copper(II) ion biosensor based on self-assembly of L-cysteine on gold nanoparticle-modified screen-printed carbon electrode. J. Sens. 2011, 2011, 230535. [Google Scholar]
- Da Costa, A.S.; Delgadillo, I.; Rudnitskaya, A. Detection of copper, lead, cadmium and iron in wine using electronic tongue sensor system. Talanta 2014, 129, 63–71. [Google Scholar] [CrossRef]
- Pinto, E.M.; Soares, D.M.; Brett, C.M. Interaction of BSA protein with copper evaluated by electrochemical impedance spectroscopy and quartz crystal microbalance. Electrochim. Acta 2008, 53, 7460–7466. [Google Scholar] [CrossRef] [Green Version]
- Topală, T.; Bodoki, A.; Oprean, L.; Oprean, R. Bovine serum albumin interactions with metal complexes. Clujul Med. 2014, 87, 215–219. [Google Scholar] [CrossRef] [Green Version]
- Asaturian, R.A. Cu (II)-BSA complexes and their identification by the ESR method. Gen. Physiol. Biophys. 1986, 5, 105–108. [Google Scholar] [PubMed]
- Anicai, L.; Stoica, C.; Vladut, C.; Negru, A.; Teulon, J.M.; Odorico, M.; Enachescu, M. Synthesis and Characterization of a Novel Screen-Printed Modified Gold Electrode with Applications in Uranyl Ions Detection. Rev. Chim. 2015, 66, 1639–1644. [Google Scholar]
- Liu, J. Investigation of cu (II) binding to bovine serum Albumin by potentiometry with an iron selective electrode: A biophysical chemistry experiment for the undergraduate curriculum. J. Chem. Educ. 2004, 81, 395. [Google Scholar] [CrossRef]
- Pagán, M.; Suazo, D.; Del Toro, N.; Griebenow, K. A comparative study of different protein immobilization methods for the construction of an efficient nano-structured lactate oxidase-SWCNT-biosensor. Biosens. Bioelectron. 2015, 64, 138–146. [Google Scholar] [CrossRef] [PubMed]
- Ley, C.; Holtmann, D.; Mangold, K.M.; Schrader, J. Immobilization of histidine-tagged proteins on electrodes. Colloids Surf. B Biointerfaces 2011, 88, 539–551. [Google Scholar] [CrossRef] [PubMed]
- Ferrero, V.E.; Andolfi, L.; Di Nardo, G.; Sadeghi, S.J.; Fantuzzi, A.; Cannistraro, S.; Gilardi, G. Protein and electrode engineering for the covalent immobilization of P450 BMP on gold. Anal. Chem. 2008, 80, 8438–8446. [Google Scholar] [CrossRef] [PubMed]
- Trashin, S.; de Jong, M.; Meynen, V.; Dewilde, S.; De Wael, K. Attaching Redox Proteins onto Electrode Surfaces by using bis-Silane. ChemElectroChem 2016, 3, 1035–1038. [Google Scholar] [CrossRef]
- Scouten, W.H.; Luong, J.H.; Brown, R.S. Enzyme or protein immobilization techniques for applications in biosensor design. Trends Biotechnol. 1995, 13, 178–185. [Google Scholar] [CrossRef]
- Masuoka, J.; Saltman, P. Zinc (II) and copper (II) binding to serum albumin. A comparative study of dog, bovine, and human albumin. J. Biol. Chem. 1994, 269, 25557–25561. [Google Scholar]
- Ratner, B.D.; Hoffman, A.S.; Schoen, F.J.; Lemons, J.E. Biomaterials Science: An Introduction to Materials in Medicine; Elsevier Academic Press: San Diego, CA, USA, 2004. [Google Scholar]
- WanTai, G. Protein immobilization on polypropylene surface modified by photografting. J. Beijing Univ. Chem. Technol. (Nat. Sci. Ed.). 2008, 4, 014. [Google Scholar]
- Hwang, L.Y.; Götz, H.; Hawker, C.J.; Frank, C.W. Glyco-acrylate copolymers for bilayer tethering on benzophenone-modified substrates. Colloids Surf. B Biointerfaces 2007, 54, 127–135. [Google Scholar] [CrossRef] [PubMed]
- Wu, X.; Tang, Q.; Liu, C.; Li, Q.; Guo, Y.; Yang, Y.; Deng, Y. Protein photoimmobilizations on the surface of quartz glass simply mediated by benzophenone. Appl. Surf. Sci. 2011, 257, 7415–7421. [Google Scholar] [CrossRef]
- Ericsson, E. Biosensor Surface Chemistry for Oriented Protein Immobilization and Biochip Patterning. Ph.D. Thesis, Linköping University, Linkoping, Sweden, 2013. [Google Scholar]
- Organisation Internationale de la Vigne et du Vin. Compendium of International Methods of Analysis—OIV, Copper, OIV-MA-AS322-06: R2009, Method OIV-MA-AS322-06, Type IV Method, Copper (Resolution Oeno 377/2009). Available online: http://www.oiv.int/en/technical-standards-and-documents/methods-of-analysis/compendium-of-international-methods-of-analysis-of-wines-and-musts-2-vol (accessed on 22 October 2019).
- Peters, T.; Blumenstock, F.A. Copper-binding properties of bovine serum albumin and its amino-terminal peptide fragment. J. Biol. Chem. 1967, 247, 1574–1578. [Google Scholar]
- Haque, F.; Rahman, M.S.; Ahmed, E.; Bakshi, P.K.; Shaikh, A.A. A cyclic voltammetric study of the redox reaction of Cu (II) in presence of ascorbic acid in different pH media. Dhaka Univ. J. Sci. 2013, 61, 161–166. [Google Scholar] [CrossRef]
- Balakrishnan, S.R.; Hashim, U.; Letchumanan, G.R.; Kashif, M.; Ruslinda, A.R.; Liu, W.W.; Poopalan, P. Development of highly sensitive polysilicon nanogap with APTES/GOx based lab-on-chip biosensor to determine low levels of salivary glucose. Sens. Actuator A Phys. 2014, 220, 101–111. [Google Scholar] [CrossRef]
- Armbruster, D.A.; Pry, T. Limit of blank, limit of detection and limit of quantitation. Clin. Biochem. Rev. 2008, 29, S49–S52. [Google Scholar]
- Norocel, L.; Gutt, G. Development and performance testing of an electrochemical sensor for determination of iron ions in wine. Aust. J. Grape Wine R 2019, 25, 161–164. [Google Scholar] [CrossRef]
- Alqasaimeh, M.; Heng, L.Y.; Ahmad, M.; Raj, A.S.; Ling, T.L. A large response range reflectometric urea biosensor made from silica-gel nanoparticles. Sensors 2014, 14, 13186–13209. [Google Scholar] [CrossRef]
- Pathakoti, K.; Manubolu, M.; Hwang, H.M. Nanotechnology applications for environmental industry. In Handbook of Nanomaterials for Industrial Applications; Elsevier: Amsterdam, The Netherlands, 2018; pp. 894–907. [Google Scholar]


© 2019 by the authors. Licensee MDPI, Basel, Switzerland. This article is an open access article distributed under the terms and conditions of the Creative Commons Attribution (CC BY) license (http://creativecommons.org/licenses/by/4.0/).
Share and Cite
Norocel, L.; Gutt, G. Screen-Printed Voltammetric Biosensors for the Determination of Copper in Wine. Sensors 2019, 19, 4618. https://doi.org/10.3390/s19214618
Norocel L, Gutt G. Screen-Printed Voltammetric Biosensors for the Determination of Copper in Wine. Sensors. 2019; 19(21):4618. https://doi.org/10.3390/s19214618
Chicago/Turabian StyleNorocel, Liliana, and Gheorghe Gutt. 2019. "Screen-Printed Voltammetric Biosensors for the Determination of Copper in Wine" Sensors 19, no. 21: 4618. https://doi.org/10.3390/s19214618