Article

A GSH Fluorescent Probe with a Large Stokes Shift and Its Application in Living Cells

1
College of Chemistry and Materials Engineering, Anhui Science and Technology University, Bengbu 233030, China
2
State Key Laboratory of Molecular Engineering of Polymers, Fudan University, Shanghai 200433, China
3
Institute of Biomedical and Health Science, Anhui Science and Technology University, Bengbu 233030, China
*
Authors to whom correspondence should be addressed.
Sensors 2019, 19(24), 5348; https://doi.org/10.3390/s19245348
Submission received: 15 November 2019 / Revised: 1 December 2019 / Accepted: 2 December 2019 / Published: 4 December 2019
(This article belongs to the Special Issue Luminescent/Colorimetric Probes and Sensors)

Abstract

:
Intracellular GSH is the most abundant non-protein biothiol and acts as a central antioxidant to defend against aging toxins and radicals. Meanwhile abnormal level of intracellular GSH concentration is directly related to some diseases. In this case, detecting intracellular GSH rapidly and sensitively is of great significance. We synthesize a simple fluorescent probe (named GP) which can discriminate GSH from Cys (cysteine) or Hcy (homocysteine) and presents a 50-fold fluorescence increasing. The response time of GP to GSH was only 5 min and the product GO (the product of GP after reacting with GSH) after reacting with GSH possesses a larger Stokes shift for 135 nm than that in reported work. Probe GP can detect intracellular effectively and shows obvious yellow fluorescence. Briefly, probe GP can detect intracellular GSH rapidly and effectively both in vitro and in living cells.

Graphical Abstract

1. Introduction

Biothiols containing glutathione (GSH), cysteine (Cys) and homocysteine (Hcy) play significant roles in maintaining the normal redox status in biological systems [1,2,3]. However, GSH, a tripeptide which is made up of glutamic acid, cysteine, and glycine [4], is the most abundant non-protein biothiol and acts as a central antioxidant to defend against aging toxins and radicals [5,6]. Sulfhydryl reduced form (GSH) and disulfide oxidized form (GSSG) are two existing forms in vivo and they maintain the redox homeostasis via the transformation between GSH and GSSG [7]. The concentration of GSH ranges from micromole in saliva, plasma, and other body fluids to millimole in cells [8]. Meanwhile, an abnormal level of GSH concentration is directly related to some diseases, such as retarded children, hepatic impairment, and even serious diseases such as Alzheimer’s disease [9], cardiovascular diseases [10], diabetes mellitus [11], cancer, etc. As the structure of GSH was extremely similar to that of Cys or Hcy, it is a tough mission to discriminate GSH from Cys and Hcy.
Familiar methods to detect GSH mainly include electrochemistry [12], colorimetry [13], surface-enhanced Raman scattering [14], magnetic resonance imaging [15], mass spectrometry [16], electrochemical luminescence [17], and fluorescence spectroscopy [18]. Among those detection methods, fluorescent analysis is a much simpler, more efficient and lower destructive method and detecting limits, which can be applied in living cells and even in vivo to imaging bio-thiols. In this case, development of a stable, sensitive, efficient and fast responsive fluorescent probe to GSH is meaningful both in vitro and in vivo.
Fluorescent probes can be classified into two categories: inorganic materials and organic molecules. Inorganic materials applied to detect GSH mainly take advantage of the reduction properties of GSH [19]. Most organic fluorescent probes which were applied to detect GSH showed high nucleophilicity, which were named “reaction based probes”. Reaction based probes are mainly related to cleavage of sulfonate ester [20], acryloyl ester [7] and aryl substitution reactions [5,21,22], disulfide bond cleavage [23] and cyclization [24], and Michael additions [25,26]. As organic molecules are easy to modify, fluorescent probes with different emission wavelengths were synthesized and applied to cell imaging. Benzothiazoles derivatives have rigid planar structure, high fluorescence quantum yield, low toxicity, etc., which have important applications in photoelectric materials [27] and fluorescent probes [28,29,30,31]. The reported benzothiazole-based derivatives mainly emit blue or green light, which is limited for application in cell imaging. Therefore, it is of great significance to develop benzothiazole-based probes with longer fluorescence emission wavelength.
In this work, we synthesized a benzothiazole-based derivative GP that showed an “off–on” fluorescent change as coming across GSH in a buffer solution system (as showed in Scheme 1). Fluorescence intensity could reach the plateau after incubating in a water bath for 5 min, which presented a relatively fast responding speed. In addition, the limit of detection was 0.36 µM. The fluorescent responding product (GO) showed the largest Stokes shift for about 135 nm until now. We applied the probe GP to detect GSH in human breast cancer cells (MDA-MB-231) by a confocal laser scanning microscope and showed an obvious fluorescence enhancement to GSH compared with that in cells pretreated with a quenching agent of bio-thiols. The probe GP realized the fast detecting GSH and imaging GSH in living cells.

2. Materials and Methods

2.1. Materials

Regular reagents were acquired from suppliers and used without further purification. 2-Cyano-6-Hydroxybenzothiazole, 2-aminobenzenethiol, N-Ethylmaleimide, acetonitrile, 2,4-Dinitrofluorobenzeneand Sate dry dimethyl formamide (DMF) were purchased from a general reagent. K2CO3, CH2Cl2, Et3N, and other common reagents were purchased form Sinopharm Chemical Reagent Co., Ltd. (Shanghai, China).

2.2. Physical Measurements and Instrumentation

Nuclear Magnetic resonance (1H NMR (400 MHz) and 13C NMR (100 MHz)) were tested on a JEOL instrument (JEOL, Tokyo, Japan). Proton chemical shifts are reported in parts per million with tetramethylsilane (TMS) as the reference. High-resolution mass spectra (HRMS) were successfully obtained by an Agilent Technologies 6200 series TOF/6500 series Q-TOF B.06.01 (B6157) instrument (California, USA) with the negative electro-spray ionization (ESI) ionization mode. A Shimadzu RF-6000 fluorescent spectrophotometer (Kyoto, Japan) was applied to test the fluorescent spectra. CLSM images were performed on a Zeiss LSM 710 (Jena, Germany).

2.3. Synthesis and Characterization of Probe GP

Compound 1 was synthesized according to reported method [32]. The synthesis equation of compound GP was showed as Scheme 2. In addition, 50 mg of compound 1 (0.18 mmol) was dissolved in DMF. 2,4-Dinitrofluorobenzene (36 mg, 0.19 mmol) and three drops of Et3N were added into the system, and the mixture was stirred at room temperature for 5 h. In the reaction process, pale yellow precipitation appeared. After the reaction finished, a pale yellow product (36.5 mg, 0.81 mmol, yield = 45%) was obtained via filtration. 1HNMR (CDCl3, 400 MHz): δ 8.86 (d, J = 2.6 Hz, 1H), 8.46 (dd, J = 9.2 Hz, 1H), 8.25 (d, J = 8.9 Hz, 1H), 8.19 (d, J = 8.0 Hz, 1H), 8.16 (d, J = 8.1 Hz, 1H), 8.09 (d, J = 2.3 Hz, 1H), 7.60 (dt, J = 27.3 Hz, 7.4 Hz, 2H), 7.48 (dd, J = 8.9 Hz, 2.4 Hz), 7.43 (d, J = 9.2 Hz, 1H). 13CNMR: δ 162.27, 162.18, 154.69, 153.68, 153.65, 151.40, 143.14, 140.88, 137.66, 135.90, 129.88, 127.65, 127.49, 125.86, 124.20, 123.10, 122.03, 121.50, 120.36, 113.88. HRMS (ESI, m/z): calculated for C20H10ClN4O5S2 [M + Cl] = 484.97866, found 484.97864.

2.4. Preparation of Samples and Test Solution

As the aromatic planner structure of probe GP, the solubility was poor in water or phosphate buffer solution (PBS), compound GP was dissolved in dimethylsulfoxide (DMSO) and got the stocked solution of which the concentration was 10−3 mol∙L−1. GSH, Cys, Hcy, and other amino acids were dissolved in distilled water to get a stock solution. The testing solution was obtained via diluting the stocked solution with PBS/DMSO (v:v = 7:3). The PBS concentration was 0.02 M and PH = 7.4. The mixture of probe EP and esterase was kept in the water bath at 37 °C for different lengths of time. In addition, the fluorescent testing was conducted with 370 nm as the excitation wavelength.

2.5. Calculating Method of LOD

The limit of detection (LOD) was calculated according to the following Formula:
LOD = 3 σ S   ,
In Formula (1), σ is the standard deviation of fluorescence intensity measurements for blank sample and testing number n = 14; and S is the slope of liner fitting equation.

2.6. Confocal Laser Scanning Microscope (CLSM) Imaging

Confocal Laser Scanning Microscope (CLSM) images were conducted on a Zeiss LSM 710. The fluorescent images were collected from 530 nm to 600 nm with 405 nm laser as the excitation wavelength.

3. Results and Discussion

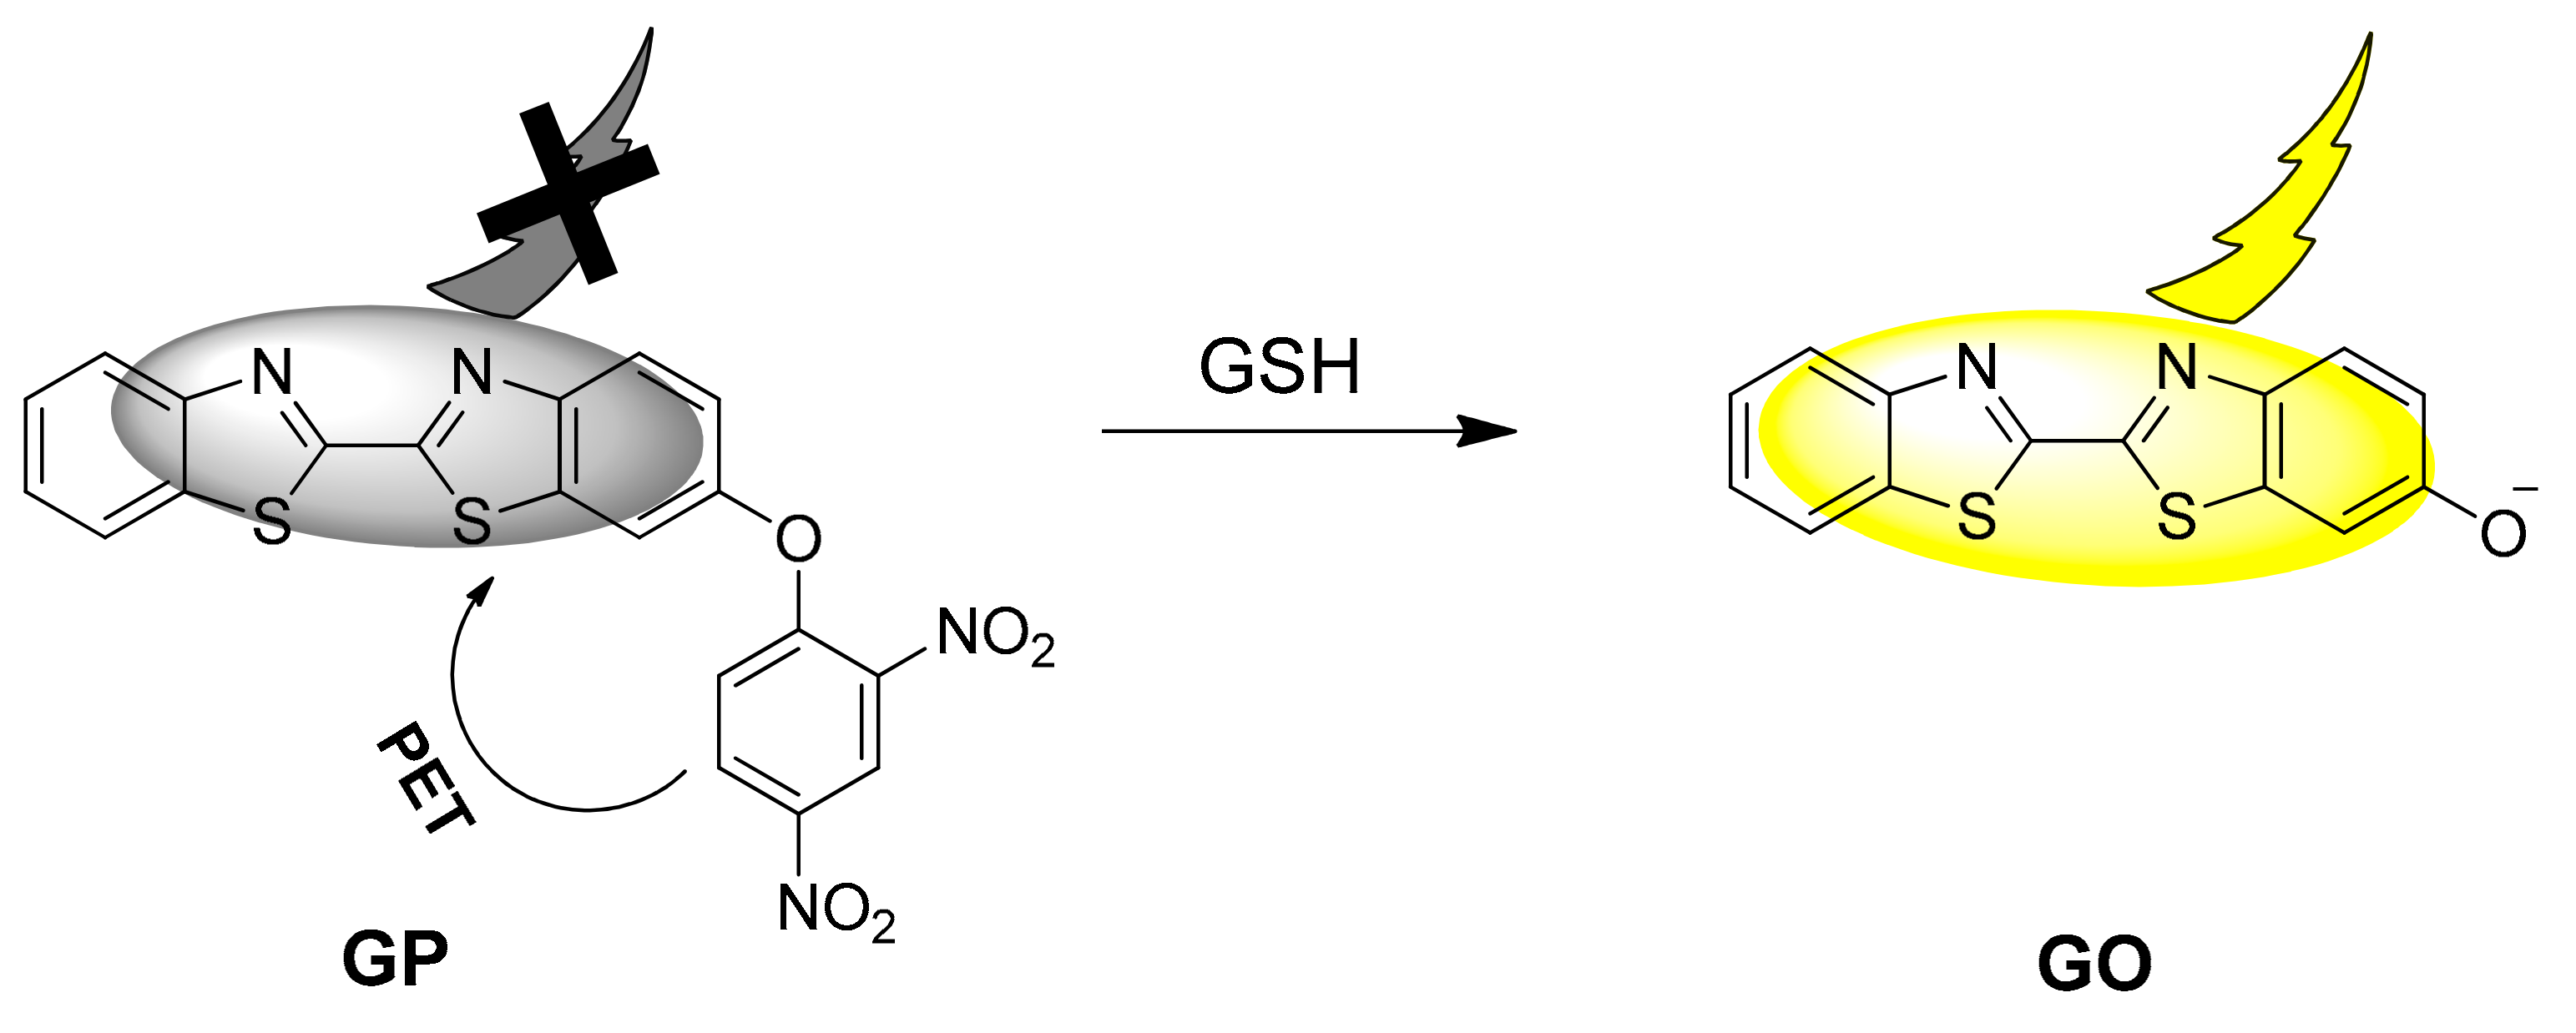
3.1. Preparation and Photo Physical Property

Probe GP was synthesized with compound 1 and 2,4-Dinitrofluorobenzene as the reported method [33]. With the dinitrophenyl group in molecule GP, photoelectron transfer (PET) [34,35,36] appeared between the dinitrophenyl group and benzothiazole fluorescent group, so no fluorescence appeared. As the nucleophilic replacement between GSH and probe GP in the buffer system (PBS (0.05 M): DMSO = 7:3, pH of PBS was 7.4), a strong yellow fluorescence appeared. Fluorescent emission and excitation spectra of GO (reaction product of GP solution with GSH) were tested, and it showed that the Stokes shift of GO was about 135 nm, which was a larger Stokes shift than those in reported references (Table S1) Fluorescence intensity of the GP solution showed a 50-fold increase (Figure 1a) after reacting with abundant GSH. As structures of cysteine (Cys) and homocysteine (Hcy) were similar to that of GSH, probe GP showed a slight increase after reacting with Cys (Figure 1b) or Hcy (Figure 1c). The fluorescence enhancement of GP with adding GSH, Cys, or Hcy, respectively, showed in Figure 1d, it is obvious that probe GP was more sensitive to detecting GSH with abundant incubating time (60 min). The limit of detection (LOD) could reflect the detection sensitivity of probe. LOD of GP was calculated as 0.36 µM (showed in Table S1).
The fluorescence intensity of probe GP with abundant GSH, Cys, or Hcy was tested as incubated in a 37 °C water bath for different lengths of time, and the variation trend was showed in Figure 2. We found that fluorescence intensity of a mixture system containing probe GP and GSH increased to the platform point after incubating in a 37 °C water bath for 5 min, whereas the mixtures containing probe GP and Cys or Hcy showed sluggish fluorescent enhancement after incubating in a 37 °C water bath for 60 min. In this case, we can discriminate GSH from Cys/Hcy with probe GP after incubating for a short period of time (5 min) in a water bath.
To verify if the fluorescent enhancement of mixture containing GP and GSH was caused by nucleophilic substitution of biothiols, we try to quench the biothiols with N-Ethylmaleimide (NEM, a quenching agent of bio-thiols through thiol alkylation). Different concentrations of NEM and 1000 μM GSH or Cys or Hcy were added to the buffer solution of probe GP, and obvious fluorescence quenching appeared as showed in Figure 3. In addition, 800 μM NEM could quench GSH (1000 μM) absolutely, while only 400 μM NEM was needed to quench Cys (1000 μM) or Hcy (1000 μM) completely. It may be that, due to the low chemical reactivity of Cys and Hcy with probe GP, the required concentration of NEM was low. This result indicated that the fluorescent enhancement was indeed caused by a substitution reaction of GSH with probe GP.

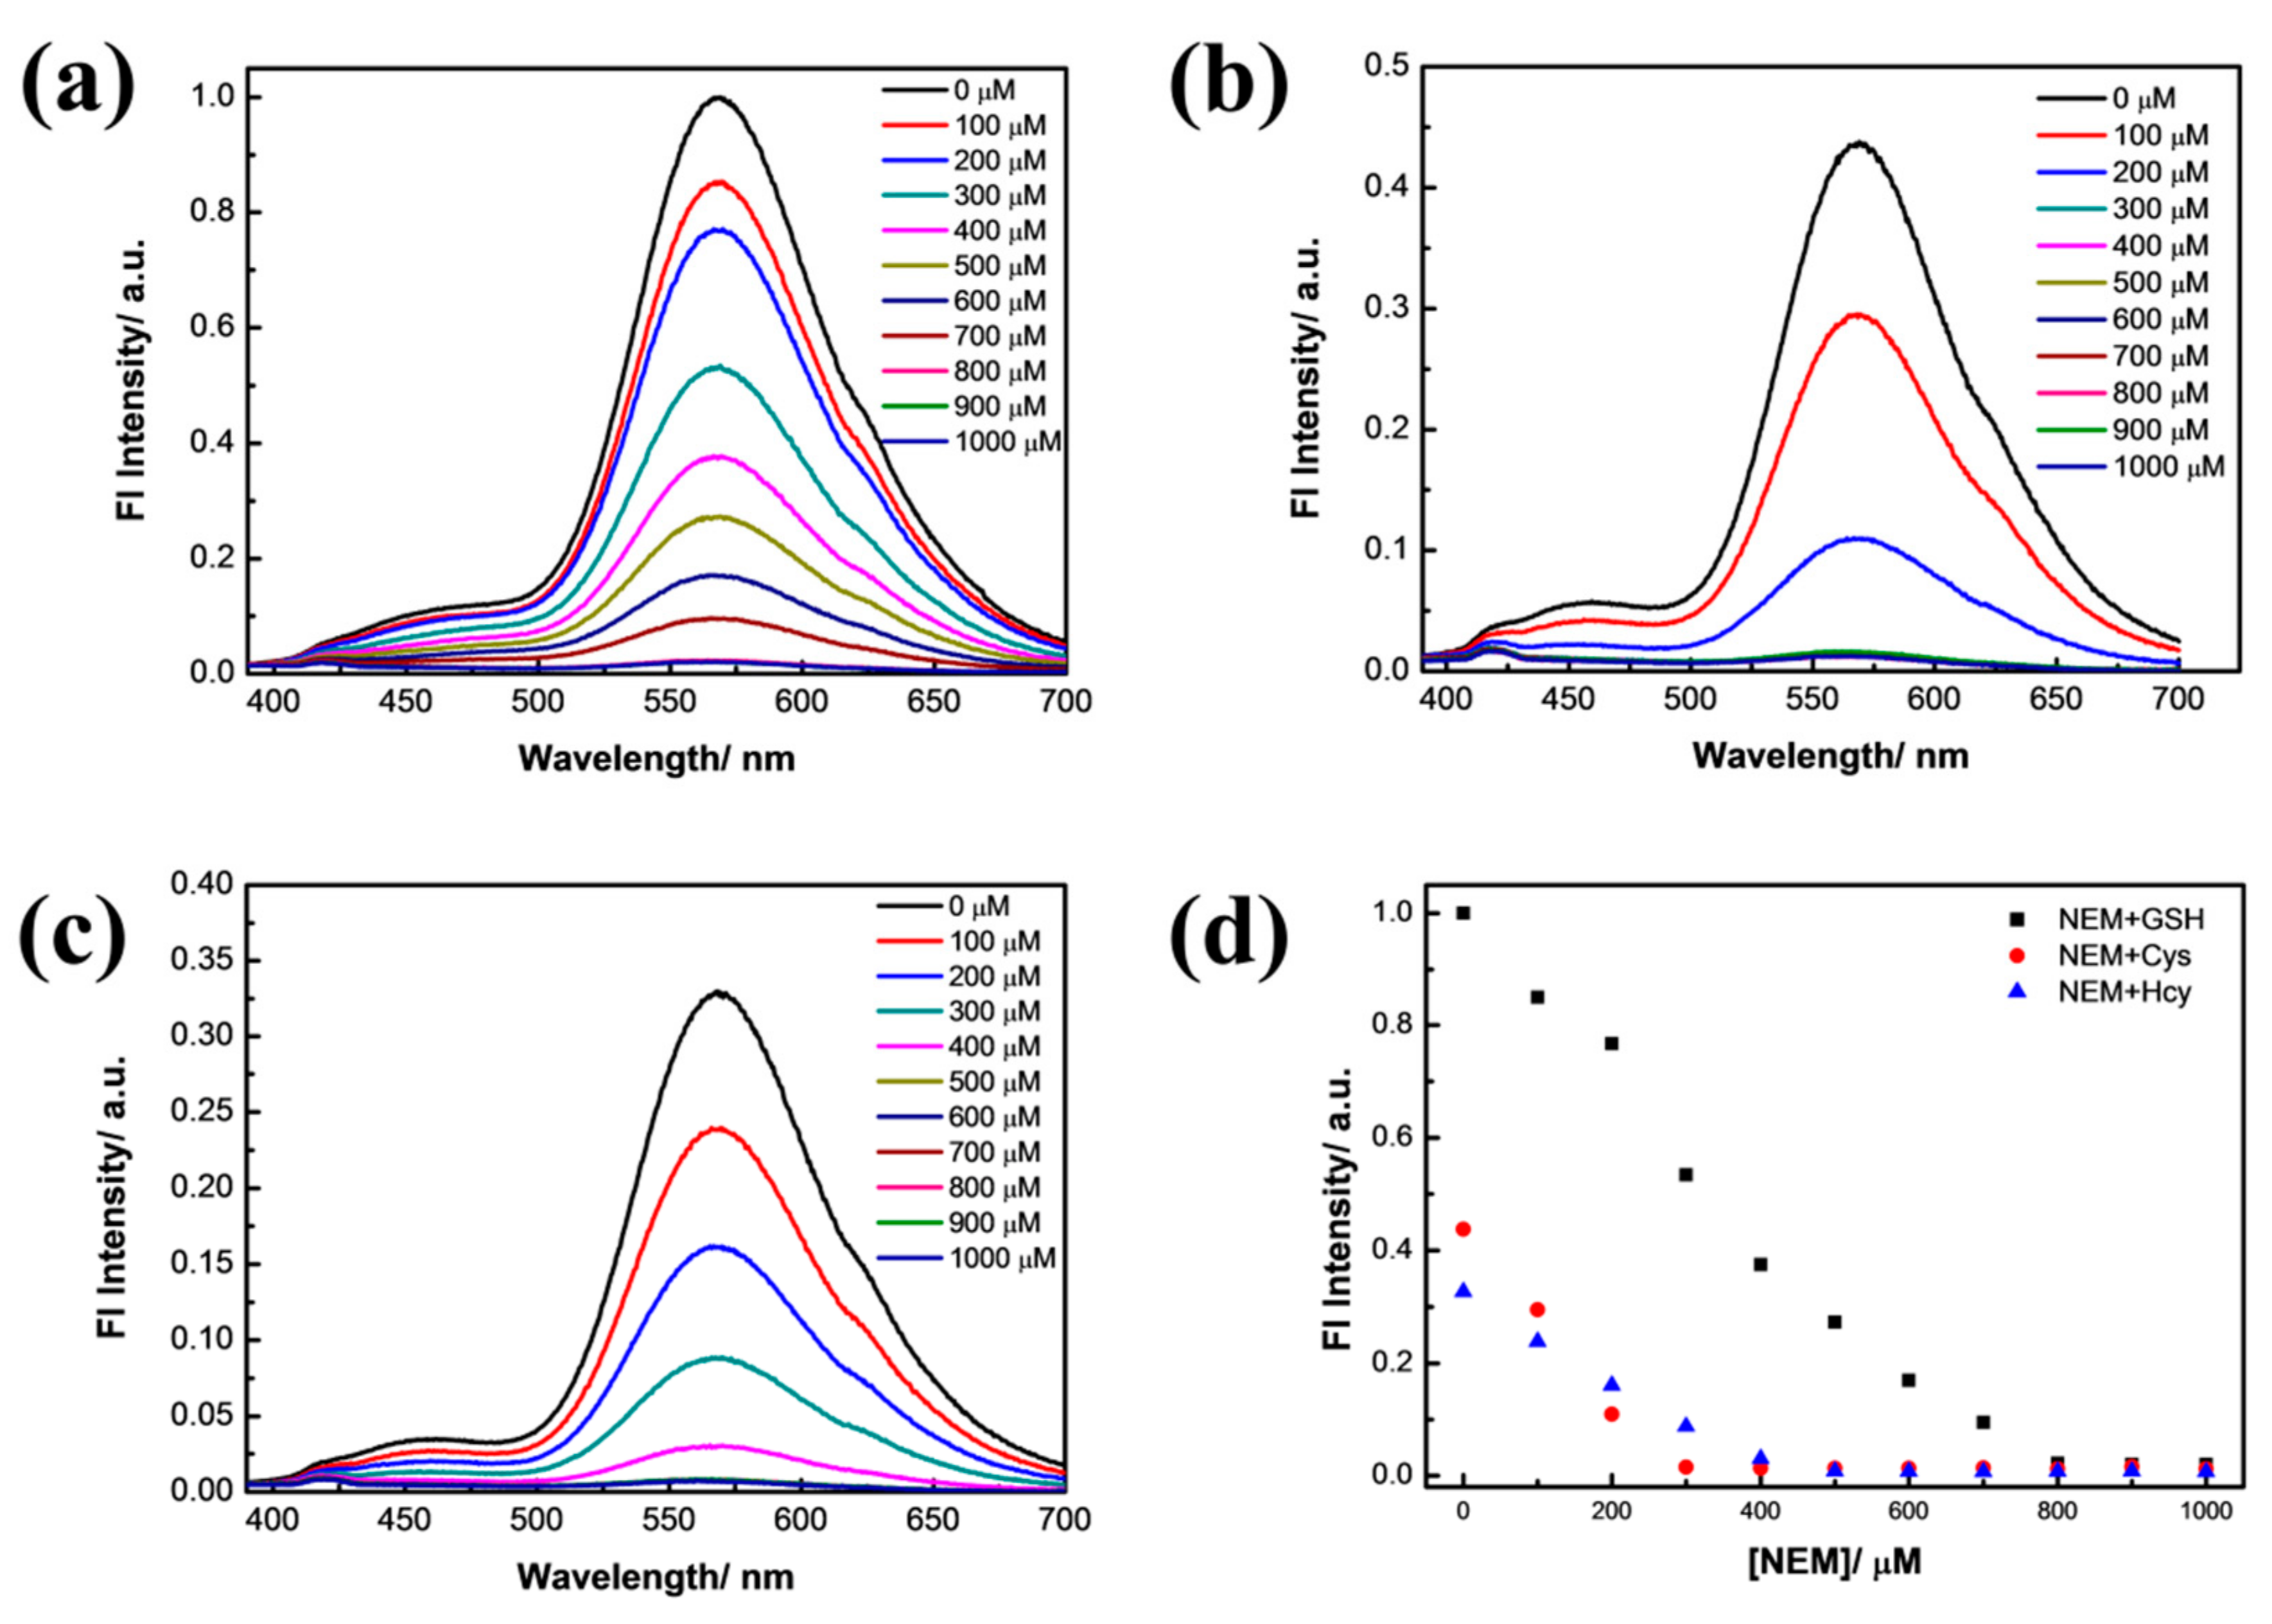
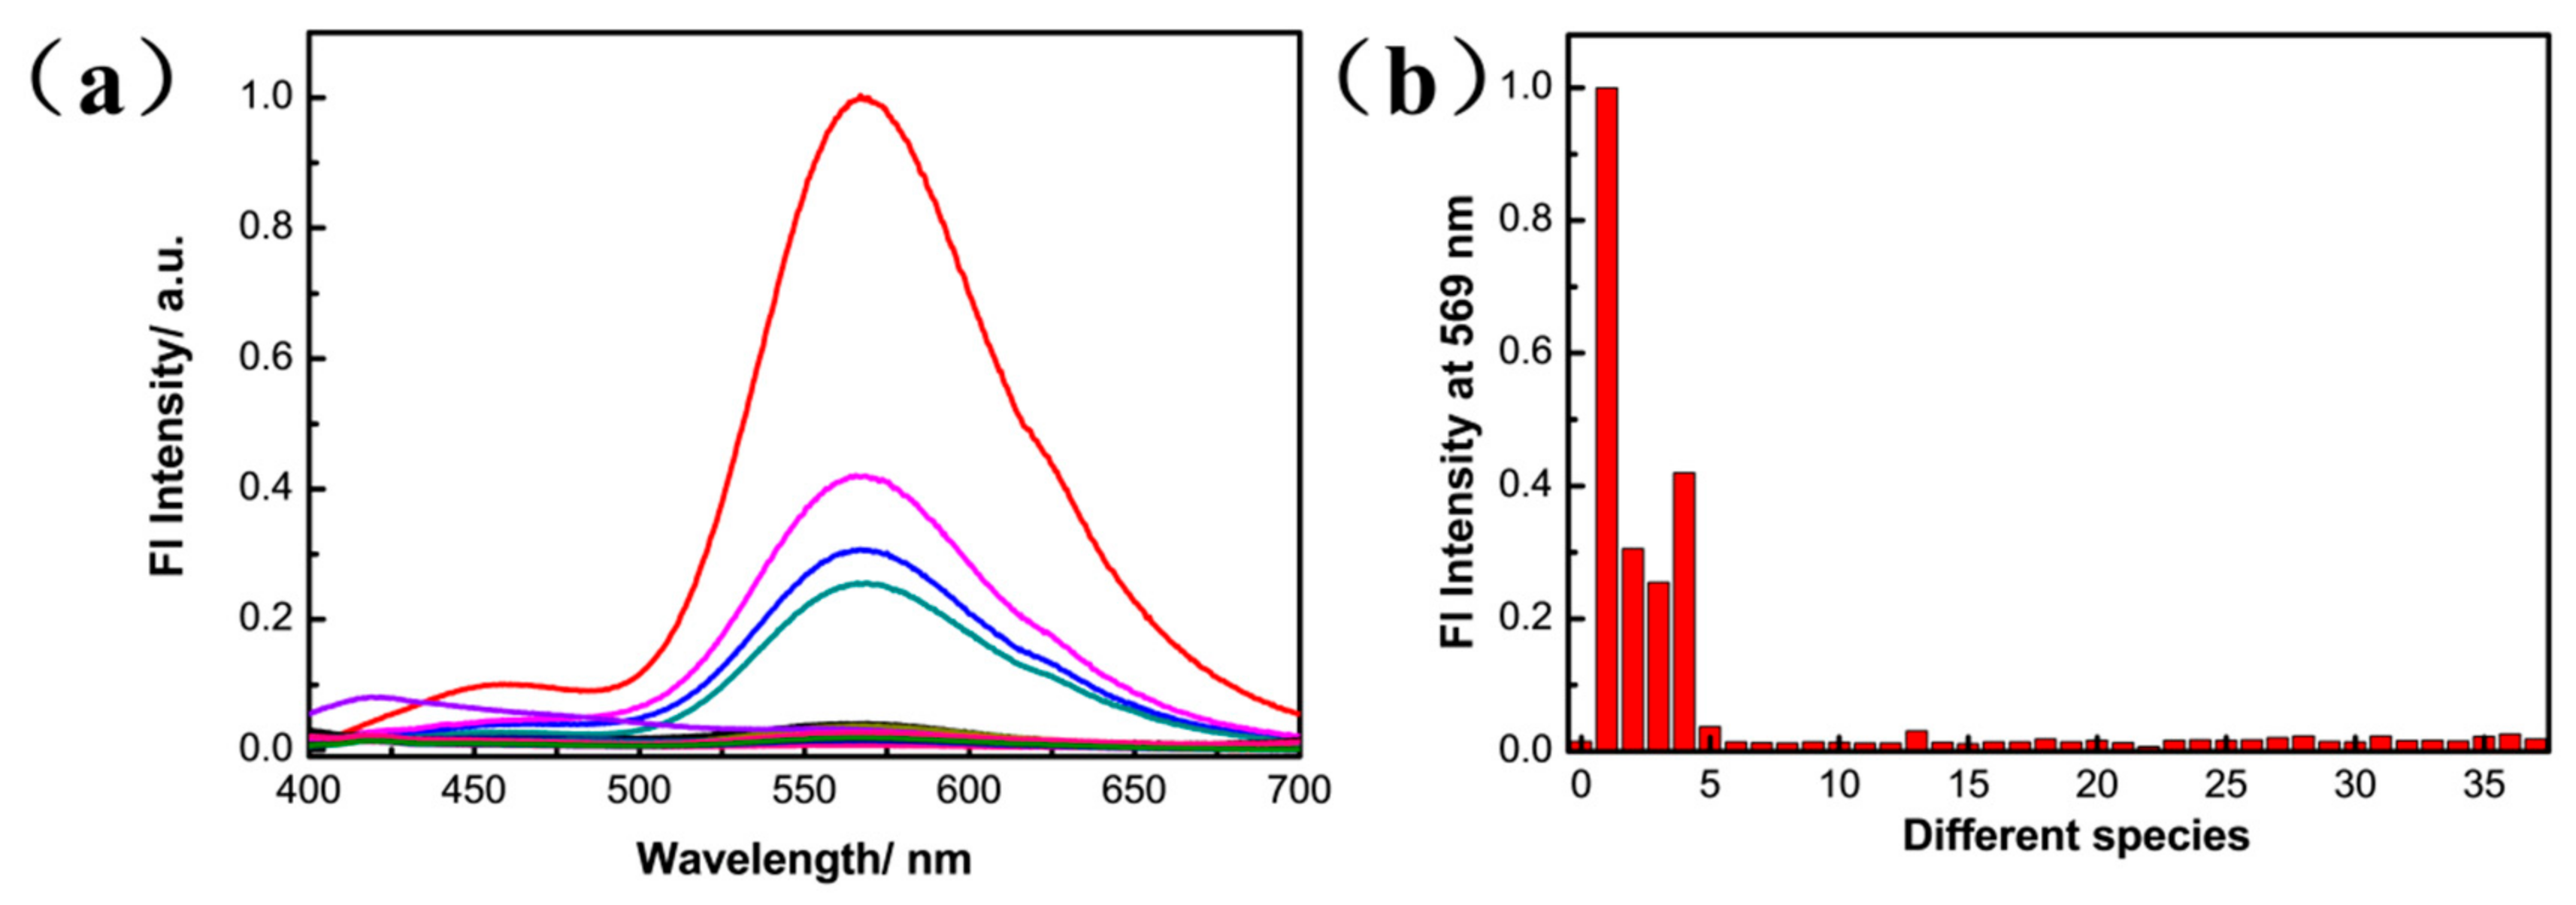
3.2. Selectivity Experiment

In general, fluorescent probes can be applied in cells to image target molecules. As the intracellular environment is complex and contains various proteins, amino acids, and ions, the selectivity of probe GP was necessary to evaluate the applicability. Different species were added into the GP solution and incubated mixture in a 37 °C water bath for 60 min; then, fluorescent spectra were conducted. As showed in Figure 4, Cys, Hcy, and H2S showed slight distractions while showing nearly no fluorescence enhancement after adding other amino acids and ions. This result indicated that probe GP showed high selectivity to other species in cells.

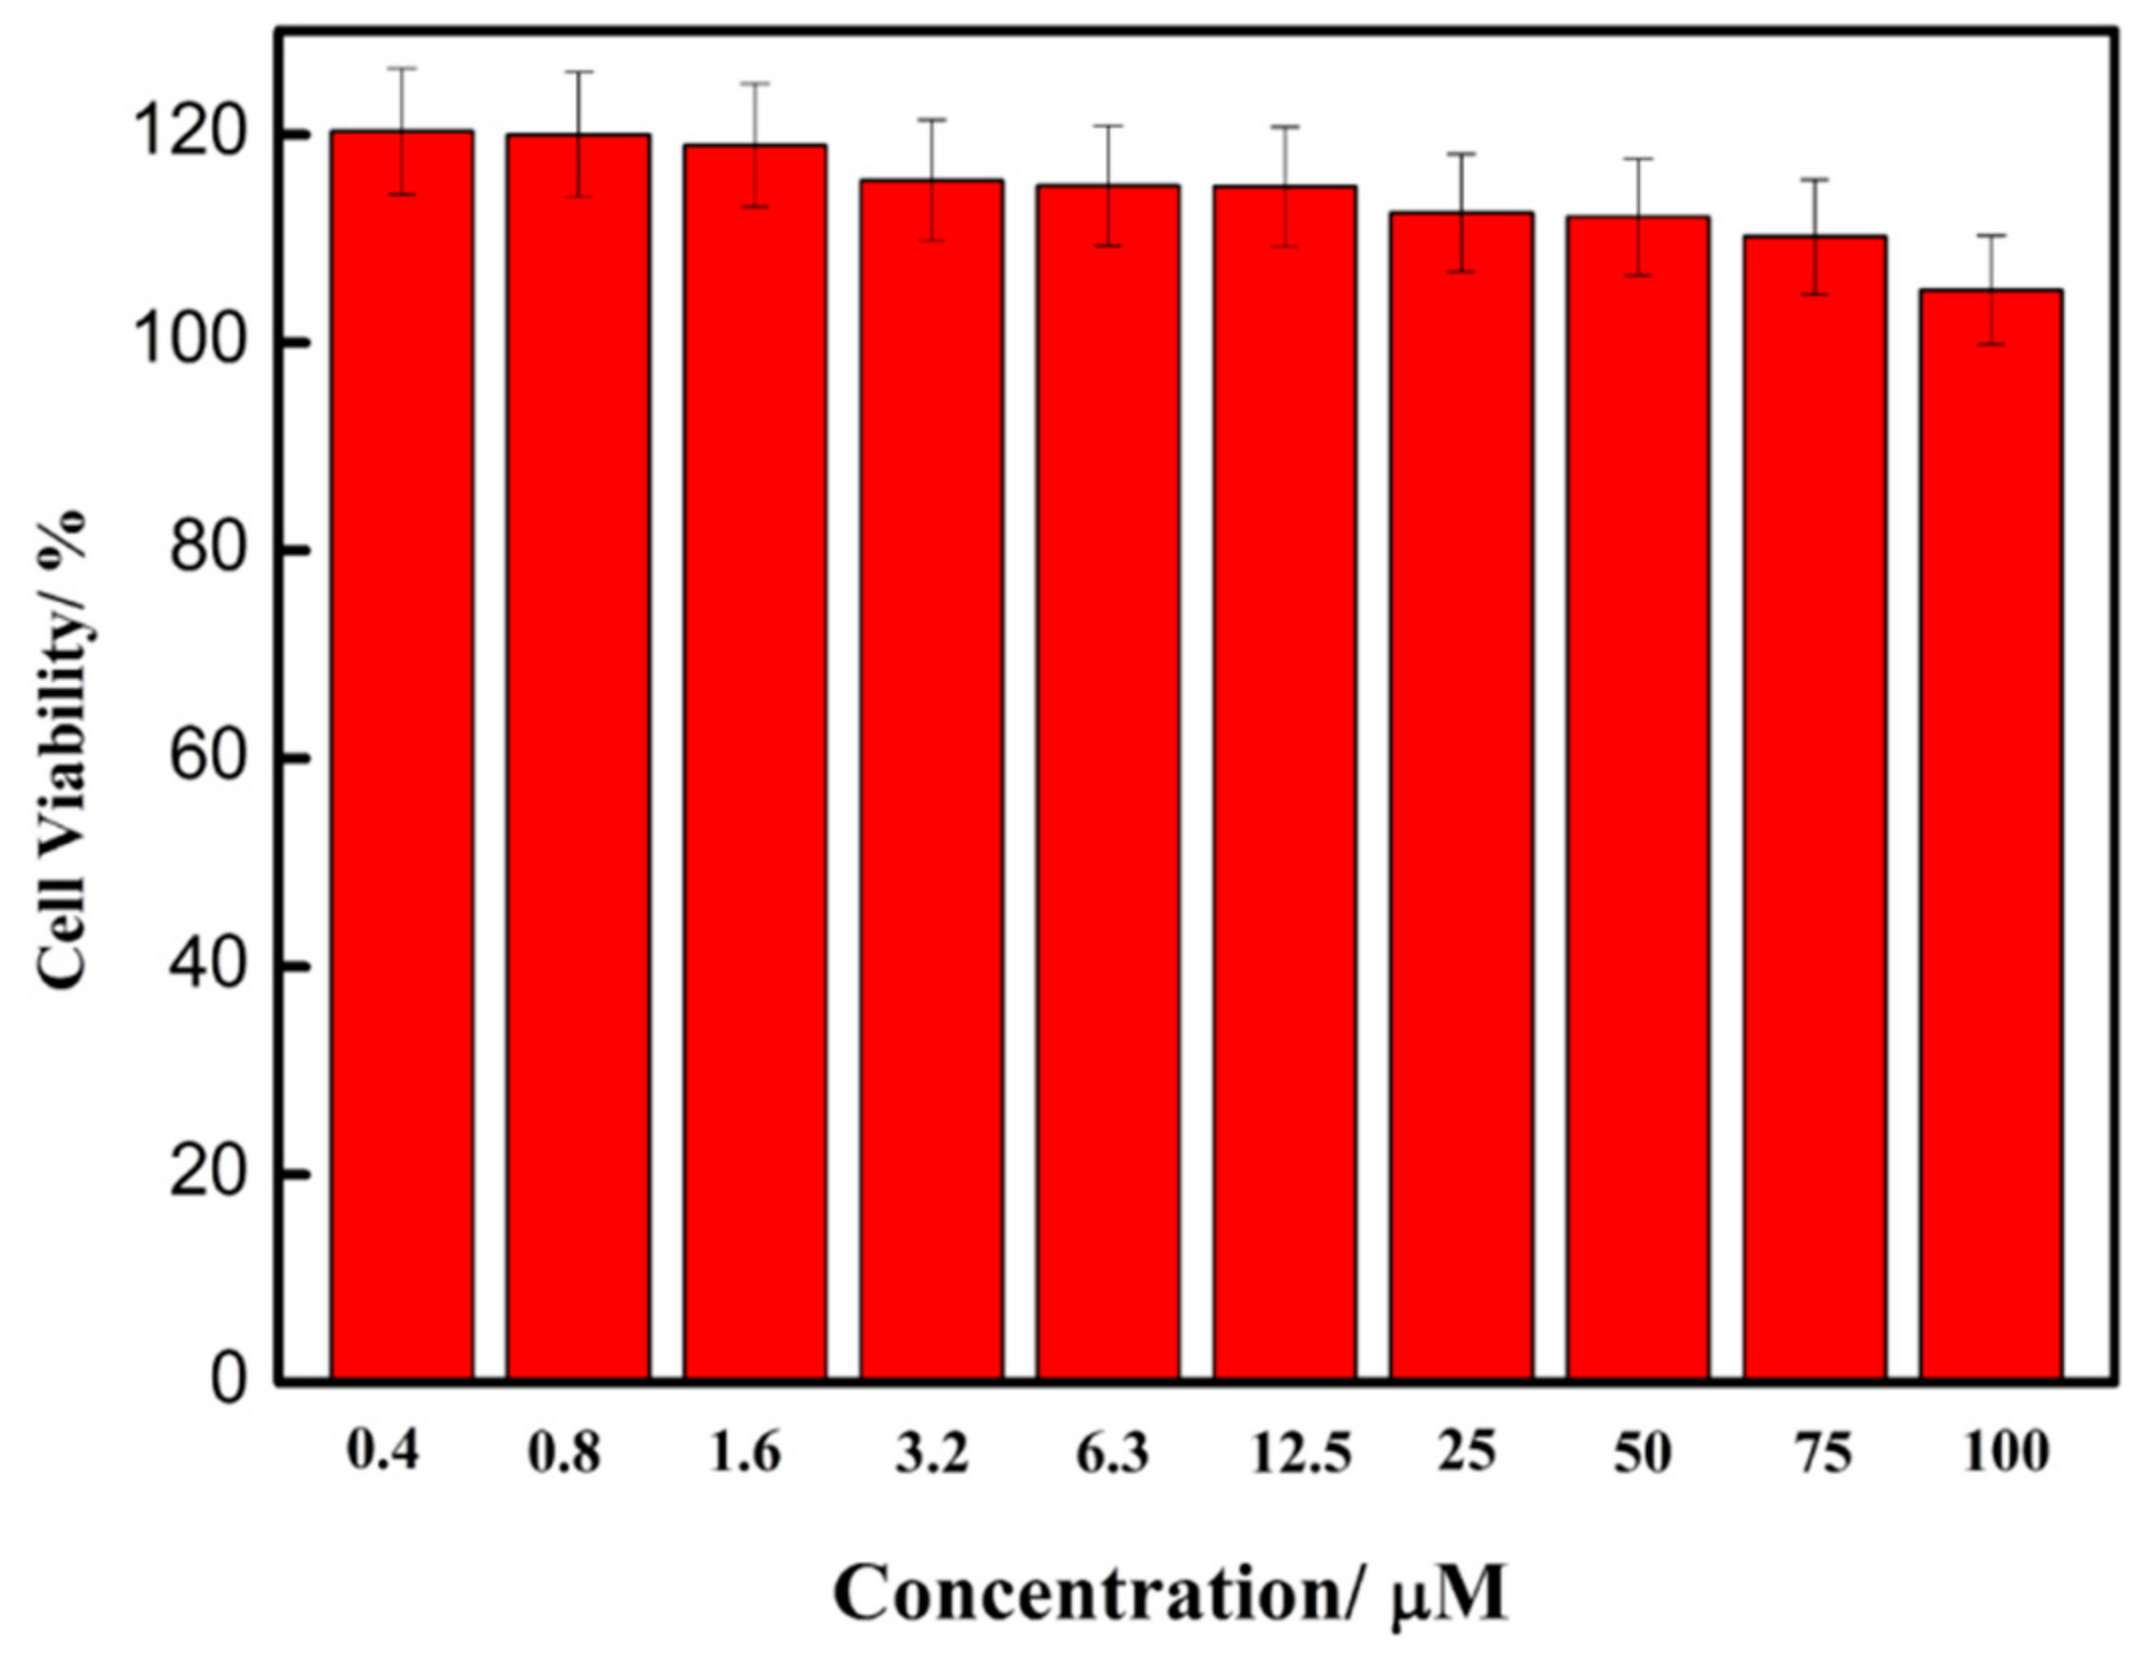
3.3. Cell Imaging Experiment and Its Application in the Analysis of Cell Healthy Status

We must test the toxicity of probe GP to MDA-MB-231 cells via the methyl thiazolyl tetrazolium (MTT) method before applying it to cell imaging. As showed in Figure 5, cell viability was still above 90% after incubating cells with different concentrations of probe GP (0–100 μM) for 24 h at 37 °C. This result indicated that probe GP was nearly nontoxic for MDA-MB-231 cells.
Cell imaging of GP to cellular GSH was conducted in MDA-MB-231 cells. MDA-MB-231 cells were incubated in the mixture of PBS (pH = 7.4): DMSP = 99.1 (v:v) containing 10 μM probe GP for 30 min at 37 °C and then imaging was performed on a Laser Scanning Confocal Microscope (LSCM). Cells incubated with a 10 μM probe GP presented visible fluorescence in the yellow channel (Figure 6a1–a3). Furthermore, fluorescence in cells became more obvious (Figure 6b1–b3) when cells were pretreated with 100 μM GSH for 30 min and then incubated with 10 μM GP for 30 min at 37 °C. This was due to the pretreating of GSH to cells giving rise to the intracellular GSH concentration; the intracellular fluorescence induced by GSH become more obvious consequently. We evaluated the quenching effect of NEM to intracellular GSH. Cells were pretreated with 1 mM NEM for 30 min and then incubated with 10 μM probe GP. As showed in Figure 6c1–c3, fluorescence almost decreased to extinction and this indicated that NEM indeed quenched the intracellular GSH. These cell imaging experiment results showed that probe GP can image the intracellular GSH effectively.

4. Conclusions

In this work, we synthesized a GSH responding probe GP and characterized the structure via NMR and HRMS. Probe GP can discriminate GSH from Cys or Hcy and shows a 50-fold fluorescence increasing at 569 nm when adding GSH into a solution of GP in PBS/DMSO (v:v = 7:3) mixed solvent. Probe GP showed a short response time and fluorescence intensity reached the platform after incubating the mixture of GP and GSH at 37 °C for 5 min. The product of GP reacting with GSH possesses a large Stokes shift for 135 nm. Probe GP has to be applied to detect intracellular GSH and presents obvious fluorescence in MDA-MB-231 cells. This indicates that GP can discriminate GSH from extremely similar biothiols (Cys and Hcy) and be applied as a GSH fluorescence probe both in vitro and in living cells. As a fluorescent probe that emits near-infrared fluorescence is more appropriate to image in cells or tissues, further work is underway to shift fluorescence wavelength to near infrared region.

Supplementary Materials

The following are available online at https://www.mdpi.com/1424-8220/19/24/5348/s1, Figure S1: Excitation (Ex) and emission (Em) spectra of GO, which is the product of GP (10 μM) reacting with GSH (1000 μM), Table S1: Limit of detection (LOD), responding time and Sticks shift of reported probes for GSH, Figure S2: 1HNMR of compound GP was conducted in d6-DMSO, Figure S3: 13CNMR of compound GP in d6-DMSO, Figure S4: HRMS of compound GP.

Author Contributions

Y.X., Z.L., Y.W., H.D., and R.D. did the experiments. L.L. conducted the analysis of experiment results. Y.M. designed the experiment and wrote the paper. G.L. helped to analyze the data. All authors approved the final paper.

Funding

This research was funded by the National Natural Science Foundation of China (21804001), Foundation of State Key Laboratory of Molecular Engineering of Polymers (Fudan University) (K2019-24), the Natural Science Foundation of Anhui Province (KJ2019ZD58 and KJ2019A0807), the Materials Science and Engineering Key Discipline Foundation (AKZDXK2015A01), the Foundation of Anhui Science and Technology University (HCYJ201704), and the National Innovation Training Program for Undergraduates (201810879019).

Conflicts of Interest

The authors declare no conflict of interest. The funders had no role in the design of the study; in the collection, analyses, or interpretation of data; in the writing of the manuscript, or in the decision to publish the results.

References

  1. Rui, H.; Gang, H.; Fernández, J.M.; Byoung-Jin, K.; Forbes, N.S.; Rotello, V.M. Glutathione-mediated delivery and release using monolayer protected nanoparticle carriers. J. Am. Chem. Soc. 2006, 128, 1078–1079. [Google Scholar]
  2. Niu, H.; Ni, B.; Chen, K.; Yang, X.; Cao, W.; Ye, Y.; Zhao, Y. A long-wavelength-emitting fluorescent probe for simultaneous discrimination of H2S/Cys/GSH and its bio-imaging applications. Talanta 2019, 196, 145–152. [Google Scholar] [CrossRef] [PubMed]
  3. Ren, X.; Tian, H.; Yang, L.; He, L.; Geng, Y.; Liu, X.; Song, X. Fluorescent probe for simultaneous discrimination of Cys/Hcy and GSH in pure aqueous media with a fast response under a single-wavelength excitation. Sens. Actuators B Chem. 2018, 273, 1170–1178. [Google Scholar] [CrossRef]
  4. Yang, R.; Tang, Y.; Zhu, W. Ratiometric Fluorescent Probe for the Detection of Glutathione in Living Cells. Chem. J. Chin. Univ.-Chin. 2016, 37, 643–647. [Google Scholar] [CrossRef]
  5. Niu, L.-Y.; Guan, Y.-S.; Chen, Y.-Z.; Wu, L.-Z.; Tung, C.-H.; Yang, Q.-Z. BODIPY-Based Ratiometric Fluorescent Sensor for Highly Selective Detection of Glutathione over Cysteine and Homocysteine. J. Am. Chem. Soc. 2012, 134, 18928–18931. [Google Scholar] [CrossRef]
  6. Lee, S.; Li, J.; Xin, Z.; Yin, J.; Yoon, J. Recent progress on the development of glutathione (GSH) selective fluorescent and colorimetric probes. Coord. Chem. Rev. 2018, 366, 29–68. [Google Scholar] [CrossRef]
  7. Huang, R.; Wang, B.-B.; Si-Tu, X.-M.; Gao, T.; Wang, F.-F.; He, H.; Fan, X.-Y.; Jiang, F.-L.; Liu, Y. A lysosome-targeted fluorescent sensor for the detection of glutathione in cells with an extremely fast response. Chem. Commun. 2016, 52, 11579–11582. [Google Scholar] [CrossRef]
  8. Shi, Y.; Pan, Y.; Zhang, H.; Zhang, Z.; Li, M.-J.; Yi, C.; Yang, M. A dual-mode nanosensor based on carbon quantum dots and gold nanoparticles for discriminative detection of glutathione in human plasma. Biosens. Bioelectron. 2014, 56, 39–45. [Google Scholar] [CrossRef]
  9. Zampagni, M.; Wright, D.; Cascella, R.; D’Adamio, G.; Casamenti, F.; Evangelisti, E.; Cardona, F.; Goti, A.; Nacmias, B.; Sorbi, S.; et al. Novel S-acyl glutathione derivatives prevent amyloid oxidative stress and cholinergic dysfunction in Alzheimer disease models. Free Radic. Biol. Med. 2012, 52, 1362–1371. [Google Scholar] [CrossRef]
  10. Gong, D.; Ru, J.; Cao, T.; Qian, J.; Liu, W.; Iqbal, A.; Liu, W.; Qin, W.; Guo, H. Two-stage ratiometric fluorescent responsive probe for rapid glutathione detection based on BODIPY thiol-halogen nucleophilic mono- or disubstitution. Sens. Actuators B Chem. 2018, 258, 72–79. [Google Scholar] [CrossRef]
  11. Seghrouchni, I.; Drai, J.; Bannier, E.; Rivière, J.; Revol, A. Oxidative stress parameters in type I, type II and insulin-treated type 2 diabetes mellitus; insulin treatment efficiency. Clin. Chim. Acta 2002, 321, 89–96. [Google Scholar] [CrossRef]
  12. Yuan, B.; Zeng, X.; Xu, C.; Lin, L.; Ma, Y.; Zhang, D.; Yong, F. Electrochemical modification of graphene oxide bearing different types of oxygen functional species for the electro-catalytic oxidation of reduced glutathione. Sens. Actuators B Chem. 2013, 184, 15–20. [Google Scholar] [CrossRef]
  13. Huang, Z.M.; Cai, Q.Y.; Ding, D.C.; Ge, J.; Hu, Y.L.; Yang, J.; Zhang, L.; Li, Z.H. A facile label-free colorimetric method for highly sensitive glutathione detection by using manganese dioxide nanosheets. Sens. Actuators B Chem. 2017, 242, 355–361. [Google Scholar] [CrossRef]
  14. Arindam, S.; Jana, N.R. Detection of cellular glutathione and oxidized glutathione using magnetic-plasmonic nanocomposite-based “turn-off” surface enhanced Raman scattering. Anal. Chem. 2013, 85, 9221–9228. [Google Scholar]
  15. Zhao, Z.; Fan, H.; Zhou, G.; Bai, H.; Liang, H.; Wang, R.; Zhang, X.; Tan, W. Activatable fluorescence/MRI bimodal platform for tumor cell imaging via MnO2 nanosheet-aptamer nanoprobe. J. Am. Chem. Soc. 2014, 136, 11220–11223. [Google Scholar] [CrossRef]
  16. Zhu, X.; Kalyanaraman, N.; Subramanian, R. Enhanced screening of glutathione-trapped reactive metabolites by in-source collision-induced dissociation and extraction of product ion using UHPLC-high resolution mass spectrometry. Anal. Chem. 2011, 83, 9516. [Google Scholar] [CrossRef]
  17. Gao, W.; Liu, Z.; Qi, L.; Lai, J.; Kitte, S.A.; Xu, G. Ultrasensitive Glutathione Detection Based on Lucigenin Cathodic Electrochemiluminescence in the Presence of MnO2 Nanosheets. Anal. Chem. 2016, 88, 7654. [Google Scholar] [CrossRef]
  18. Yu, F.; Li, P.; Wang, B.; Han, K. Reversible near-infrared fluorescent probe introducing tellurium to mimetic glutathione peroxidase for monitoring the redox cycles between peroxynitrite and glutathione in vivo. J. Am. Chem. Soc. 2013, 135, 7674–7680. [Google Scholar] [CrossRef]
  19. Han, L.; Liu, S.G.; Zhang, X.F.; Tao, B.X.; Li, N.B.; Luo, H.Q. A sensitive polymer dots-manganese dioxide fluorescent nanosensor for “turn-on” detection of glutathione in human serum. Sens. Actuators B Chem. 2018, 258, 25–31. [Google Scholar] [CrossRef]
  20. Xia, X.; Qian, Y.; Shen, B. Synthesis of a BODIPY disulfonate near-infrared fluorescence-enhanced probe with high selectivity to endogenous glutathione and two-photon fluorescent turn-on through thiol-induced SNAr substitution. J. Mater. Chem. B 2018, 6, 3023–3029. [Google Scholar] [CrossRef]
  21. Dai, X.; Wang, Z.-Y.; Du, Z.-F.; Cui, J.; Miao, J.-Y.; Zhao, B.-X. A colorimetric, ratiometric and water-soluble fluorescent probe for simultaneously sensing glutathione and cysteine/homocysteine. Anal. Chim. Acta 2015, 900, 103–110. [Google Scholar] [CrossRef] [PubMed]
  22. Li, X.; Huo, F.; Yue, Y.; Zhang, Y.; Yin, C. A coumarin-based “off-on” sensor for fluorescence selectivily discriminating GSH from Cys/Hcy and its bioimaging in living cells. Sens. Actuators B Chem. 2017, 253, 42–49. [Google Scholar] [CrossRef]
  23. Hou, X.; Li, Z.; Li, B.; Liu, C.; Xu, Z. An “off-on” fluorescein-based colormetric and fluorescent probe for the detection of glutathione and cysteine over homocysteine and its application for cell imaging. Sens. Actuators B Chem. 2018, 260, 295–302. [Google Scholar] [CrossRef]
  24. Zhang, X.; Ren, X.; Xu, Q.H.; Loh, K.P.; Chen, Z.K. One- and two-photon turn-on fluorescent probe for cysteine and homocysteine with large emission shift. Org. Lett. 2009, 11, 1257–1260. [Google Scholar] [CrossRef] [PubMed]
  25. Xu, G.; Tang, Y.; Lin, W. Development of a Two-photon Ratiometric Fluorescent Probe for Glutathione and Its Applications in Living Cells. Chem. Res. Chin. Univ. 2018, 34, 523–527. [Google Scholar] [CrossRef]
  26. Xiong, K.; Huo, F.; Chao, J.; Zhang, Y.; Yin, C. Colorimetric and NIR Fluorescence Probe with Multiple Binding Sites for Distinguishing Detection of Cys/Hcy and GSH in Vivo. Anal. Chem. 2019, 91, 1472–1478. [Google Scholar] [CrossRef]
  27. Zhao, L.; Wang, X.; Li, X.; Zhang, W.; Liu, X.; Zhu, Y.; Wang, H.-Q.; Fang, J. Improving performance and reducing hysteresis in perovskite solar cells by using F8BT as electron transporting layer. Sol. Energy Mater. Sol. Cells 2016, 157, 79–84. [Google Scholar] [CrossRef]
  28. Sun, W.; Li, W.; Li, J.; Zhang, J.; Du, L.; Li, M. A benzothiazole-based fluorescent probe for thiol bioimaging. Tetrahedron Lett. 2012, 53, 2332–2335. [Google Scholar] [CrossRef]
  29. Goswami, S.; Manna, A.; Paul, S.; Das, A.K.; Nandi, P.K.; Maity, A.K.; Saha, P. A turn on ESIPT probe for rapid and ratiometric fluorogenic detection of homocysteine and cysteine in water with live cell-imaging. Tetrahedron Lett. 2014, 55, 490–494. [Google Scholar] [CrossRef]
  30. Liu, Y.; Ding, Y.; Huang, J.; Zhang, X.; Fang, T.; Zhang, Y.; Zheng, X.; Yang, X. A benzothiazole-based fluorescent probe for selective detection of H2S in living cells and mouse hippocampal tissues. Dye. Pigment. 2017, 138, 112–118. [Google Scholar] [CrossRef]
  31. Ren, X.; Fang, W.; Jing, L.; Wei, T.; Wei, Z.; Yong, W.; Chen, X. An ESIPT-based fluorescent probe for highly selective detection of glutathione in aqueous solution and living cells. Dye. Pigment. 2016, 129, 156–162. [Google Scholar] [CrossRef]
  32. Mao, Y.; Du, H.; Wang, X.; Tian, M.; Wang, Y.; Liu, L.; Wei, J.; Xue, F.; Liu, G.; Zhang, X.; et al. A ratiometric fluorescent probe for rapidly detecting bio-thiols in vitro and in living cells. Dye. Pigment. 2019, 171, 107688. [Google Scholar] [CrossRef]
  33. Wang, X.-B.; Hao, X.; Zhang, D.; Jiang, Y. Reaction-based fluorescent turn-on probe for selective detection of thiophenols in aqueous solution and living cells. Dye. Pigment. 2017, 142, 167–174. [Google Scholar] [CrossRef]
  34. Jiang, W.; Cao, Y.; Liu, Y.; Wang, W. Rational design of a highly selective and sensitive fluorescent PET probe for discrimination of thiophenols and aliphatic thiols. Chem. Commun. 2010, 46, 1944. [Google Scholar] [CrossRef]
  35. Lan, M.; Wu, J.; Liu, W.; Zhang, H.; Zhang, W.; Zhuang, X.; Wang, P. Highly sensitive fluorescent probe for thiols based on combination of PET and ESIPT mechanisms. Sens. Actuators B Chem. 2011, 156, 332–337. [Google Scholar] [CrossRef]
  36. Liu, K.; Shang, H.; Kong, X.; Lin, W. A novel near-infrared fluorescent probe with a large Stokes shift for biothiol detection and application in in vitro and in vivo fluorescence imaging. J. Mater. Chem. B 2017, 5, 3836–3841. [Google Scholar] [CrossRef]
Scheme 1. Molecular structure of probe GP, detection mechanism and the corresponding reaction product GO.
Sensors 19 05348 sch001
Scheme 2. Synthesis procedure of probe GP.
Sensors 19 05348 sch002
Figure 1. Normalized fluorescent spectra of probe GP (10 μM) in PBS (pH = 7.4, 0.05 M): DMSO = 7:3 after adding different concentrations (0 μM–1000 μM) of GSH (a), Cys (b), or Hcy (c) and incubating the mixture at 37 °C for 60 min. Fluorescence intensity at 569 nm of a mixture containing 10 μM GP and biothiols changes as the concentration of biothiols (GSH or Cys or Hcy) increased gradually. (d) Ex = 370 nm.
Sensors 19 05348 g001
Figure 2. The normalized fluorescence intensity at 569 nm containing 10 μM GP and 1000 μM biothiols (GSH or Cys or Hcy) in PBS (pH = 7.4): DMSO (v:v = 7:3) mixed solvent change as the incubating time prolonged at 37 °C. Ex = 370 nm.
Sensors 19 05348 g002
Figure 3. Normalized fluorescent intensity of probe GP (10 μM) in PBS (pH = 7.4)/DMSO mixed solvent (v:v = 7:3) containing NEM and 1000 μM biothiols ((a): GSH, (b): Cys, (c): Hcy) changed as the concentration of NEM increased from 0 μM to 1000 μM. The fluorescence intensity of probe GP at 569 nm changed as the concentration of biothiols increased (d). Ex = 370 nm.
Sensors 19 05348 g003
Figure 4. Selectivity of GP to other amino acids or ions. Fluorescent spectra (a) were conducted after adding different 1000 μM amino acids or ions into the solution of probe GP (10 μM). The fluorescence intensity at 569 nm was plotted as the bar graph (b). 0–37 represent Blank, GSH, Hcy, Cys, H2S, BSA, Phe, Ala, Gly, Glu, Gln, Cystine, Arg, Lys, Tyr, Leu, Pro, Trp, Ser, Thr, Asn, His, Ca2+, Cu2+, Fe2+, K+, OH, Mg2+, Na+, HCO3, Cl, I, Br, NH4+, Sn2+, Zn2+, and PO43−, HPO42−. Different amino acids and ions were added into the solution of GP in PBS (pH = 7.4)/DMSO (7:3) and incubated in a 37 °C water bath for 60 min.
Sensors 19 05348 g004
Figure 5. Cell toxicity of probe GP to MDA-MB-231 cells. Cells were incubated in cell culture fluid containing different concentrations (range from 0 μM to 100 μM) of probe GP at 37 °C for 24 h. The cell viability was tested via the MTT method.
Sensors 19 05348 g005
Figure 6. Confocal Laser Scanning Microscopy (CLSM) images of MDA-MB-231 cells incubated in PBS (pH = 7.4) containing 10 μM GP (a1a3) for 30 min. MDA-MB-231 cells were pretreated with 100 μM GSH (b1b3) or 1 mM NEM (c1c3) for 30 min firstly and incubated in PBS containing 10 μM GP for 30 min. (a1,b1,c1): Fluorescent channel (570 nm ± 30 nm); (a2,b2,c2): Bright field; (a3,b3,c3): Overlay images of fluorescent channel and bright field. Ex = 405 nm; Scale bar = 10 μm.
Sensors 19 05348 g006

