
3D-Printed Load Cell Using Nanocarbon Composite Strain Sensor


Abstract
:1. Introduction
2. 3D Printed Load Cell Design and Fabrication
2.1. 3D Printed Load Cell Design
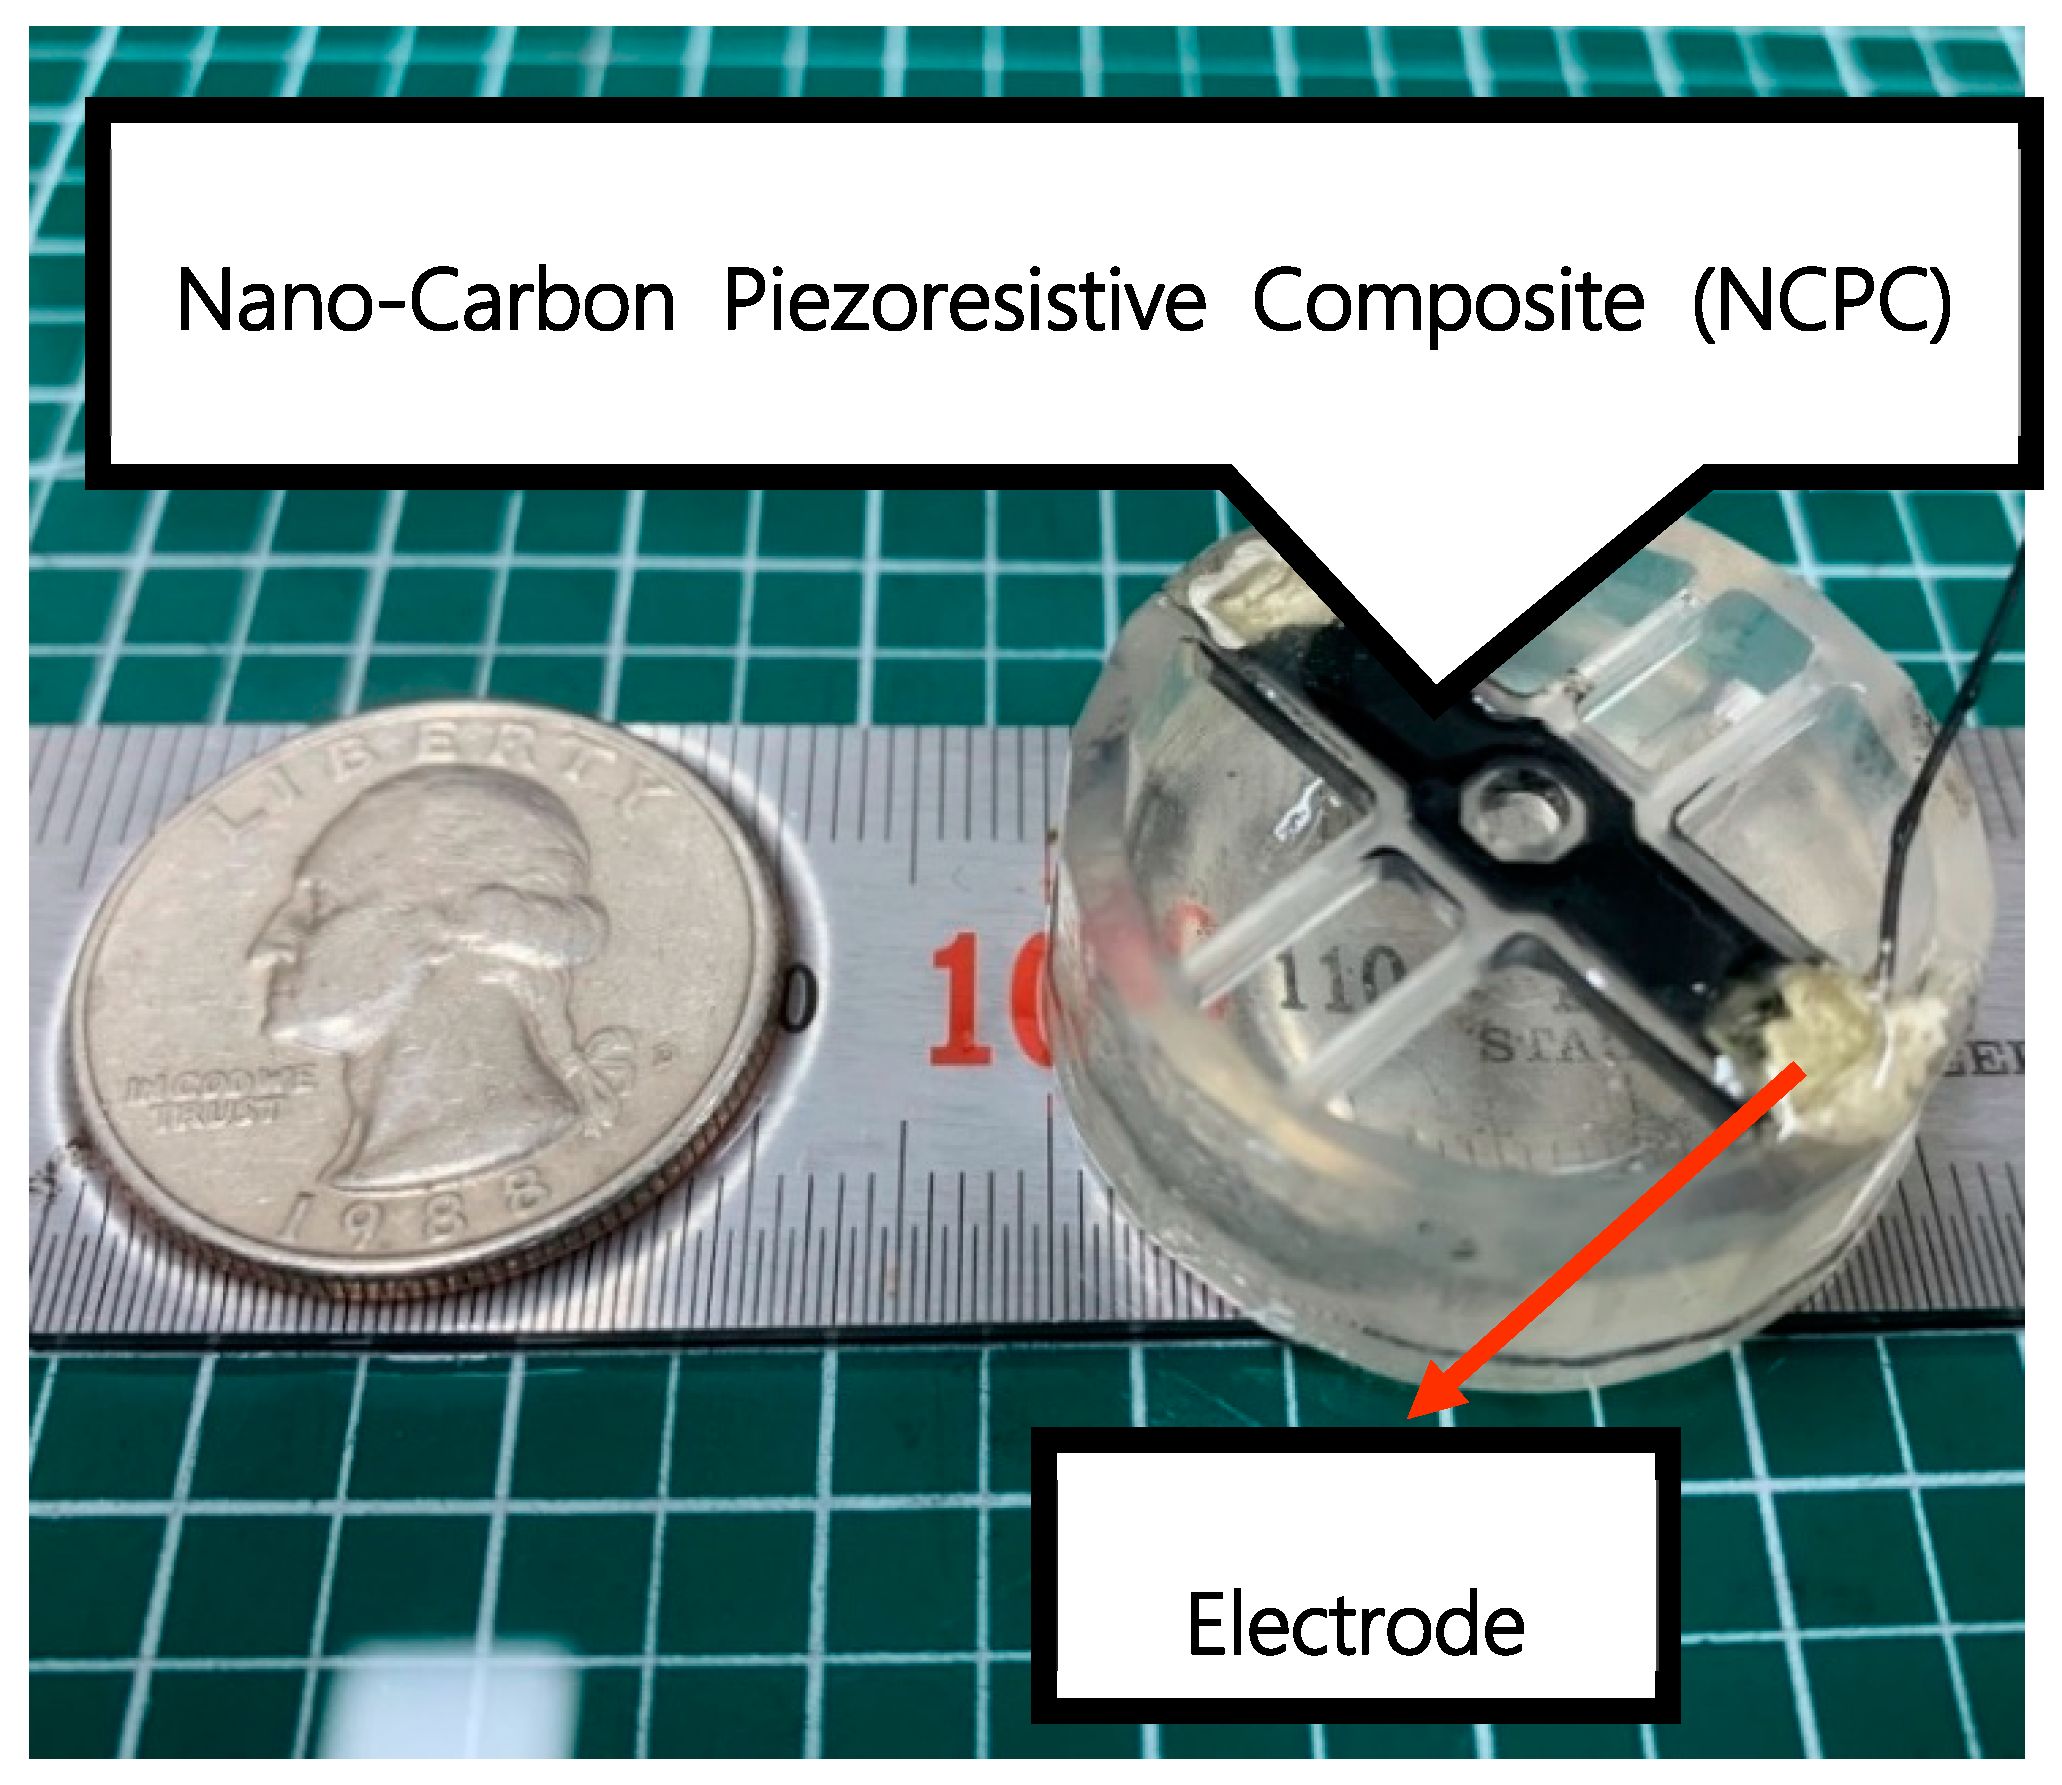
2.2. Load Cell Fabrication Using 3D Printing Process
3. Experimental 3D-Printed Load Cell Sensing Characteristics
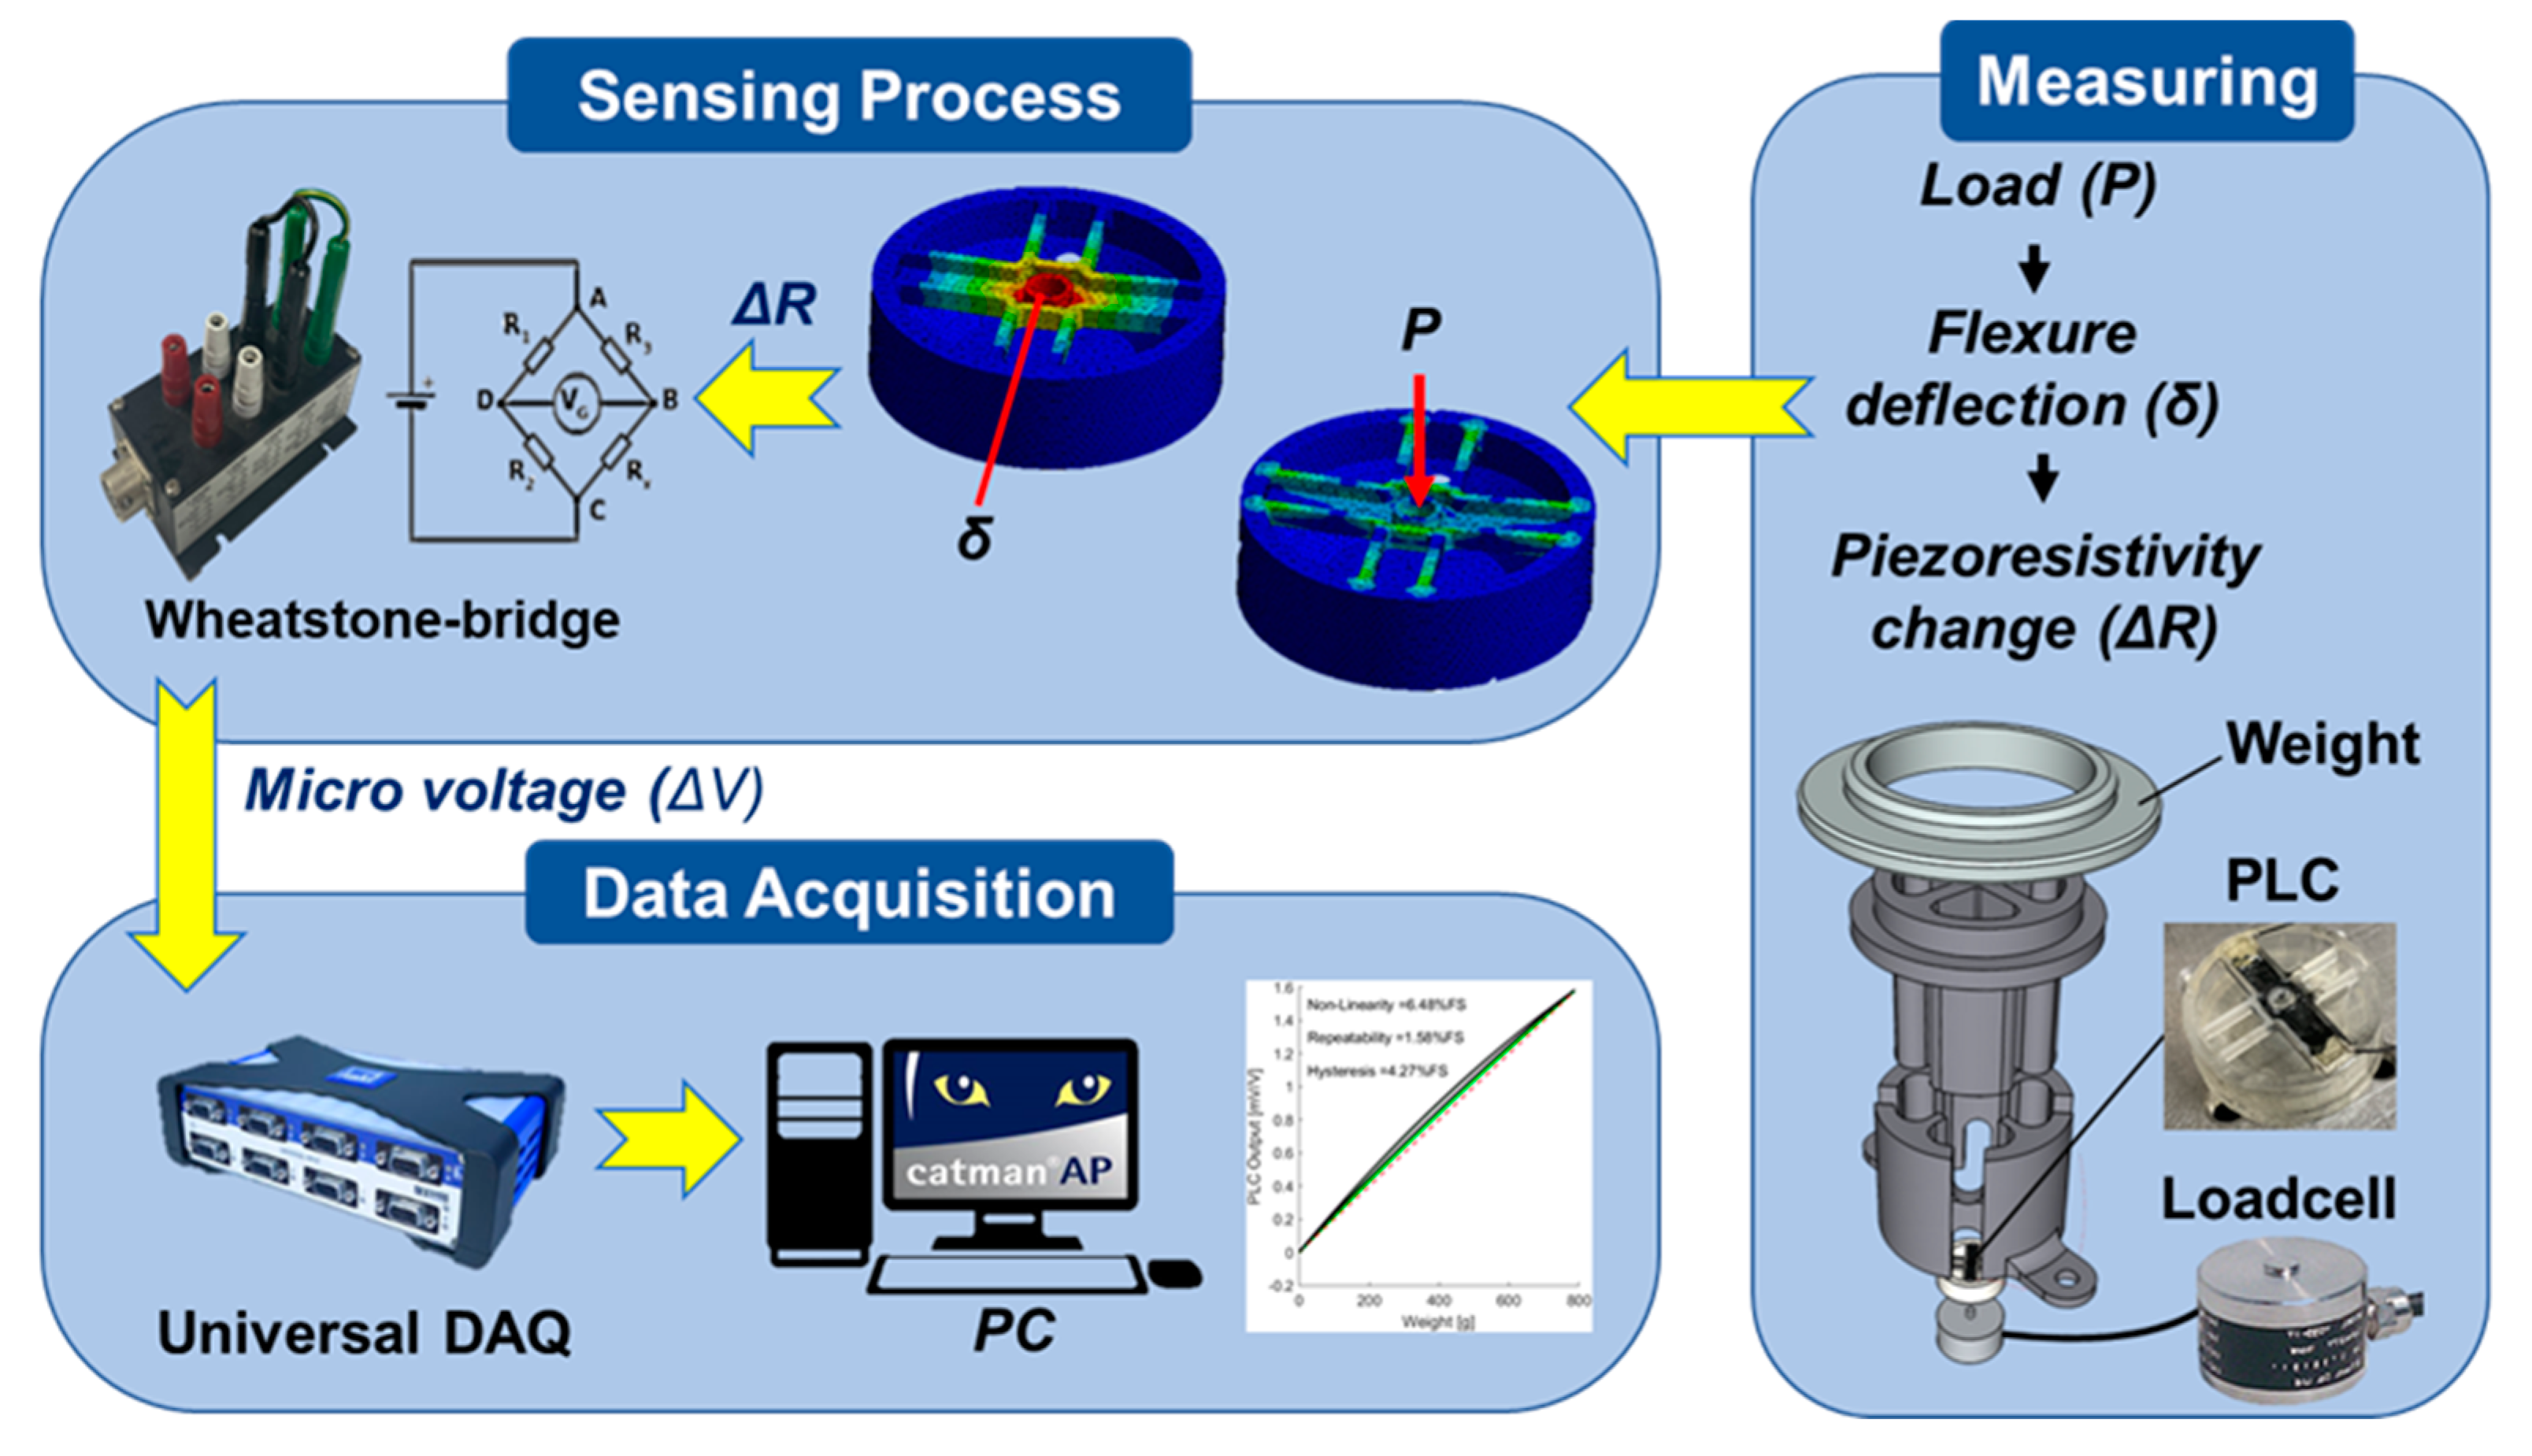
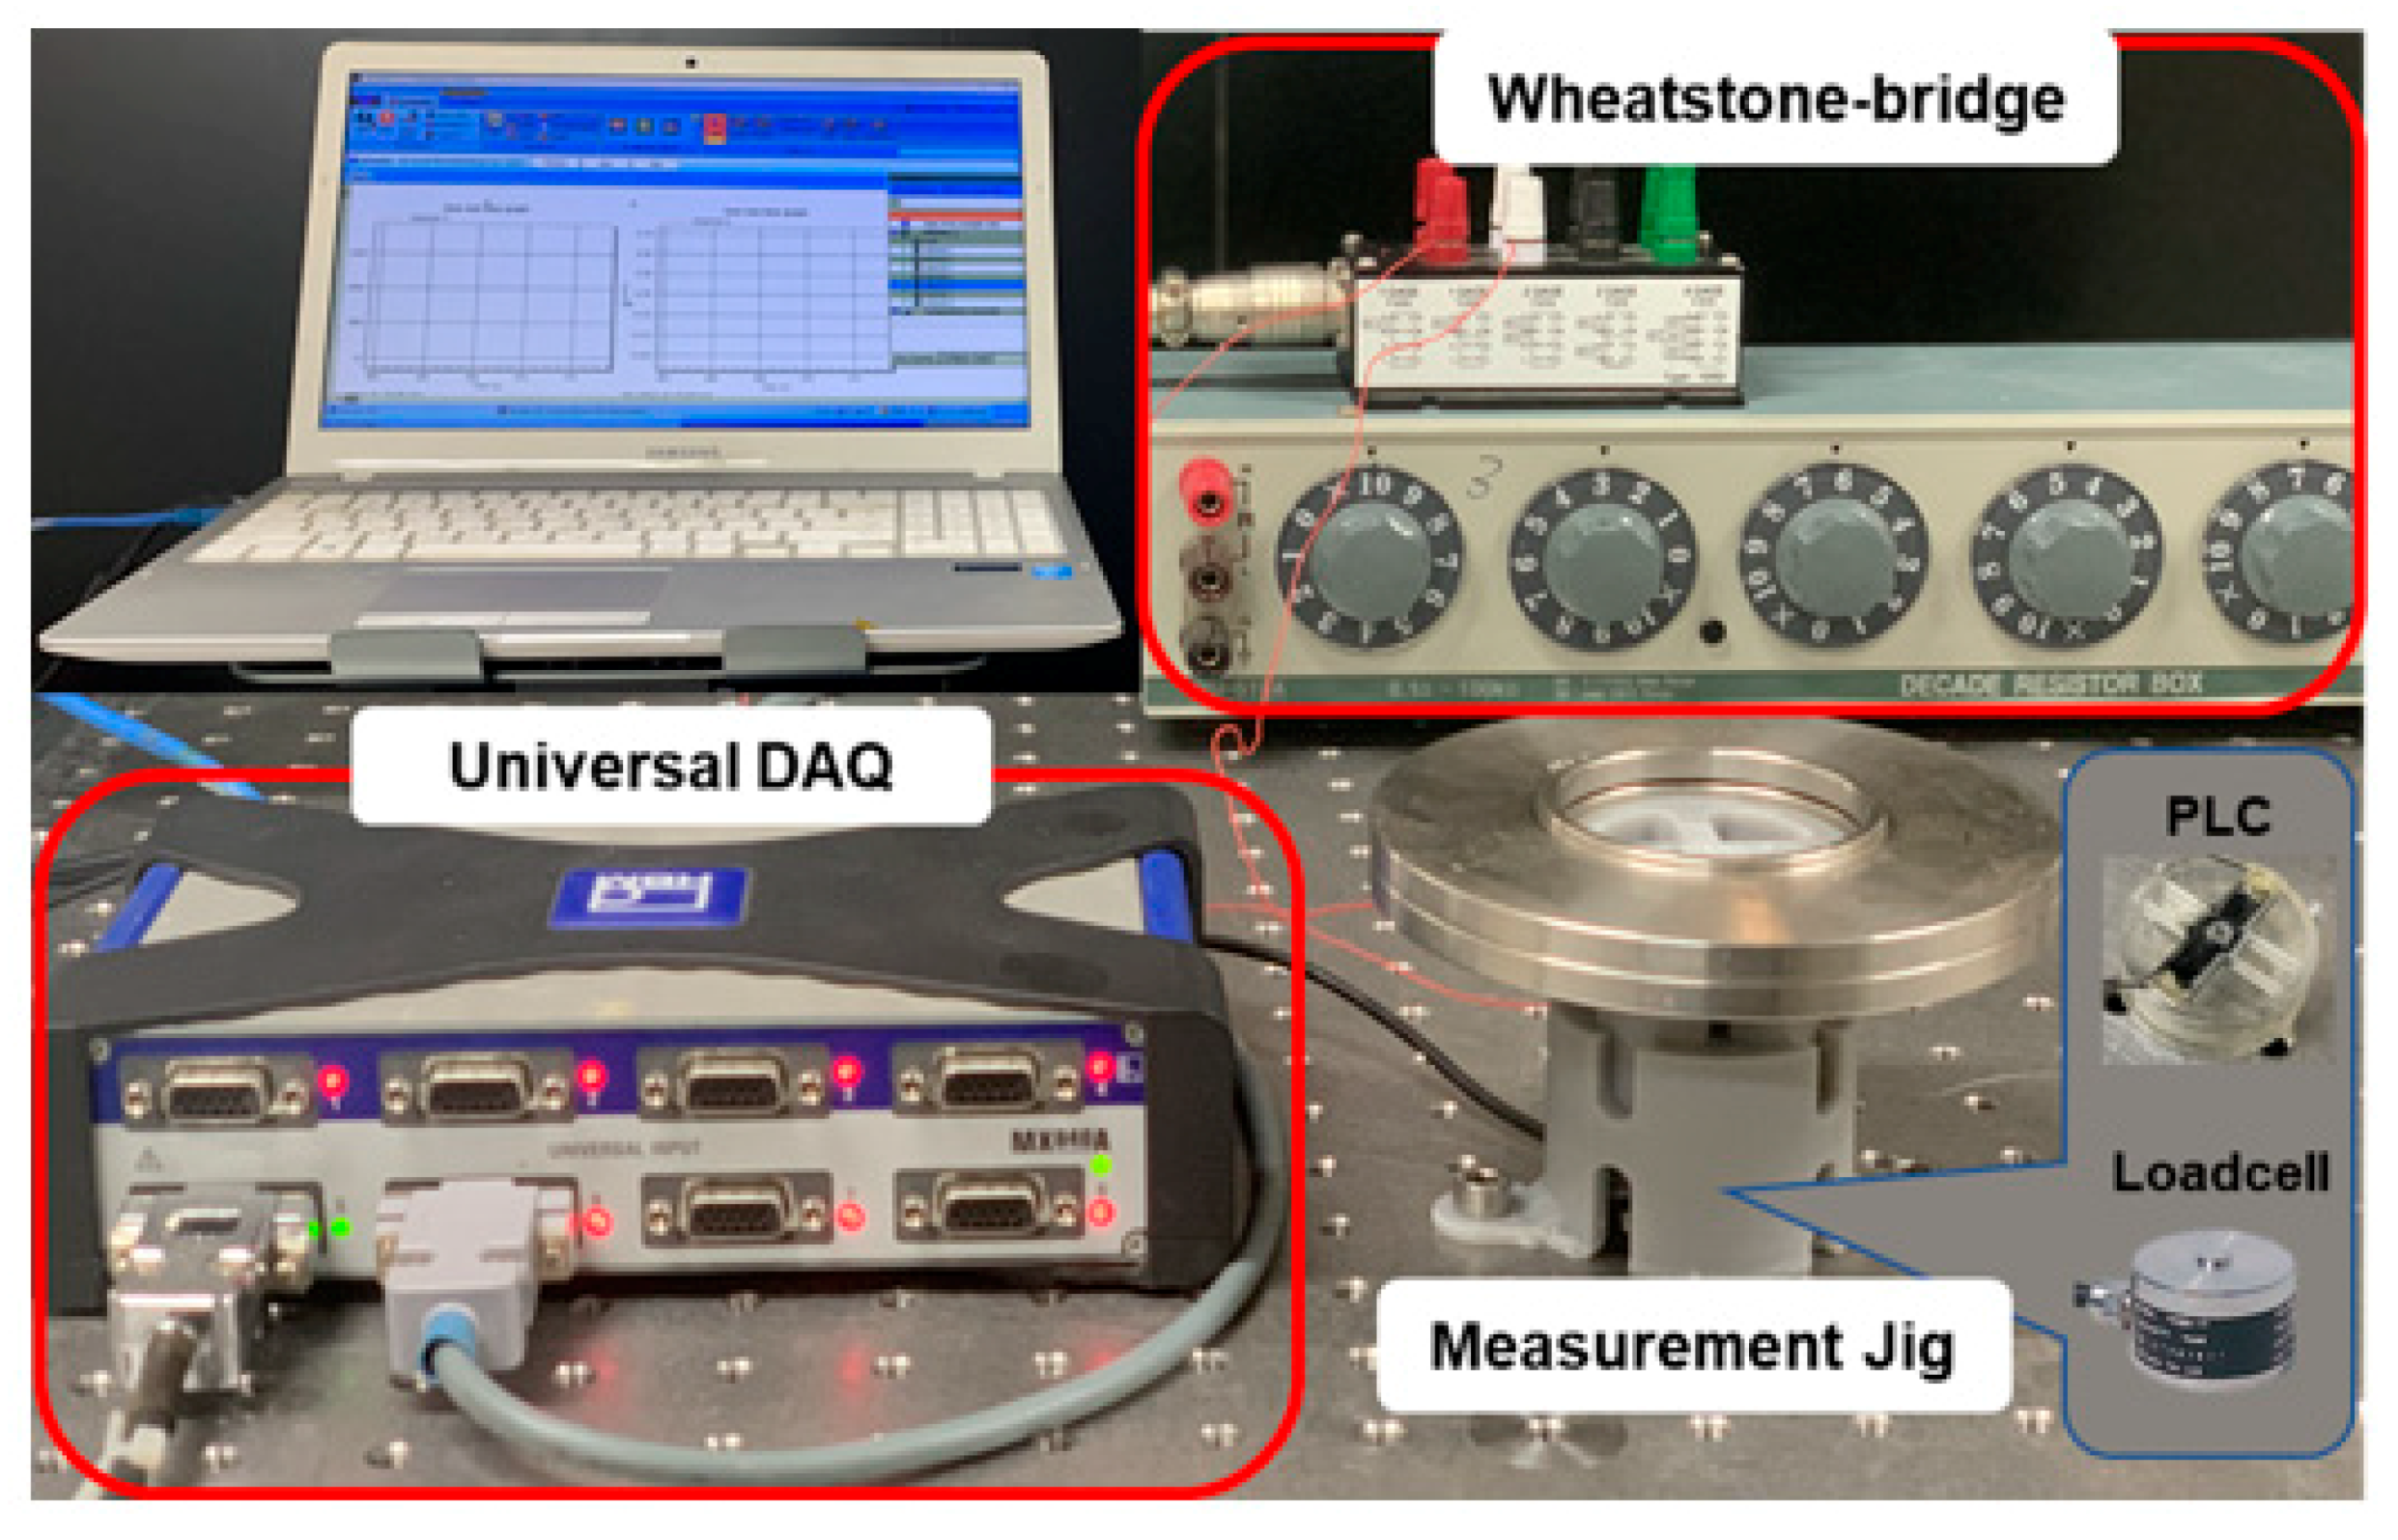
3.1. Experimental Setup
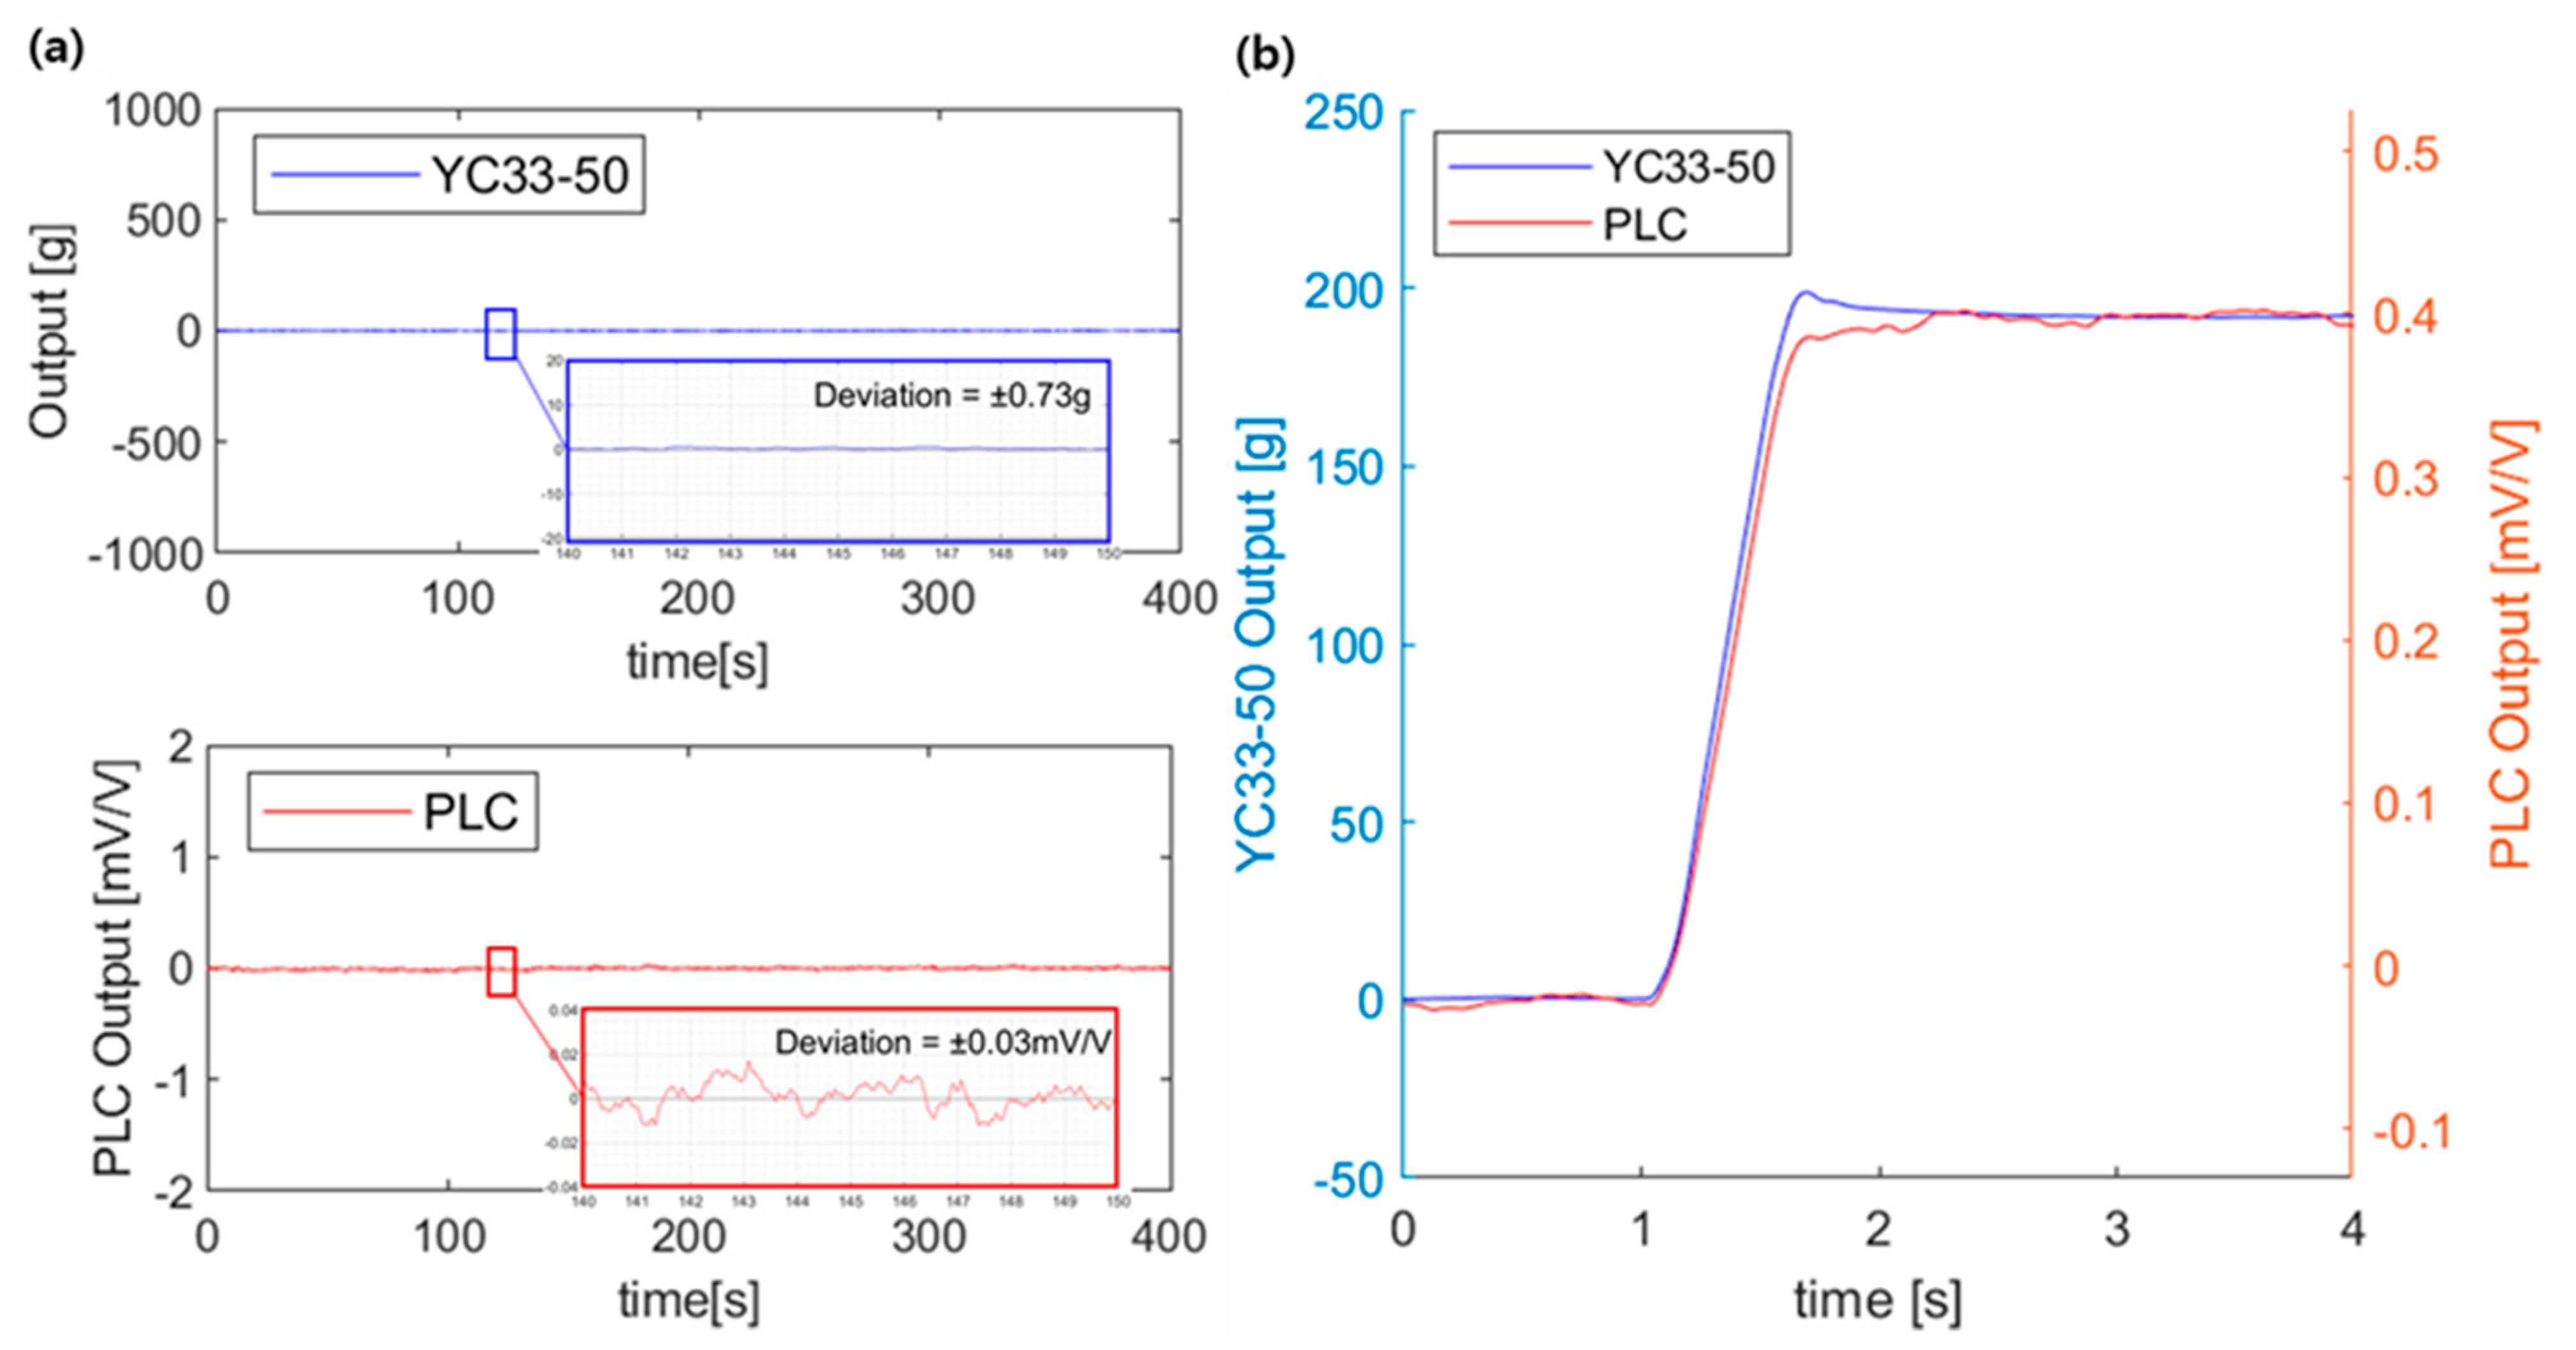
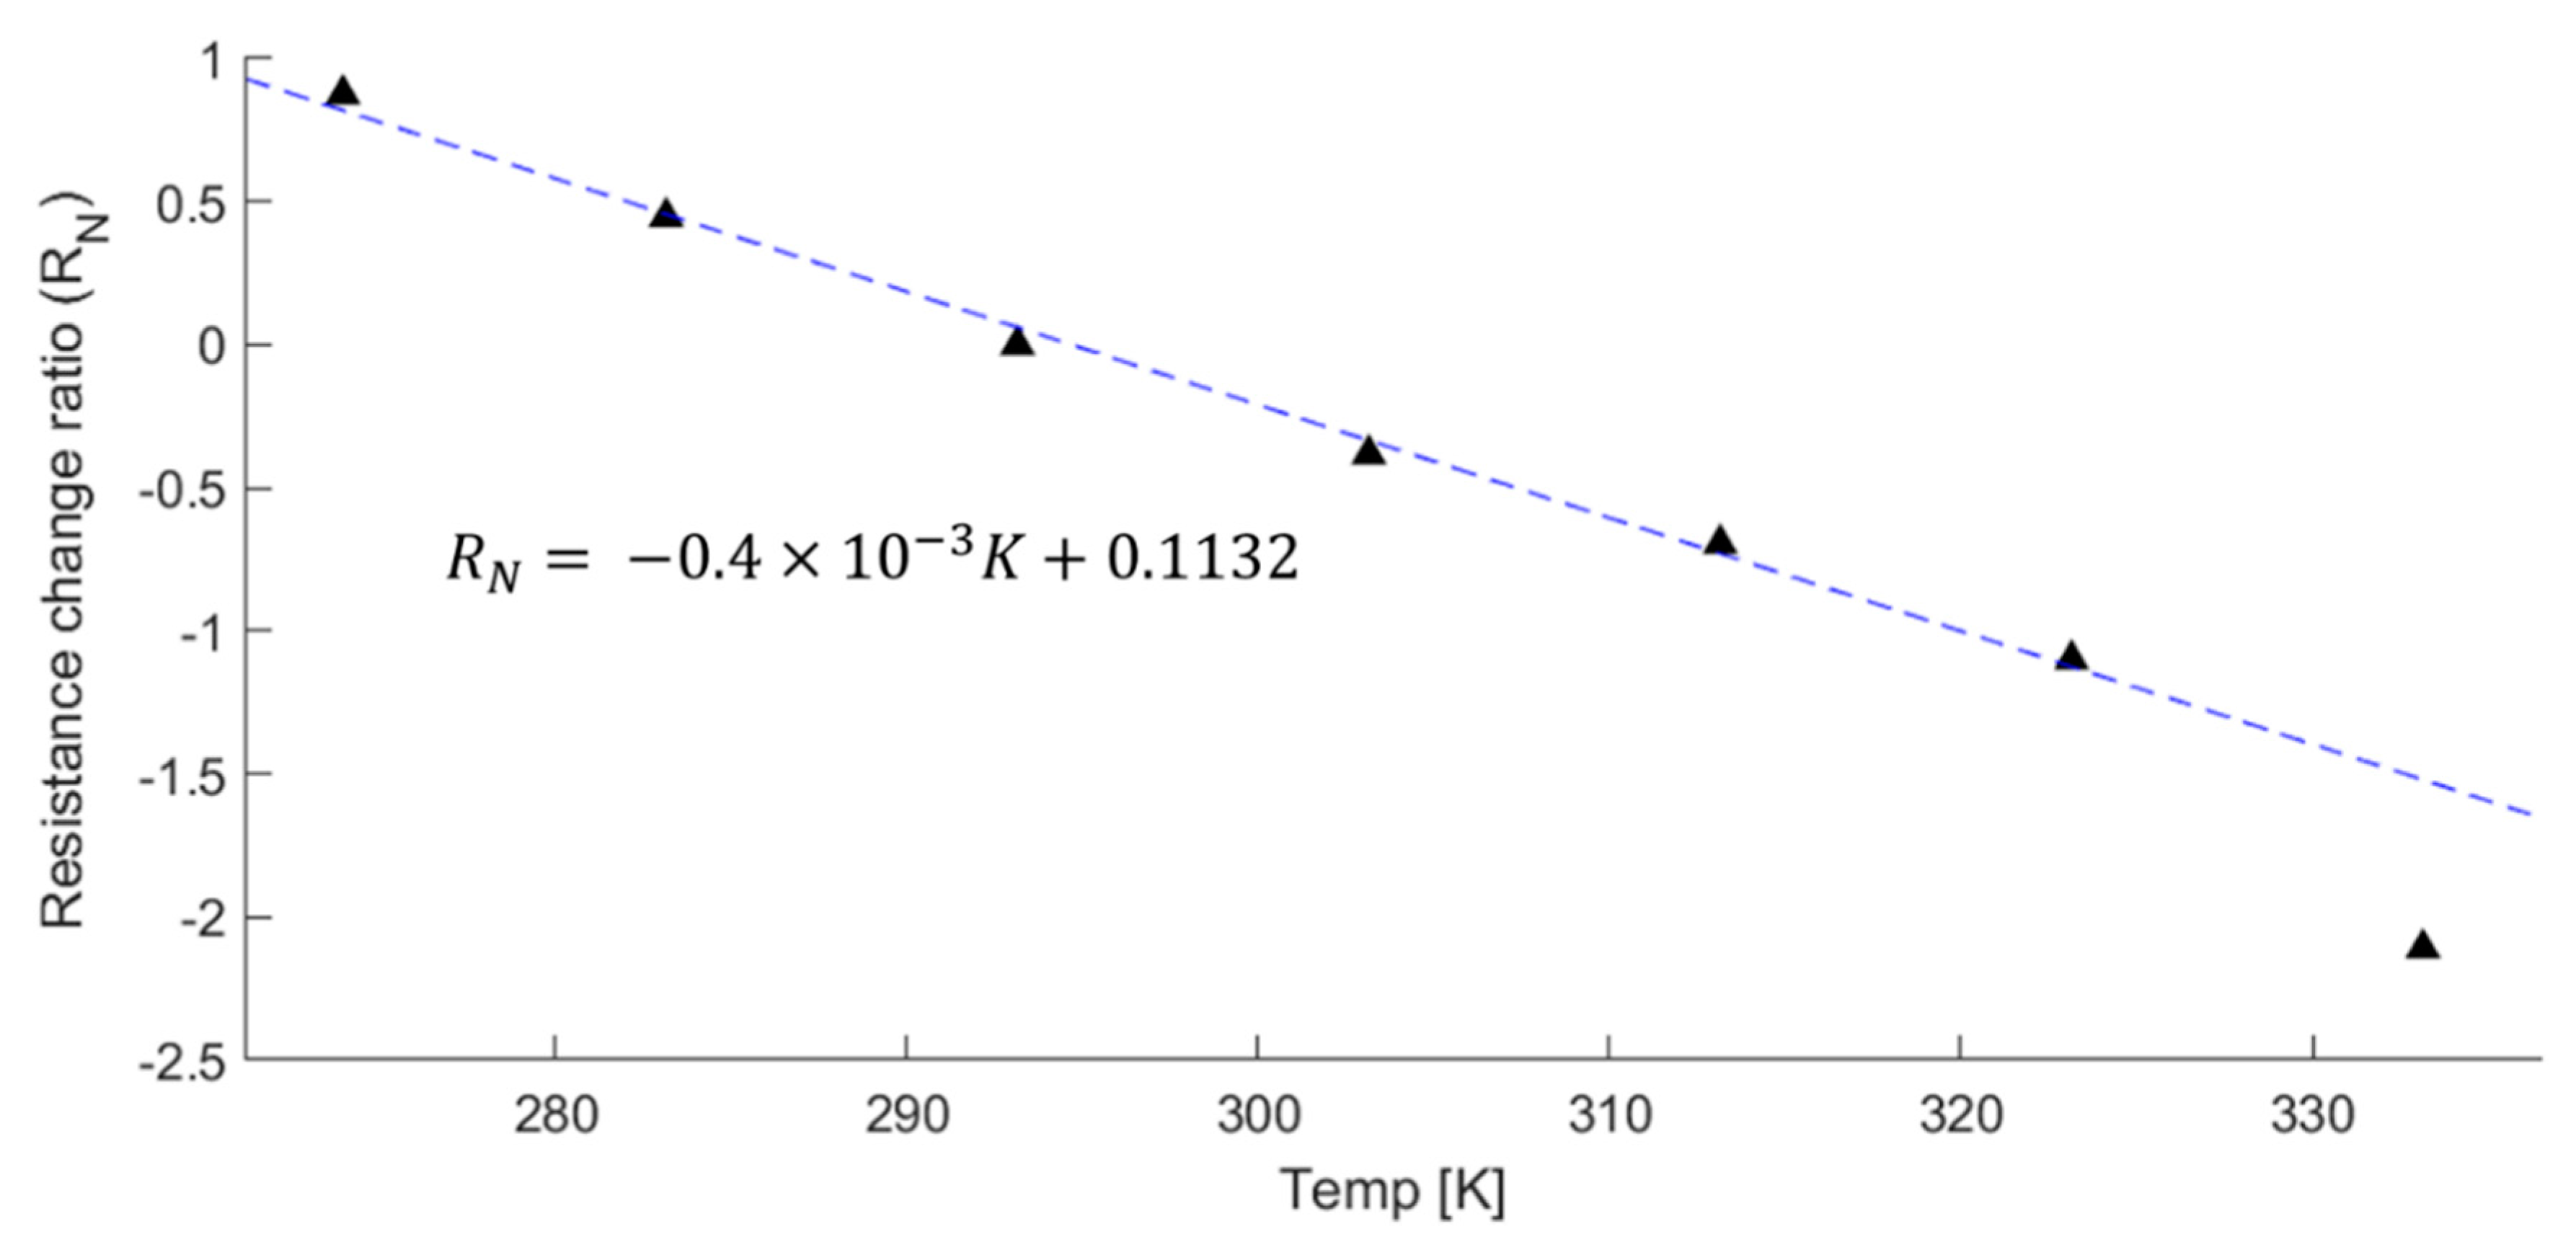
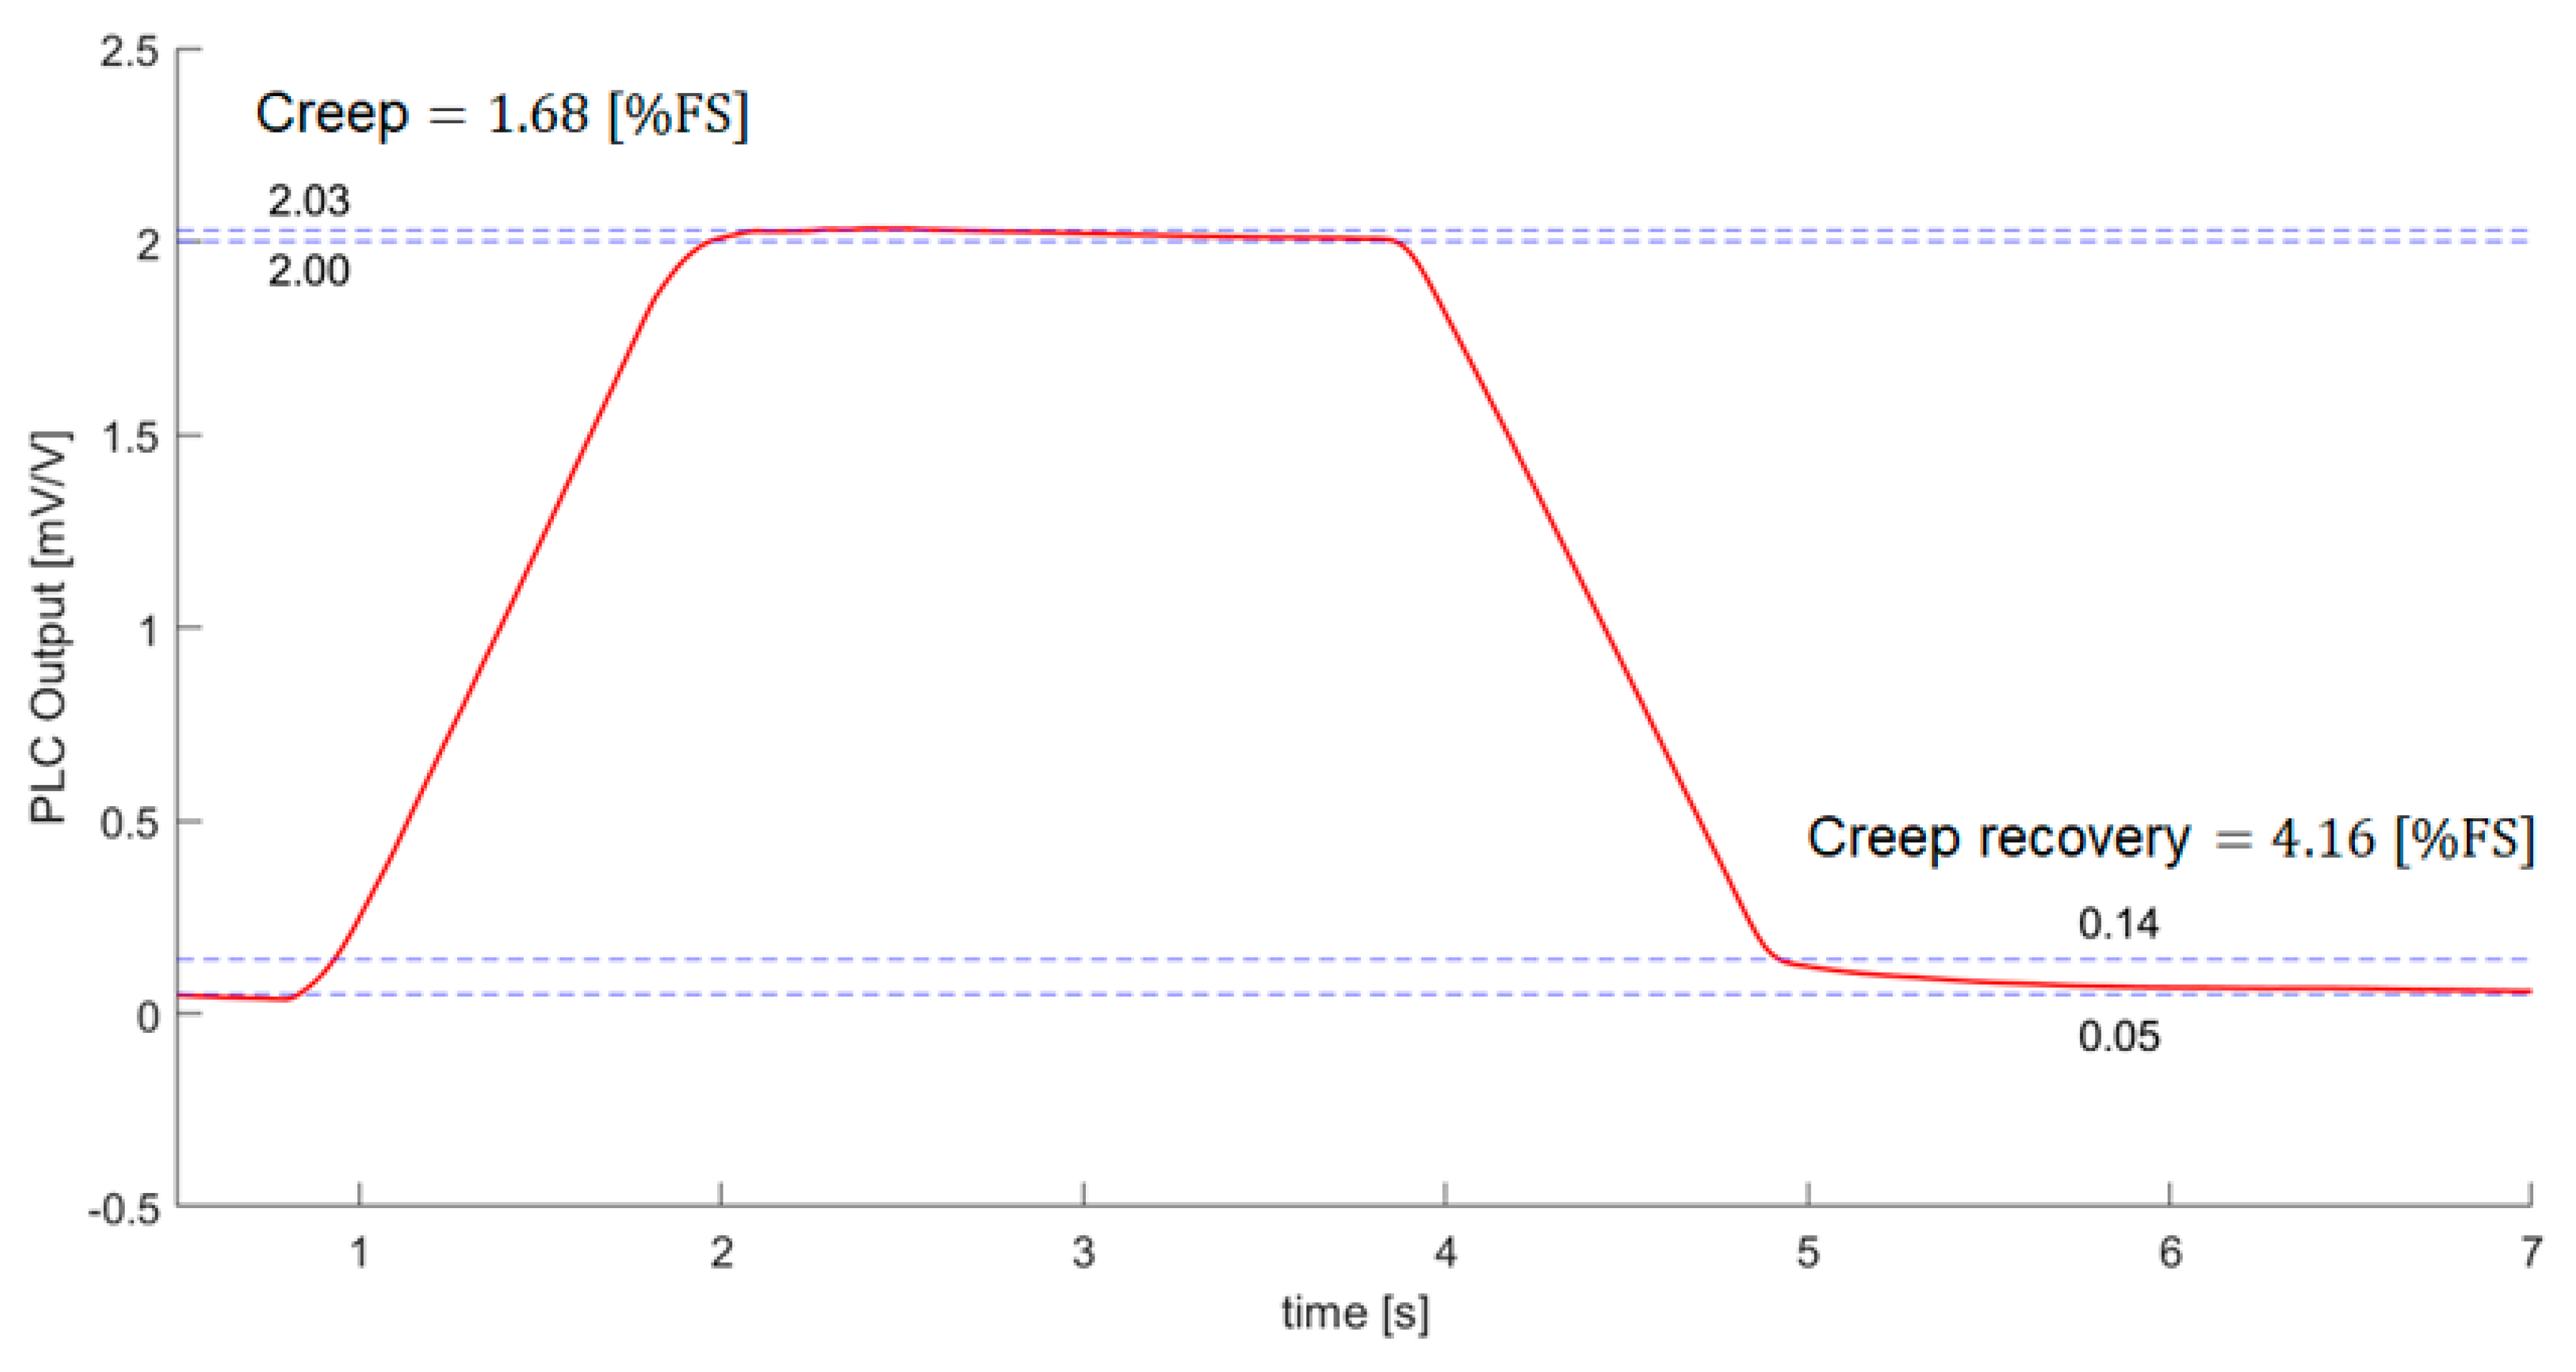
3.2. 3D PLC Sensing Characteristics
4. Conclusions
Author Contributions
Funding
Institutional Review Board Statement
Informed Consent Statement
Data Availability Statement
Conflicts of Interest
References
- PCB Load & Torque Division. Load Cell Handbook: A Technical Overview and Selection Guide, 1st ed.; PCB: Depew, NY, USA, 2014; p. 4. [Google Scholar]
- OMEGA. Available online: https://kr.omega.com/prodinfo/loadcells.Html (accessed on 15 March 2021).
- Higson, G.R. Recent Advances in Strain Gauges. J. Sci. Instrum. 1964, 41, 405–414. [Google Scholar] [CrossRef]
- Yang, S.; Lu, N. Gauge Factor and Stretchability of Silicon-on-Polymer Strain Gauges. Sensors 2013, 13, 8577–8594. [Google Scholar] [CrossRef] [Green Version]
- Mangayil, R.; Rajala, S.; Pammo, A.; Sarlin, E.; Luo, J.; Santala, V.; Karp, M.; Tuukkanen, S. Engineering and Characterization of Bacterial Nanocellulose Films as Low Cost and Flexible Sensor Material. ACS Appl. Mater. Interfaces 2017, 9, 19048–19056. [Google Scholar] [CrossRef] [PubMed]
- Lim, H.-R.; Kim, H.-S.; Qazi, R.; Kwon, Y.-T.; Jeong, J.W.; Yeo, W.-H. Advanced Soft Materials, Sensor Integrations, and Applications of Wearable Flexible Hybrid Electronics in Healthcare, Energy, and Environment. Adv. Mater. 2019, 32, 1901924. [Google Scholar] [CrossRef] [PubMed]
- Pan, S.; Pei, Z.; Jing, Z.; Song, J.; Zhang, W.; Zhang, Q.; Sang, S. A Highly Stretchable Strain Sensor Based on CNT/graphene/Fullerene-SEBS. RSC Adv. 2020, 10, 11225–11232. [Google Scholar] [CrossRef] [Green Version]
- Ali, A.; Ali, F.; Irfan, M.; Muhammad, F.; Glowacz, A.; Antonino-Daviu, J.A.; Caesarendra, W.; Qamar, S. Mechanical Pressure Characterization of CNT-Graphene Composite Material. Micromachines 2020, 11, 1000. [Google Scholar] [CrossRef]
- Sheng, N.; Ji, P.; Zhang, M.; Wu, Z.; Liang, Q.; Chen, S.; Wang, H. High Sensitivity Polyurethane-Based Fiber Strain Sensor with Porous Structure via Incorporation of Bacterial Cellulose Nanofibers. Adv. Electron. Mater. 2021, 7, 2001235. [Google Scholar] [CrossRef]
- Kang, I.; Schulz, M.J.; Kim, J.H.; Shanov, V.; Shi, D. A Carbon Nanotube Strain Sensor for Structural Health Monitoring. Smart Mater. Struct. 2006, 15, 737–748. [Google Scholar] [CrossRef]
- Salvado, R.; Lopes, C.; Szojda, L.; Araujo, P.; Gorski, M.; Velez, F.J.; Castro-Gomes, J.; Krzywon, R. Carbon Fiber Epoxy Composites for Both Strengthening and Health Monitoring of Structures. Sensors 2015, 15, 10753–10770. [Google Scholar] [CrossRef] [Green Version]
- Hu, N.; Itoi, T.; Akagi, T.; Kojima, T.; Xue, J.; Yan, C.; Atobe, S.; Fukunaga, H.; Yuan, W.; Ning, H.; et al. Alamusi Ultrasensitive Strain Sensors Made from Metal-Coated Carbon nanofiller/Epoxy Composites. Carbon 2013, 51, 202–212. [Google Scholar] [CrossRef] [Green Version]
- Ferreira, A.; Mendez, S.L. Piezoresistive Response of Spray-Printed Carbon nanotube/Poly(vinylidene Fluoride) Composites. Compos. Part B Eng. 2016, 96, 242–247. [Google Scholar] [CrossRef]
- Le, T.H.; Lee, D.H.; Kim, J.H.; Park, S.J. Polypyrrole/Graphene Quantum Dot Composites as a Sensor Media for Epinephrine. J. Nanosci. Nanotechnol. 2020, 20, 4005–4010. [Google Scholar] [CrossRef] [PubMed]
- Park, M.; Kim, H.; Youngblood, J.P. Strain-Dependent Electrical Resistance of Multi-Walled Carbon Nanotube/Polymer Composite Films. Nanotechnology 2008, 19, 5. [Google Scholar]
- Li, C.; Thostenson, E.T.; Chou, T.-W. Dominant Role of Tunneling Resistance in the Electrical Conductivity of Carbon nanotube–based Composites. Appl. Phys. Lett. 2007, 91, 223114. [Google Scholar] [CrossRef]
- Park, S.-H.; Hwang, J.; Park, G.-S.; Ha, J.-H.; Zhang, M.; Kim, D.; Yun, D.-J.; Lee, S.; Lee, S.H. Modeling the Electrical Resistivity of Polymer Composites with Segregated Structures. Nat. Commun. 2019, 10, 1–11. [Google Scholar] [CrossRef] [Green Version]
- Choi, G.; Lee, J.W.; Cha, J.Y.; Kim, Y.-J.; Choi, Y.-S.; Schulz, M.J.; Moon, C.K.; Lim, K.T.; Kim, S.Y.; Kang, I. A Spray-On Carbon Nanotube Artificial Neuron Strain Sensor for Composite Structural Health Monitoring. Sensors 2016, 16, 1171. [Google Scholar] [CrossRef] [Green Version]
- Kim, S.Y.; Choi, B.G.; Baek, W.K.; Park, S.H.; Park, S.W.; Shin, J.W.; Kang, I. Impact Paint Sensor Based on Polymer/Multi-Dimension Carbon Nano Isotopes Composites. Smart Mater. Struct. 2019, 28, 035025. [Google Scholar] [CrossRef]
- Giovanni, P.; Gabriele, N.; Gianmarco, G.; Marinella, L.; Stefano, T. Conductive 3D Microstructures by Direct 3D Printing of polymer/Carbon Nanotube Nanocomposites via Liquid Deposition Modeling. Compos. Part A Appl. Sci. Manuf. 2015, 76, 110–114. [Google Scholar]
- Zhang, D.; Chi, B.; Li, B.; Gao, Z.; Du, Y.; Guo, J.; Wei, J. Fabrication of Highly Conductive Graphene Flexible Circuits by 3D Printing. Synth. Met. 2016, 217, 79–86. [Google Scholar] [CrossRef]
- John, M.H.; Godfrey, S.; Kim, J.W.; Roberto, J.C.; Russel, A.W.; Christopher, J.S.; Brian, W.G.; Dennis, C.W.; Emilie, J.S. 3-D Printing of Multifunctional Carbon Nanotube Yarn Reinforced Components. Addit. Manuf. 2016, 12, 38–44. [Google Scholar]
- Rafael, M.C.; Cristiane, K.; Raquel, G.R.; Pãmyla, L.S.; Diego, P.R.; Paulo, R.O.; Bruno, C.J.; Juliano, A.B.; Eduardo, M.R.; Rodrigo, A.A.M. Additive-Manufactured (3D-Printed) Electrochemical Sensors: A Critical Review. Anal. Chim. Acta 2020, 29, 73–91. [Google Scholar]
- Kim, K.; Park, J.; Suh, J.-H.; Kim, M.; Jeong, Y.; Park, I. 3D printing of multiaxial force sensors using carbon nanotube (CNT)/thermoplastic polyurethane (TPU) filaments. Sens. Actuators A Phys. 2017, 263, 493–500. [Google Scholar] [CrossRef]
- Christ, J.F.; Aliheidari, N.; Pötschke, P.; Ameli, A. Bidirectional and Stretchable Piezoresistive Sensors Enabled by Multimaterial 3D Printing of Carbon Nanotube/Thermoplastic Polyurethane Nanocomposites. Polymers 2018, 11, 11. [Google Scholar] [CrossRef] [PubMed] [Green Version]
- Al-Rubaiai, M.K.; Tsuruta, R.; Gandhi, U.; Wang, C.; Tan, X. A 3D-Printed Stretchable Strain Sensor for Wind Sensing. Smart Mater. Struct. 2019, 28, 084001. [Google Scholar] [CrossRef]
- Stano, G.; Nisio, A.D.; Lanzolla, A.; Percoco, G. Additive Manufacturing and Characterization of a Load Cell with Embedded Strain Gauges. Precis. Eng. 2020, 62, 113–120. [Google Scholar] [CrossRef]
- Qu, J.; Wu, Q.; Clancy, T.; Fan, Q.; Wang, X.; Liu, X. 3D-Printed Strain-Gauge Micro Force Sensors. IEEE Sens. J. 2020, 20, 6971–6978. [Google Scholar] [CrossRef]
- Kim, S.Y.; Kang, I. A Study on the Development of a Novel Pressure Sensor Based on Nano Carbon Piezoresistive Composite by Using 3D Printing. Trans. Korean Soc. Mech. Eng. A 2017, 41, 187–192. [Google Scholar]
- 4thwave. Available online: https://4thwave3d.com/product/Resin/ (accessed on 23 May 2021).
- Kordas, K.; Mustonen, T.; Toth, G.; Jantunen, H.; Lajunen, M.; Soldano, C.; Talapatra, S.; Kar, S.; Vajtai, R.; Ajayan, P.M.; et al. Inkjet Printing of Electrically Conductive Patterns of Carbon Nanotubes. Small 2006, 2, 1021–1025. [Google Scholar] [CrossRef] [PubMed]
- Christ, J.F.; Aliheidari, N.; Ameli, A.; Pötschke, P. 3D Printed Highly Elastic Strain Sensors of Multiwalled Carbon Nano-tube/Thermoplastic Polyurethane Nanocomposites. Mater. Des. 2017, 131, 394–401. [Google Scholar] [CrossRef]
- Oliveri, A.; Maselli, M.; Lodi, M.; Storace, M.; Cianchetti, M. Model-Based Compensation of Rate-Dependent Hysteresis in a Piezoresistive Strain Sensor. IEEE Trans. Ind. Electron. 2018, 66, 8205–8213. [Google Scholar] [CrossRef]
- Dehghani, S.; Moravvej-Farshi, M.K.; Sheikhi, M.H. Temperature Dependence of Electrical Resistance of Individual Carbon Nanotubes and Carbon Nanotubes Network. Mod. Phys. Lett. B 2012, 26, 1250136. [Google Scholar] [CrossRef]
- Neitzert, H.C.; Vertuccio, L.; Sorrentino, A. Epoxy/MWCNT Composite as Temperature Sensor and Electrical Heating Element. IEEE Trans. Nanotechnol. 2011, 10, 688–693. [Google Scholar] [CrossRef]
- International Organization of Legal Metrology. Metrological Regulation for Load Cells; OIML: Paris, France, 2000. [Google Scholar]


| Max. Load (kg) | Max. Deflection (mm) | Max. Strain (%) | Max. Stress (MPa) |
|---|---|---|---|
| 2 | 0.29 | 2 | 55 |
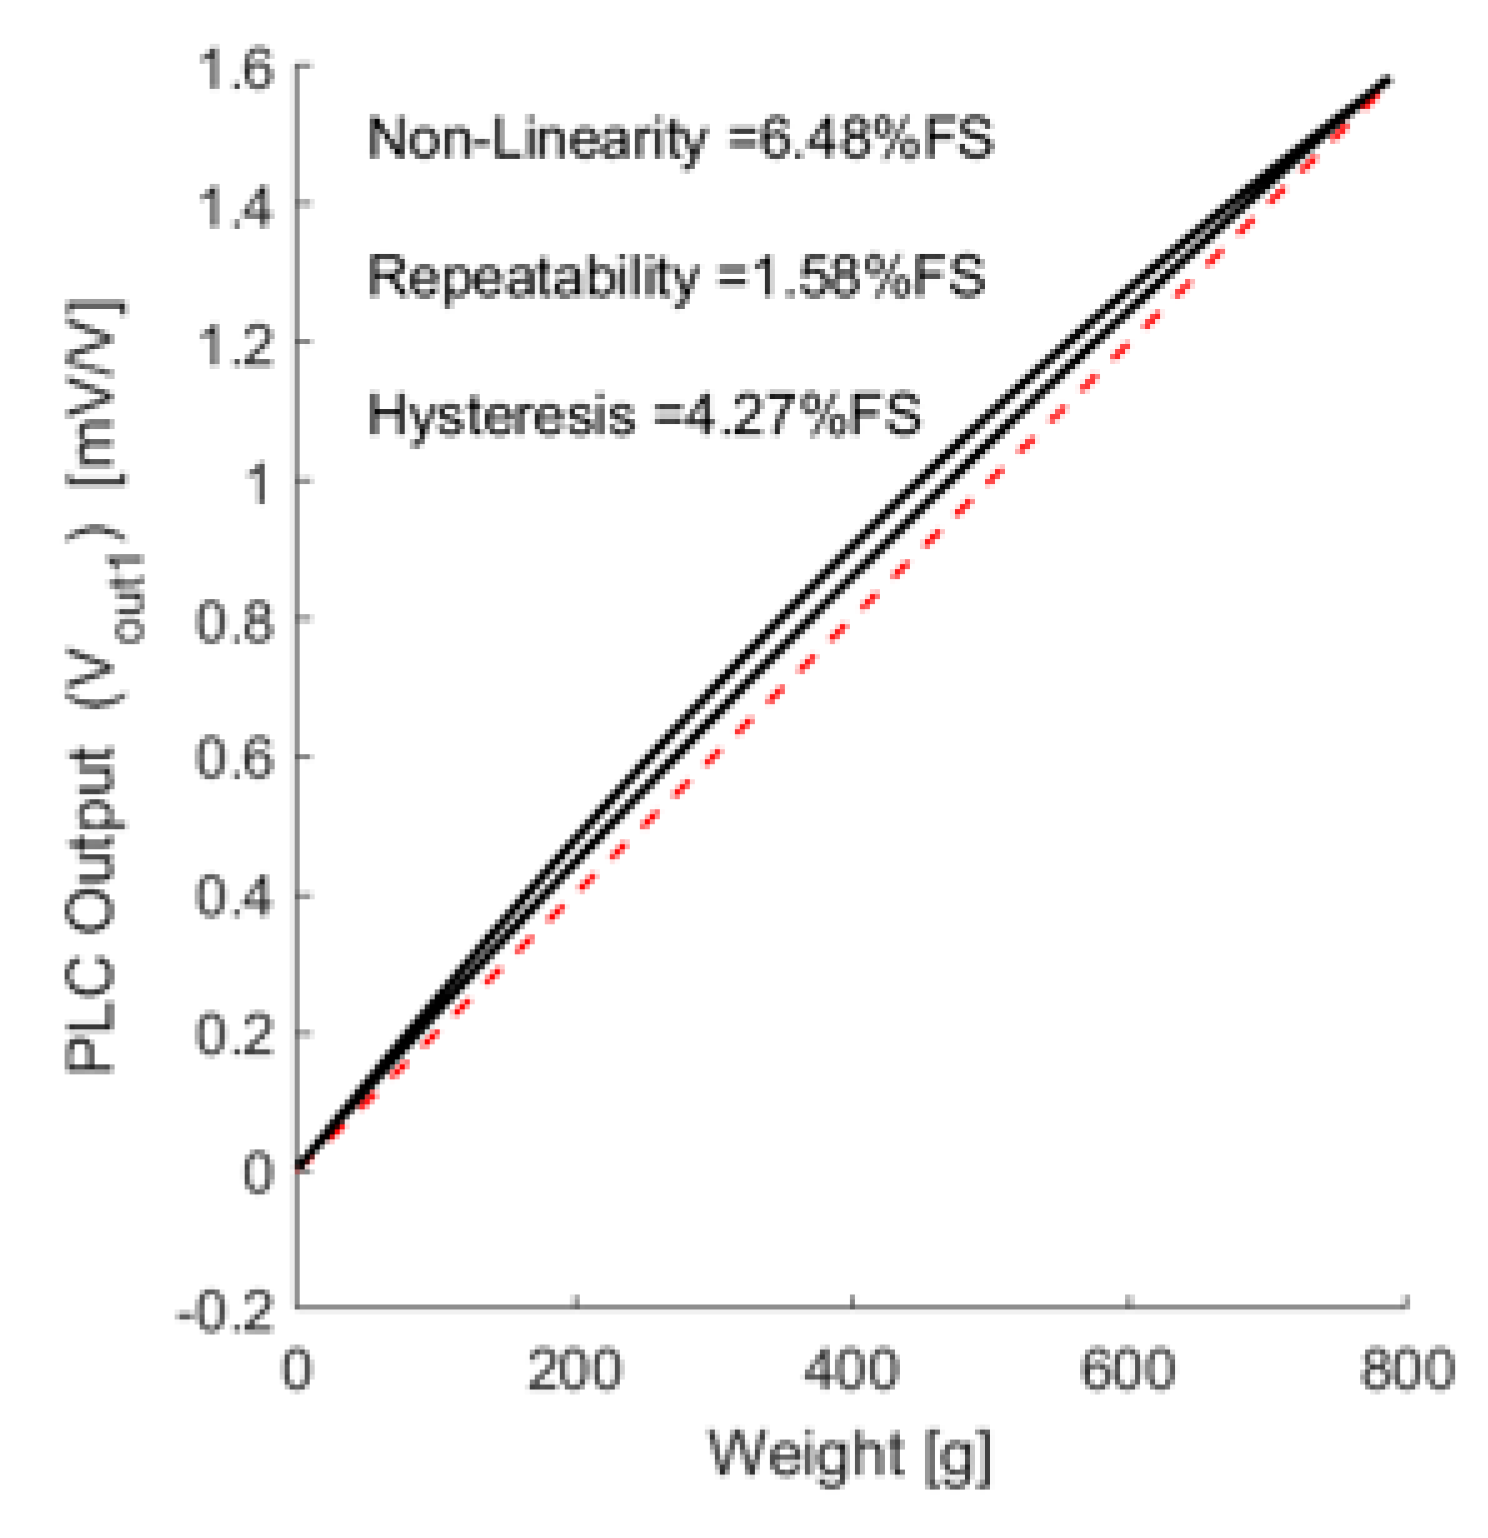
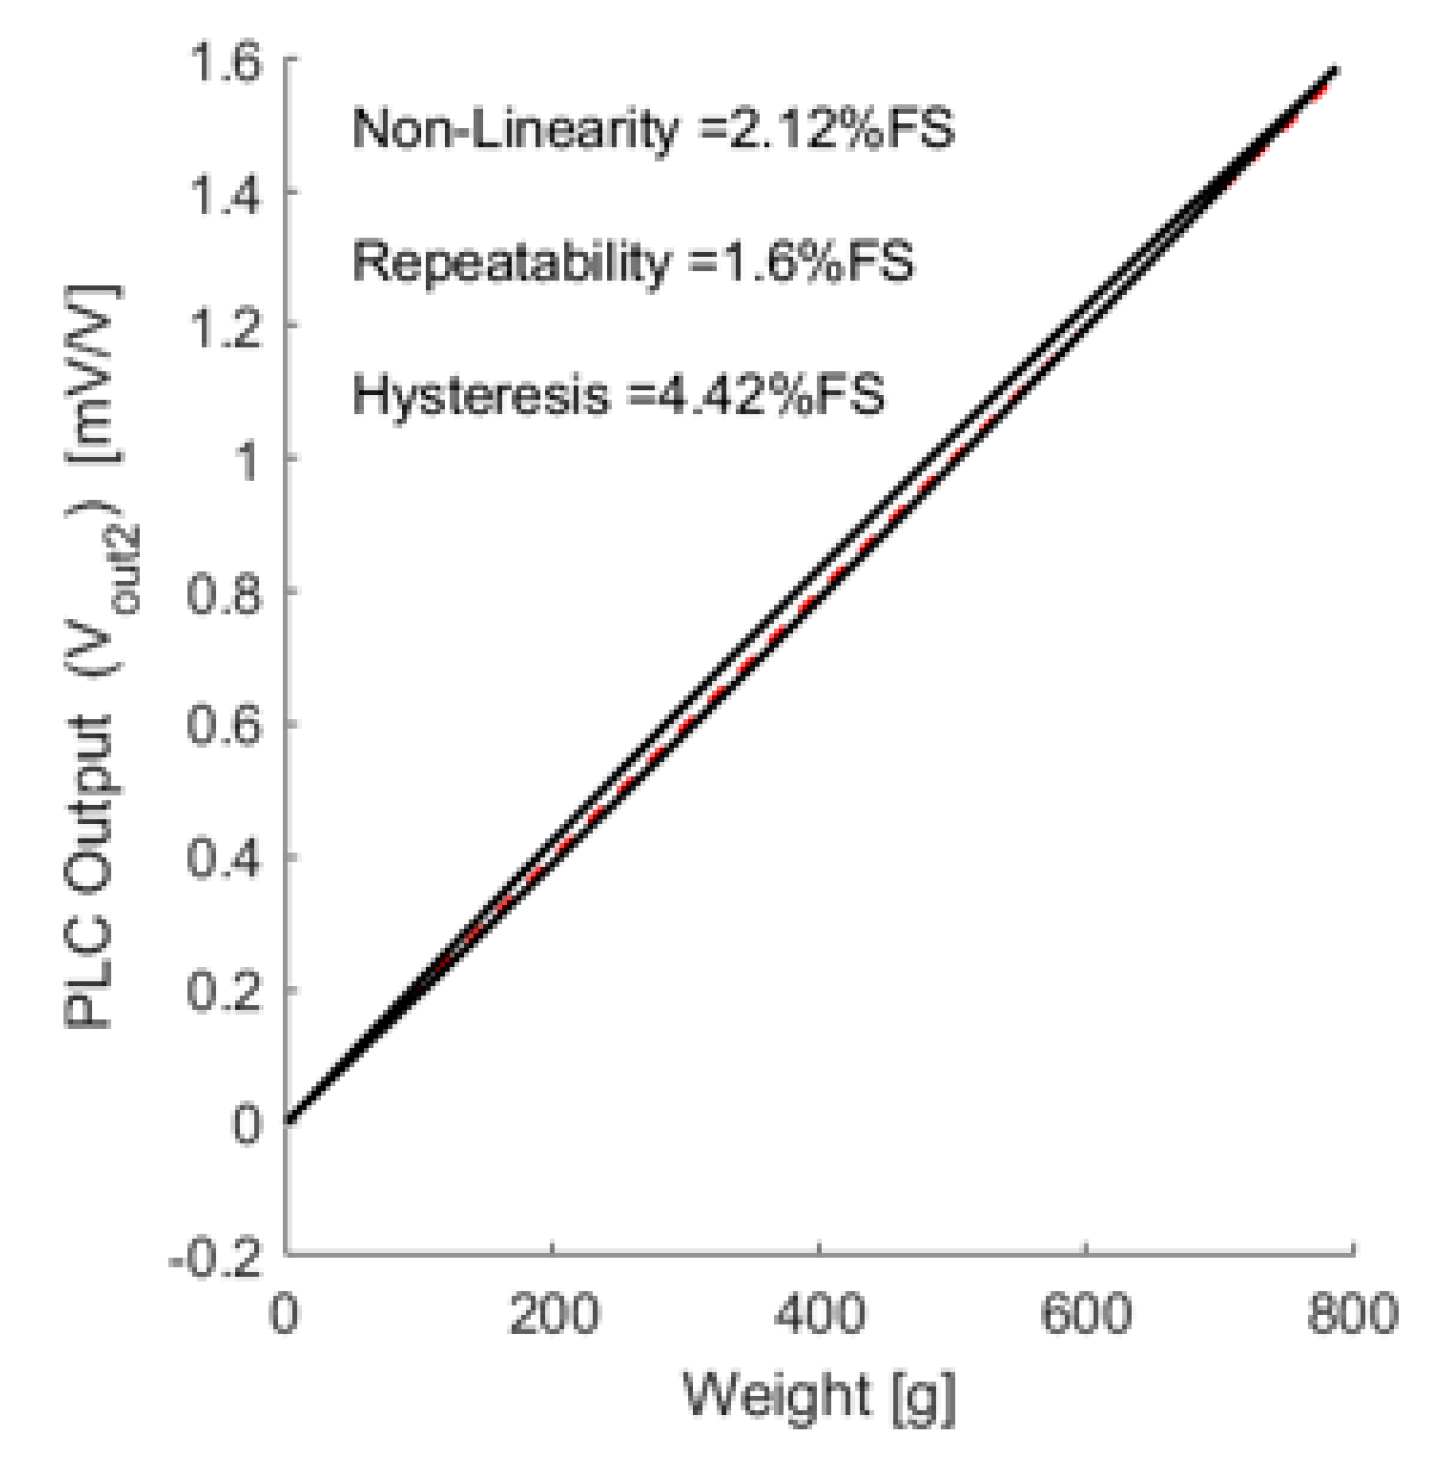
| Parameter | Non-Linearity [%] | Repeatability [%] | Hysteresis [%] |
|---|---|---|---|
| Evaluation (1st) | 6.48 | 1.58 | 4.27 |
| Evaluation (compensated) | 2.12 | 1.60 | 4.42 |
| Market requirement [1] | 0.25~1 | 0.1~0.5 | 0.25~1 |
Publisher’s Note: MDPI stays neutral with regard to jurisdictional claims in published maps and institutional affiliations. |
© 2021 by the authors. Licensee MDPI, Basel, Switzerland. This article is an open access article distributed under the terms and conditions of the Creative Commons Attribution (CC BY) license (https://creativecommons.org/licenses/by/4.0/).
Share and Cite
Joung, K.-Y.; Kim, S.-Y.; Kang, I.; Cho, S.-H. 3D-Printed Load Cell Using Nanocarbon Composite Strain Sensor. Sensors 2021, 21, 3675. https://doi.org/10.3390/s21113675
Joung K-Y, Kim S-Y, Kang I, Cho S-H. 3D-Printed Load Cell Using Nanocarbon Composite Strain Sensor. Sensors. 2021; 21(11):3675. https://doi.org/10.3390/s21113675
Chicago/Turabian StyleJoung, Kwan-Young, Sung-Yong Kim, Inpil Kang, and Sung-Ho Cho. 2021. "3D-Printed Load Cell Using Nanocarbon Composite Strain Sensor" Sensors 21, no. 11: 3675. https://doi.org/10.3390/s21113675