Abstract
The need to manufacture more competitive equipment, together with the emergence of the digital technologies from the so-called Industry 4.0, have changed many paradigms of the industrial sector. Presently, the trend has shifted to massively acquire operational data, which can be processed to extract really valuable information with the help of Machine Learning or Deep Learning techniques. As a result, classical Condition Monitoring methodologies, such as model- and signal-based ones are being overcome by data-driven approaches. Therefore, the current paper provides a review of these data-driven active supervision strategies implemented in electric drives for fault detection and diagnosis (FDD). Hence, first, an overview of the main FDD methods is presented. Then, some basic guidelines to implement the Machine Learning workflow on which most data-driven strategies are based, are explained. In addition, finally, the review of scientific articles related to the topic is provided, together with a discussion which tries to identify the main research gaps and opportunities.
1. Introduction
Research on Condition Monitoring (CM) and maintenance of electric drives has been a field of activity for decades. Generally, electric drives control software including algorithms, strategies, or routines aimed at actively monitoring their operation by supervising possible system faults. For this purpose, traditionally, model- and signal-based techniques have been used. The former method is based on an analytical redundancy generated by the mathematical model that replicates the operational behaviour of the system under investigation. The latter is based on the analysis of different signals acquired from the real system to identify specific characteristics that indicate anomalies in the equipment. Normally, most of the referred solutions were implemented as on-board or embedded routines in the control software application of the electric drive.
However, the recent advent of Industry 4.0 and the new digital technologies such as Big Data (BD), the Internet of Things (IoT), Cloud Computing (CC) and Artificial Intelligence (AI) have completely changed the paradigm for actively monitoring industrial equipment among which are electric traction systems. An example of the change in this paradigm is the emergent importance of operational data. Owing to the improvement of its availability and the different tools to manage it, presently really valuable information can be extracted from huge amount of datasets. That is why, in many different applications, data-driven strategies have been implemented in order to actively supervise industrial equipment. At the same time, it is important to mention that the aforementioned digital technologies are being offered more as a service than as a product. Therefore, it is no longer justified to increase the cost (memory and computational capacity) of an embedded traction control unit because its health management functionalities, when current AI, CC, and communication technologies allow remote data processing at a much lower cost and greater flexibility.
As an example related to those data-driven fault diagnosis approaches developed in electric drives, some manufacturers already have different IoT-, Cloud-, and Big Data-based health management platforms in the market. Table 1 summarizes the aforementioned main digital platforms in the electric drive sector.

Table 1.
Cloud-based monitoring platforms for maintenance in electric traction sector.
Although this digital paradigm has become a key point in industry, especially in power traction, due to the increase of e-mobility applications, and power generation, three main challenges have been identified:
- Adaptation of AI to industry (consumer AI vs. industrial AI).Although AI is well established in the business sector, in the industry still has much to do. The main difference between consumer/business AI and industrial AI is data origin. In the business sector, AI models are fed with human-generated data which is closer to being valuable information than raw data. However, in industry, AI is fed with sensor/machine-generated data. Thus, most of the time, it means working with time-series, which are difficult and more complicated to manage because they need to be processed extensively. More issues related to the characteristics of industrial data were identified in [17,18]:
- –
- Lack of faulty data: Industrial applications are designed not to be prone to failures. Therefore, it is difficult to find data samples to model operation under abnormal events. This lack of faulty samples is an important drawback to develop efficient industrial AI models.
- –
- Lack of good quality data: Data from sensors is noisy, has outliers and contains missing values. Apart from that, in the same system, data of different characteristics and domains (different value ranges, sampling frequencies and origins) are collected. This is the reason of being difficult to manage in comparison to business or consumer datasets.
- Boosting the collaboration between data analysts and system analysts (Domain knowledge vs. Data Analytics).In [19,20] six key elements (ABCDEF) for Industrial AI are identified: Analytics technology (A), Big data technology (B), Cyber technology (C), Domain Know-how (D), Evidence (E) and Feedback (F). While the first three are usually the domain of a data analyst, the last three are fundamental to ensure the success of any AI strategy. However, many times their presence is not assured. Knowledge of the application is fundamental to understand the system and the problem, knowing which data to collect and understanding the physical meaning of the variables. Thus, there is a need to unify the knowledge and to create communication channels between system and data analysts.
- Electric drive complexity (Onboard vs. Remote architectures).As mentioned above, electric traction sector is increasingly tending to provide active remote monitoring solutions. For this, the standardized architecture is the one where the onboard equipment only collects and sends raw data. Subsequently, CC platforms carry out data analytics and execution of the supervision models. However, with the increasing data volume generated by sensors, it is clear that sending raw data directly to the cloud is less and less viable. This has reinforced the need for edge-computing. It refers to an architecture in which each subsystem can collect, preprocess, analyze and even execute AI models. As described in Figure 1, there are several alternatives, but clear solution has not been found yet. However, edge-computing is seen as a suitable alternative for transportation applications where assets are geographically distributed, with a large number of fleets and components, high-speed data streams and dynamic environments [2,6,20,21].
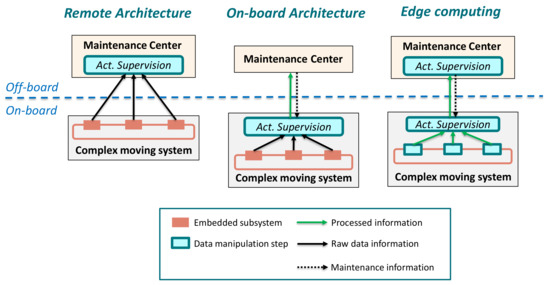 Figure 1. Condition Monitoring and health management architectures applied in electric drives [22].
All these challenges can be found in the monitoring process of a traction electric drive. Figure 2 shows the most common structure of this system. In general terms, it is composed of an energy source, an input energy conversion step, a DC-Link, an output energy conversion step and an electric machine, these subsystems can be treated as the core of any electric traction application. Furthermore, sensors and the Traction Control Unit (TCU) can be understood as the brain of each application. Moreover, it is worth mentioning that this subsystem structure has been used to organize the scientific documentation review about the topic.
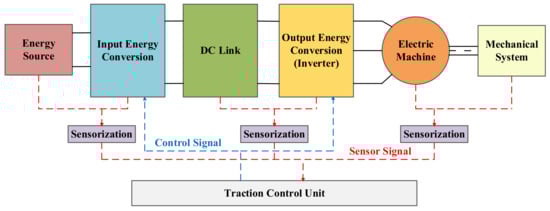
Figure 2.
Block diagram of a generic architecture of an electric drive.
Considering the aforementioned points, this article aims to review the implementation of data-driven active supervision strategies in each of the electric drive architecture subsystems. The main objective is to identify a trend in the use of the different FDD strategies in electric traction applications, focusing on those based on Machine Learning and Deep Learning. The rest of this paper is organized as follows. Section 2 introduces the meaning of actively supervising any industrial equipment, as well as its corresponding standard. Section 3 analyzes the basic theory of the Machine Learning workflow, going a bit on Deep Learning too. Section 4 reviews the applications of data-driven approaches in electric drives. Finally, the discussion about the topic is carried out in Section 5 and concluding remarks are drawn in Section 7.
2. Fundamentals of Active Supervision in Electric Drives
Modern industry has developed a trend to design and manufacture equipments with high sophistication, complexity, and capacity that generally increase their Life Cycle Costs (LCC). As a result, and with the aim of producing industrial systems with higher competitiveness in the market, companies have develop greater awareness in key aspects such as Reliability, Availability, Maintainability and Safety, which the four of them compose the RAMS philosophy [23,24,25,26]. These key aspects generally are focused on reducing abnormal operating conditions of industrial systems to avoid their negative consequences [27,28]. Therefore, it is interesting to actively supervise industrial equipment, in order to control their operation and perform anomaly detection and identification tasks, or even predict the health status of their components.
Supervision is understood as the set of actions executed with the purpose of ensuring the correct operation of any system [29]. Presently, there are different standards, such as ISO 13374 [30,31,32,33] or CRISP-DM [34,35], which describes a modular architecture to supervise and monitor industrial equipment. Concretely, Figure 3 shows the block diagram presented in the ISO standard.
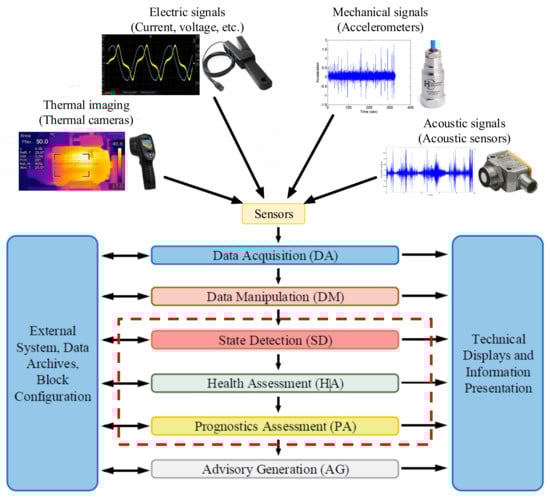
Figure 3.
Block diagram of the ISO 13374 Condition Monitoring standard architecture [30].
It can be said that every active supervision strategy will contain three common blocks which namely are the Data Acquisition (DA), Data Manipulation (DM) and the Advisory Generation (AG). In other words, some kind of information should be acquired from somewhere, for example sensors, transducers, etc. Consequently, this information usually should be preprocessed in order to optimize the knowledge value. In addition, of course, at the end of this process, certain information must be delivered to the system maintenance personnel, designers, users, etc. However, the blocks ((SD), (HA) and (PA)) inside the dotted red box in Figure 3 depend, to a large extent, on the supervision methodology chosen. This means that the modular architecture, and thus the active supervision strategy, can be limited only to Detection tasks (check if a fault has happened in the system, via alarms). It can be partially extended until Diagnosis tasks (know what and where has happened in the system). Or even, it can be extended totally until Prognostics levels (identify what will happen in the near future, the so-called Remaining Useful Life (RUL) estimation).
There are four main methodologies to implement these last functionalities:
- Signal-based methodology: The main objective of a SB method is to analyze fault symptoms (s) in the real signals acquired from the systems under investigation such as current, voltage, vibrations, etc. In a nominal state, the acquired signals correspond to certain frequency, amplitude and ripple features (ŷ) whereas in faulty states these indicators differ from the nominal ones [36,37]. That is why with the help of expert knowledge, it can be identified whether a fault is presented or not in the system (see Figure 4). It is important to know that the existing SB methods can be categorized depending on their feature typologies: Time domain techniques, frequency domain techniques and time/frequency domain techniques [38].
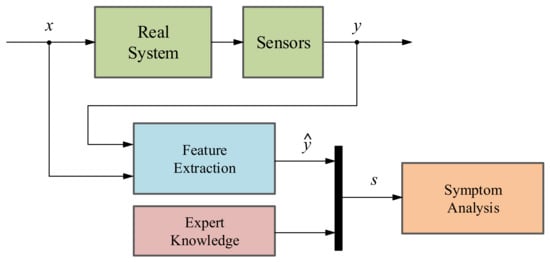 Figure 4. Schematic of the signal-based fault detection and diagnosis methodology.
 - Model-based methodology: This method aims at generating an analytical redundancy through a mathematical model that replicates the physical behaviour of the real system. The MB strategy executes the analytical model in real-time, in parallel to the real system and with the same measured inputs. After that, the mathematical model output (ŷ) is compared with the output of the real system (y), generating residual signals (r) which will determine if there is a fault in the system using a residual evaluator [36], as it can be seen in Figure 5. According to [36,39,40], there are three different model-based approaches: the parameter estimation approach, the parity space approach and the observer-based approach.
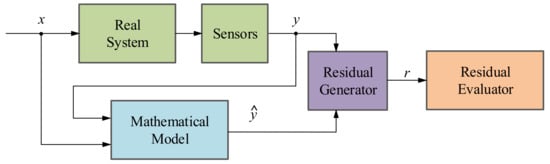 Figure 5. Schematic of the model-based fault detection and diagnosis methodology.
 - Data-driven methodology: The basis of DD methods is to take advantage of large amount of historic datasets acquired from the system under investigation by means of Machine Learning or advanced statistical models [36,41]. These algorithms learn from data in order to discover hidden patterns (p) represented in the information redundancy among the system variables (see Figure 6). It can be said that this approach is the recent alternative for active supervision in those systems, which are too complex to have an explicit analytic model or signal symptoms of faulty behaviour. It is worth mentioning that the information redundancy added to AI techniques make possible to build a complete CM platform, from data acquisition (DA) to prognostics assessment (PA) levels.
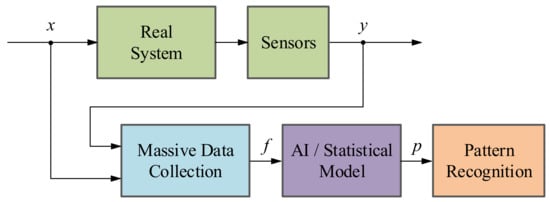 Figure 6. Schematic of the data-driven fault detection and diagnosis methodology.
 - Hybrid methodology: As the aforementioned active supervision techniques have their pros and cons, a new trend has emerged, which tries to integrate together these complementary methods in order to achieve a better performance [41,42]. It is commonly agreed that hybrid schemes would provide better solutions to a complex system. In other words, hybrid CM methods aim to enhance the supervision results by leveraging the advantages and avoiding the limitations of their consisting approaches.
Table 2 collects the most important advantages and disadvantages of the different aforementioned methodologies.
Table 2.
Advantages and disadvantages of the active supervision methodologies.
To sum up, on the one hand, the limitations of SB and MB methodologies are the excessive requirement of expert knowledge and their limitations to implement all the functionalities from the ISO architecture. On the other hand, the main drawback of the data-driven method is the availability of the data itself. However, the improvement of the data manipulation and communications, as well as the trend of acquiring data in every company make data-driven strategies a hot topic in present research.
3. Fundamentals of the Machine Learning Workflow
This section provides an explanation of the standardized workflow to develop a data-driven fault detection and diagnostic (FDD) strategy based on Machine Learning algorithms, for actively supervising electric drives.
Although sometimes it is thought that implementing these solutions consists only of selecting and optimizing a Machine Learning algorithm, many other operations have to be carried out in order to develop efficient approaches. As Figure 7 shows, this methodology can be split in four main stages, which namely are the acquisition and raw data organization steps, the raw data preprocessing step, the Machine Learning model design and the implementation and integration in the application [43,44,45].
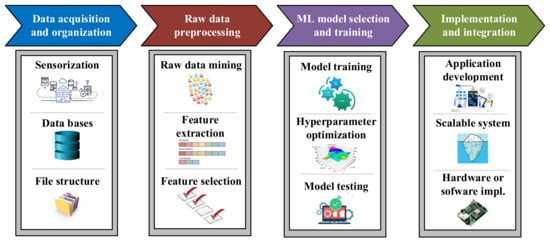
Figure 7.
Machine Learning standardized workflow [43].
3.1. Acquisition and Raw Data Organization
In this first stage, the massive raw data acquisition is performed, as well as its saving and organization in a structured way. This step is very important because the quality and the quantity of the data gathered will directly determine how good the FDD model can be. The raw data acquisition involves reading and saving data from different sources, not only from online streaming sensors directly installed in the system under investigation, but also from offline databases such as historic datasets from local or cloud data servers.
It is worth mentioning that in order to build a ML-based solution, which generalizes every health condition of an industrial equipment, both healthy and faulty data must be acquired. However, as mentioned before, this is an important problem that DD methodology must deal with. In most of the industrial applications, the observed data volume for nominal or healthy operations far exceeds the observed data volume for an anomalous or faulty status, which will cause great difficulties in conducting the model training. Owing to the unbalanced datasets, it is especially necessary to acquire more data under fault status scenarios or apply data augmentation techniques, which will make the entire dataset more balanced [18]. A well-established example of data augmentation is synthetic data generated from simulation via the so-called Digital Twins [46,47].
Likewise, it is not only important to collect such data. Where and how to store it is also of crucial importance. The standardized storage place has usually been local servers (Local databases), but in recent decades the tendency is to use services in the cloud (cloud databases) because of their improvement and flexibility. Moreover, the data should be stored in a structured way in order to be more efficiently accessible.
3.2. Raw Data Preprocessing
After acquiring and organising the raw data, the next step is preprocessing it. That means, data manipulation and transformation for consumption in Machine Learning algorithms. In general, this step can be divided into two levels of preprocessing. On the one hand, the general raw data preprocessing and on the other hand, the specific feature preprocessing or Feature Engineering.
- General raw data preprocessing: This level of preprocessing involves data cleaning, which is all about filtering messy data, detecting outliers and missing values, and applying normalization [48,49] and even segmentation [50,51]. Furthermore, it is important to know that data exploration is a technique that will help general preprocessing by combination of manual methods and automated tools such as data visualizations, charts, etc. to understand what is in a dataset. After refining the raw dataset, the volume of data will be considerably smaller. This makes easier to manage it during the Feature Engineering step.
- Feature Engineering: Once the raw data have been reduced and cleaned, Feature Engineering should be applied in order to modify the dataset into appropriate information for feeding the ML algorithm. Particularly, Feature Engineering can be split into two main tasks, Feature Extraction (FE) and Feature Selection (FS).The main objective of Feature Extraction is to transform raw data into numerical features that can be processed by the ML algorithm, while preserving the information in the original dataset. ML algorithms do not always work so well on raw data, that is why extracting new numerical features from historic dataset variables yields better results. This task performance is directly related to domain expertise and solid understanding of the data, that is why expert knowledge is really required. Feature Extraction can be accomplished manually, via time, frequency and time/frequency domains transformations such as mean, maximum/minimum, standard deviation, kurtosis, as well as, more advance domain transformations such as Fast Fourier Transform (FFT) or even Wavelet and Short Time Fourier Transform (STFT) approaches. At the same time, FE can be also performed automatically using specialized algorithms such as Linear Discriminant Analysis (LDA), Principal Component Analysis (PCA), or Independent Component Analysis (ICA) [52,53,54].Usually, a huge number of features can be obtained from the FE stage. Unfortunately, not all features are meaningful and contain hidden patterns about the equipment under investigation. That is why some of them are redundant or irrelevant. These features should be removed by means of Feature Selection techniques [52]. The main objectives of applying these methods are the accuracy improvement in the ML model, the overfitting risk reduction of the algorithm, and a considerable speed up in the training step. When speaking about overfitting, it means that a trained model corresponds too closely to a particular dataset, which may therefore fail to fit additional data or predict future observations reliably [55,56]. Therefore, this second task of Feature Engineering tries to rank the importance of the extracted features in the dataset by applying certain evaluation criteria, while discarding less important variables. FS mechanisms are divided in three groups: Wrapper, Filter, and Embedded methods [57].
3.3. Machine Learning Model Design
Once the most important features have been selected, it is time to choose the most appropriate Machine Learning topology and algorithm to build the active supervision strategy.
Machine Learning is a subset of AI which enables computers to act and make data-driven decisions to carry out certain tasks. Its main applications can be summarized in collaborative filtering, automatic translation, speech recognition, face identification, as well as different fault diagnosis and maintenance tasks [58]. The core of these data-driven methods are algorithms that are designed in a way that they can learn and improve over time when exposed to new data [59,60,61].
ML algorithms can deal with different problem topologies and applications. The typical ML classification shown in scientific publications such as [60,61,62,63,64] is the one presented in Figure 8.
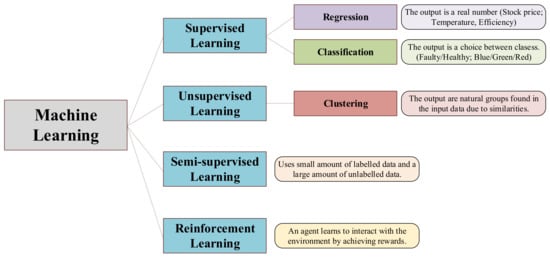
Figure 8.
Machine Learning algorithms topology.
- Supervised Learning: Supervised ML algorithms are supported by an established set of data and a certain understanding of how that data is organised. That is to say, data samples have assigned labels that define the meaning of the input/output relationship [65], as it can be seen in Figure 9.
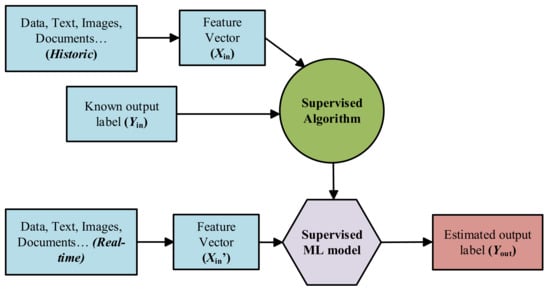 Figure 9. Schematic block-diagram of the supervised ML approach.However, the most challenging problems in supervised models is that they require labelled data. One has to spend time labelling the samples, which is expensive and time-consuming.
 - Unsupervised Learning: Unsupervised ML algorithms arise when the problem contains a large amount of unlabelled historic data. That means that it only contains the features subset, no label characteristic is available [65] (see Figure 10). Thus, understanding the meaning behind this problem requires algorithms that can find and classify data instances into groups by their similarities based on distance or statistic metric [61,66].
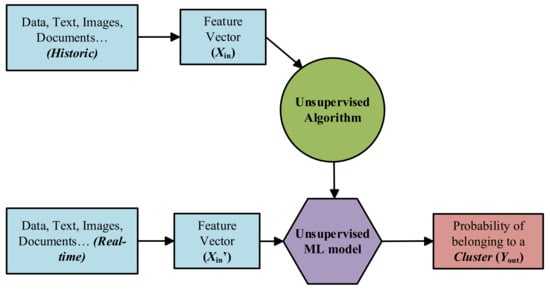 Figure 10. Schematic block-diagram of the unsupervised ML approach.Clustering is the most used Unsupervised approach. With it, objects or samples with similar parameters or characteristics are grouped together in “clusters”.
 - Semi-supervised Learning: Most of the application domain suffers from not having sufficient labelled data whereas unlabelled data are available cheaply. Semi-supervised Learning addresses this problem and act as a half way between supervised and unsupervised learning [67,68]. Normally, first, these type of algorithms use the limited set of labelled samples to train themselves, resulting in “partially trained” models. After that, the partially trained models label the unlabelled dataset. In addition, finally, the pseudo-labelled and labelled datasets are combined, in order to train a new algorithm that joins both the descriptive and predictive aspects of supervised and unsupervised learning.
As said before, in this third step of the workflow, the Machine Learning topology should be selected and the algorithm should be trained and validated in order to leave it ready to integrate into the required application [62,69,70]. For that, the specific procedure shown in Figure 11 should be followed [71].
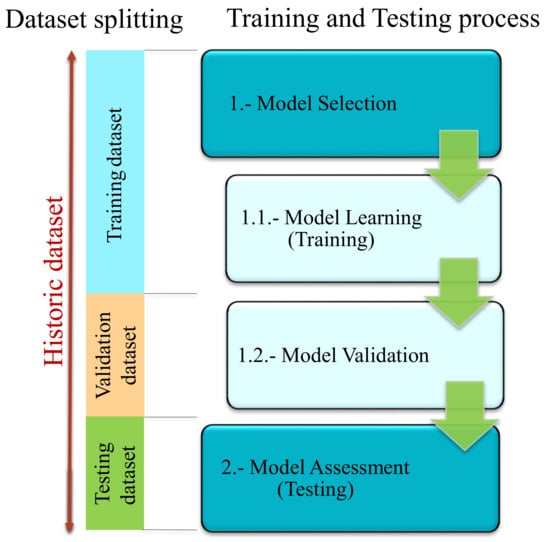
Figure 11.
Training/Testing process for a ML algorithm.
In the Model Selection phase, an empirical comparison of algorithms of the same topology is performed and the approach with best results is selected. This phase is divided into two sub-phases. On the one hand, in the first sub-phase (Model Learning), algorithms of similar characteristics (supervised, unsupervised, etc.) are trained with the training sub-dataset. This means adjusting their internal parameters during the learning phase. On the other hand, in the second sub-phase (Model Validation), hyperparameters are optimized and the different algorithms are validated with the validation sub-dataset. Validation means, evaluating algorithms performance by different criteria. The most common indicators are the Confusion Matrix for classification problems and the Root Mean Square Error (RMSE) for regression approaches [72].
Finally, in the Model Assessment phase the trained and selected algorithm is checked in a real environment under new unseen data, the so-called testing sub-dataset. If this last evaluation is positive, the ML model will be ready to be implemented in the application.
In addition, it is important to mention that the most efficient way to carry out this training and testing process is to use independent sub-datasets at each stage. That means that a historic dataset achieved from preprocessing step of the workflow should be split into three sub-datasets, which are training, validation and testing sub-datasets, as was said before (see Figure 11). Normally, between 60–70% of the historic dataset is saved for training tasks. The rest 20–30% is split in two equal parts for creating the Validation and Testing sub-datasets.
3.4. Implementation and Integration in the Application
In this last step of the ML workflow, trained and validated models are integrated into company pipelines. In the case of a data-driven active supervision strategy, this step means that ML algorithms are integrated in the CM structure from Figure 3. However, several tasks need to be performed before a data-driven solution is fully operational. Some of the aspects to be taken into account are:
- The ML workflow may not be developed using industrial tools. It is common to use research or academic tools (such as Matlab) in the training and validation phases. Hence, during the deployment, algorithms need to be adapted to different platforms.
- Following the previous point, visualization tools need to be developed. In the design phases, specialized tools are used to analyze in detail the performance and operation of the algorithms.
- The deployment architecture must be selected between the solutions given in Figure 1.
4. Data-Driven Active Supervision Strategies in Electric Drives
In this section, a review of scientific documentation focused on data-driven active supervision techniques applied in electric traction systems is presented. As a way of covering as many publications as possible and give consistency to the review, a structured material collection was carried out. Therefore, this review is defined by the next points:
- The collected material is composed of scientific papers, from many data bases such as Web of Science, Scopus, Google Scholar, etc. in which the main area of study matches with data-driven fault detection, diagnosis and prognosis approaches performed in electric drives.
- The searching has been limited by dates, only documentation published between 2010 and the present has been taken into account.
- The publications have been classified by application type, component under investigation, ML type, ML algorithm, preprocessing techniques and data sources.
- Finally, the literature has been organized depending on the electric drive subsystem they belong to, taking as reference the general architecture defined in Figure 2.
Therefore, it is important to take into account that the aim of this review is to analyze the present studies and research about this topic, in order to identify the main challenges around it, to be able to define new investigations gaps for future developments.
4.1. Energy Source
In electric drives, the energy source can be based on different topologies such as batteries, electric grid, catenaries, super/ultra-capacitors, etc. which depend mainly on the application.
In the railway sector, catenaries or overhead contact lines (OCL) are treated as part of the infrastructure section. This means that this component should be considered out of the electric traction system of a rolling stock itself. However, owing to its relevance in the performance of the system and its continuous interaction with the pantograph, they have been taken into account in this review.
To start with, ref. [73] reviews the state of practice and the state of the art of Prognostics and Health Management (PHM) strategies for OCL systems. Key sensors, monitoring parameters, state detection algorithms, diagnostics approaches and prognostics models are reviewed. Additionally, future challenges and technical needs are highlighted, such as the need for standardizing sensors, improving in data storage platforms, and boosting hybrid FDD strategies.
In the case of ref. [74], a brief comparison between the traditional methods used to detect faults in catenaries and the more sophisticated ones is presented. It remarks that traditional ones were carried out through foot inspections and inspection trolleys fitted with cameras, proving to be inefficient and time consuming when analysing the data. However, with the advance of AI and new sensing techniques, smart supervision systems based on ML techniques have been implemented. As an example, the paper analyzes the interaction between the pantograph and contact wire (CW) by using accelerometers and non-contact infrared thermometers. The acquired field data are transmitted to the cloud for preprocessing and storage. Moreover, an unsupervised learning method based on the k-Means clustering algorithm is built in Matlab, which reaches satisfactory results.
Furthermore, ref. [75] focuses on catenary-pantograph interactions, especially in electric arcs. The general block diagram of the designed data-driven active supervision strategy is based on three SVM classifiers fed with current and voltage signals from pantographs, working as an ensemble method. At the end, a fuzzy integral technique is used to synthesize the results obtained by the individual classifiers reaching 95.64% of accuracy in electric arcs’ detection tasks.
When focusing only in the pantograph device, it is clear that one of the main problematic events is the carbon contact strip wearing. An example of this event analysis is ref. [76], which develops a RUL prediction of the pantograph carbon contact strip (PCCS) via linear regression combined model. For that, wear data from Guangzhou Metro are acquired and preprocessed, reaching acceptable predictive properties.
Eventually, in terms of energy storage systems (ESS) such as batteries and super/ultra-capacitors, plenty of studies have been carried out in levels of fault detection and diagnostic or even in prognostics ones. On the one hand, as reviews such as [77,78] say, fault diagnosis of batteries is an important task in the battery management system (BMS). It is responsible for detecting early faults and providing control actions to minimize their effects, to ensure the safe and reliable operation of the ESS. On the other hand, research such as in refs. [79,80,81] concludes that RUL prediction of batteries has become the hot topic in electronic PHM, because it is helpful to reduce failure rates and maintenance costs.
However, an exhaustive analysis of the existing alternatives is outside the scope of this review, since the ESS sector is large enough to warrant an independent analysis.
4.2. DC Link
The DC link subsystem makes the union between the input and the output energy conversion subsystems using a bus capacitor bench. Other elements can be added to this capacitor bench to actively control the flow of energy, such as the crowbar and the grounding circuit.
In the case of the crowbar, the influence of AI is not usual. No scientific papers have been found concerning maintenance strategies of this protection element. The main reason for that can be the simplicity and the discontinued use of the component, since it is only used in braking mode and not in every application.
In respect to the grounding circuit, a single paper was found [82]. The research goes over a data-driven FDI method to avoid grounding faults and consequent short circuits. In this case, the Canonical Correlation Analysis (CCA) supervised algorithm is applied for fault detection, and then fault isolation and visualization techniques are proposed based on DC link current and voltage data from a test-bench.
However, as review [83] transmits, a large number of scientific publications studied CM strategies in capacitor benches during last two decades. Most of the research is based on signal-based methodologies. Taking refs. [84,85,86] as example, the main strategy in this approach is to detect changes in the equivalent series resistance (ESR) and in the capacitance of the component via the analysis of voltage and current measurements, in order to detect the life-cycle status and permit preventive maintenance of the component.
Nevertheless, a tendency can be observed from 2015 until now, where research raised attention in data-driven active approaches. For example, a data-driven method for capacitors based on an Artificial Neural Network (ANN) algorithm is proposed in ref. [87]. It is applied to a back-to-back converter case study to estimate the capacitance value change of the DC-link capacitor. Data for training and validating the model is achieved from simulations in Matlab/Simulink software.
The case of ref. [88] presents a fault detection and identification method for the capacitor ageing faults in DC filters of power converters. This strategy is based on the adaptive neuro-fuzzy inference system (ANFIS) algorithm. The inputs to this model are input voltage of the converter, as well as the voltages across the DC filters. The output of the ANFIS unit is used as an index to identify the capacitor ageing fault. Then, it locates the fault within the two DC filters installed in the power converter. Another recent example is ref. [89], where an online failure detection method for a DC-link electrolytic capacitor in a converter, using a Support Vector Regression technique, was proposed.
Table 3 gathers the analyzed papers concerning data-driven fault detection and diagnosis models applied over the DC link subsystem.
Table 3.
Data-driven FDD application examples in DC-link subsystem.
4.3. Energy Conversion Step
In the energy conversion steps (input and output), the power converters are normally based on power semiconductors, which are exposed to high thermal and electrical stress in electric drive applications. Repeated impact of energy during the IGBT’s or Diode’s switching and blocking makes the power converter more vulnerable to failures, such as open-circuit (OC) and short-circuit (SC). Therefore, supervision of this subsystem has been studied for years.
Until 2010, signal-based and model-based techniques were the most applied methodologies. On the one hand, signal-based methods such as current trajectory and instantaneous frequency analysis, considered in refs. [90,91], were applied because of their simplicity and low computational load in detection supervision levels. On the other hand, the model-based techniques were more precise and easier to implement in diagnostic tasks after the mathematical model generation [92]. Nevertheless, as the complexity of the systems have increased, the work required in calculating these new mathematical models have not been feasible.
That is why, from 2010 to the present, data-driven active supervision strategies have been investigated because of the improvement of data accessibility, storage and computational capacity. One of the first works implementing data-driven methods in power electronics semiconductors supervision is ref. [93], which with the help of model-based simulations, detects and identifies IGBT OC faults from voltages and current signals via ANN. Additionally, supported by simulations in Matlab, ref. [94] develops an IGBT OC diagnosis model based on a SVM. As peculiarity, in this research the current signals are preprocessed with wavelet transform in order to achieve new input features to the model.
In ref. [95] not only the OC fault mode is analyzed, but also SC faults are distinguished via an ANN algorithm. In this case, voltage, current and torque variables are preprocessed to calculate new statistical features such as maximum, minimum, standard deviations, etc.
Furthermore, in ref. [96], a basic test-bench with an electric drive attached to a microcontroller is built. The main objective of this test-bench is the massive data generation (healthy and faulty). In this research, new features are extracted with FFT from output inverter voltage, and then the most relevant ones are selected with PCA method. Finally, a Bayesian Network is developed to diagnose OC faults.
However, research developed from 2016 until now focused more on Deep Learning approaches. As an example, ref. [97] questions both model-based and basic ML architectures because they need to build complex mathematical models or extract features from sensor signals manually. To solve these problems, the paper proposed a new DL method for IGBT OC fault diagnosis based on a Convolutional Neural Network. This end-to-end algorithm extracts comprehensive information from converting current signals into pixelated images. It is worth mentioning that faulty and healthy data for training the CNN is acquired from simulations in Matlab/Simulink.
Another example of DL application is ref. [98], where a fault identification in traction inverter based on Deep Wavelet Neural Network (DWNN) and Deep Support Vector Machine was suggested. The method uses the DWNN to automatically mine and compress hidden fault information from the simulated current signals and after that Deep Support Vector Machines (DSVM) are trained to integrate the recognition results.
Similar to previous examples, in ref. [99], a robust fault diagnosis strategy for open switch faults isolation in a five-phase conventional inverter was designed. An adaptive Self-Recurrent Wavelet Neural Network (SRWNN) as a non-linear system identifier provides the fault detection scenario. Then, it is followed by a classifier to locate the fault. Discriminant Analysis and SVM have been implemented to identify the fault location. In this research, the proposed method was also evaluated by experimental results obtained from a lab prototype.
To sum up, all the analyzed scientific papers referring Data-driven FDD techniques in inverters of electric drive applications are shown in Table 4.
Table 4.
Data-driven FDD application examples in energy conversion subsystem.
4.4. Electric Machine
In the case of the electric machine subsystem, plenty of scientific publications have been found. This can be for many reasons. On the one hand, the electric machine can be categorised as the nucleus of electric drive application, because it is the device which generates the motion. On the other hand, it is one of the most expensive and complex part among all the components.
Traditionally, signal-based methods have had a wide application in Condition Monitoring for electric machines, both in electrical and mechanical faulty events. Reviews [108,109,110], and PhD thesis [111] summarized the different applied methodologies. Moreover, model-based diagnostic methods have been also used simultaneously with signal-based method. In this case, reviews such as [112,113] make a general mapping of this strategy in electric machines, and scientific applications such as [114,115,116,117] develop different model-based methods.
Even so, concerning the last decade, data-driven techniques were implemented to assist in active supervision tasks. As an example from 2010, ref. [118] performed the complete workflow of a Machine Learning based active supervision methodology for electric machines. It classified winding inter-turn SC and rotor eccentricity faults based on a Multi-Layer Perceptron (MLP). Later, ref. [119] analyzed electric machine health status not in steady state, but in speed transient state. In this case, stator current signals have been preprocessed by wavelet transform and PCA algorithm to achieve new input features for the Decision Tree model.
However, not only electric signals are analyzed in electric machine diagnosis, refs. [112,120] analyzed stator and rotor faults via vibration signals from accelerometers installed in test-benches. The research compared k Nearest Neighbours, MLP and Radial Basis Function (RBF) algorithms performance after preprocessing vibration signals with discrete wavelet transform (DWT) and genetic algorithm (GA). The latter calculates statistical features and principal components from vibration signals to feed an ANN algorithm. Furthermore, research where acoustic signals [121,122] or even thermal imaging [123] are analyzed, can be found in the bibliography.
Although every research shown until now reached diagnosis classification accuracies above 90%, they depended strongly on expert knowledge, especially in preprocessing steps such as feature selection and extraction. Thus, from 2016 to the present, Deep Learning workflow has been studied in different publications. As mentioned before, Deep Learning models substitute the time-consuming preprocessing steps by end-to-end algorithms which work directly with quasi-raw data, accelerating the workflow and approaching to real-time maintenance strategies. For example, ref. [124] trained a Deep Belief Network (DBN) with vibration data from an electric machine. This algorithm is a probabilistic generative model formed by Restrictive Boltzmann Machines (RBM), which can model high-dimensional and non-linear data via multiple layers, thus can reduce training error and improve classification accuracy.
In ref. [125], stator and rotor faults were analyzed with CNNs. It is important to mention that in this case, CNN training periods are reduced because the Transfer Learning approach has been applied. This recent philosophy takes advantage of parameters and hyperparameters from previous trained CNN of similar applications. Refs. [126,127,128] are other examples were end-to-end algorithms were used to actively supervise electric machines, Sparse Autoencoders combined with SVM (SAE-SVM), CNN and DNN respectively.
Table 5 collects the papers which perform a data-driven fault detection and diagnosis methodology in electric machine.
Table 5.
Data-driven FDD application examples in electric machine subsystem.
4.5. Mechanical Subsystem
In this scientific documentation review, the mechanical subsystem is the one that concentrates the highest amount of scientific publications. Specifically, among all the components that compose the subsystem, bearings are the most analyzed elements. For example, reviews such as [145,146,147,148] affirm that this vulnerable element has been studied for a long time. In general terms, they analyzde both ML and DL approaches for detection and diagnostics tasks, as well as, for prognostics tasks applied in bearings.
Based on the carried out analysis, it can be seen that from 2010 to 2015, the ML workflow was the basis of the data-driven active supervision techniques applied in bearings. Next publications are examples of this period of time. Ref. [149] develops a FDD strategy based on a SVM classifier applied in bearings of a three-phase induction motor. In this case, data are acquired from accelerometers installed in a test-bench, and preprocessed via Continuous WT to improve the training dataset quality.
Moreover, ref. [150] proposed a binary classifier based on an ANN. This algorithm is tested with experimental data obtained via the phase current measurements when the machine is in healthy state and having cracked bearing fault. It concludes that the success of a classifier depends very much on the effectiveness of the extracted features more than in the algorithm itself.
Furthermore, in ref. [151] a monitoring scheme applied to diagnose local defects, raceway faults and also, distributed anomalies in bearings was presented. For that, first, the most significant statistical time domain features are computed from vibration signals. Then, in order to comprehend and visualize features behaviour better, Curvilinear Component Analysis, a non-linear preprocessing technique was applied. Finally, a Hierarchical Neural Network structure was used to perform the classification stage between classes.
However, from 2015 until now, DL architectures have been the most popular in bearing active supervision strategies. Clear examples of this change are next scientific publications. Refs. [152,153] researched the design of CNN-based end-to-end methods that take raw signals as inputs. The only difference between both publications is that the former uses as input image the frequency spectrum of the vibration time-series, whereas the latter uses the STFT of those vibrations signals. It is important to mention, that in both cases the dataset has been taken from a public dataset provided by Case Western Reserve University. It consists of vibration signals collected at 12 kHz or 48 kHz for normal and damaged bearings with single-point defects under four different motor loads.
In the case of ref. [154], it faces the noise drawback in vibration signal from bearings to develop an effective data-driven FDD methodology. It uses the Deep Autoencoder algorithm to denoize input signals before putting them into the Neural classifier. This denoizing step improves classification accuracy of bearing faults until values above 99%.
At the same time, and taking advantage of the DL’s strengths, strategies based on acoustic signals or thermal imaging have been applied for diagnosing faults in the mechanical subsystem of electric drives. As an example, on the one hand, ref. [155] proposes a CNN-based classification method for diagnosing bearing faults under variable shaft speeds using acoustic signals. These signals are represented by spectrograms to obtain as much information as possible in the time–frequency domain. On the other hand, ref. [156] worked in a new framework based on small labelled infrared thermal images used to train CNNs.
Apart from fault detection and diagnosis strategies, prognostics techniques to compute the RUL of bearings are also being developed. As an example, ref. [157] dealt with the problem of CBM applied to the predictive maintenance of train axle bearings based on multi-sensors data collection, with the purpose of maximizing their RUL. For that, SVR algorithm is trained and tested with real data. Additionally, ref. [158] worked on a data-driven approach for the RUL estimation of rolling bearings based on a SVR algorithm. In this case, multiple statistical features in time and frequency domain are extracted from the run-to-failure experiments by the PRONOSTIA public dataset provided by the FEMTO-ST institute in France.
To end with this subsystem review, it is important to mention that apart from bearings, data-driven active supervision strategies also are focused on the gearbox. Some examples are refs. [159,160], which based their diagnosis abilities in CNN models trained with vibration signals acquired from test-benches.
Table 6 collects the most important papers concerning data-driven active supervision strategies applied in mechanical subsystem.
Table 6.
Data-driven FDD application examples in mechanical subsystem (Bearings and Gearbox). Prat I.
4.6. Sensors
Although the function of sensors is very wide, the majority of the reviewed research analyze sensors which are used for control operations. For example, in ref. [184] a new data-driven incipient fault detector methodology was proposed via Neural Network algorithms for phase current, speed and DC link voltage sensors. It incorporates preprocessing algorithms such as PCA or Kullback–Leibler divergence (KLD) to extract important information from the acquired data.
Furthermore, ref. [185] developed a SVM based fault detection and diagnosis strategy applied in High-Speed Trains applications. On it, the fault detectability of data from a test-bench is improved via PCA preprocessing methods. Additionally, studies such as [186,187] develop generic faults diagnosis strategies for sensors, based on Extreme Learning Machine and kNN algorithms, respectively. Both studies are focused on current and speed signal measurements acquired from simulations and test-benches.
However, few studies focused on sensors used in protection or monitoring tasks. For example, ref. [188] demonstrated that ML techniques such as kNN can be used to classify generic sensor faults from a strain gauge used in aviation application. It is worth mentioning that it is the only research found that tests the ML model against field data. Moreover, ref. [189] analyzed temperature sensor performance installed in a converter package from a traction application. It develops a SVM based classifier to detect and diagnose faults such as erratic, drift, hard-over, spike, and stuck by inserting them in a simulation run in Matlab. In this case, preprocessing tasks have been carried out in order to extract features in time domain via basic statistics methods.
Table 7 summarizes papers which perform a ML based data-driven fault detection and diagnosis methodology.
Table 7.
Data-driven FDD application examples in sensors.
5. Discussion
This section presents the main discussion of the review of the ML- and DL-based solutions for actively supervise electric drives. These results have been divided in points in order to facilitate their understanding.
- First, taken the aforementioned bibliography into account, it is important to understand the tendency of the different FDD methodologies applied in electric drives during last decades, in order to understand the background and the future lines about this topic. Therefore, as a result, this review shows that until 2010, model- and signal-based methods were the most applied strategies by researchers. However, due to the development of the Industry 4.0, as well as the enhancement in the accessibility to large amount of datasets, from 2010 to the present, solutions based on data-driven methods has been the most studied and developed. Compared with the classical techniques, DD active supervision strategies have a greater scope, as they can embrace more functional levels of ISO 13374. While MB or SB techniques cover until the State Detection or even Health Assessment level, data-driven ones can also help at Prognostics Assessment and Advisory Generation tasks.
- Furthermore, it is important to know that these DD strategies have been supported by Machine Learning algorithms, which have been developed with the standardized workflow analyzed in Section 3. Nevertheless, ML algorithms have suffered limitations when trying to reach real-time diagnosis because of some time-consuming manual stages. That is why, from 2015 until the present, Deep Learning end-to-end architectures have become the hot topic among the researchers.
- Concerning the analyzed workflow, although the ML algorithm selection, training and testing step (3rd step) looks like the most laborious step of the workflow, data acquisition and preprocessing steps can be considered to be the bottleneck of the complete development procedure. Therefore, DL approaches try to overcome the presented limitations. The workflow for this new solution removes the middle feature engineering step, building end-to-end Deep Neural Networks. This means that new features do not have to be selected manually by experts, instead they are computed automatically by adding hidden networks to the traditional Artificial Neural Networks (see Figure 12).
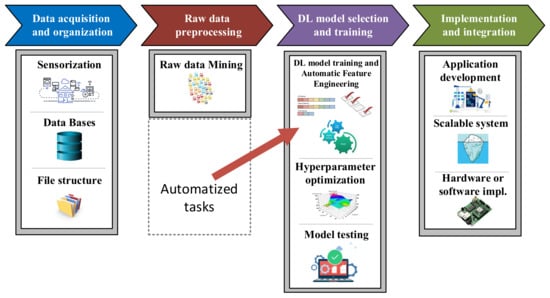 Figure 12. Deep Learning workflow.
 - The main drawback of DL approaches is not only the lack of interpretability, but also the lack of ability to explain specific phenomena. This is a disadvantage for diagnostic applications, where cause-effect relationships need to be identified, so that you can correct or reconfigure systems or even change designs. When an algorithm integrates all the steps by itself and does not give any information about the features or the sources of a faulty event, it is difficult to implement the feedback key element of Industrial AI explained in Section 1.
- At the same time, Section 4 shows evidence of the usage of data-driven FDD methodologies in fault diagnosis of electric drive subsystems and components. It collects applications from sectors such as railway, aviation, electric and hybrid vehicle, elevators, energy generation and electric grid.
- Another result obtained from the review is that DD active supervision strategies have been applied in most components of the electric drive generic architecture. However, according to the literature, the number of works dedicated to each subsystem depends strongly on the analyzed component. As it can be seen in Figure 13, sensors, electric machines and mechanical subsystem (bearings) are the ones with higher numbers of scientific papers.
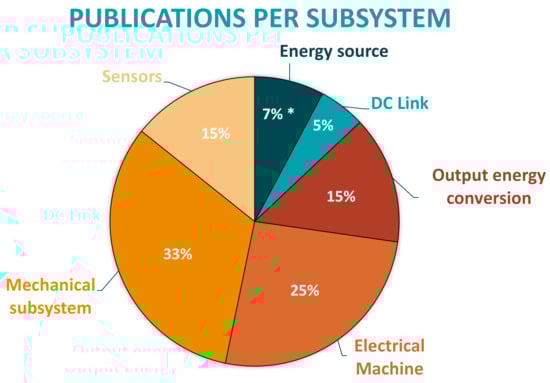 Figure 13. Percentage of developed research per subsystem of the electric drive architecture. * Batteries and Super/Ultra-capacitors have not been analyzed because they have potential to be studied independently.It can be said that solutions based on ML and DL are applied in the most complex and expensive components in terms of maintainability. For example, on the one hand, power electronics (inverters, rectifiers, etc.) or passive components (DC-link capacitors, filter inductors, braking resistors) are usually designed for the whole Life Cycle of the systems. Hence, maintenance actions are limited and faults should not appear. On the other hand, electric machines and bearings are components that need extensive maintenance. Thus, active supervision continues being an open topic for research.
 - Moreover, most of the analyzed applications are developed with simulation or test-bench data sources. Little research shows solutions validated in real industrial environments with field data, as can be seen in Figure 14.
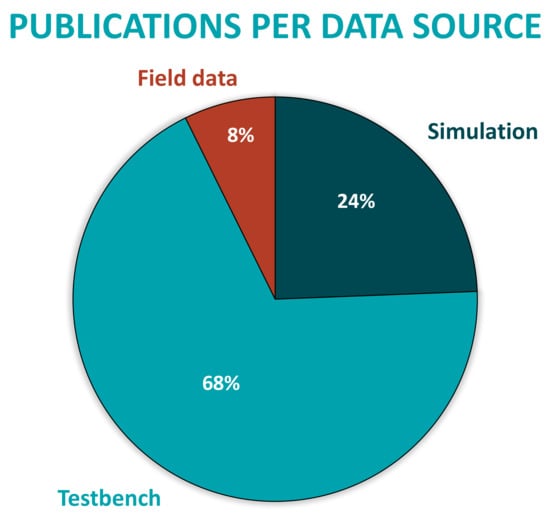 Figure 14. Percentage of developed research per data source.As it has been mentioned in the introduction, one of the challenges of the Industrial AI is the lack of faulty event samples when facing real environment applications. Therefore, in most research, training AI models require supplementing real data with synthetic samples from simulations or test-benches. It is clear that real systems are designed not to fail, that is why faulty data are scarce. As a result, the dataset becomes unbalanced and it will cause great difficulties in conducting model training. In order to overcome this limitation, much of the research has been working on simulation and test-bench environments to acquire synthetic balanced datasets. Owing to the fact that it is much easier to develop a controlled failure scenario, which will not damage the operation of the real application.
 - Furthermore, in electric drives, sensors used for monitoring have different sources and characteristics making the data acquisition heterogeneous and challenging. However, the most used variables are vibration for diagnosing mechanical failures and current or voltage for analysing electrical failures. Although the results of the review show this, it is worth mentioning that if the main objective is to reduce the Life Cycle Costs of the on-line CM strategy, the most efficient approach is to use the sensors already installed for control and protection tasks of the electric drive as data source for training the ML algorithms, and likewise not adding more sensors that increase the initial investment. Among the most used sensors are current, voltage, speed sensors, etc. It is true that at the level of fault diagnosis, sensors such as accelerometers, acoustic and thermal cameras can better identify the origin of the fault. However, their implementation is not economically feasible because it increases the costs of the electric drive that already suffers many market pressures for acquisition cost. In turn, adding these sensors increases the cost of maintenance. As a result, it is understood that these sensors have greater opportunities in the quality control of the manufacturing processes of the equipment and in the periodic inspection scheduled off-line.
- Finally, looking at the casuistry of failure modes addressed in the literature, it has been seen that most proposals are closely related to failures at the component level (bearing failures, shot-circuits or broken rotor bars, for example). However, there is a wider field of research related to failure modes at the subsystem or even, system level (control instabilities, undesired interaction between energy conversion steps, loss of comfort in the system user, etc.). These are cases that are difficult to emulate in simulation or laboratory environments because more than one subsystem interacts under given conditions. It is in these cases, at the application level, with complex industrial systems, which escapes expert knowledge, that Artificial Intelligence (both ML or DL) and the use of Big Data have the greatest potential compared to other techniques.
6. Future Research Directions
Taking in mind this results, in next lines future challenges or investigation lines in which our research area will be focus on, are going to be explained:
- Knowing that one of the main drawbacks of these data-driven fault diagnosis strategies, in real industrial applications, is the lack of faulty data (Unbalanced dataset), future research should work on dataset balancing techniques. An alternative to this challenge could be the synthetic data generation, via Hardware-in-the-Loop simulations, which should replicate as best as possible the real application under investigation, and also, should be compatible with the little field data available when training the ML algorithms. The second objective is to get closer to real applications building test-benches where different faulty scenarios can be forced, in order to generate efficient training datasets.
- Another interesting future line is the perspective change when facing failure modes analysis. As mentioned before, failures are currently studied from a faulty component or subsystem point of view, and in most cases only faulty effects on the analyzed subsystems are considered. However, the interaction between subsystems and focusing on a complete system environment can be interesting. This way, new faulty events and improvements can be found.
- At the same time, another interesting objective is to try boosting unsupervised ML or even DL strategies, owing to the fact that they are considered to be a hot topic at present. These approaches can overcome the laborious task of raw dataset labelling, which many times is really expensive and time consuming.
- Finally, and concerning the last stage of the ML/DL standard workflow, the integration of the data-driven fault diagnosis approaches in the Life Cycle of any industrial equipment needs further research. The main idea in here is to think how this approach can be established to obtain as much profit as possible, not only in the operation and maintenance stage of the equipment, but also during the design and the integration phases. Figure 15 shows an example of integration of the Condition Monitoring strategy in the “V” shape Life Cycle of an industrial system. Each stage should benefit from the knowledge acquired thanks to massive data collection and analysis, and at the same time, design tools such as simulations should help training fault diagnosis algorithms
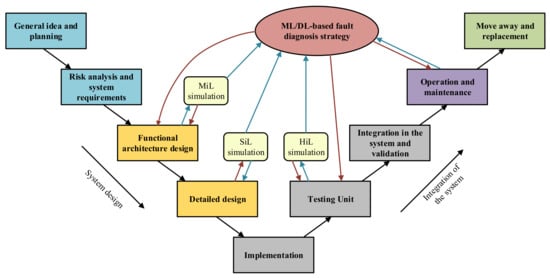 Figure 15. V model refresenting the Life Cycle of an industrial system.
7. Conclusions
This review focused on data-driven active supervision strategies implemented in electric drives, which add value to the systems, improving their competitiveness in the market. Furthermore, this publication provides general guidelines to develop the Machine Learning workflow, which can be considered to be the brain of the complete active supervision approach. At the same time, the analyzed scientific documentation is evidence of the importance that data-driven methods are acquiring in the maintenance and health management tasks not only in electric traction systems, but also in the industry and in other sectors such as chemistry or economy. However, in order to settle these techniques problems such as unbalanced datasets, speed-up trainings or even DL algorithm understanding should be overcome. For that, solutions such as hybrid active supervision methods, semi-supervised algorithms, or data augmentation techniques could be interesting.
Author Contributions
Conceptualization: D.G.-J. and J.d.-O.; Investigation: D.G.-J. and J.d.-O.; Methodology: D.G.-J. and J.d.-O.; Formal Analysis: J.P., P.M. and F.G.; Project administration: J.P.; Validation: D.G.-J. and J.d.-O.; Writing—original draft: D.G.-J.; Writing—review and editing: J.d.-O., J.P., P.M. and F.G. All authors have read and agreed to the published version of the manuscript.
Funding
This research received no external funding.
Institutional Review Board Statement
Not applicable.
Informed Consent Statement
Not applicable.
Data Availability Statement
Not applicable.
Acknowledgments
This research work was supported by CAF Power & Automation. The authors are thankful to the colleagues from CAF Power & Automation, who provided material and expertise that greatly assisted the research.
Conflicts of Interest
The authors declare no conflict of interest.
Abbreviations
The following abbreviations are used in this article:
| FDD | Fault detection and diagnosis |
| ML | Machine Learning |
| DL | Deep Learning |
| CM | Condition Monitoring |
| AI | Artificial Intelligence |
| BD | Big Data |
| IoT | Internet of Things |
| CC | Cloud Computing |
| AWS | Amazon Web Services |
| TCU | Traction Control Unit |
| LCC | Life Cycle Cost |
| SB | Signal-based |
| MB | Model-based |
| DD | Data-driven |
| FFT | Fast Fourier Transform |
| STFT | Short Time Fourier Transform |
| PCA | Principal Component Analysis |
| RUL | Remaining Useful Life |
| ESS | Energy Storage Systems |
| ANN | Artificial Neural Network |
| SVM | Support Vector Machine |
| CNN | Convolutional Neural network |
| MLP | Multi-Layer Perceptron |
| DNN | Deep Neural Network |
References
- Corre, F.L. HealthHub™. Smart Asset Monitoring for Optimised Life-Cycle Cost. 2019. Available online: https://www.alstom.com/our-solutions/services/digital-services-dependable-support-operators-and-owners-all-newest (accessed on 7 May 2020).
- Brahimi, M.; Medjaher, K.; Leouatni, M.; Zerhouni, N. Development of a prognostics and health management system for the railway infrastructure—Review and methodology. In Proceedings of the 2016 Prognostics and System Health Management Conference, Denver, CO, USA, 3–6 October 2016; pp. 1–8. [Google Scholar] [CrossRef]
- Lu, X.; Shan, S.; Tang, G.; Wen, Z. Survey on the railway telematic system for rolling stocks. In Proceedings of the 2015 International Conference on Electrical and Information Technologies for Rail Transportation, Zhuzhou, China, 28–30 August 2015. [Google Scholar] [CrossRef]
- Le Mortellec, A.; Clarhaut, J.; Sallez, Y.; Berger, T.; Trentesaux, D. Embedded holonic fault diagnosis of complex transportation systems. Eng. Appl. Artif. Intell. 2013, 227–240. [Google Scholar] [CrossRef]
- Zhu, A. Railway Infrastructure Management—System Engineering and Requirement. Ph.D. Thesis, KTH Royal Institute of Technology, Stockholm, Sweden, 2017. [Google Scholar]
- Teoh, T.; Berne, B.V.; Hindriks, I.; Waldenfels, R.; Eichhorn, T.; Hong, M.; Akerkar, R.; Sangwan, J.; Debussche, J.; Coordinator, P. Leveraging Big Data For Managing Transport Operations; Technical Report, Horizon 2020 Research and Innovation Programme; European Commission: Brussels, Belgium, 2019; Available online: https://cordis.europa.eu/project/id/770038 (accessed on 7 May 2021).
- Hitachi. Lumada Edge Intelligence Improves Customer Experience at Global Railroad Company. 2019. Available online: https://www.hitachivantara.com/en-us/products/data-management-analytics/lumada-dataops-suite.html?ecid=ps_gb_dx_en_ss0019sem&utm_source=google_ads_search_emea&utm_medium=paid-search&utm_keyword=lumada&gclid=Cj0KCQjwvYSEBhDjARIsAJMn0lhfO846GXkd6FImuovK49oqHeVZHk0ktJB6w0ayxFvnUR_geMKDJfsaAkFHEALw_wcB (accessed on 7 May 2020).
- Ortega, D.S. LeadMind: CAF´s Digital Train Platform. 2018. Available online: https://www.caf.net/en/productos-servicios/servicios/servicios-digitales.php (accessed on 7 May 2020).
- KONE. Intelligent Services Are Here. KONE CARE. 2018. Available online: https://www.kone.co.nz/Images/pdf_181524ConnectedServicesBrochure_tcm47-74692.pdf (accessed on 5 May 2020).
- KONE. Elevator and Escalator Maintenace Solutions. KONE Care. Available online: https://fliphtml5.com/ttgd/kstj/basic (accessed on 5 May 2020).
- Elevator, T. Engineering, Tomorrow, Together. MAX. 2016. Available online: https://ucpcdn.thyssenkrupp.com/_legacy/UCPthyssenkruppAG/assets.files/media/investoren/berichterstattung-publikationen/update-24.11.2016/en/archiv/thyssenkrupp_gb_en_2015_2016.pdf (accessed on 7 May 2020).
- Elevator, T. MAXimizing City Efficiency. 2016. Available online: https://max.thyssenkrupp-elevator.com/assets/pdf/TK-Elevator-MAX-Report.pdf (accessed on 7 May 2020).
- Otis. Personalize Your Service Experience. Otis ONE. 2018. Available online: https://www.otis.com/documents/256045/35474965/IoT_Brochure_WHQ_EN_0118_Letter_R6_V4-lores.pdf/c00a87ea-405f-b782-3559-9dd8ae37cb27?t=1596807632540 (accessed on 4 May 2020).
- Gamesa, S. We Turn Data into Valuable Knowledge Pythia. Available online: https://www.siemensgamesa.com/en-int/products-and-services/service-wind/diagnostics (accessed on 7 May 2020).
- Knudsen, S.J. Vestas Spins Up Wind Generation with Spotfire. Available online: https://www.tibco.com/blog/2016/08/18/vestas-spins-up-wind-generation-with-spotfire/ (accessed on 7 May 2020).
- Vestas. Vestas and Spotfire: Governed Data Discovery and Self Service. 2016. Available online: https://community.tibco.com/sites/default/files/wiki_files/vestas_and_spotfire_tn2017singapore.pdf (accessed on 7 May 2020).
- Lee, J.; Singh, J.; Azamfar, M.; Pandhare, V. Industrial AI and Predictive Analytics for Smart Manufacturing Systems; Elsevier Inc.: Amsterdam, The Netherlands, 2020. [Google Scholar] [CrossRef]
- Zhang, W.; Yang, D.; Wang, H. Data-Driven Methods for Predictive Maintenance of Industrial Equipment: A Survey. IEEE Syst. J. 2019, 13, 2213–2227. [Google Scholar] [CrossRef]
- Lee, J.; Davari, H.; Singh, J.; Pandhare, V. Industrial Artificial Intelligence for industry 4.0-based manufacturing systems. Manuf. Lett. 2018. [Google Scholar] [CrossRef]
- Liu, Z.; Jin, C.; Jin, W.; Lee, J.; Zhang, Z.; Peng, C.; Xu, G. Industrial AI Enabled Prognostics for High-speed Railway Systems. In Proceedings of the 2018 IEEE International Conference on Prognostics and Health Management (ICPHM), Seattle, WA, USA, 11–13 June 2018. [Google Scholar] [CrossRef]
- Garramiola, F.; Poza, J.; Madina, P.; del Olmo, J.; Almandoz, G. A Review in Fault Diagnosis and Health Assessment for Railway Traction Drives. Appl. Sci. 2018, 8, 2475. [Google Scholar] [CrossRef]
- Gandibleux, J. Contribution à l’évaluation de Sûreté de Fonctionnement des Architectures de Surveillance/Diagnostic Embarquée. Application au Transport Ferroviaire. Ph.D. Thesis, Valenciennes et du Hainaut-Cambresis, Valenciennes, France, 2014. [Google Scholar]
- Wollny, S. Reliability, Availability, Maintainability, Safety (RAMS) and Life Cycle Costs (LCC); European Association for Business and Commerce: Bangkok, Thailand, 2017. [Google Scholar]
- Del Pino, J.M.T. NTP 316: Fiabilidad de Componentes: La Distribucion Exponencial; Ministerio de Trabajo y Asuntos Exteriores: Madrid, Spain, 1991.
- Stapelberg, R.F. Handbook of Reliability, Availability, Maintainability and Safety in Engineering Design; Springer: Queensland, Australia, 2009. [Google Scholar]
- Isermann, R. Fault Diagnosis Systems: An introduction from Fault Detection to Fault Tolerance; Springer: Darmstadt, Germany, 2006. [Google Scholar] [CrossRef]
- Saraswat, S.; Yadava, G.S. An overview on reliability, availability, maintainability and supportability (RAMS) engineering. Int. J. Qual. Reliab. Manag. 2008, 25, 330–344. [Google Scholar] [CrossRef]
- EPSMA. Guidelines to Understanding Reliability Prediction; Report; The European Power Supply Manufacturers Association: Devon, UK, 2004. [Google Scholar]
- Colomer, J.; Meléndez, J.; Ayza, J. Sistemas de Supervisión: Introducción a la Monitorización y Supervisión Experta de Procesos; Cetisa Boixareu: Barcelona, Spain, 2000. [Google Scholar]
- ISO. Condition Monitoring and Diagnostics of Machines—Data Processing, Communication and Presentation—Part 1: General Guidelines; ISO 13374-1:2003; ISO Publishing: Geneve, Switzerland, 2003. [Google Scholar]
- ISO. Condition Monitoring and Diagnostics of Machines—Data Processing, Communication, and Presentation—Part 2: Data Processing; ISO 13374-2:2004; ISO Publishing: Geneve, Switzerland, 2004. [Google Scholar]
- ISO. Condition Monitoring and Diagnostics of Machines—Data Processing, Communication and Presentation—Part 3: Communication; ISO 13374-3:2012; ISO Publishing: Geneve, Switzerland, 2012. [Google Scholar]
- Johnson, P. Commercialization of prognostics systems leveraging commercial off-the-shelf instrumentation, analysis, and data base technologies. In Proceedings of the Annual Conference of the Prognostics and Health Management Society (PHM 2011), Montreal, QC, Canada, 25–29 September 2011. [Google Scholar]
- Pete, C.; Julian, C.; Randy, K.; Thomas, K.; Thomas, R.; Colin, S.; Wirth, R. Crisp-Dm 1.0—Step-by-step data mining guide. In CRISP-DM Consortium; SPSS: Chicago, IL, USA, 2000. [Google Scholar]
- Gallardo, J.A. CRISP-DM Metodologia para el Desarrollo de Proyectos de Mineria de Datos. Available online: http://www.oldemarrodriguez.com/yahoo_site_admin/assets/docs/Documento_CRISP-DM.2385037 (accessed on 7 May 2021).
- Dai, X.; Gao, Z. From model, signal to knowledge: A data-driven perspective of fault detection and diagnosis. IEEE Trans. Ind. Inform. 2013, 9, 2226–2238. [Google Scholar] [CrossRef]
- Gao, Z.; Cecati, C.; Ding, S.X. A Survey of Fault Diagnosis and Fault-Tolerant Techniques Part I: Fault Diagnosis with Model-Based and Signal-Based Approaches. IEEE Trans. Ind. Electron. 2015, 62, 3768–3774. [Google Scholar] [CrossRef]
- Phuong Khanh, T.; Nguyen, K.T.; Khlaief, A.; Medjaher, K.; Picot, A.; Maussion, P.; Tobon, D.; Chauchat, B.; Cheron, R. Analysis and comparison of multiple features for fault detection and prognostic in ball bearings. In Proceedings of the PHM Society European Conference, Utrecht, The Netherlands, 3–6 July 2018. [Google Scholar] [CrossRef]
- Skliros, C.; Esperon Miguez, M.; Fakhre, A.; Jennions, I.K. A review of model based and data driven methods targeting hardware systems diagnostics. Diagnostyka 2019, 20, 3–21. [Google Scholar] [CrossRef]
- Chen, J.I.E. Robust Residual Generation for Model-Based Fault Diagnosis of Dynamic Systems. Ph.D. Thesis, University of York, York, UK, 1995; pp. 1–293. [Google Scholar]
- Gao, Z.; Cecati, C.; Ding, S.X. A survey of fault diagnosis and fault-tolerant techniques—Part II: Fault diagnosis with knowledge-based and hybrid/active approaches. IEEE Trans. Ind. Electron. 2015, 62, 3768–3774. [Google Scholar] [CrossRef]
- Garramiola, F.; Poza, J.; Madina, P.; Olmo, J.; Ugalde, G. A Hybrid Sensor Fault Diagnosis for Maintenance in Railway Traction Drives. Sensors 2020, 20, 962. [Google Scholar] [CrossRef]
- MathWorks. Mastering Machine Learning A Step-by-Step Guide with MATLAB; MathWorks: Natick, MA, USA, 2018; Available online: https://www.mathworks.com/campaigns/offers/mastering-machine-learning-with-matlab.html (accessed on 7 May 2021).
- Zhong, K.; Han, M.; Han, B. Data-driven based fault prognosis for industrial systems: A concise overview. IEEE/CAA J. Autom. Sin. 2019, 1–16. [Google Scholar] [CrossRef]
- Bikov, E.; Boyko, P.; Sokolov, E.; Yarotsky, D. Railway incident ranking with machine learning. In Proceedings of the 16th IEEE International Conference on Machine Learning and Applications (ICMLA 2017), Cancun, Mexico, 18–21 December 2017. [Google Scholar] [CrossRef]
- Kaur, M.J.; Mishra, V.P.; Maheshwari, P. The Convergence of Digital Twin, IoT, and Machine Learning: Transforming Data into Action. Internet Things 2020. [Google Scholar] [CrossRef]
- Fuller, A.; Fan, Z.; Day, C.; Barlow, C. Digital Twin: Enabling Technologies, Challenges and Open Research. IEEE Access 2020. [Google Scholar] [CrossRef]
- Melendez, I.; Doelling, R.; Bringmann, O. Self-supervised Multi-stage Estimation of Remaining Useful Life for Electric Drive Units. In Proceedings of the 2019 IEEE International Conference on Big Data (Big Data), Los Angeles, CA, USA, 9–12 December 2019. [Google Scholar] [CrossRef]
- Xue, Z.Y.; Li, M.S.; Xiahou, K.S.; Ji, T.Y.; Wu, Q.H. A Data-Driven Diagnosis Method of Open-Circuit Switch Faults for PMSG-Based Wind Generation System. In Proceedings of the IEEE 12th International Symposium on Diagnostics for Electrical Machines, Power Electronics and Drives (SDEMPED 2019), Toulouse, France, 27–30 August 2019. [Google Scholar] [CrossRef]
- Xu, Z.; Hu, J.; Hu, C.; Nadarajan, S.; Goh, C.K.; Gupta, A. Data-Driven Fault Detection of Electrical Machine. In Proceedings of the 2018 15th International Conference on Control, Automation, Robotics and Vision (ICARCV), Singapore, 18–21 November 2018. [Google Scholar] [CrossRef]
- Shi, W.; Lu, N.; Jiang, B.; Zhi, Y.; Xu, Z. An Unsupervised Anomaly Detection Method Based on Density Peak Clustering for Rail Vehicle Door System. In Proceedings of the 2019 Chinese Control And Decision Conference (CCDC), Nanchang, China, 3–5 June 2019. [Google Scholar]
- Khalid, S.; Khalil, T.; Nasreen, S. A survey of feature selection and feature extraction techniques in machine learning. In Proceedings of the 2014 Science and Information Conference (SAI 2014), London, UK, 27–29 August 2014. [Google Scholar] [CrossRef]
- Tharwat, A. Linear Discriminant Analysis: An Overview. AI Communications. May 2017. Available online: https://www.researchgate.net/publication/289528785_Linear_Discriminant_Analysis (accessed on 7 May 2021).
- Jolliffe, I. Principal Components Analysis, 2nd ed.; Springer: Berlin, Germany, 2002. [Google Scholar] [CrossRef]
- Ying, X. An Overview of Overfitting and its Solutions. J. Phys. Conf. Ser. 2019. [Google Scholar] [CrossRef]
- Ghojogh, B.; Crowley, M. The Theory Behind Overfitting, Cross Validation, Regularization, Bagging, and Boosting: Tutorial. arXiv 2019, arXiv:1905.12787. [Google Scholar]
- Venkatesh, B.; Anuradha, J. A review of Feature Selection and its methods. Cybern. Inf. Technol. 2019. [Google Scholar] [CrossRef]
- Smola, A.; Vishwanathan, S. Introduction to Machine Learning; Cambridge University Press: Cambridge, MA, USA, 2008; Volume I, p. 226. [Google Scholar] [CrossRef]
- Chollet, F. Deep Learning with Python; Manning Publications Co.: Shelter Island, NY, USA, 2018; pp. 2437–2444. [Google Scholar]
- Marsland, S. Machine Learning: An Algorithmic Perspective; Chapman and Hall: London, UK, 2009; Volume 78, p. 325. [Google Scholar] [CrossRef]
- Hurwitz, J.; Kirsch, D. Machine Learning for Dummies; IBM Limited Edition; John Wiley and Sons, Inc.: Hoboken, NJ, USA, 2018. [Google Scholar]
- James, G.; Witten, D.; Hastie, T.; Tibshirani, R. An Introduction to Statistical Learning; Springer: Berlin, Germany, 2019. [Google Scholar]
- Hastie, T.; Tibshirani, R.; Friedman, J. The Elements of Statistical Learning Data Mining, Inference, and Prediction; Springer: Berlin, Germany, 2014; p. 700. [Google Scholar]
- Witten, I.; Frank, E. Data Mining Practical Macine Learning Tools and Techniques, 2nd ed.; Elsevier: Amsterdam, The Netherlands; Morgan and Claypool Publishers: San Rafael, CA, USA, 2005. [Google Scholar]
- Lindholm, A.; Wahlstrom, N.; Lindsten, F.; Schon, T.B. Supervised Machine Learning; Department of Information Technology, Uppsala University: Uppsala, Sweden, 2019; p. 112. [Google Scholar]
- Hirschmann, F. Machine Learning for the Prediction of Railway Fares; Technical University of Darmstadt: Darmstadt, Germany, 2013. [Google Scholar]
- Reddy, Y.C.A.P.; Viswanath, P.; Eswara Reddy, B. Semi-supervised learning: A brief review. Int. J. Eng. Technol. 2018, 7, 81. [Google Scholar] [CrossRef]
- Cholaquidis, A.; Fraiman, R.; Sued, M. On semi-supervised learning. TEST 2020, 29, 914–937. [Google Scholar] [CrossRef]
- Shalev-Shwartz, S.; Ben-David, S. Understanding Machine Learning: From Theory to Algorithms; Cambridge University Press: Cambridge, MA, USA, 2013. [Google Scholar] [CrossRef]
- Bloom, J.; Brink, H. Overcoming the Barriers to Production-Ready Machine Learning Workflows. In Proceedings of the Strata Conference—Making Data Work, Barcelona, Spain, 19–21 November 2014. [Google Scholar]
- Borovicka, T.; Jirina, M.; Kordik, P.; Jiri, M. Selecting Representative Data Sets. In Advances in Data Mining Knowledge Discovery and Applications; IntechOpen: Rijeka, Croatia, 2012. [Google Scholar] [CrossRef]
- Japkowicz, N.; Shah, M. Evaluating Learning Algorithms: A Classification Perspective; Cambridge University Press: Cambridge, MA, USA, 2011. [Google Scholar]
- Atamuradov, V.; Medjaher, K.; Dersin, P.; Lamoureux, B.; Zerhouni, N. Prognostics and health management for maintenance practitioners—Review, implementation and tools evaluation. Int. J. Progn. Health Manag. 2017, 8, 1–31. [Google Scholar]
- Phala, K.; Doorsamy, W.; Paul, B.S. Detection and Clustering of Neutral Section Faults Using Machine Learning Techniques for SMART Railways. In Proceedings of the 6th International Conference on Soft Computing & Machine Intelligence (ISCMI), Johannesburg, South Africa, 19–20 November 2019; pp. 1–6. [Google Scholar] [CrossRef]
- Aydin, I.; Celebi, S.B.; Barmada, S.; Tucci, M. Fuzzy integral-based multi-sensor fusion for arc detection in the pantograph-catenary system. Inst. Mech. Eng. Part F J. Rail Rapid Transit 2018, 159–170. [Google Scholar] [CrossRef]
- Guan, Q.; Wei, X.; Jia, L.; He, Y.; Zhang, H. RUL Prediction of Railway PCCS Based on Wiener Process Model with Unequal Interval Wear Data. Appl. Sci. 2020, 10, 1616. [Google Scholar] [CrossRef]
- Zhao, Y.; Liu, P.; Wang, Z.; Zhang, L.; Hong, J. Fault and defect diagnosis of battery for electric vehicles based on big data analysis methods. Appl. Energy 2017, 354–362. [Google Scholar] [CrossRef]
- Tran, M.K.; Fowler, M. A review of lithium-ion battery fault diagnostic algorithms: Current progress and future challenges. Algorithms 2020, 13, 62. [Google Scholar] [CrossRef]
- Zhou, J.; Liu, D.; Peng, Y.; Peng, X. Dynamic battery remaining useful life estimation: An on-line data-driven approach. In Proceedings of the IEEE I2MTC—International Instrumentation and Measurement Technology Conference, Proceedings, Graz, Australia, 13–16 May 2012; pp. 2196–2199. [Google Scholar] [CrossRef]
- Lin, C.P.; Cabrera, J.; Yang, F.; Ling, M.H.; Tsui, K.L.; Science, D.; Kong, H. Battery state of health modeling and remaining useful life prediction through time series model. Appl. Energy 2020, 275, 115338. [Google Scholar] [CrossRef]
- Wu, L.; Fu, X.; Guan, Y. Review of the remaining useful life prognostics of vehicle lithium-ion batteries using data-driven methodologies. Appl. Sci. 2016, 6, 166. [Google Scholar] [CrossRef]
- Chen, Z.; Li, X.; Yang, C.; Peng, T.; Yang, C.; Karimi, H.R.; Gui, W. A data-driven ground fault detection and isolation method for main circuit in railway electrical traction system. ISA Trans. 2019, 87, 264–271. [Google Scholar] [CrossRef]
- Soliman, H.; Wang, H.; Blaabjerg, F. A Review of the Condition Monitoring of Capacitors in Power Electronic Converters. IEEE Trans. Ind. Appl. 2016, 52, 4976–4989. [Google Scholar] [CrossRef]
- Imam, A.M.; Divan, D.M.; Harley, R.G.; Habetler, T.G. Real-time condition monitoring of the electrolytic capacitors for power electronics applications. In Proceedings of the Conference IEEE Applied Power Electronics Conference and Exposition (APEC), Anaheim, CA, USA, 25 February–1 March 2007; pp. 1057–1061. [Google Scholar] [CrossRef]
- Vogelsberger, M.A.; Wiesinger, T.; Ertl, H. Life-cycle monitoring and voltage-managing unit for DC-link electrolytic capacitors in PWM converters. IEEE Trans. Power Electron. 2011, 26, 493–503. [Google Scholar] [CrossRef]
- Amaral, A.M.R.; Cardoso, A.J. A simple offline technique for evaluating the condition of aluminum-electrolytic-capacitors. IEEE Trans. Ind. Electron. 2009, 56, 3230–3237. [Google Scholar] [CrossRef]
- Soliman, H.; Wang, H.; Gadalla, B.; Blaabjerg, F. Artificial Neural Network Algorithm for Condition Monitoring of DC-link Capacitors Based on Capacitance Estimation. In Proceedings of the International Conference on Power Engineering, Energy and Electrical Drives, Riga, Latvia, 11–13 May 2015; pp. 587–591. [Google Scholar] [CrossRef]
- Kamel, T.; Biletskiy, Y.; Chang, L. Capacitor aging detection for the DC filters in the power electronic converters using ANFIS algorithm. In Proceedings of the Canadian Conference on Electrical and Computer Engineering, Nova Scotia, NS, Canada, 3–6 May 2015; pp. 663–668. [Google Scholar] [CrossRef]
- Abo-khalil, A.G.; Eltamaly, A.M.; Yu, B.G. Condition Monitoring of DC-Link Electrolytic Capacitors in PWM Power Converters Using OBL Method. Sustainability 2020, 12, 3719. [Google Scholar] [CrossRef]
- Meinguet, F.; Sandulescu, P.; Aslan, B.; Lu, L.; Nguyen, N.K.; Kestelyn, X.; Semail, E. Signal-based Technique for Fault Detection and Isolation of Inverter Faults in Multi-phase Drives. In Proceedings of the International IEEE International Conference on Power Electronics, Drives and Energy Systems (PEDES), Tehran, Iran, 13–14 February 2013. [Google Scholar]
- Aguayo, J.; Claudio, A.; Vela, L.G.; Gentile, S. A survey of fault diagnosis methods for induction motors drives under inverter fault conditions. In Proceedings of the 1st International Conference on Electrical and Electronics Engineering, Acapulco, Mexico, 8–10 September 2004; pp. 367–372. [Google Scholar] [CrossRef]
- Alavi, M.; Luo, M.; Wang, D.; Zhang, D. Fault diagnosis for power electronic inverters: A model-based approach. In Proceedings of the 8th IEEE Symposium on Diagnostics for Electrical Machines, Power Electronics and Drives (SDEMPED), Bologna, Italy, 5–8 September 2011; pp. 221–228. [Google Scholar] [CrossRef]
- Murphey, Y.L.; Masrur, M.A.; Chen, Z.H.; Zhang, B. Model-based fault diagnosis in electric drives using machine learning. IEEE/ASME Trans. Mechatron. 2006. [Google Scholar] [CrossRef]
- Huang, C.; Zhao, J.; Wu, C. Data-based inverter IGBT open-circuit fault diagnosis in vector control induction motor drives. In Proceedings of the IEEE 8th Conference on Industrial Electronics and Applications (ICIEA), Melbourne, Australia, 19–21 June 2013; pp. 1039–1044. [Google Scholar] [CrossRef]
- Abul Masrur, M.; Chen, Z.; Murphey, Y. Intelligent diagnosis of open and short circuit faults in electric drive inverters for real-time applications. IET Power Electron. 2010, 279–291. [Google Scholar] [CrossRef]
- Cai, B.; Zhao, Y.; Liu, H.; Xie, M. A Data-Driven Fault Diagnosis Methodology in Three-Phase Inverters for PMSM Drive Systems. IEEE Trans. Power Electron. 2017, 5590–5600. [Google Scholar] [CrossRef]
- Wang, H.; Zhang, C.; Zhang, N.; Chen, Y.; Chen, Y. Fault Diagnosis for IGBTs Open-Circuit Faults in High-Speed Trains Based on Convolutional Neural Network. In Proceedings of the Prognostics and System Health Management Conference, Paris, France, 2–5 May 2019. [Google Scholar] [CrossRef]
- Cheng, Y.; Dong, W. Research on fault diagnosis of traction inverter based on compressed sensing and deep wavelet neural network. In Proceedings of the International Conference on Communications, Information System, and Computer Engineering (CISCE), Haikou, China, 5–7 July 2019; pp. 314–318. [Google Scholar] [CrossRef]
- Torabi, N.; Sundaram, V.M.; Toliyat, H.A. On-line fault diagnosis of multi-phase drives using self-recurrent wavelet neural networks with adaptive learning rates. In Proceedings of the Conference IEEE Applied Power Electronics Conference and Exposition (APEC), Tampa, FL, USA, 26–30 March 2017; pp. 570–577. [Google Scholar] [CrossRef]
- Xia, Y.; Gou, B.; Xu, Y.; Wilson, G. Ensemble-based Randomized Classifier for Data-driven Fault Diagnosis of IGBT in Traction Converters. In Proceedings of the International Conference on Innovative Smart Grid Technologies (ISGT), Singapore, 22–25 May 2018; pp. 74–79. [Google Scholar] [CrossRef]
- Cherif, B.D.E.; Bendiabdellah, A.; Bendjebbar, M.; Tamer, A. Neural network based fault diagnosis of three phase inverter fed vector control induction motor. Period. Polytech. Electr. Eng. Comput. Sci. 2019, 63, 295–305. [Google Scholar] [CrossRef]
- Mei, F.; Liu, N.; Miao, H.; Pan, Y.; Sha, H.; Zheng, J. On-line fault diagnosis model for locomotive traction inverter based on wavelet transform and support vector machine. Microelectron. Reliab. 2018, 1274–1280. [Google Scholar] [CrossRef]
- Chen, H.; Jiang, B.; Lu, N.; Mao, Z. Multi-mode kernel principal component analysis–based incipient fault detection for pulse width modulated inverter of China Railway High-speed 5. Adv. Mech. Eng. 2017. [Google Scholar] [CrossRef]
- Kou, L.; Liu, C.; Cai, G.W.; Zhou, J.N.; Yuan, Q.D. Data-driven design of fault diagnosis for three-phase PWM rectifier using random forests technique with transient synthetic features. IET Power Electron. 2020. [Google Scholar] [CrossRef]
- Gong, W.; Chen, H.; Zhang, Z.; Zhang, M.; Gao, H. A Data-Driven-Based Fault Diagnosis Approach for Electrical Power DC-DC Inverter by Using Modified Convolutional Neural Network with Global Average Pooling and 2-D Feature Image. IEEE Access 2020. [Google Scholar] [CrossRef]
- Li, Z.; Gao, Y.; Zhang, X.; Wang, B.; Ma, H. A Model-Data-Hybrid-Driven Diagnosis Method for Open-Switch Faults in Power Converters. IEEE Trans. Power Electron. 2020. [Google Scholar] [CrossRef]
- Gou, B.; Xu, Y.; Xia, Y.; Deng, Q.; Ge, X. An Online Data-driven Method for Simultaneous Diagnosis of IGBT and Current Sensor Fault of 3-Phase PWM Inverter in Induction Motor Drives. IEEE Trans. Power Electron. 2020. [Google Scholar] [CrossRef]
- Gangsar, P.; Tiwari, R. Signal based condition monitoring techniques for fault detection and diagnosis of induction motors: A state-of-the-art review. Mech. Syst. Signal Process. 2020. [Google Scholar] [CrossRef]
- Henao, H.; Capolino, G.A.; Fernandez-Cabanas, M.; Filippetti, F.; Bruzzese, C.; Strangas, E.; Pusca, R.; Estima, J.; Riera-Guasp, M.; Hedayati-Kia, S. Trends in fault diagnosis for electrical machines: A review of diagnostic techniques. IEEE Ind. Electron. Mag. 2014, 31–42. [Google Scholar] [CrossRef]
- Seera, M.; Lim, C.P.; Nahavandi, S.; Loo, C.K. Condition monitoring of induction motors: A review and an application of an ensemble of hybrid intelligent models. Expert Syst. Appl. 2014. [Google Scholar] [CrossRef]
- Gritli, Y. Diagnosis and Fault Detection in Electrical Machines and Drives based on Advanced Signal Processing Techniques. Ph.D. Thesis, Alma Mater Studiorum, Università di Bologna, Bologna, Italy, 2014. [Google Scholar]
- Sin, M.; Soong, W.; Ertugrul, N. Induction Machine Online condition monitoring and fault diagnosis—A survey. In Proceedings of the Australasian Universities Power Engineering Conference, Christchurch, New Zealand, 28 September–1 October 2003. [Google Scholar]
- Gandhi, A.; Corrigan, T.; Parsa, L. Recent advances in modeling and online detection of stator interturn faults in electrical motors. IEEE Trans. Ind. Electron. 2011. [Google Scholar] [CrossRef]
- De Angelo, C.; Bossio, G.; Giaccone, S.; García, G.O.; Solsona, J.; Valla, M.I. Model based stator fault detection in induction motors. In Proceedings of the IECON Proceedings (Industrial Electronics Conference), Paris, France, 7–10 November 2006. [Google Scholar] [CrossRef]
- De Angelo, C.H.; Bossio, G.R.; Giaccone, S.J.; Valla, M.I.; Solsona, J.A.; García, G.O. Online model-based stator-fault detection and identification in induction motors. IEEE Trans. Ind. Electron. 2009. [Google Scholar] [CrossRef]
- Adouni, A.; Ben Hamed, M.; Sbita, L. Application of parity space approach in fault detection of DC motors. In Proceedings of the 1st International Conference on Renewable Energies and Vehicular Technology (REVET), Hammamet, Tunisia, 26–28 March 2012; pp. 446–451. [Google Scholar] [CrossRef]
- Karami, F.; Poshtan, J.; Poshtan, M. Model-based fault detection in induction Motors. In Proceedings of the IEEE International Conference on Control Applications, Yokohama, Japan, 8–10 September 2010. [Google Scholar] [CrossRef]
- Ghate, V.N.; Dudul, S.V. Cascade neural-network-based fault classifier for three-phase induction motor. IEEE Trans. Ind. Electron. 2011. [Google Scholar] [CrossRef]
- Silva, A.A.; Bazzi, A.M.; Gupta, S. Wavelet-based Information Filtering for Fault Diagnosis of Electric Drive Systems in Electric Ships. In Proceedings of the IEEE International Electric Machines and Drives Conference (IEMDC), Chicago, IL, USA, 12–15 May 2013. [Google Scholar] [CrossRef]
- Panigrahy, P.S.; Konar, P.; Chattopadhyay, P. Application of data mining in fault diagnosis of induction motor. In Proceedings of the IEEE 1st International Conference on Control, Measurement and Instrumentation, Kolkata, India, 8–10 January 2016. [Google Scholar] [CrossRef]
- AlShorman, O.; Alkahatni, F.; Masadeh, M.; Irfan, M.; Glowacz, A.; Althobiani, F.; Kozik, J.; Glowacz, W. Sounds and acoustic emission-based early fault diagnosis of induction motor: A review study. Adv. Mech. Eng. 2021. [Google Scholar] [CrossRef]
- Glowacz, A. Acoustic based fault diagnosis of three-phase induction motor. Appl. Acoust. 2018. [Google Scholar] [CrossRef]
- Glowacz, A.; Glowacz, Z. Diagnosis of the three-phase induction motor using thermal imaging. Infrared Phys. Technol. 2017. [Google Scholar] [CrossRef]
- Shao, S.Y.; Sun, W.J.; Yan, R.Q.; Wang, P.; Gao, R.X. A Deep Learning Approach for Fault Diagnosis of Induction Motors in Manufacturing. Chin. J. Mech. Eng. (Engl. Ed.) 2017. [Google Scholar] [CrossRef]
- Shao, S.; McAleer, S.; Yan, R.; Baldi, P. Highly Accurate Machine Fault Diagnosis Using Deep Transfer Learning. IEEE Trans. Ind. Inform. 2019. [Google Scholar] [CrossRef]
- Sun, W.; Shao, S.; Zhao, R.; Yan, R.; Zhang, X.; Chen, X. A sparse auto-encoder-based deep neural network approach for induction motor faults classification. Meas. J. Int. Meas. Confed. 2016. [Google Scholar] [CrossRef]
- Shao, S.; Yan, R.; Lu, Y.; Wang, P.; Gao, R. DCNN-based Multi-signal Induction Motor Fault Diagnosis. IEEE Trans. Instrum. Meas. 2019. [Google Scholar] [CrossRef]
- Lee, Y.O.; Jo, J.; Hwang, J. Application of deep neural network and generative adversarial network to industrial maintenance: A case study of induction motor fault detection. In Proceedings of the IEEE International Conference on Big Data, Boston, MA, USA, 11–14 December 2017. [Google Scholar] [CrossRef]
- Gou, X.; Bian, C.; Zeng, F.; Xu, Q.; Wang, W.; Yang, S. A Data-Driven Smart Fault Diagnosis Method for Electric Motor. In Proceedings of the IEEE 18th International Conference on Software Quality, Reliability, and Security Companion, Lisbon, Portugal, 16–20 July 2018. [Google Scholar] [CrossRef]
- Martin-Diaz, I.; Morinigo-Sotelo, D.; Duque-Perez, O.; Romero-Troncoso, R.J. An Experimental Comparative Evaluation of Machine Learning Techniques for Motor Fault Diagnosis under Various Operating Conditions. IEEE Trans. Ind. Appl. 2018. [Google Scholar] [CrossRef]
- Godoy, W.F.; da Silva, I.N.; Goedtel, A.; Palácios, R.H.C.; Lopes, T.D. Application of intelligent tools to detect and classify broken rotor bars in three-phase induction motors fed by an inverter. IET Electr. Power Appl. 2016. [Google Scholar] [CrossRef]
- Roland, U.; Eseosa, O. Artificial Intelligent Techniques In Real-Time Diagnosis Of Stator And Rotor Faults In Induction Machines. Int. J. Sci. Eng. Res. 2014, 5, 946–954. [Google Scholar]
- Sun, W.; Zhao, R.; Yan, R.; Shao, S.; Chen, X. Convolutional Discriminative Feature Learning for Induction Motor Fault Diagnosis. IEEE Trans. Ind. Inform. 2017. [Google Scholar] [CrossRef]
- Han, J.H.; Choi, D.J.; Hong, S.K.; Kim, H.S. Motor Fault Diagnosis Using CNN Based Deep Learning Algorithm Considering Motor Rotating Speed. In Proceedings of the IEEE 6th International Conference on Industrial Engineering and Applications (ICIEA 2019), Tokyo, Japan, 26–29 April 2019. [Google Scholar] [CrossRef]
- Saucedo-Dorantes, J.J.; Delgado-Prieto, M.; Osornio-Rios, R.A.; De Jesus Romero-Troncoso, R. Multifault Diagnosis Method Applied to an Electric Machine Based on High-Dimensional Feature Reduction. IEEE Trans. Ind. Appl. 2017. [Google Scholar] [CrossRef]
- Martins, J.F.; Pires, V.F.; Pires, A.J. Unsupervised neural-network-based algorithm for an on-line diagnosis of three-phase induction motor stator fault. IEEE Trans. Ind. Electron. 2007. [Google Scholar] [CrossRef]
- Alwan, H.O.; Farhan, N.M.; Sabbagh, Q.S.A. Detection of Static Air-Gap Eccentricity in Three Phase induction Motor by Using Artificial Neural Network (ANN). Int. J. Eng. Res. Appl. 2017. [Google Scholar] [CrossRef]
- Langarica, S.; Ruffelmacher, C.; Nunez, F. An Industrial Internet Application for Real-Time Fault Diagnosis in Industrial Motors. IEEE Trans. Autom. Sci. Eng. 2019. [Google Scholar] [CrossRef]
- Dineva, A.; Mosavi, A.; Gyimesi, M.; Vajda, I.; Nabipour, N. Fault Diagnosis of Rotating Electrical Machines Using Multi-Label Classification. Appl. Sci. 2019, 9, 5086. [Google Scholar] [CrossRef]
- Chai, S.; Li, X.I.; Jia, Y.; He, Y.; Yip, C.H.; Cheung, K.K.; Wang, M. A Non-Intrusive Deep Learning Based Diagnosis System for Elevators. IEEE Access 2021, 9. [Google Scholar] [CrossRef]
- Xiao, D.; Qin, C.; Yu, H.; Huang, Y.; Liu, C. Unsupervised deep representation learning for motor fault diagnosis by mutual information maximization. J. Intell. Manuf. 2020. [Google Scholar] [CrossRef]
- Swana, E.; Doorsamy, W. An Unsupervised Learning Approach to Condition Assessment on a Wound-Rotor Induction Generator. Energies 2021, 14, 602. [Google Scholar] [CrossRef]
- Skowron, M.; Orlowska-Kowalska, T.; Wolkiewicz, M.; Kowalski, C.T. Convolutional neural network-based stator current data-driven incipient stator fault diagnosis of inverter-fed induction motor. Energies 2020, 13, 1475. [Google Scholar] [CrossRef]
- Glowacz, A. Ventilation diagnosis of angle grinder using thermal imaging. Sensors 2021, 21, 2853. [Google Scholar] [CrossRef] [PubMed]
- Zhang, S.; Zhang, S.; Wang, B.; Habetler, T.G. Machine Learning and Deep Learning Algorithms for Bearing Fault Diagnostics—A Comprehensive Review. arXiv 2019, arXiv:1901.08247. [Google Scholar]
- Hamadache, M.; Jung, J.H.; Park, J.; Youn, B.D. A comprehensive review of artificial intelligence-based approaches for rolling element bearing PHM: Shallow and deep learning. JMST Adv. 2019. [Google Scholar] [CrossRef]
- Saufi, S.R.; Ahmad, Z.A.B.; Leong, M.S.; Lim, M.H. Challenges and opportunities of deep learning models for machinery fault detection and diagnosis: A review. IEEE Access 2019, 29, 122644–122662. [Google Scholar] [CrossRef]
- Zhao, Z.; Li, T.; Wu, J.; Sun, C.; Wang, S.; Yan, R.; Chen, X. Deep Learning Algorithms for Rotating Machinery Intelligent Diagnosis: An Open Source Benchmark Study. ISA Trans. 2020, 107, 224–255. [Google Scholar] [CrossRef]
- Konar, P.; Chattopadhyay, P. Bearing fault detection of induction motor using wavelet and Support Vector Machines (SVMs). Appl. Soft Comput. J. 2011. [Google Scholar] [CrossRef]
- Harlisca, C.; Bouchareb, I.; Frosini, L.; Szabo, L. Induction machine bearing faults detection based on artificial neural network. In Proceedings of the CINTI 14th IEEE International Symposium on Computational Intelligence and Informatics, Budapest, Hungary, 19–21 November 2013. [Google Scholar] [CrossRef]
- Prieto, M.D.; Cirrincione, G.; Espinosa, A.G.; Ortega, J.A.; Henao, H. Bearing fault detection by a novel condition-monitoring scheme based on statistical-time features and neural networks. IEEE Trans. Ind. Electron. 2013. [Google Scholar] [CrossRef]
- Zhang, W.; Li, C.; Peng, G.; Chen, Y.; Zhang, Z. A deep convolutional neural network with new training methods for bearing fault diagnosis under noisy environment and different working load. Mech. Syst. Signal Process. 2018. [Google Scholar] [CrossRef]
- Zhang, Y.; Xing, K.; Bai, R.; Sun, D.; Meng, Z. An enhanced convolutional neural network for bearing fault diagnosis based on time–frequency image. Meas. J. Int. Meas. Confed. 2020. [Google Scholar] [CrossRef]
- Tan, J.; Lu, W.; An, J.; Wan, X. Fault diagnosis method study in roller bearing based on wavelet transform and stacked auto-encoder. In Proceedings of the 27th Chinese Control and Decision Conference (CCDC), Qingdao, China, 13–25 May 2015. [Google Scholar] [CrossRef]
- Pham, M.T.; Kim, J.M.; Kim, C.H. Intelligent fault diagnosis method using acoustic emission signals for bearings under complex working conditions. Appl. Sci. 2020, 10, 7068. [Google Scholar] [CrossRef]
- Zhiyi, H.; Haidong, S.; Xiang, Z.; Yu, Y.; Junsheng, C. An intelligent fault diagnosis method for rotor-bearing system using small labeled infrared thermal images and enhanced CNN transferred from CAE. Adv. Eng. Inform. 2020. [Google Scholar] [CrossRef]
- Fumeo, E.; Oneto, L.; Anguita, D. Condition based maintenance in railway transportation systems based on big data streaming analysis. Procedia Comput. Sci. 2015. [Google Scholar] [CrossRef]
- Loutas, T.H.; Roulias, D.; Georgoulas, G. Remaining useful life estimation in rolling bearings utilizing data-driven probabilistic E-support vectors regression. IEEE Trans. Reliab. 2013. [Google Scholar] [CrossRef]
- Qiu, G.; Gu, Y.; Cai, Q. A deep convolutional neural networks model for intelligent fault diagnosis of a gearbox under different operational conditions. Meas. J. Int. Meas. Confed. 2019. [Google Scholar] [CrossRef]
- Chen, Z.; Gryllias, K.; Liu, C.; Li, W. Gearbox fault diagnosis using convolutional neural networks and support vector machines. In Proceedings of the 27th European Signal Process Conference, A Coruña, Spain, 2–6 September 2019. [Google Scholar] [CrossRef]
- Pandarakone, S.E.; Mizuno, Y.; Nakamura, H. A Comparative Study between Machine Learning Algorithm and Artificial Intelligence Neural Network in Detecting Minor Bearing Fault of Induction Motors. Energies 2019, 12, 2105. [Google Scholar] [CrossRef]
- Zhang, C.; Zhang, Y.; Hu, C.; Liu, Z.; Cheng, L.; Zhou, Y. A Novel Intelligent Fault Diagnosis Method Based on Variational Mode Decomposition and Ensemble Deep Belief Network. IEEE Access 2020. [Google Scholar] [CrossRef]
- Lei, Y.; Jia, F.; Lin, J.; Xing, S.; Ding, S.X. An Intelligent Fault Diagnosis Method Using Unsupervised Feature Learning Towards Mechanical Big Data. IEEE Trans. Ind. Electron. 2016. [Google Scholar] [CrossRef]
- Eren, L. Bearing fault detection by one-dimensional convolutional neural networks. Math. Probl. Eng. 2017. [Google Scholar] [CrossRef]
- Choudhary, A.; Shimi, S.L.; Akula, A. Bearing fault diagnosis of induction motor using thermal imaging. In Proceedings of the 2018 International Conference on Computing, Power and Communication Technologies (GUCON), Greater Noida, India, 28–29 September 2018. [Google Scholar] [CrossRef]
- Sakaidani, Y.; Kondo, M. Bearing Fault Detection for Railway Traction Motors Through Leakage Current. In Proceedings of the 2018 23rd International Conference on Electrical Machine, Alexandroupoli, Greece, 3–6 September 2018. [Google Scholar] [CrossRef]
- Dou, D.; Zhou, S. Comparison of four direct classification methods for intelligent fault diagnosis of rotating machinery. Appl. Soft Comput. J. 2016. [Google Scholar] [CrossRef]
- Qiao, M.; Yan, S.; Tang, X.; Xu, C. Deep Convolutional and LSTM Recurrent Neural Networks for Rolling Bearing Fault Diagnosis under strong noises and variable loads. IEEE Access 2020. [Google Scholar] [CrossRef]
- Jia, F.; Lei, Y.; Lin, J.; Zhou, X.; Lu, N. Deep neural networks: A promising tool for fault characteristic mining and intelligent diagnosis of rotating machinery with massive data. Mech. Syst. Signal Process. 2016. [Google Scholar] [CrossRef]
- Islam, M.R.; Kim, Y.H.; Kim, J.Y.; Kim, J.M. Detecting and learning unknown fault states by automatically finding the optimal number of clusters for online bearing fault diagnosis. Appl. Sci. 2019, 9, 2326. [Google Scholar] [CrossRef]
- Lei, Y.; He, Z.; Zi, Y. EEMD method and WNN for fault diagnosis of locomotive roller bearings. Expert Syst. Appl. 2011. [Google Scholar] [CrossRef]
- Lu, C.; Wang, Z.Y.; Qin, W.L.; Ma, J. Fault diagnosis of rotary machinery components using a stacked denoising autoencoder-based health state identification. Signal Process. 2017. [Google Scholar] [CrossRef]
- Zhang, X.; Wang, B.; Chen, X. Intelligent fault diagnosis of roller bearings with multivariable ensemble-based incremental support vector machine. Knowl. Based Syst. 2015. [Google Scholar] [CrossRef]
- Duong, B.P.; Kim, J.Y.; Jeong, I.; Im, K.; Kim, C.H.; Kim, J.M. A Deep-Learning-Based Bearing Fault Diagnosis Using Defect Signature Wavelet Image Visualization. Appl. Sci. 2020, 10, 8800. [Google Scholar] [CrossRef]
- Liu, H.; Yao, D.; Yang, J.; Li, X. Lightweight convolutional neural network and its application in rolling bearing fault diagnosis under variable working conditions. Sensors 2019, 19, 4827. [Google Scholar] [CrossRef] [PubMed]
- Chen, Z.; Li, W. Multisensor feature fusion for bearing fault diagnosis using sparse autoencoder and deep belief network. IEEE Trans. Instrum. Meas. 2017. [Google Scholar] [CrossRef]
- Mehta, A.; Goyal, D.; Choudhary, A.; Pabla, B.S.; Belghith, S. Machine Learning-Based Fault Diagnosis of Self-Aligning Bearings for Rotating Machinery Using Infrared Thermography. Math. Probl. Eng. 2021. [Google Scholar] [CrossRef]
- Wang, H.; Yu, Z.; Guo, L. Real-time Online Fault Diagnosis of Rolling Bearings Based on KNN Algorithm. J. Phys. Conf. Ser. 2020. [Google Scholar] [CrossRef]
- Lu, D.; Qiao, W. Adaptive feature extraction and SVM classification for real-time fault diagnosis of drivetrain gearboxes. In Proceedings of the IEEE Energy Conversion Congress and Exposition, Denver, CO, USA, 15–19 September 2013. [Google Scholar] [CrossRef]
- Yao, Y.; Wang, H.; Li, S.; Liu, Z.; Gui, G.; Dan, Y.; Hu, J. End-to-end convolutional neural network model for gear fault diagnosis based on sound signals. Appl. Sci. 2018, 8, 1584. [Google Scholar] [CrossRef]
- Toma, R.N.; Prosvirin, A.E.; Kim, J.M. Bearing fault diagnosis of induction motors using a genetic algorithm and machine learning classifiers. Sensors 2020, 20, 1884. [Google Scholar] [CrossRef] [PubMed]
- Arellano-Espitia, F.; Delgado-Prieto, M.; Martinez-Viol, V.; Saucedo-Dorantes, J.J.; Osornio-Rios, R.A. Deep-learning-based methodology for fault diagnosis in electromechanical systems. Sensors 2020, 20, 3949. [Google Scholar] [CrossRef]
- Sikder, N.; Mohammad Arif, A.S.; Islam, M.M.; Nahid, A.A. Induction Motor Bearing Fault Classification Using Extreme Learning Machine Based on Power Features. Arabian J. Sci. Eng. 2021. [Google Scholar] [CrossRef]
- Chen, H.; Jiang, B.; Lu, N. Data-Driven Incipient Sensor Fault Estimation with Application in Inverter of High-Speed Railway. Math. Probl. Eng. 2017. [Google Scholar] [CrossRef]
- Chen, H.; Jiang, B.; Chen, W.; Yi, H. Data-driven Detection and Diagnosis of Incipient Faults in Electrical Drives of High-Speed Trains. IEEE Trans. Ind. Electron. 2019, 4716–4725. [Google Scholar] [CrossRef]
- Gou, B.; Xu, Y.; Xia, Y.; Wilson, G.; Liu, S. An Intelligent Time-adaptive Data-driven Method for Sensor Fault Diagnosis in Induction Motor Drive System. IEEE Trans. Ind. Electron. 2018. [Google Scholar] [CrossRef]
- Daelemans, W. Fault Diagnosis in Electric Drives Using Machine Learning Approaches. In Proceedings of the International Electric Machines & Drives Conference, Chicago, IL, USA, 12–15 May 2013. [Google Scholar] [CrossRef]
- Melia, T.; Cooke, A.; Grayson, S. Machine learning techniques for automatic sensor fault detection in Airborne SHM Networks. In Proceedings of the 8th European Workshop on Structural Health Monitoring (EWSHM), Bilbao, Spain, 5–8 July 2016. [Google Scholar]
- Jan, S.U.; Lee, Y.D.; Shin, J.; Koo, I. Sensor Fault Classification Based on Support Vector Machine and Statistical Time-Domain Features. IEEE Access 2017. [Google Scholar] [CrossRef]
- Chen, H.; Jiang, B.; Lu, N. A Multi-mode Incipient Sensor Fault Detection and Diagnosis Method for Electrical Traction Systems. Int. J. Control Autom. Syst. 2018. [Google Scholar] [CrossRef]
- Dybkowski, M.; Klimkowski, K. Artificial neural network application for current sensors fault detection in the vector controlled induction motor drive. Sensors 2019, 3, 571. [Google Scholar] [CrossRef] [PubMed]
- Chen, H.; Jiang, B.; Zhang, T.; Lu, N. Data-driven and deep learning-based detection and diagnosis of incipient faults with application to electrical traction systems. Neurocomputing 2019. [Google Scholar] [CrossRef]
- Chen, H.; Jiang, B.; Lu, N.; Mao, Z. Deep PCA based real-time incipient fault detection and diagnosis methodology for electrical drive in high-speed trains. IEEE Trans. Veh. Technol. 2018. [Google Scholar] [CrossRef]
- Chen, H.; Jiang, B.; Ding, S.X.; Lu, N.; Chen, W. Probability-Relevant Incipient Fault Detection and Diagnosis Methodology with Applications to Electric Drive Systems. IEEE Trans. Control Syst. Technol. 2018. [Google Scholar] [CrossRef]
- Xia, Y.; Gou, B.; Xu, Y. A Data-Driven Method for Current Sensor Fault Diagnosis in Single-Phase PWM Rectifier. In Proceedings of the 9th International Conference on Power and Energy Systems (ICPES 2019), Perth, Australia, 10–12 December 2019. [Google Scholar] [CrossRef]
- Xia, Y.; Xu, Y.; Gou, B. Current sensor fault diagnosis and faulttolerant control for single-phase PWM rectifier based on a hybrid model-based and datadriven method. IET Power Electron. 2020. [Google Scholar] [CrossRef]


Publisher’s Note: MDPI stays neutral with regard to jurisdictional claims in published maps and institutional affiliations. |
© 2021 by the authors. Licensee MDPI, Basel, Switzerland. This article is an open access article distributed under the terms and conditions of the Creative Commons Attribution (CC BY) license (https://creativecommons.org/licenses/by/4.0/).