
Non-Invasive Monitoring of Ethanol and Methanol Levels in Grape-Derived Pisco Distillate by Vibrational Spectroscopy

 ,
,  ,
, 
Abstract
:1. Introduction
2. Materials and Methods
2.1. Determination of Ethanol and Methanol Concentrations by GC–MS
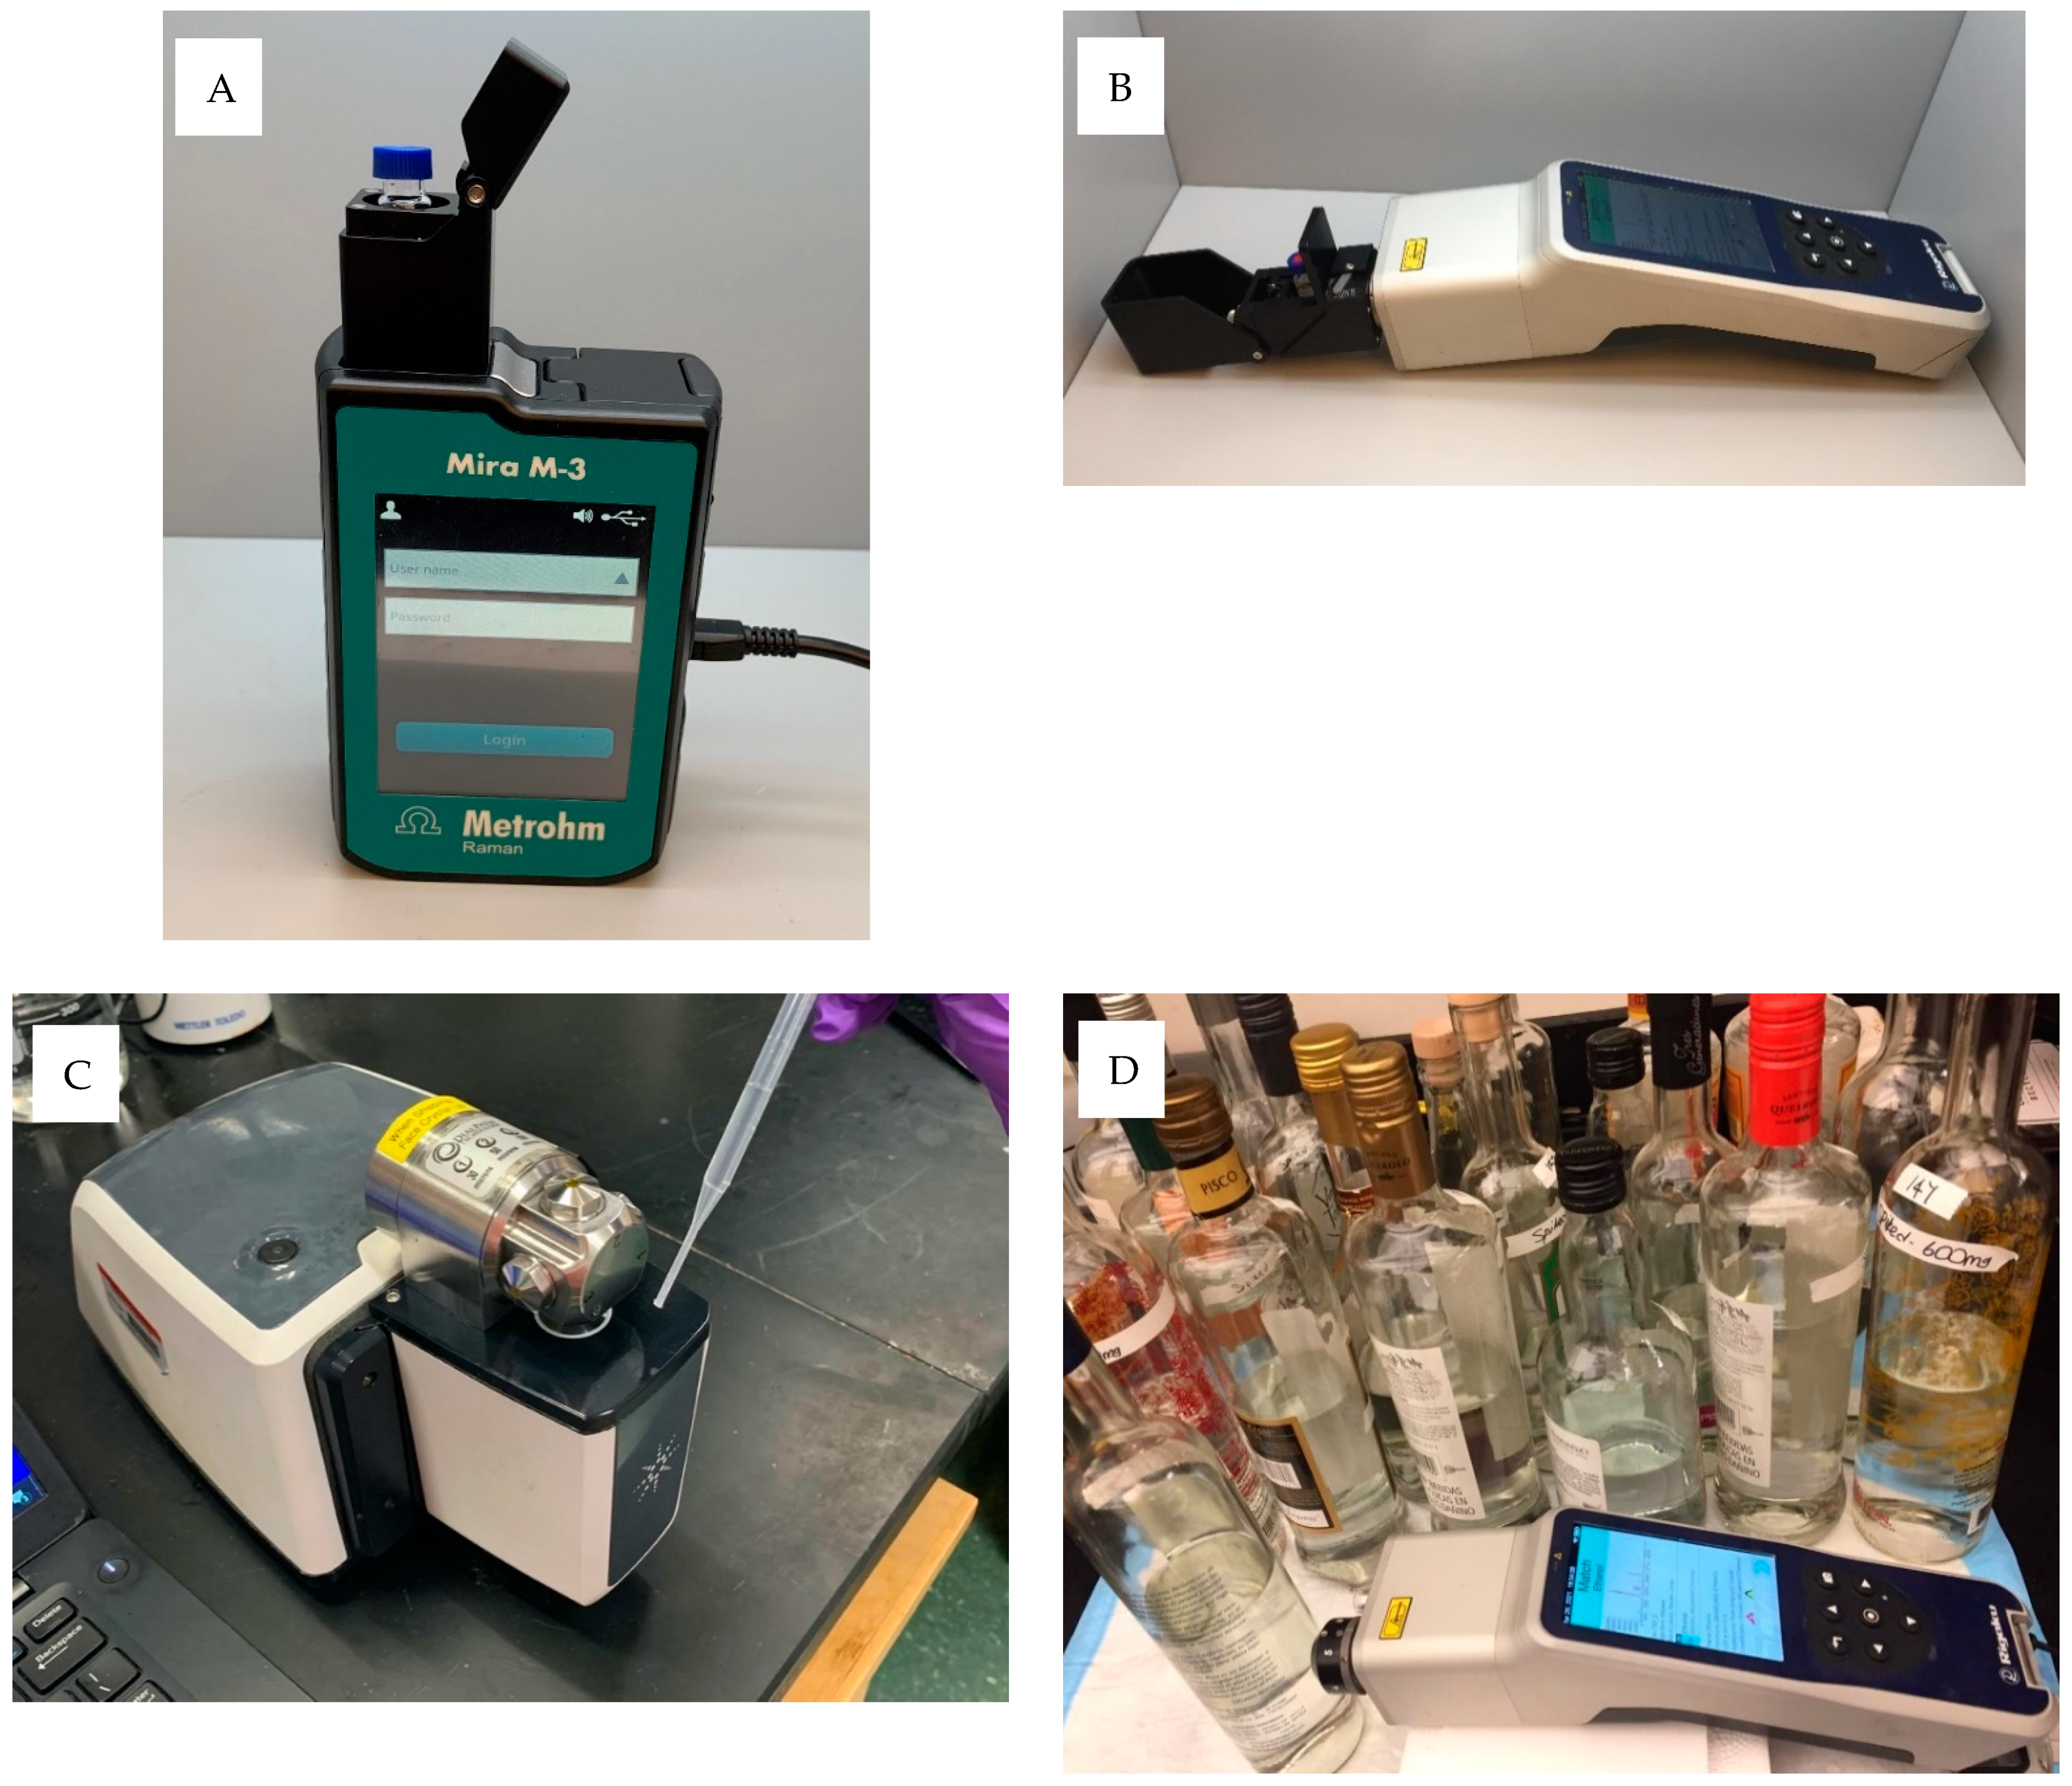
2.2. Vibrational Spectroscopy
2.3. Methanol Spiking and Spectroscopy Measurements
2.4. Partial Least-Squares Regression (PLSR)
3. Results and Discussion
3.1. Quantification of Methanol and Ethanol Content with Reference Analysis
3.2. Spectral Information
3.3. Quantification of Methanol and Ethanol Content with Validated Regression Models
3.4. Quantification of Methanol and Ethanol Content through the Bottles
4. Conclusions
Author Contributions
Funding
Institutional Review Board Statement
Informed Consent Statement
Data Availability Statement
Acknowledgments
Conflicts of Interest
References
- Ellis, D.I.; Muhamadali, H.; Xu, Y.; Eccles, R.; Goodall, I.; Goodacre, R. Rapid through-container detection of fake spirits and methanol quantification with handheld Raman spectroscopy. Analyst 2019, 144, 324–330. [Google Scholar] [CrossRef]
- Garcia-Lomillo, H.; Gonzalez-Sanjose, M.L.; Pino-Garcia, R.D.; Rivero-Perez, M.D.; Muniz-Rodriguez, P. Antioxidant and Antimicrobial Properties of Wine Byproducts and Their Potential Uses in the Food Industry. J. Agric. Food Chem. 2014, 62, 12595–12602. [Google Scholar] [CrossRef] [PubMed] [Green Version]
- Markechová, D.; Májek, P.; Sádecká, J. Fluorescence spectroscopy and multivariate methods for the determination of brandy adulteration with mixed wine spirit. Food Chem. 2014, 159, 193–199. [Google Scholar] [CrossRef]
- Jackson, R.S. Chemical constituents of grapes and wine. In Wine Science: Principles and Applications; Academic Press: Cambridge, MA, USA, 2008. [Google Scholar]
- Tsakiris, A.; Kallithraka, S.; Kourkoutas, Y. Grape brandy production, composition and sensory evaluation. J. Sci. Food Agric. 2014, 94, 404–414. [Google Scholar] [CrossRef] [PubMed]
- Vallejos, L.H. Historia de la producción de vinos y piscos en el Perú. Universum 2004, 19, 44–61. [Google Scholar]
- Cacho, J.; Moncayo, L.; Palma, J.C.; Ferreira, V.; Cullere, L. The Influence of Different Production Processes on the Aromatic Composition of Peruvian Piscos. J. Nutr. Food Sci. 2013, 3, 245. [Google Scholar]
- Hatta-Sakoda, B.; Universidad Nacional Agraria La Molina, Lima, Peru. Personal communication, 2018.
- Nagarajan, R.; Mehrotra, R.; Bajaj, M.M. Quantitative analysis of methanol, an adulterant in alcoholic beverages, using attenuated total reflectance spectroscopy. J. Sci. Ind. Res. 2006, 65, 416–419. [Google Scholar]
- Crocombe, R.A. Portable Spectroscopy. Appl. Spectrosc. 2018, 72, 1701–1751. [Google Scholar] [CrossRef]
- Haas, J.; Mizaikoff, B. Advances in Mid-Infrared Spectroscopy for Chemical Analysis. Annu. Rev. Anal. Chem. 2016, 9, 45–68. [Google Scholar] [CrossRef]
- Wu, H.; Qian, J.; Bergles, E.; Chandler, L. A Portable Multiexcitation Dispersive Raman Spectrometer for Environmental Analysis; BaySpec Inc.: San Jose, CA, USA, 2013. [Google Scholar]
- Vaskova, H. Spectroscopic Determination of Methanol Content in Alcoholic Drinks. Int. J. Biol. Biomed. Eng. 2014, 8, 27–34. [Google Scholar]
- Czech Agriculture and Food Inspection Authority. 2012. Available online: https://www.szpi.gov.cz/docDetail.aspx?docid=1042485&docTy%20pe=ART&nid=11913 (accessed on 1 July 2021).
- INDECOPI. Reglamento de la Denominacion de origen Pisco. Available online: www.indecopi.gob.pe (accessed on 22 July 2019).
- Wold, S.; Martens, H.; Wold, H. The multivariate calibration problem in chemistry solved by PLS method. In Matrix Pencils; Lectures Notes in Mathematics; Ruhe, A., Kågström, B., Eds.; Springer: Berlin/Heidelberg, Germany, 1983. [Google Scholar]
- Geladi, P.; Kowalski, B.R. Partial Least-Squares Regression: A Tutorial. Anal. Chim. Acta 1986, 185, 1–17. [Google Scholar] [CrossRef]
- Martens, H.; Naes, T. Multivariate Calibration; John Wiley & Sons: Chichester, UK, 1991; p. 419. [Google Scholar]
- Biancolillo, A.; Marii, F. Chemometric methods for spectroscopy-based pharmaceutical analysis. Front. Chem. 2018, 6, 576. [Google Scholar] [CrossRef]
- Beganovic, A.; Hawthorne, L.M.; Bach, K.; Huck, C.W. Critical Review on the Utilization of Handheld and Portable Raman Spectrometry in Meat Science. Foods 2019, 8, 49. [Google Scholar] [CrossRef] [Green Version]
- Boysworth, M.C.; Booksh, K.S. Aspects of Multivariate Calibration Applied to Near-Infrared Spectroscopy. In Handbook of Near-Infrared Analysis, 3rd ed.; CRC Press: Boca Raton, FL, USA, 2007. [Google Scholar]
- Gschaedler-Mathis, A.C.; Acevedo, F.; Aroca, G. Tequila and Pisco. In Current Developments in Biotechnology and Bioengineering: Food and Beverages Industry; Elsevier: Amsterdam, The Netherlands, 2017. [Google Scholar] [CrossRef]
- Harrigan, T.M. Standards of Identity for Pisco and Cognac; Depeartment of Treasury Alcohol and Tobacco Tax and Trade Bureau 27 CFR: Washington, DC, USA, 2013; Volume 78. [Google Scholar]
- Paine, A.J.; Dayan, A.D. Defining a tolerable concentration of methanol in alcoholic drinks. Hum. Exp. Toxicol. 2001, 20, 563–568. [Google Scholar] [CrossRef]
- Kiefer, J.; Kiefer, L. Whisky Analysis with Raman Spectroscopy in the Near-Infrared Spectral Range: Comparison of 785– and 1064–nm Excitation. Spectroscopy 2020, 35, 37–41. [Google Scholar]
- Pappas, C.; Marianthi, B.; Konstantinou, E.; Proxenia, N.; Kallithraka, S.; Kotseridis, Y.; Taranilis, P.A. Evaluation of a raman spectroscopic method for the determination of alcohol content in greek spirit tsipouro. Curr. Res. Nutr. Food Sci. 2016, 4, 1–9. [Google Scholar] [CrossRef]
- Boyaci, I.H.; Genis, H.E.; Guven, B.; Tamer, U.; Alper, N. A novel method for quantification of ethanol and methanol in distilled alcoholic beverages using Raman spectroscopy. J. Raman Spectrosc. 2011, 43, 1171–1176. [Google Scholar] [CrossRef]
- Coldea, T.E.; Socaciu, C.; Fetea, F.; Ranga, F.; Pop, R.M.; Florea, M. Rapid quantitative analysis of ethanol and prediction of methanol content in traditional fruit brandies from romania, using FTIR spectroscopy and chemometrics. Not. Bot. Horti Agrobot. Cluj-Napoca 2013, 41, 143–149. [Google Scholar] [CrossRef] [Green Version]
- Yucesoy, D.; Ozen, B. Authentication of a Turkish traditional aniseed flavoured distilled spirit, raki. Food Chem. 2013, 141, 1461–1465. [Google Scholar] [CrossRef] [Green Version]
- Anjos, O.; Santos, A.J.A.; Estevinho, L.M.; Caldeira, I. FTIR-ATR spectroscopy applied to quality control of grape-derived spirits. Food Chem. 2016, 205, 28–35. [Google Scholar] [CrossRef] [Green Version]
- Teixeira dos Santos, C.A.; Páscoa, R.N.M.J.; Porto, P.A.L.S.; Cerdeira, A.L.; González-Sáiz, J.M.; Pizarro, C.; Lopes, J.A. Raman spectroscopy for wine analyses: A comparison with near and mid infrared spectroscopy. Talanta 2018, 186, 306–314. [Google Scholar] [CrossRef] [PubMed]
- Ellis, D.I.; Eccles, R.; Xu, Y.; Griffen, J.; Muhamadali, H.; Matousek, P.; Goodacre, R. Through-container, extremely low concentration detection of multiple chemical markers of counterfeit alcohol using a handheld SORS device. Sci. Rep. 2017, 7, 12082. [Google Scholar] [CrossRef] [PubMed]
- Kiefer, J.; Cromwell, A.L. Analysis of single malt Scotch whisky using Raman spectroscopy. Anal. Methods 2017, 9, 511–518. [Google Scholar] [CrossRef]


| Technique | Parameter | Calibration Model | External Validation Model | |||||||
|---|---|---|---|---|---|---|---|---|---|---|
| Range | N a | Factor | SECV b | Rcv c | Range | n d | SEP e | RPre f | ||
| FT-IR | Methanol | 18.1–45.2 | 124 | 2 | 2.5 | 0.90 | 22.0–41.4 | 31 | 2.3 | 0.88 |
| Ethanol | 21.1–43.8 | 124 | 3 | 1.0 | 0.97 | 30.3–41.6 | 31 | 1.0 | 0.96 | |
| Raman Mira M3 (785 nm) | Methanol | 18.6–45.8 | 131 | 3 | 2.4 | 0.89 | 22.0–41.4 | 33 | 2.3 | 0.86 |
| Ethanol | 7.0–44.9 | 136 | 2 | 1.4 | 0.97 | 27.2–42.0 | 34 | 1.4 | 0.94 | |
| Raman Progeny Rigaku (1064 nm) | Methanol | 2.4–48.3 | 135 | 3 | 2.5 | 0.94 | 22.2–44.4 | 34 | 1.8 | 0.93 |
| Ethanol | 7.0–44.9 | 132 | 2 | 1.3 | 0.97 | 27.2–41.6 | 33 | 1.2 | 0.95 | |
| Environment | Parameter | Calibration Model | External Validation Model | |||||||
|---|---|---|---|---|---|---|---|---|---|---|
| Range | N a | Factor | SECV b | Rcv c | Range | n d | SEP e | RPre f | ||
| Reading from Glass Vial | Methanol | 10.3–2475.7 | 142 | 3 | 110 | 0.98 | 16.0–2543.9 | 36 | 103.0 | 0.99 |
| Reading from Bottle | Methanol | 10.3–2836.6 | 50 | 4 | 123.8 | 0.98 | 23.9–1441.9 | 13 | 97.7 | 0.97 |
| Ethanol | 28.4–41.3 | 50 | 6 | 0.97 | 0.95 | 34.8–42.2 | 13 | 0.78 | 0.94 | |
Publisher’s Note: MDPI stays neutral with regard to jurisdictional claims in published maps and institutional affiliations. |
© 2021 by the authors. Licensee MDPI, Basel, Switzerland. This article is an open access article distributed under the terms and conditions of the Creative Commons Attribution (CC BY) license (https://creativecommons.org/licenses/by/4.0/).
Share and Cite
Menevseoglu, A.; Aykas, D.P.; Hatta-Sakoda, B.; Toledo-Herrera, V.H.; Rodriguez-Saona, L.E. Non-Invasive Monitoring of Ethanol and Methanol Levels in Grape-Derived Pisco Distillate by Vibrational Spectroscopy. Sensors 2021, 21, 6278. https://doi.org/10.3390/s21186278
Menevseoglu A, Aykas DP, Hatta-Sakoda B, Toledo-Herrera VH, Rodriguez-Saona LE. Non-Invasive Monitoring of Ethanol and Methanol Levels in Grape-Derived Pisco Distillate by Vibrational Spectroscopy. Sensors. 2021; 21(18):6278. https://doi.org/10.3390/s21186278
Chicago/Turabian StyleMenevseoglu, Ahmed, Didem P. Aykas, Beatriz Hatta-Sakoda, Victor Hugo Toledo-Herrera, and Luis E. Rodriguez-Saona. 2021. "Non-Invasive Monitoring of Ethanol and Methanol Levels in Grape-Derived Pisco Distillate by Vibrational Spectroscopy" Sensors 21, no. 18: 6278. https://doi.org/10.3390/s21186278
APA StyleMenevseoglu, A., Aykas, D. P., Hatta-Sakoda, B., Toledo-Herrera, V. H., & Rodriguez-Saona, L. E. (2021). Non-Invasive Monitoring of Ethanol and Methanol Levels in Grape-Derived Pisco Distillate by Vibrational Spectroscopy. Sensors, 21(18), 6278. https://doi.org/10.3390/s21186278