Displacement Estimation Error in Laser Scanning Monitoring of Retaining Structures Considering Roughness
Abstract
:1. Introduction
2. Laser Scanning and Analysis Methods in Different Types of Retaining Structure
3. Roughness Evaluation of Point Cloud in Retaining Structures
3.1. Pretreatment for Cloud Compares
3.2. Roughness Analysis for Each Retaining Structure
3.3. Azimuth Angle Analysis
4. Displacement Error Evaluation
4.1. Displacement Error Calculation Method
4.2. Estimations of Displacement and Displacement Error in Three Retaining Structures
4.3. Discussion of Analysis Methods
5. Conclusions
- (1)
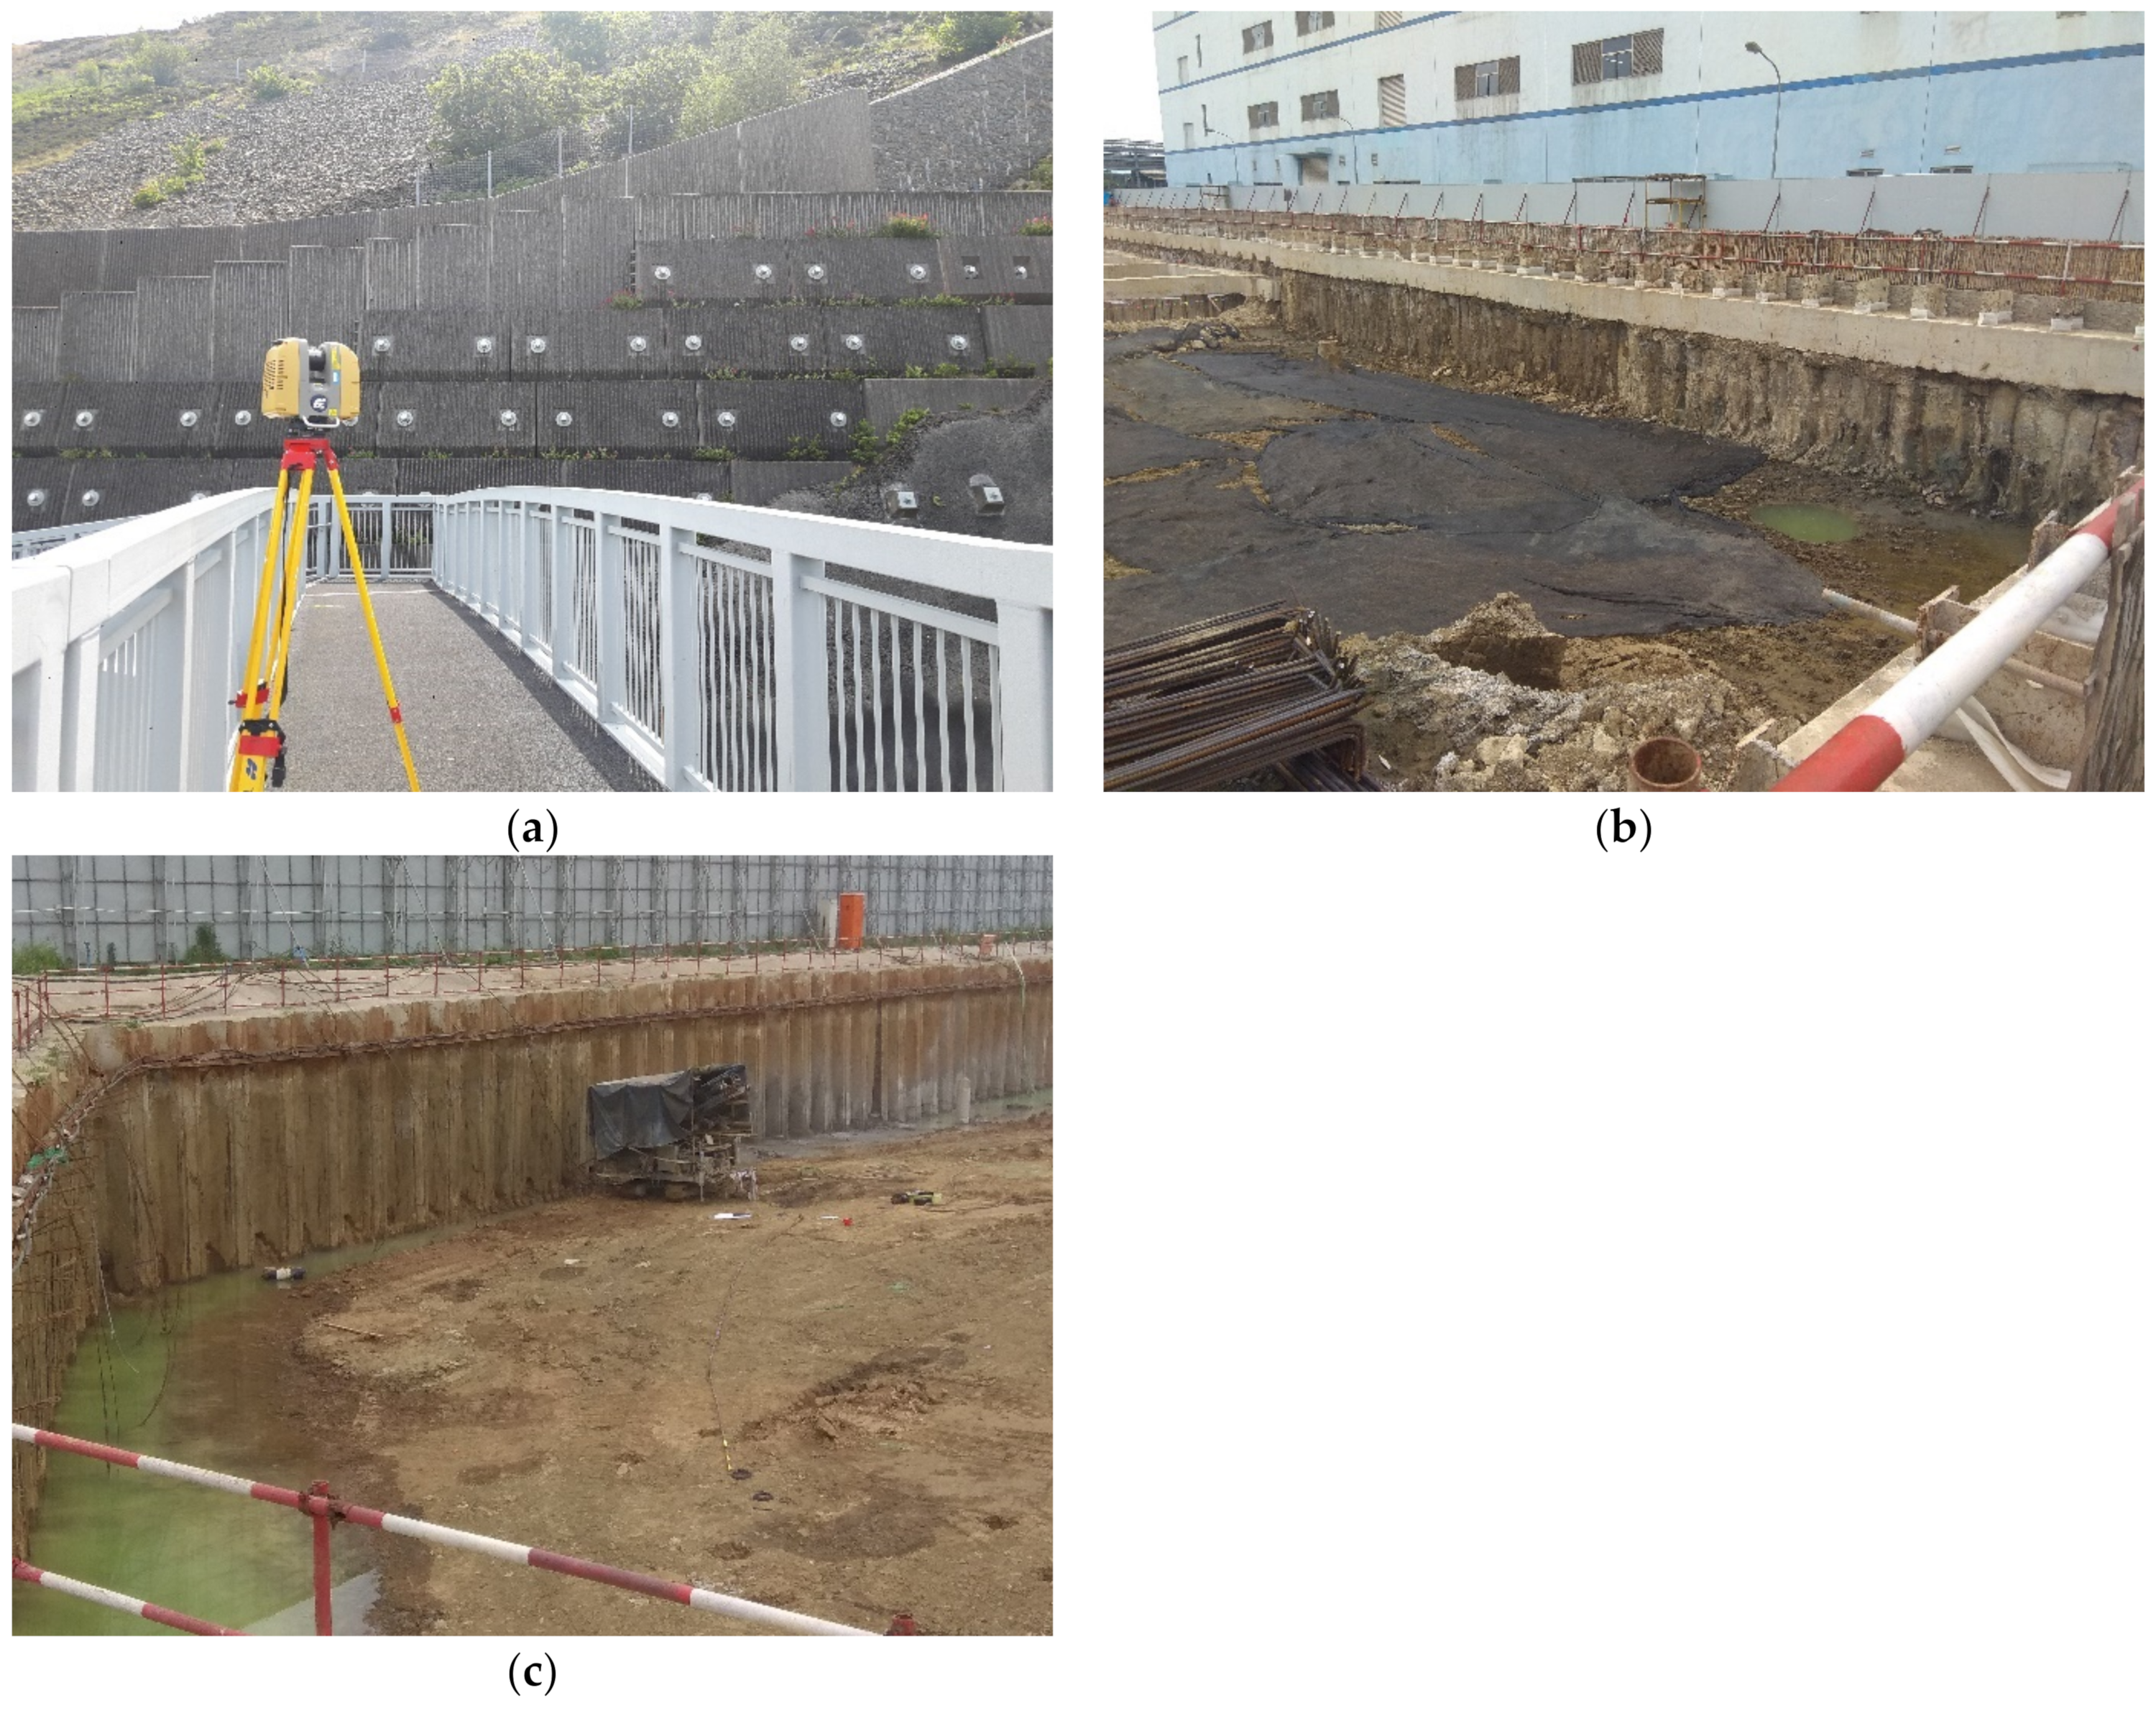
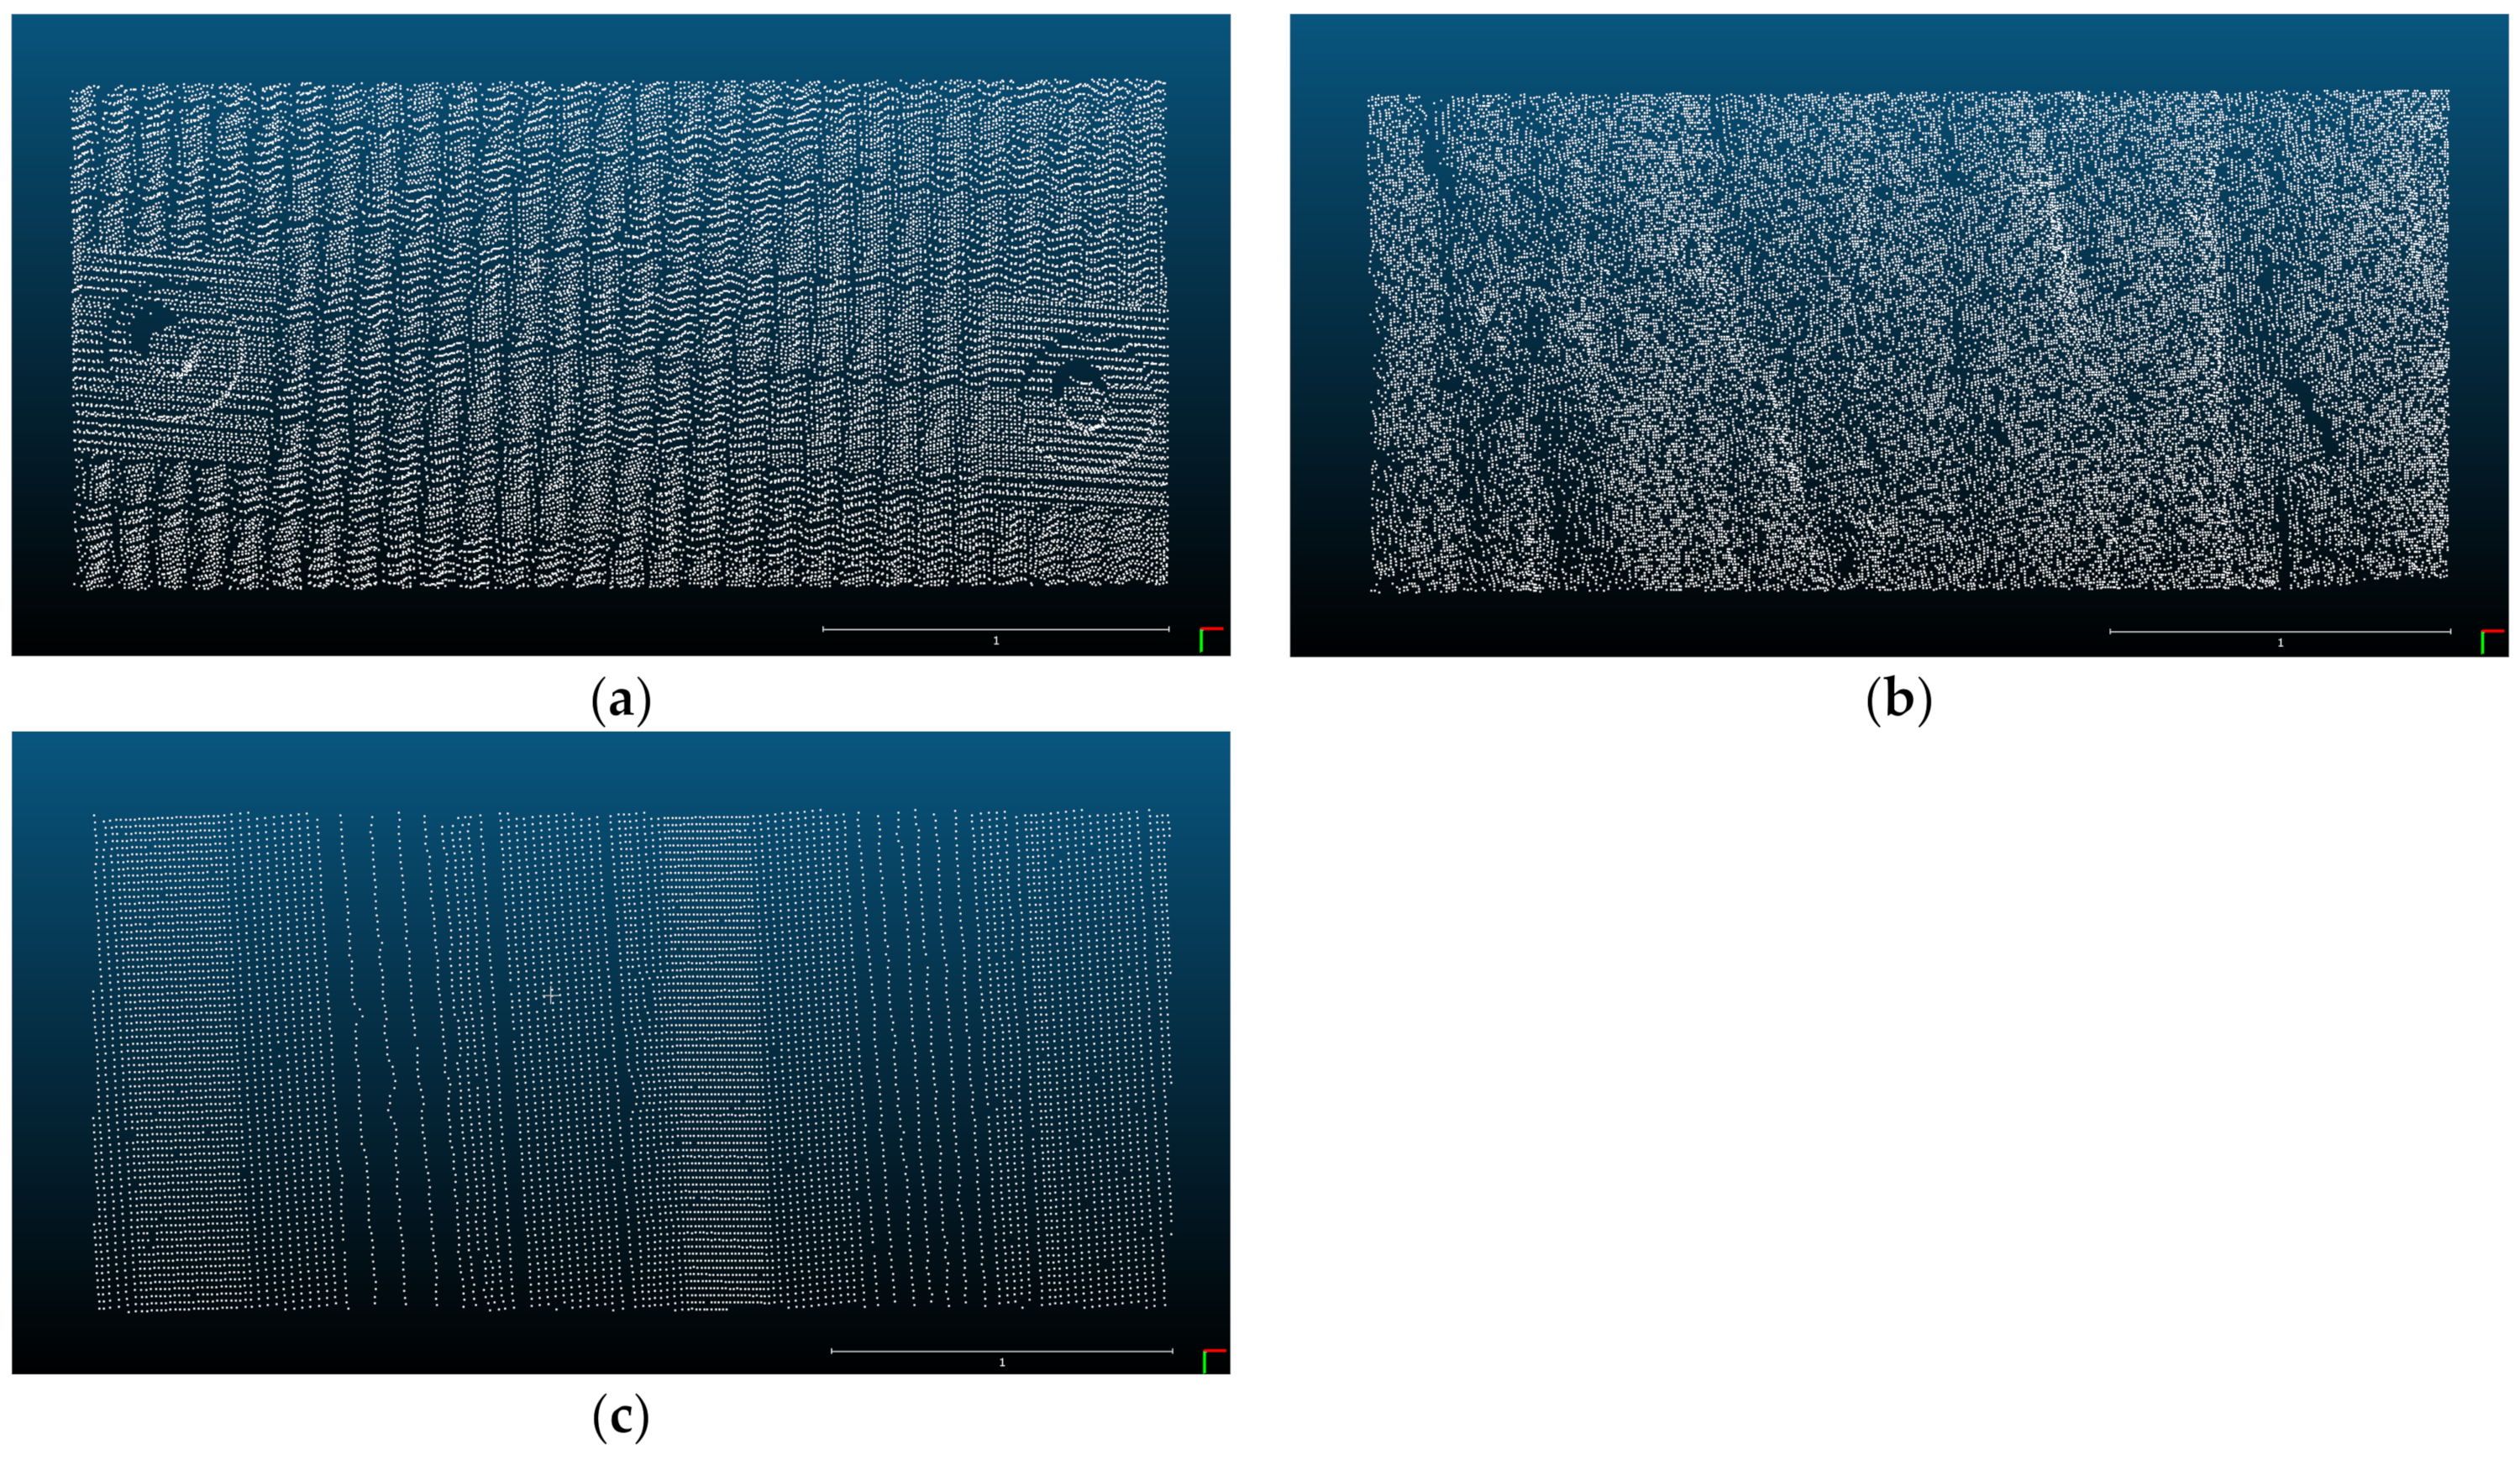
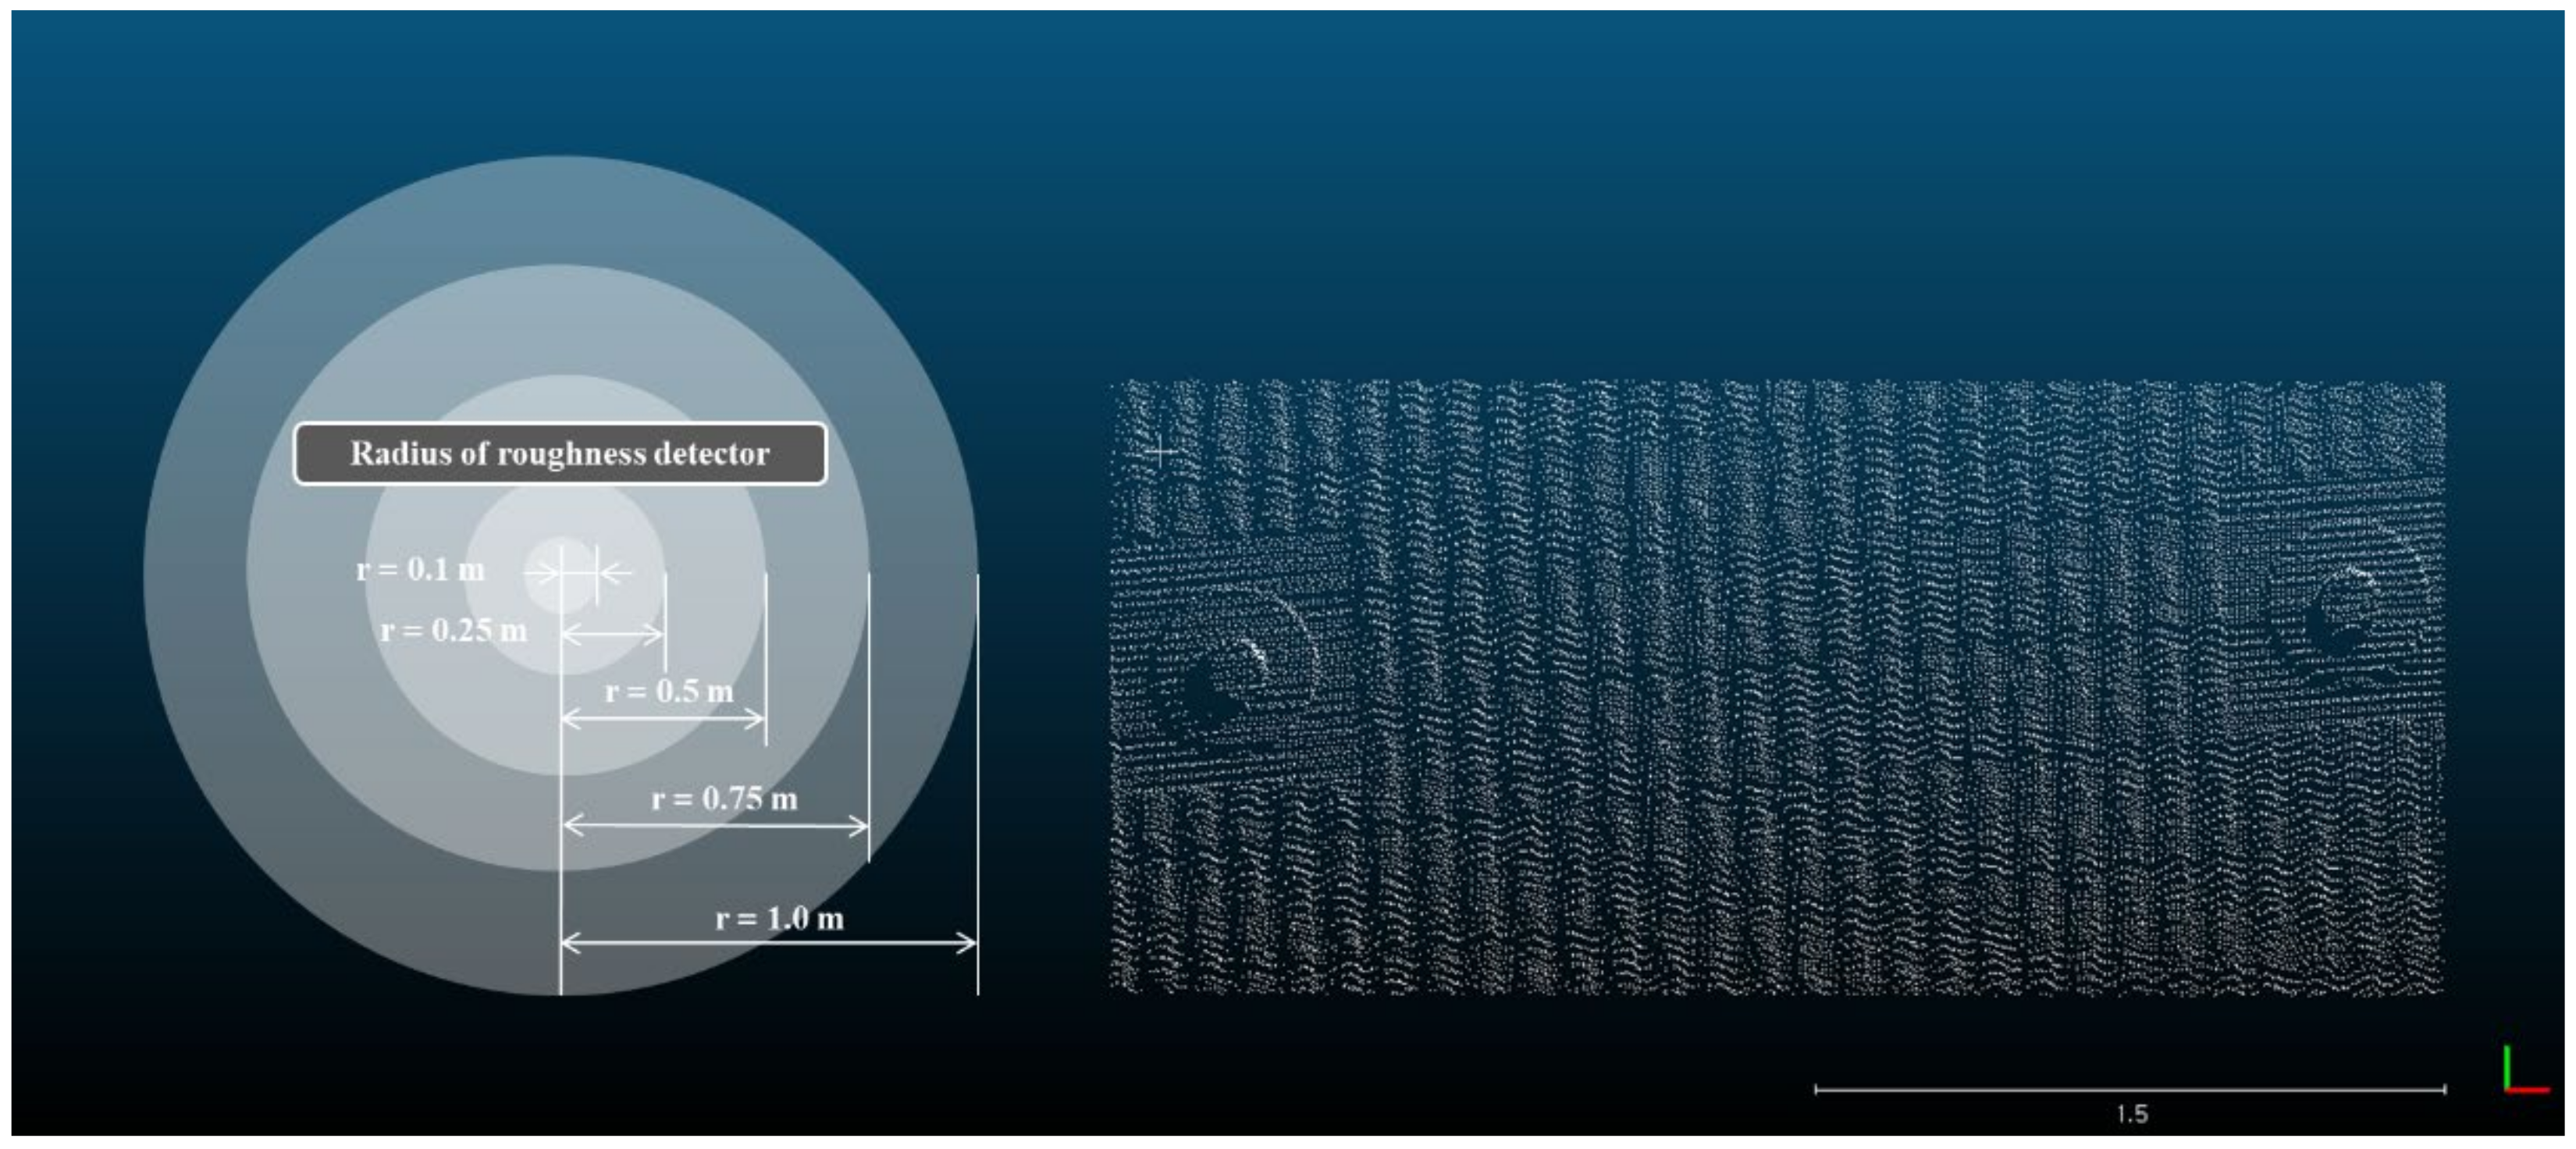
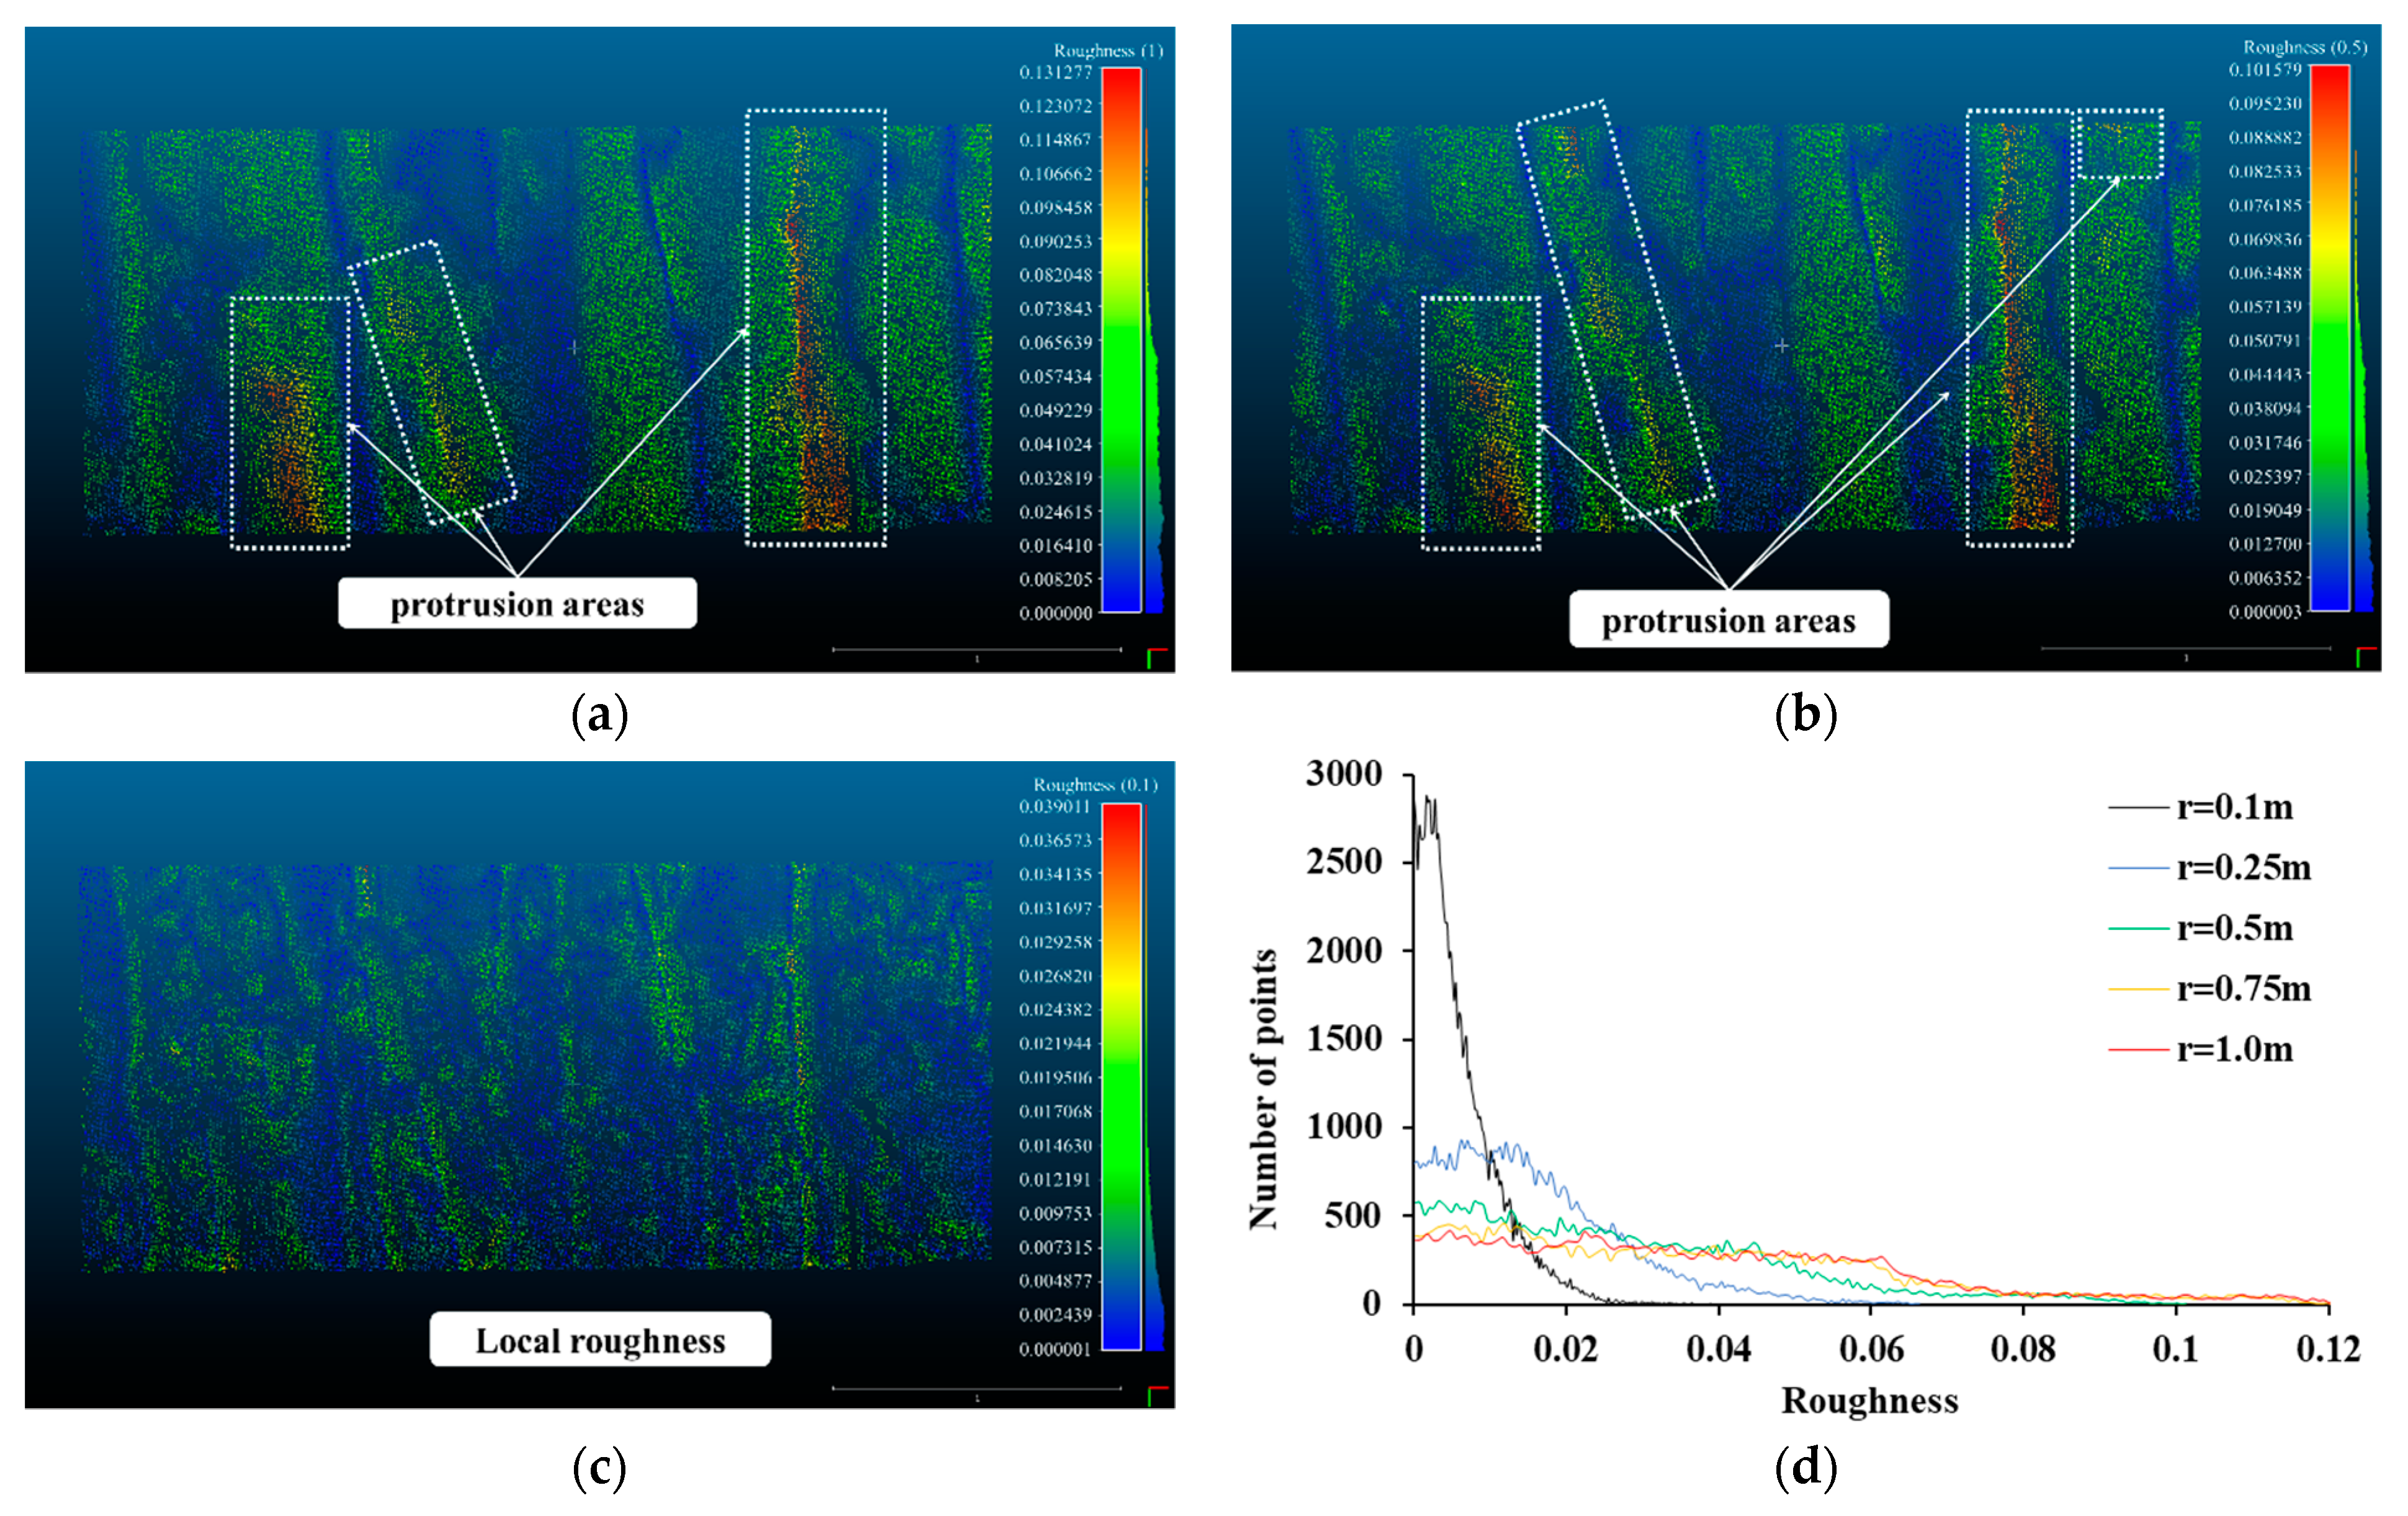
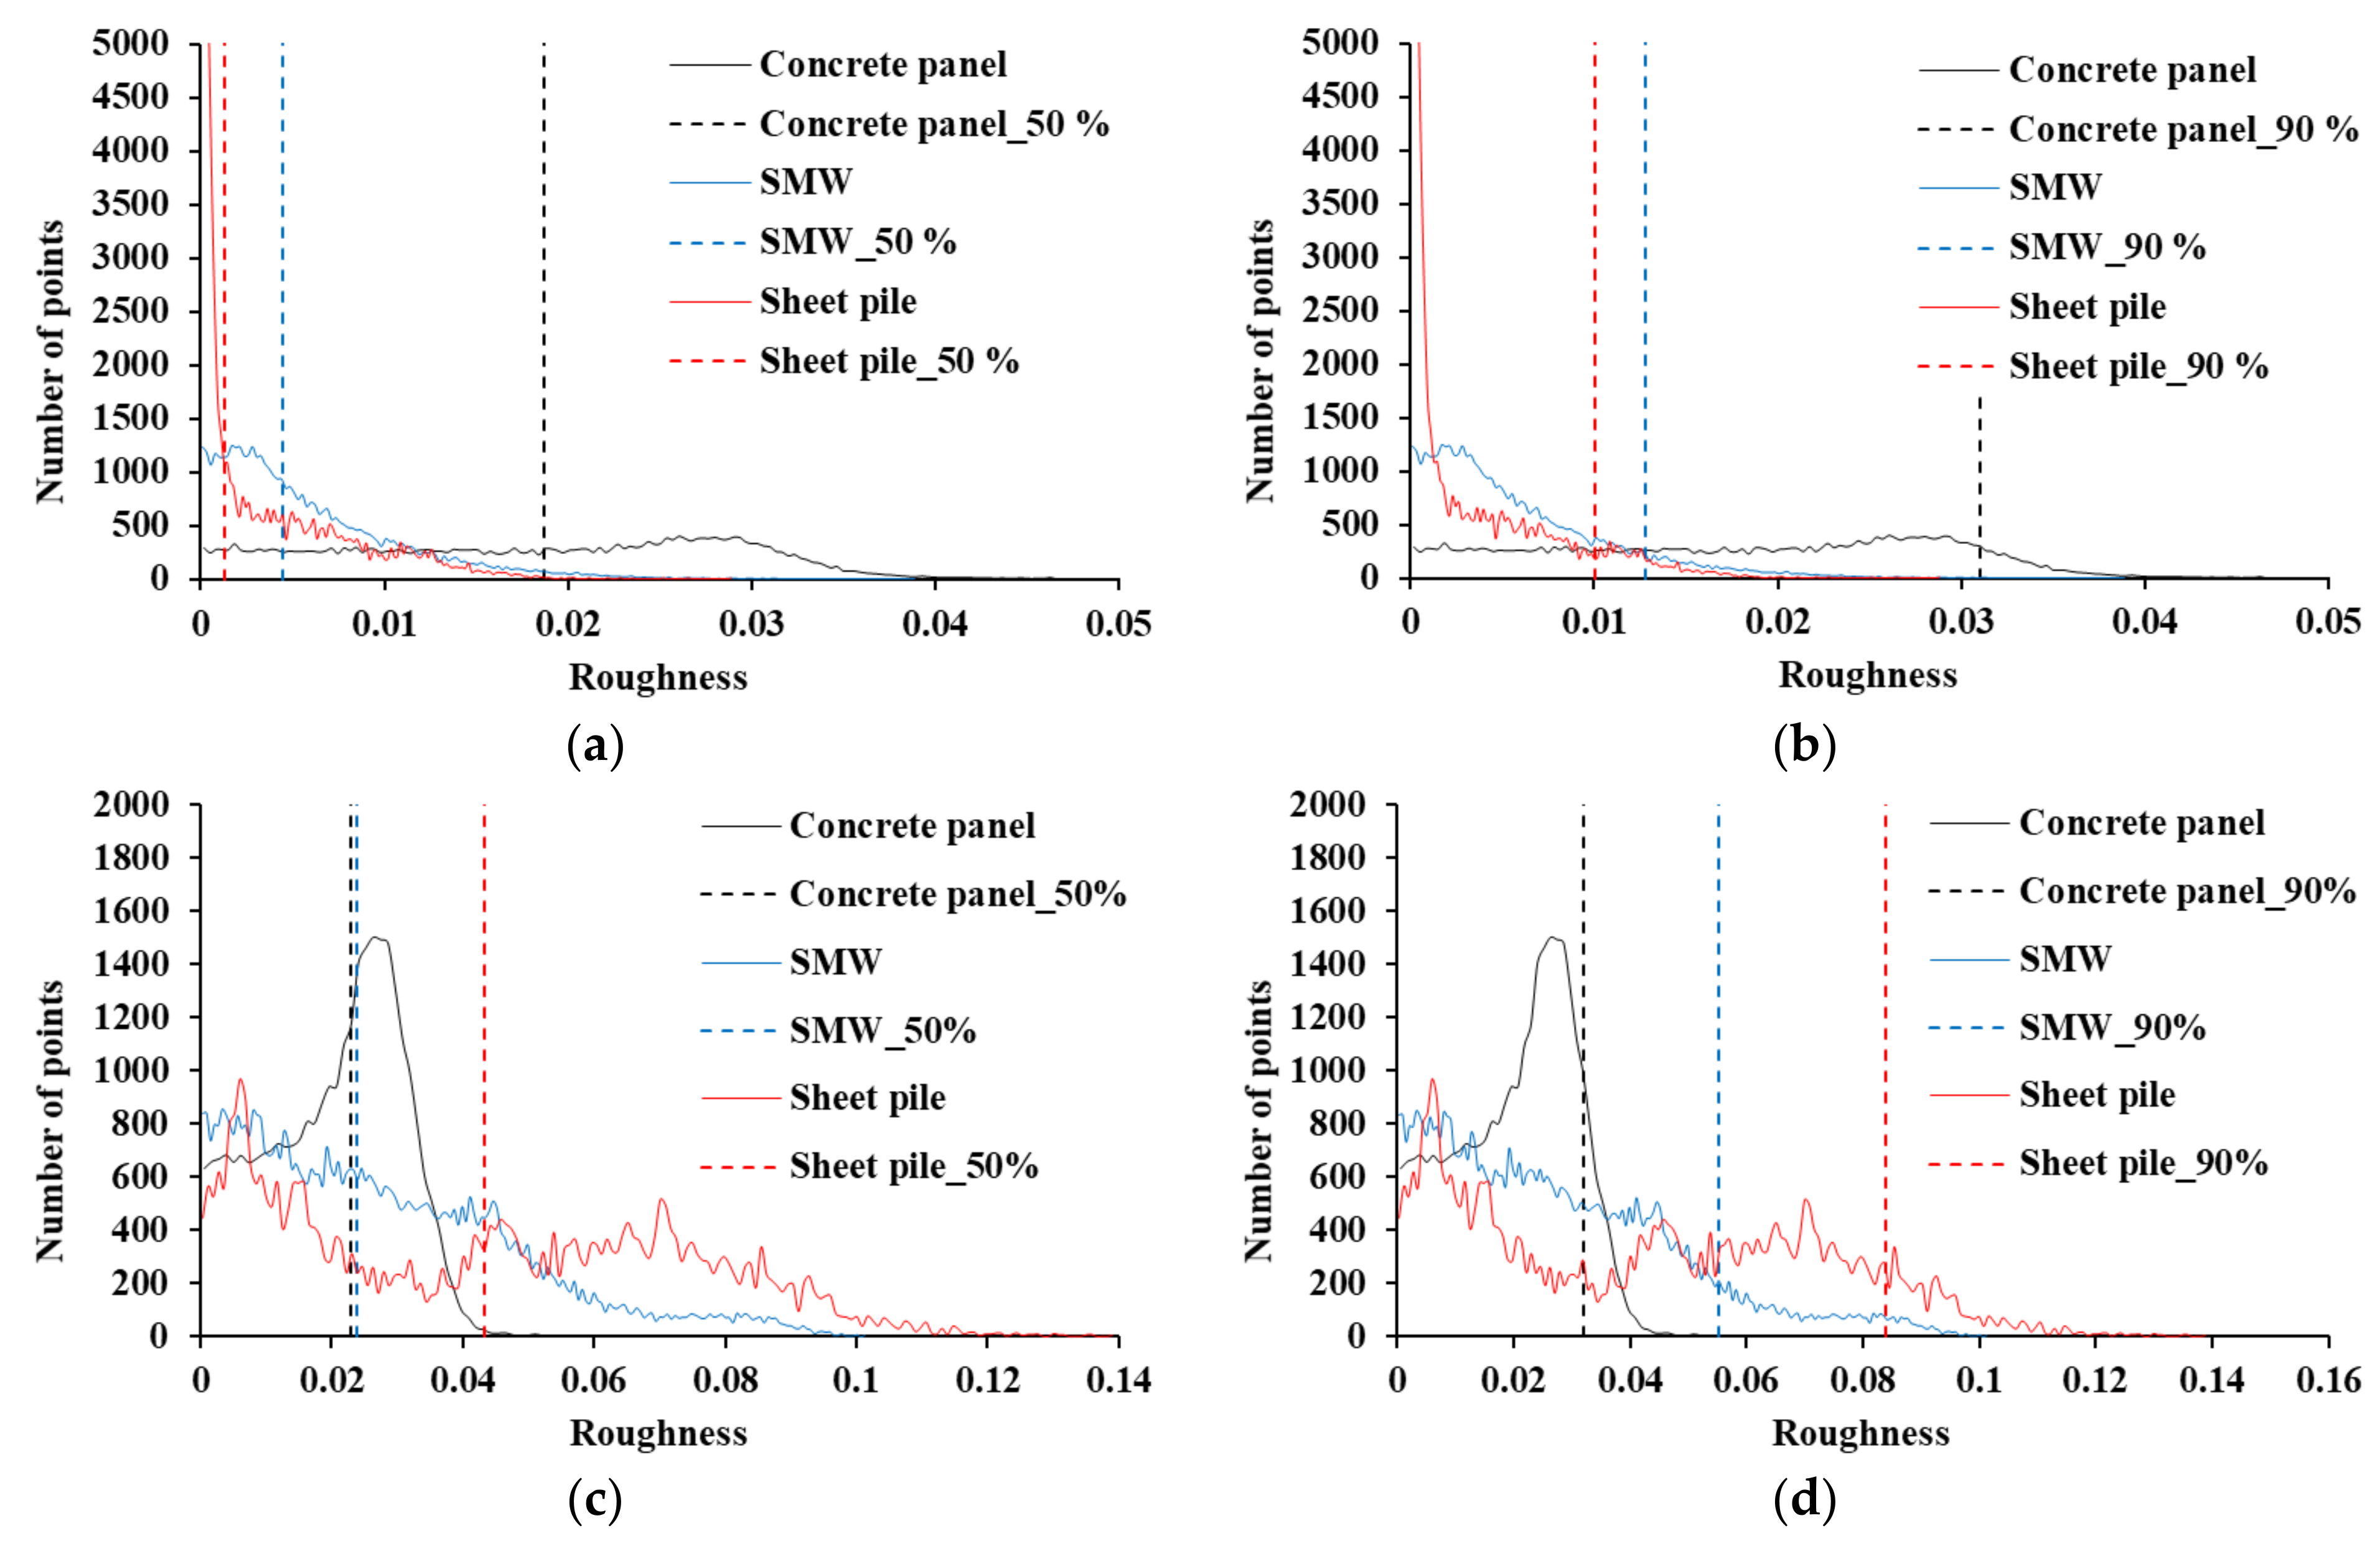
- in order to understand the roughness and curvature features of the point cloud in the three retaining structures, a roughness histogram analysis using the kernel was performed. In the result of the kernel radius of 0.1 m, the concrete panel had the highest local roughness, and it was found to be 4.2 times and 14.8 times rougher than the SMW and sheet piles, respectively. In the 0.5 m radius of the kernel where global curvature can be found, the sheet pile showed the largest value. Although SMW is also affected by the mixture of randomly protruding concrete and ground, the global curvature of the concrete panel is not reflected as roughness at a radius of 0.5 m compared to the other retaining structures. Therefore, in the displacement analysis, the effect of the global curvature of the sheet pile should be considered, and the influence of the randomly protruding area should also be considered for the SMW.
- (2)
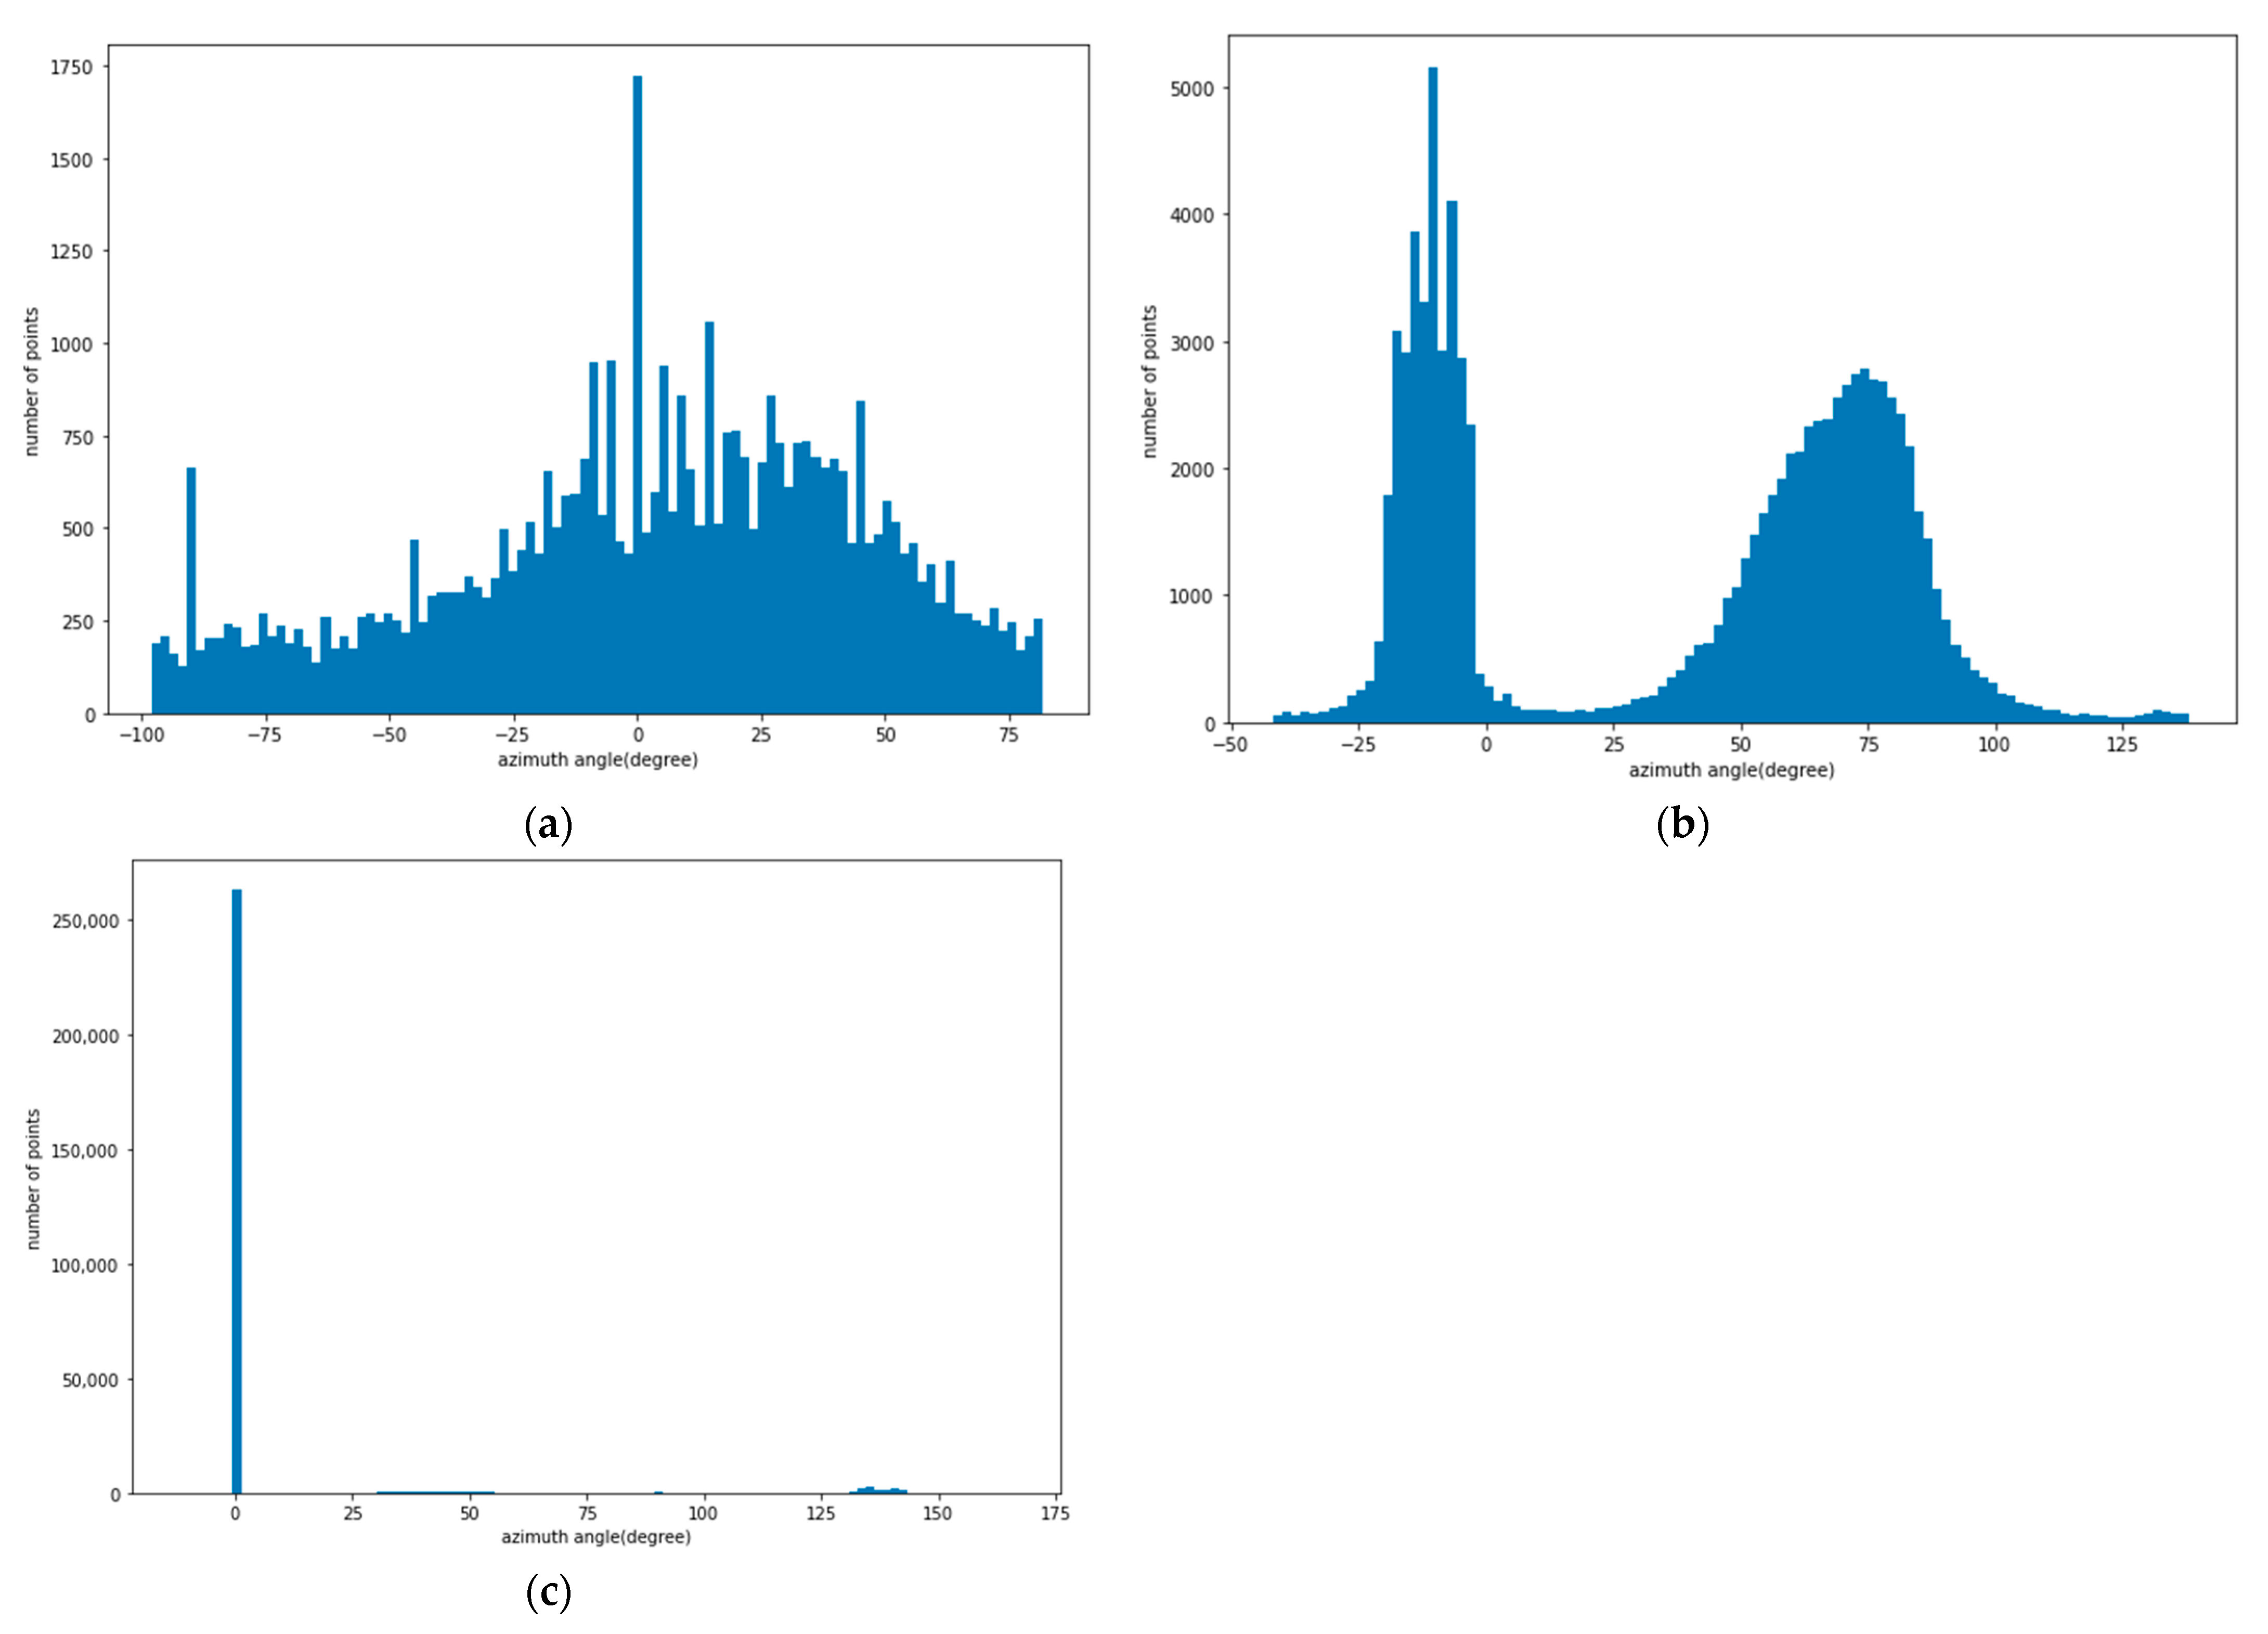
- the curvature of the retaining structure was analyzed with the histogram of azimuth angle, and in the concrete panel, the azimuth angles of the points are evenly distributed over the entire angle due to the zigzag-shaped surface. In the SMW, the azimuth angles of the points were intensively distributed around −10 ° and 75 °. In the sheet pile, the points are concentrated around 0° azimuth and the rest are distributed around 47° and 137° azimuth. In the azimuth analysis results, sheet piles are affected by global curvature, concrete panels are affected by local curvature, and SMW is affected by random curvature.
- (3)
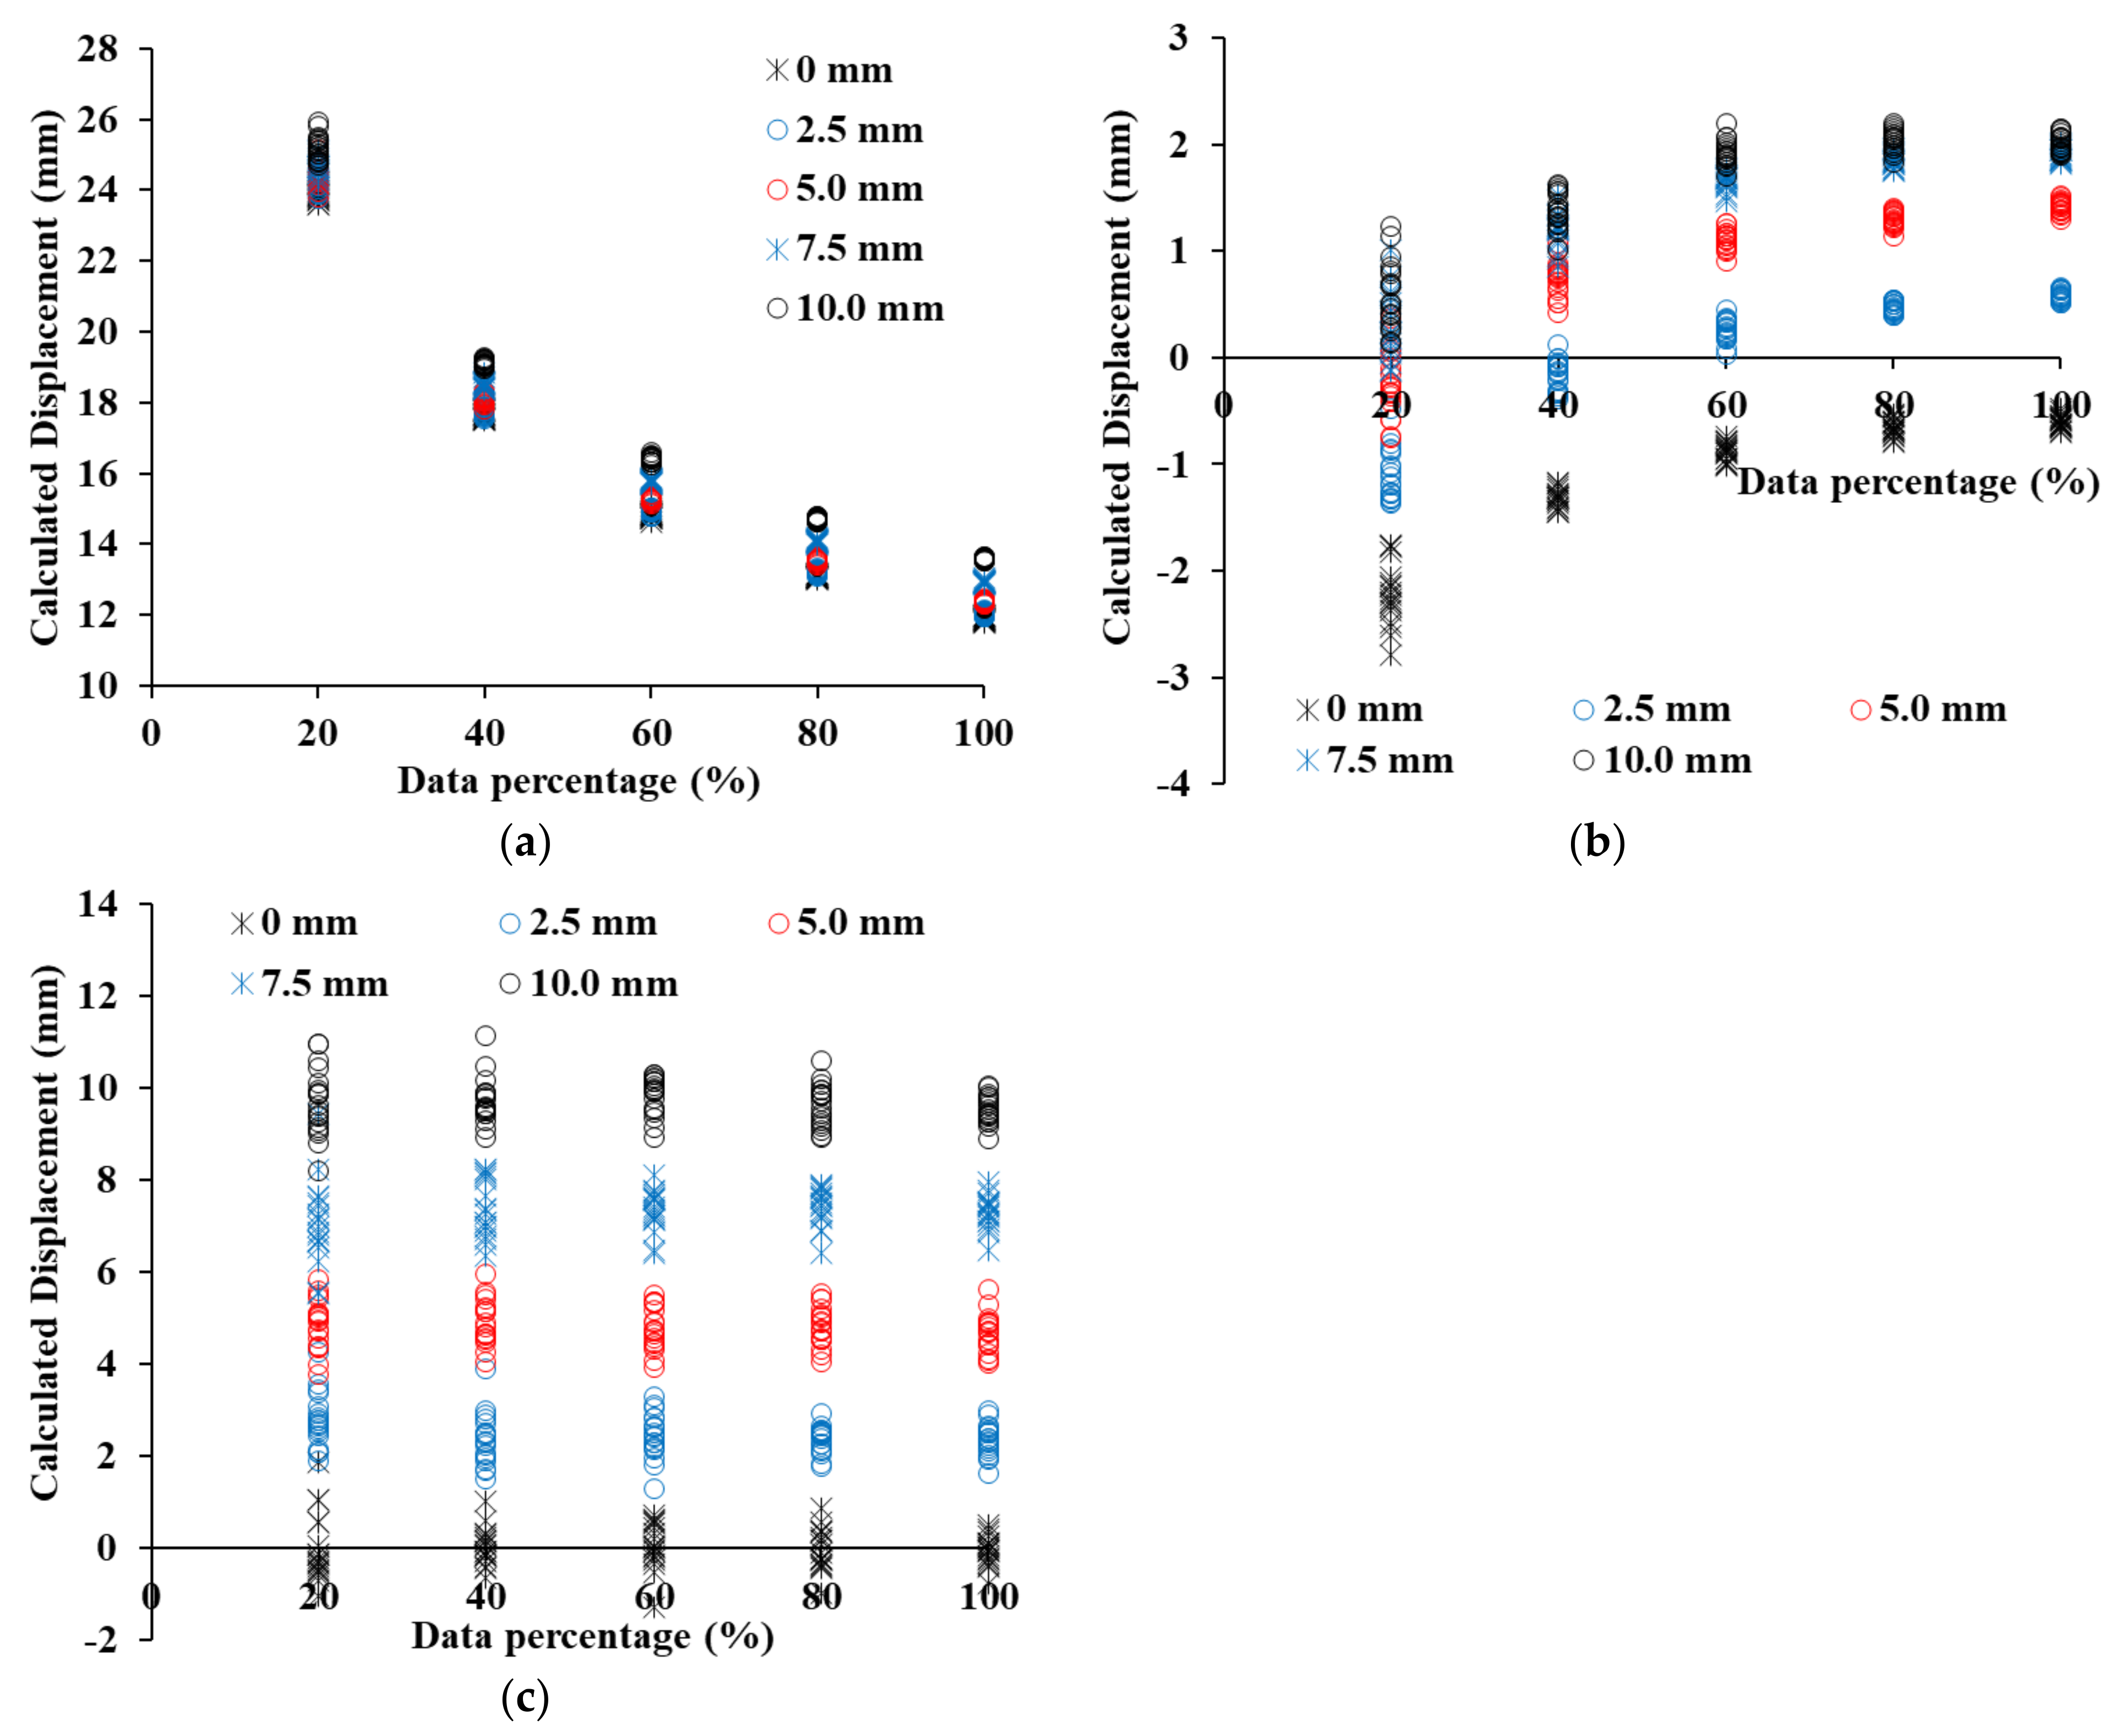
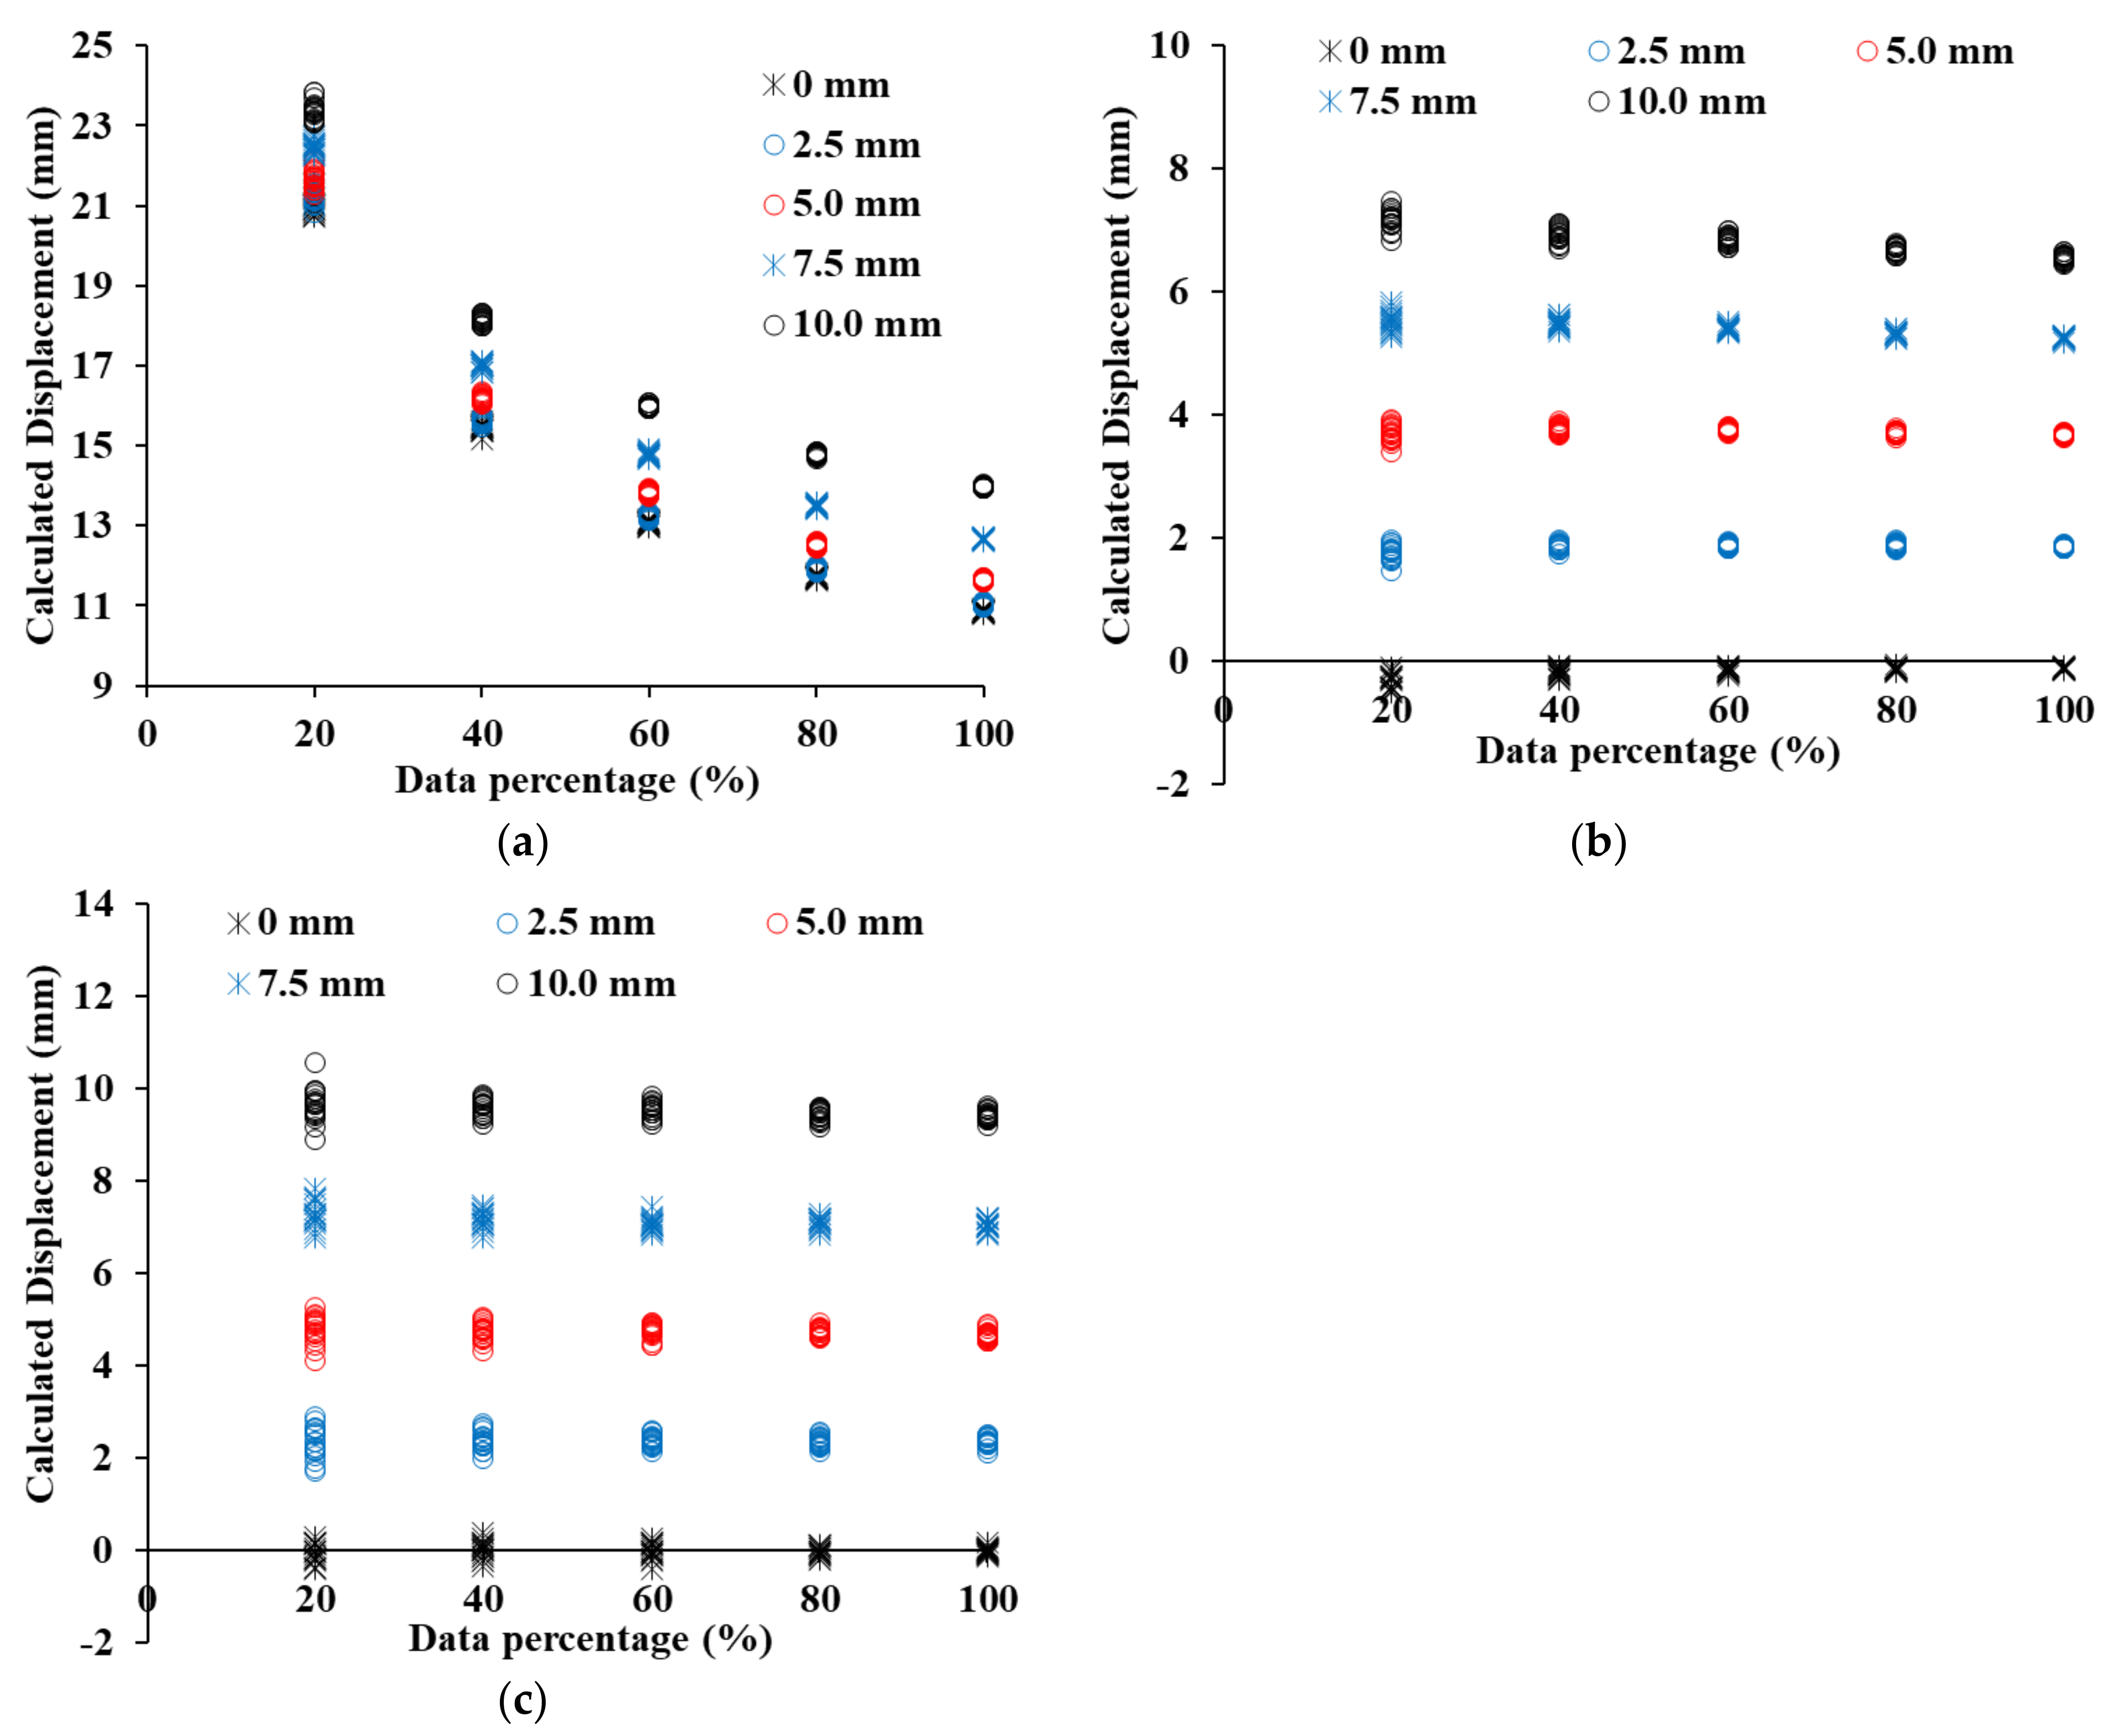
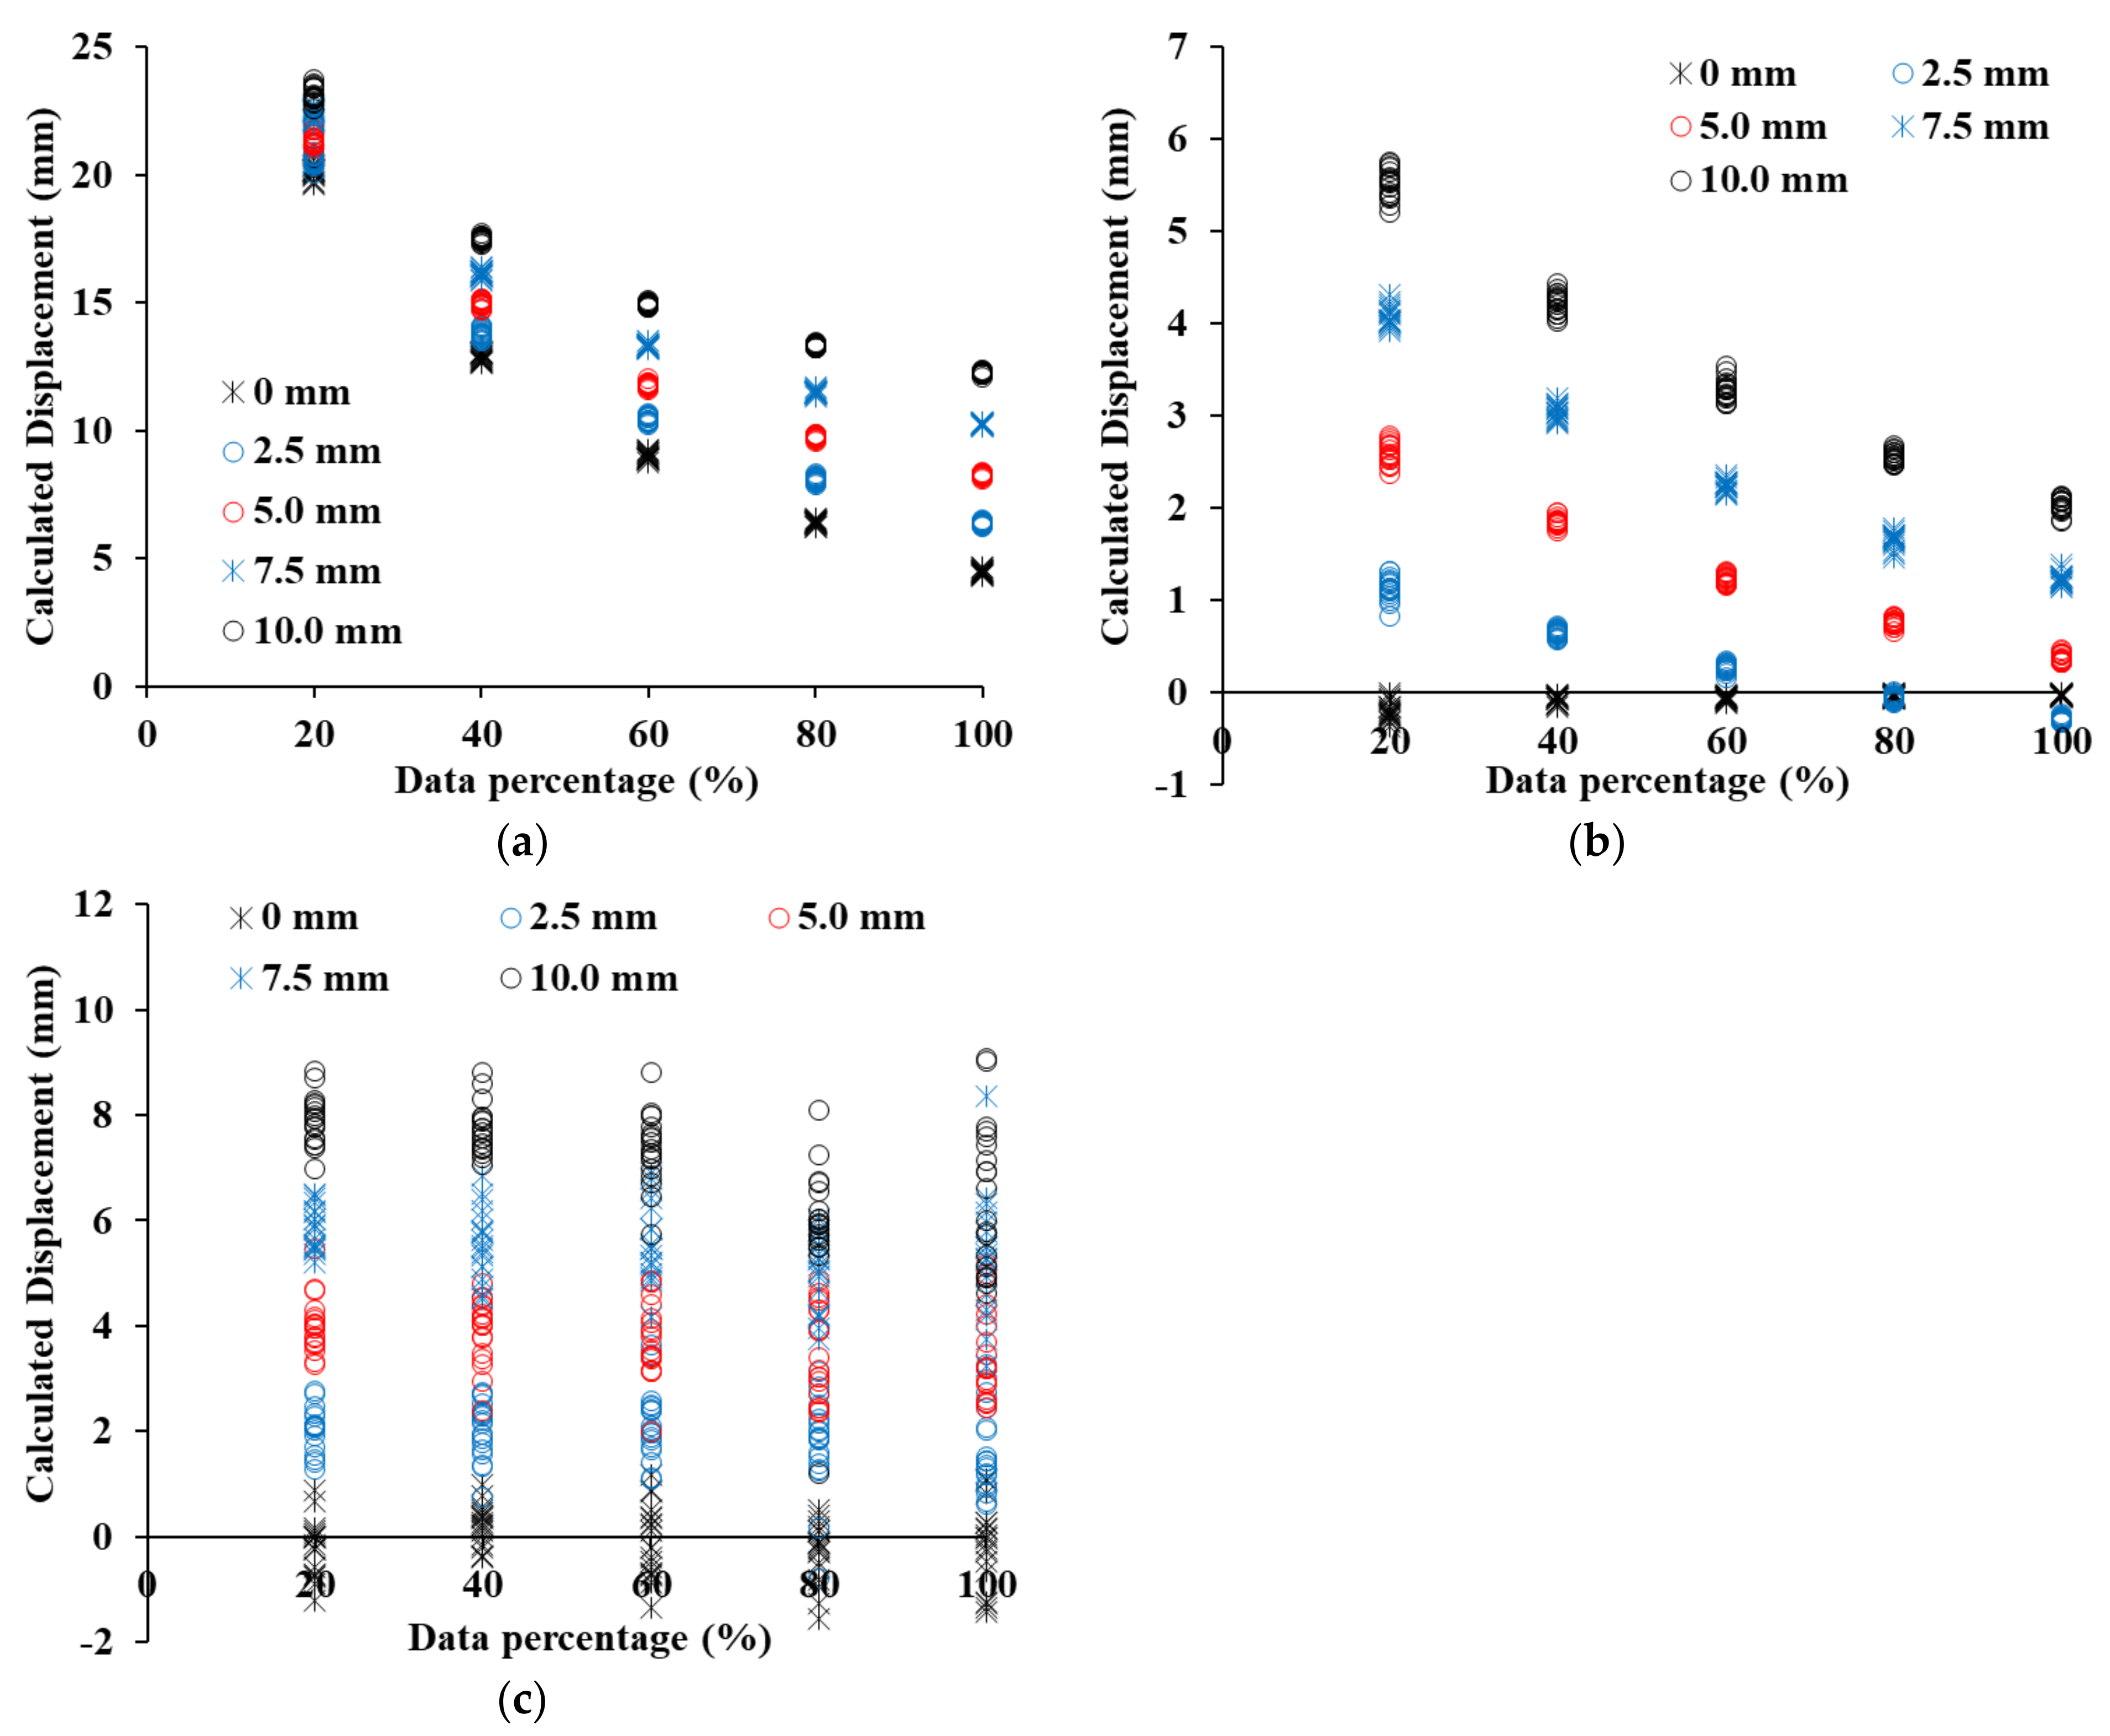
- the displacement and analysis errors of C2C, C2M, and M3C2 were calculated by shifting the 100%, 80%, 60%, 40%, and 20% point clouds of each retaining structure by 0 mm, 2.5 mm, 5.0 mm, 7.5 mm, 10.0 mm. The displacement calculated by C2C showed the largest error in all retaining structures, and it is confirmed that the error was determined by the resolution of the point cloud.
- (4)
- a curved area existed in all three retaining structures, and the C2M displacement was underestimated because the negative C2M displacement was calculated according to the direction of the point in the curved section. Therefore, when analyzing the displacement of the retaining structure by C2M analysis, the influence of negative C2M displacement has to be removed.
- (5)
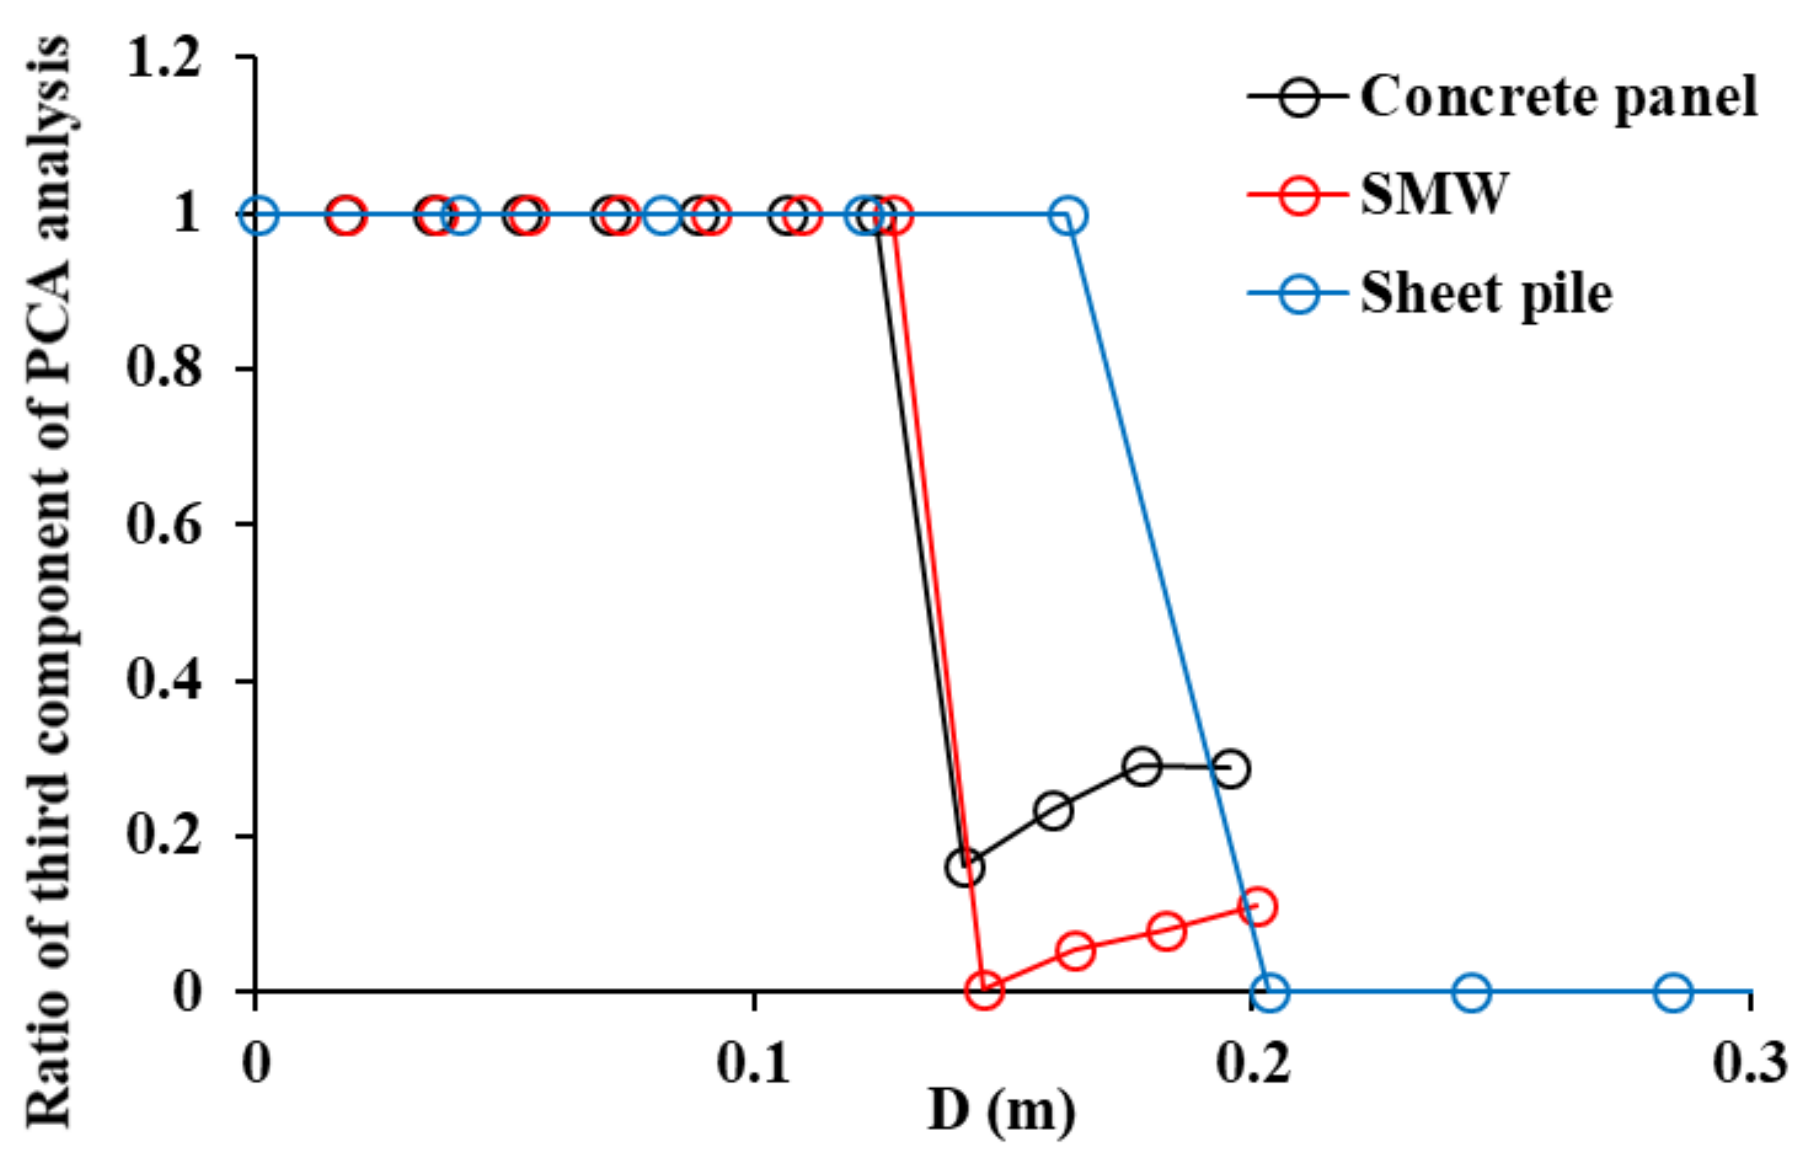
- M3C2 analysis had the highest accuracy in displacement calculation among the three analysis methods for retaining structures. PCA analysis is essential in order to get high M3C2 displacement accuracy of retaining structures with curvature and roughness. The optimized D for the M3C2 analysis of concrete panel, SMW, and sheet piles introduced in this paper were 0.142 m, 0.146 m, and 0.200 m, respectively.
Author Contributions
Funding
Institutional Review Board Statement
Informed Consent Statement
Data Availability Statement
Conflicts of Interest
References
- Bilgin, Ö. Numerical studies of anchored sheet pile wall behavior constructed in cut and fill conditions. Comput. Geotech. 2010, 37, 399–407. [Google Scholar] [CrossRef]
- Cherubini, C. Probabilistic approach to the design of anchored sheet pile walls. Comput. Geotech. 2000, 26, 309–330. [Google Scholar] [CrossRef]
- Seo, H.; Lee, I.M.; Ryu, Y.M.; Jung, J.H. Mechanical behavior of hybrid soil nail-anchor system. KSCE J. Civ. Eng. 2019, 23, 4201–4211. [Google Scholar]
- Seo, H.J.; Choi, H.; Lee, K.H.; Bae, G.J.; Lee, I.M. Pillar-reinforcement technology beneath existing structures: Small-scale model tests. KSCE J. Civ. Eng. 2014, 18, 819–826. [Google Scholar]
- Seo, H.J.; Jeong, K.H.; Choi, H.; Lee, I.-M. Pullout resistance increase of soil nailing induced by pressurized grouting. J. Geotech. Geoenviron. Eng. 2014, 138, 604–613. [Google Scholar] [CrossRef]
- Seo, H.; Lee, I.M.; Lee, S.W. Optimization of Soil Nailing Design Considering Three Failure Modes. KSCE J. Civ. Eng. 2014, 18, 488–496. [Google Scholar] [CrossRef]
- Tan, Y.; Paikowsky, S.G. Performance of Sheet Pile Wall in Peat. J. Geotech. Geoenviron. Eng. 2008, 134, 445–458. [Google Scholar] [CrossRef] [Green Version]
- Woo, S.I.; Salgado, R. Bounding surface modeling of sand with consideration of fabric and its evolution during monotonic shearing. Int. J. Solids Struct. 2015, 63, 277–288. [Google Scholar] [CrossRef]
- Han, F.; Salgado, R.; Prezzi, M.; Lim, J. Shaft and base r, esistance of non-displacement piles in sand. Comput. Geotech. 2017, 83, 184–197. [Google Scholar]
- Salgado, R.; Loukidis, D.; Abou-Jaoude, G.; Zhang, Y. The role of soil stiffness non-linearity in 1-D pile driving simulations. Géotechnique 2015, 65, 169–187. [Google Scholar] [CrossRef]
- Salgado, R.; Bandini, P.; Karim, A. Shear strength and stiffness of silty sand. J. Geotech. Geoenviron. Eng. 2000, 126, 451–462. [Google Scholar]
- Shao, Y.; Macari, E.J.; Cai, W. Compound Deep Soil Mixing Columns for Retaining Structures in Excavations. J. Geotech. Geoenviron. Eng. 2005, 131, 1370–1377. [Google Scholar] [CrossRef]
- Caputo, G.V.; Conti, R.; Viggiani, G.M.B.; Prüm, C. Improved Method for the Seismic Design of Anchored Steel Sheet Pile Walls. J. Geotech. Geoenviron. Eng. 2021, 147, 04020154. [Google Scholar] [CrossRef]
- Qu, H.-L.; Luo, H.; Hu, H.-G.; Jia, H.-Y.; Zhang, D.-Y. Dynamic response of anchored sheet pile wall under ground motion: Analytical model with experimental validation. Soil Dyn. Earthq. Eng. 2018, 115, 896–906. [Google Scholar] [CrossRef]
- Mohamad, H.; Soga, K.; Bennett, P.J.; Mair, R.J.; Lim, C.S. Monitoring Twin Tunnel Interaction Using Distributed Optical Fiber Strain Measurements. J. Geotech. Geoenviron. Eng. 2012, 138, 957–967. [Google Scholar] [CrossRef]
- Soga, K.; Kwan, V.; Pelecanos, L.; Rui, Y.; Schwamb, T.; Seo, H.; Wilcock, M. The role of distributed sensing in understanding the engineering performance of geotechnical structures. In Proceedings of the XVI European Conference on Soil Mechanics and Geotechnical Engineering, Edinburgh, UK, 13–17 September 2015. [Google Scholar]
- Pelecanos, L.; Soga, K.; Elshafie, M.Z.E.B.; Battista, N.; Kechavarzi, C.; Gue, C.Y.; Ouyang, Y.; Seo, H.J. Distributed fiber optic sensing of axially loaded bored piles. J. Geotech. Geoenviron. Eng. 2018, 144, 04017122. [Google Scholar] [CrossRef] [Green Version]
- Soga, K. Understanding the real performance of geotechnical structures using an innovative fibre optic distributed strain measurement technology. Riv. Ital. Geotech. 2014, 4, 7–48. [Google Scholar]
- Soga, K.; Kechavarzi, C.; Pelecanos, L.; de Battista, N.; Williamson, M.; Gue, C.Y.; Di Murro, V.; Elshafie, M. Distributed fiber-optic strain sensing for monitoring underground structures—Tunnels case studies. In Underground Sensing—Monitoring and Hazard Detection for Environment and Infrastructure; Pamukcu, S., Cheng, L., Eds.; Academic Press—Elsevier: Amsterdam, The Netherlands, 2017; pp. 287–321. ISBN 9780128031391. [Google Scholar]
- Hain, A.; Zaghi, A.E. Applicability of Photogrammetry for Inspection and Monitoring of Dry-Stone Masonry Retaining Walls. Transp. Res. Rec. J. Transp. Res. Board 2020, 2674, 287–297. [Google Scholar] [CrossRef]
- Jiang, Y.; Bai, Y. Estimation of Construction Site Elevations Using Drone-Based Orthoimagery and Deep Learningand Deep Learning. J. Constr. Eng. Manag. 2020, 146, 04020086. [Google Scholar] [CrossRef]
- Scaioni, M.; Barazzetti, L.; Giussani, A.; Previtali, M.; Roncoroni, F.; Alba, M.I. Photogrammetric techniques for monitoring tunnel deformation. Earth Sci. Inform. 2014, 7, 83–95. [Google Scholar] [CrossRef]
- Seo, H. Infrared thermography for detecting cracks in pillar models with different reinforcing systems. Tunn. Undergr. Space Technol. 2021, 116, 104118. [Google Scholar]
- Seo, H.; Choi, H.; Park, J.; Lee, I.M. Crack detection in pillars using infrared thermographic imaging. Geotech. Test. J. 2017, 40, 371–380. [Google Scholar]
- Heritage, G.; Large, A. Laser Scanning for the Environmental Sciences; John Wiley & Sons: Hoboken, NJ, USA, 2009. [Google Scholar]
- Renee, C.O.; Rudiger, E.-W.; Thomas, O. A Novel Application of Photogrammetry for Retaining Wall Assessment. Infrastructures 2017, 2, 10. [Google Scholar]
- Acikgoz, S.; Soga, K.; Woodhams, J. Evaluation of the response of a vaulted masonry structure to differential settlements using point cloud data and limit analyses. Constr. Build. Mater. 2017, 150, 916–931. [Google Scholar] [CrossRef]
- Olsen, M.J.; Kuester, F.; Chang, B.J.; Hutchinson, T.C. Terrestrial Laser Scanning-Based Structural Damage Assessment. J. Comput. Civ. Eng. 2010, 24, 264–272. [Google Scholar] [CrossRef]
- Oskouie, P.; Becerik-Gerber, B.; Soibelman, L. Automated measurement of highway retaining wall displacements using terrestrial laser scanners. Autom. Constr. 2016, 65, 86–101. [Google Scholar] [CrossRef]
- Riveiro, B.; Dejong, M.J.; Conde, B. Automated processing of large point clouds for structural health monitoring of masonry arch bridges. Autom. Constr. 2016, 72, 258–268. [Google Scholar]
- Seo, H. Tilt mapping for zigzag-shaped concrete panel in retaining structure using terrestrial laser scanning. J. Civ. Struct. Health Monit. 2021, 11, 851–865. [Google Scholar] [CrossRef]
- Brodu, N.; Lague, D. 3D terrestrial LiDAR data classification of complex natural scenes using a multi-scale dimensionality criterion: Applications in geomorphology. ISPRS J. Photogramm. Remote Sens. 2012, 68, 121–134. [Google Scholar] [CrossRef] [Green Version]
- Seo, H. Monitoring of CFA pile test using three dimensional laser scanning and distributed fiber optic sensors. Opt. Lasers Eng. 2020, 130, 106089. [Google Scholar]
- Seo, H. 3D roughness measurement of failure surface in CFA pile samples using three-dimensional laser scanning. Appl. Sci. 2021, 11, 2713. [Google Scholar] [CrossRef]
- CLOUDCOMPARE 2018; CloudCompare 2.6.1, ed. Available online: http://www.cloudcompare.org/doc/qCC/CloudCompare%20v2.6.1%20-%20User%20manual.pdf (accessed on 1 November 2021).
- Seo, H. Long-term Monitoring of zigzag-shaped concrete panel in retaining structure using laser scanning and analysis of influencing factors. Opt. Lasers Eng. 2021, 139, 106498. [Google Scholar]
- Zhao, Y.; Seo, H.; Chen, C. Displacement mapping of point clouds: Application of retaining structures composed of sheet piles. J. Civ. Struct. Health Monit. 2021, 11, 915–930. [Google Scholar]






| Displacement (mm) | Errors of C2C (mm) | ||||
|---|---|---|---|---|---|
| 20% | 40% | 60% | 80% | 100% | |
| 0 | 23.92 | 17.66 | 14.84 | 13.09 | 11.90 |
| 2.5 | 21.60 | 15.26 | 12.44 | 10.70 | 9.53 |
| 5 | 19.47 | 13.11 | 10.29 | 8.55 | 7.38 |
| 7.5 | 17.14 | 11.02 | 8.29 | 6.59 | 5.43 |
| 10 | 15.20 | 9.12 | 6.39 | 4.72 | 3.59 |
| Displacement (mm) | Errors of C2M (mm) | ||||
| 20% | 40% | 60% | 80% | 100% | |
| 0 | −2.20 | −1.32 | −0.89 | −0.66 | −0.61 |
| 2.5 | −3.62 | −2.67 | −2.24 | −2.03 | −1.92 |
| 5 | −5.27 | −4.26 | −3.88 | −3.70 | −3.58 |
| 7.5 | −7.19 | −6.29 | −5.85 | −5.65 | −5.59 |
| 10 | −9.39 | −8.61 | −8.08 | −7.97 | −7.99 |
| Displacement (mm) | Errors of M3C2 (mm) | ||||
| 20% | 40% | 60% | 80% | 100% | |
| 0 | −0.03 | 0.04 | 0.08 | −0.03 | −0.04 |
| 2.5 | 0.23 | −0.12 | −0.05 | −0.14 | −0.12 |
| 5 | −0.11 | −0.08 | −0.19 | −0.16 | −0.34 |
| 7.5 | −0.42 | −0.15 | −0.15 | −0.11 | −0.19 |
| 10 | −0.31 | −0.30 | −0.25 | −0.38 | −0.49 |
| Displacement (mm) | Errors of C2C (mm) | ||||
|---|---|---|---|---|---|
| 20% | 40% | 60% | 80% | 100% | |
| 0 | 21.05 | 15.45 | 13.07 | 11.72 | 10.86 |
| 2.5 | 18.72 | 13.13 | 10.75 | 9.42 | 8.52 |
| 5 | 16.66 | 11.18 | 8.84 | 7.51 | 6.64 |
| 7.5 | 14.96 | 9.50 | 7.28 | 5.99 | 5.18 |
| 10 | 13.38 | 8.15 | 5.99 | 4.77 | 3.98 |
| Displacement (mm) | Errors of C2M (mm) | ||||
| 20% | 40% | 60% | 80% | 100% | |
| 0 | −0.33 | −0.19 | −0.14 | −0.12 | −0.11 |
| 2.5 | −0.74 | −0.63 | −0.62 | −0.61 | −0.64 |
| 5 | −1.30 | −1.23 | −1.25 | −1.29 | −1.32 |
| 7.5 | −1.98 | −2.01 | −2.09 | −2.18 | −2.25 |
| 10 | −2.83 | −3.07 | −3.16 | −3.32 | −3.44 |
| Displacement (mm) | Errors of M3C2 (mm) | ||||
| 20% | 40% | 60% | 80% | 100% | |
| 0 | −0.06 | 0.01 | 0.00 | −0.01 | −0.01 |
| 2.5 | −0.15 | −0.12 | −0.12 | −0.15 | −0.14 |
| 5 | −0.23 | −0.24 | −0.26 | −0.27 | −0.33 |
| 7.5 | −0.20 | −0.33 | −0.42 | −0.40 | −0.46 |
| 10 | −0.34 | −0.42 | −0.46 | −0.56 | −0.58 |
| Displacement (mm) | Errors of C2C (mm) | ||||
|---|---|---|---|---|---|
| 20% | 40% | 60% | 80% | 100% | |
| 0 | 20.15 | 12.86 | 9.01 | 6.39 | 4.48 |
| 2.5 | 18.08 | 11.30 | 7.94 | 5.58 | 3.86 |
| 5 | 16.43 | 9.95 | 6.78 | 4.75 | 3.26 |
| 7.5 | 14.88 | 8.63 | 5.82 | 4.00 | 2.76 |
| 10 | 13.15 | 7.49 | 4.93 | 3.33 | 2.24 |
| Displacement (mm) | Errors of C2M (mm) | ||||
| 20% | 40% | 60% | 80% | 100% | |
| 0 | −0.20 | −0.08 | −0.06 | −0.04 | −0.03 |
| 2.5 | −1.36 | −1.85 | −2.23 | −2.56 | −2.79 |
| 5 | −2.41 | −3.15 | −3.78 | −4.24 | −4.61 |
| 7.5 | −3.42 | −4.46 | −5.25 | −5.85 | −6.27 |
| 10 | −4.48 | −5.78 | −6.72 | −7.45 | −7.97 |
| Displacement (mm) | Errors of M3C2 (mm) | ||||
| 20% | 40% | 60% | 80% | 100% | |
| 0 | −0.19 | 0.20 | −0.10 | −0.31 | −0.17 |
| 2.5 | −0.50 | −0.43 | −0.36 | −0.72 | −0.84 |
| 5 | −1.00 | −1.10 | −1.26 | −1.53 | −1.52 |
| 7.5 | −1.62 | −1.95 | −1.91 | −2.49 | −2.13 |
| 10 | −2.10 | −2.30 | −2.65 | −4.17 | −3.39 |
| Percentage | 100% | 80% | 60% | 40% | 20% |
|---|---|---|---|---|---|
| number of points | 15169 | 12135 | 9101 | 6068 | 3034 |
| Area (m2) | 4.63 | 4.63 | 4.63 | 4.63 | 4.63 |
| density (points/m2) | 3278 | 2622 | 1967 | 1311 | 656 |
| Equivalent resolution (mm) | 17.47 | 19.53 | 22.55 | 27.62 | 39.06 |
Publisher’s Note: MDPI stays neutral with regard to jurisdictional claims in published maps and institutional affiliations. |
© 2021 by the authors. Licensee MDPI, Basel, Switzerland. This article is an open access article distributed under the terms and conditions of the Creative Commons Attribution (CC BY) license (https://creativecommons.org/licenses/by/4.0/).
Share and Cite
Seo, H.; Zhao, Y.; Chen, C. Displacement Estimation Error in Laser Scanning Monitoring of Retaining Structures Considering Roughness. Sensors 2021, 21, 7370. https://doi.org/10.3390/s21217370
Seo H, Zhao Y, Chen C. Displacement Estimation Error in Laser Scanning Monitoring of Retaining Structures Considering Roughness. Sensors. 2021; 21(21):7370. https://doi.org/10.3390/s21217370
Chicago/Turabian StyleSeo, Hyungjoon, Yang Zhao, and Cheng Chen. 2021. "Displacement Estimation Error in Laser Scanning Monitoring of Retaining Structures Considering Roughness" Sensors 21, no. 21: 7370. https://doi.org/10.3390/s21217370
APA StyleSeo, H., Zhao, Y., & Chen, C. (2021). Displacement Estimation Error in Laser Scanning Monitoring of Retaining Structures Considering Roughness. Sensors, 21(21), 7370. https://doi.org/10.3390/s21217370


