Abstract
Nowadays, hackers take illegal advantage of distributed resources in a network of computing devices (i.e., botnet) to launch cyberattacks against the Internet of Things (IoT). Recently, diverse Machine Learning (ML) and Deep Learning (DL) methods were proposed to detect botnet attacks in IoT networks. However, highly imbalanced network traffic data in the training set often degrade the classification performance of state-of-the-art ML and DL models, especially in classes with relatively few samples. In this paper, we propose an efficient DL-based botnet attack detection algorithm that can handle highly imbalanced network traffic data. Specifically, Synthetic Minority Oversampling Technique (SMOTE) generates additional minority samples to achieve class balance, while Deep Recurrent Neural Network (DRNN) learns hierarchical feature representations from the balanced network traffic data to perform discriminative classification. We develop DRNN and SMOTE-DRNN models with the Bot-IoT dataset, and the simulation results show that high-class imbalance in the training data adversely affects the precision, recall, F1 score, area under the receiver operating characteristic curve (AUC), geometric mean (GM) and Matthews correlation coefficient (MCC) of the DRNN model. On the other hand, the SMOTE-DRNN model achieved better classification performance with precision, recall, F1 score, AUC, GM and MCC. Additionally, the SMOTE-DRNN model outperformed state-of-the-art ML and DL models.
1. Introduction
The Internet-of-Things (IoT) paradigm enables physical objects to interconnect and communicate with each other via the Internet [1]. The popularity of IoT is fast-growing, and its adoption cuts across different areas of application such as energy, water, transport, defense, health, agriculture, etc. According to Cisco’s Annual Internet Report, billion IoT devices will be connected to the Internet by 2023 [2].
On the other hand, botnet is a network of compromised computers, known as bots, that are remotely controlled by a botmaster using a Command and Control (C&C) server [3]. Nowadays, hackers leverage botnets, such as Mirai [4,5], to exploit vulnerabilities in IoT devices and networks. They use this technique to launch different types of cyber-attacks against Internet-enabled infrastructures [6,7,8,9,10,11]. For example, in September 2016, the Mirai botnet compromised several IoT devices to launch a Distributed Denial of Service (DDoS) attack, increasing traffic up to 620 Gbps in a web server [5]. Additionally, in October 2016, a web-host and cloud service provider, Dyn, was hit with a DDoS attack, increasing traffic to about Tbps. The Mozi botnet was first discovered in October 2019. It accounted for close to of the total IoT network traffic monitored by IBM Security X-Force from that time until June 2020; this incidence increased IoT attack volume by compared to the total IoT attack cases in the last two years [12].
Cybercriminals can manipulate the energy market for a significant payoff of up to million if they have access to 50,000 high-wattage IoT devices for only three hours a day, 100 days a year [13,14]. Additionally, with the current COVID-19 pandemic, corporate and IoT networks have become more vulnerable to botnet attacks because these networks are now being accessed remotely more often than before [15]. Recent and complex botnet attacks that target IoT networks include Denial of Service (DoS), DDoS, Operating System (OS) Fingerprinting (OSF), Service Scanning (SS), Data Ex-filtration (DE) and Keylogging (KL) [16]. A unique DoS or DDoS attack can be launched using either a Hypertext Transfer Protocol (HTTP), a Transmission Control Protocol (TCP) or a User Datagram Protocol (UDP). Such botnet attacks are referred to as DoS-HTTP, DoS-TCP, DDoS-UDP, DDoS-HTTP, DDoS-TCP or DDoS-UDP attacks.
Botnet attack detection in IoT networks can be formulated as a classification problem [16]. For binary classification, each sample in a network traffic packet is classified as either benign or malicious based on certain predefined features. On the other hand, the specific category of botnet attack is identified in multi-class classification. Thus far, Artificial Intelligence (AI) techniques have achieved good performance in handling classification tasks in different application areas including voltage stability assessment of power systems among many others [17]. Specifically, various Machine Learning (ML) and Deep Learning (DL) models have been developed to classify network traffic data in IoT networks. These models learn the discriminating features of benign traffic and malicious traffic using different architectures such as Random Forest (RF) [18], Support Vector Machine (SVM) [19], Deep Neural Network (DNN) [20], Recurrent Neural Network (RNN) [21], Long Short-Term Memory (LSTM) [22] and Gated Recurrent Unit (GRU) [23]. For an in-depth understanding, comprehensive reviews and surveys on the application of ML and DL in intrusion detection are presented in [24,25,26,27,28,29].
Classification of highly imbalanced network traffic data is a difficult task. The data are said to be highly imbalanced when the ratio of the number of samples in the majority class to that of the minority class is more than 1:10 [30]. High class imbalance degrades the classification performance of ML and DL models in minority classes [31,32]. In addition to the class imbalance problem, small disjuncts, noise and overlap in network traffic samples can also lead to poor classification performance [33,34]. In popular botnet attack scenarios such as DDoS, the amount of malicious traffic generated is usually far more than the volume of benign traffic produced by legitimate devices in an IoT network. This means that the number of samples in the normal class is very low compared to the number of samples in the attack class. In this case, state-of-the-art DL models tend to be biased in favour of the majority (attack) class, and this increases the false positive (FP) rate [16]. The implication of deploying state-of-the-art ML and DL models in real-life IoT networks is that a significant percentage of network traffic data in the minority classes is misclassified, and this may, consequently, lead to a breach of privacy, loss of sensitive information, loss of revenue when applications and services are unavailable, and even loss of lives in critical IoT systems.
In this paper, we propose an efficient DL-based botnet attack detection algorithm to increase the detection rate and to reduce FP in minority classes without increasing the false negative (FN) rate in the majority classes. The main contributions of this paper are as follow:
- 1.
- An efficient DL-based botnet attack detection algorithm is proposed for highly imbalanced network traffic data. Synthetic Minority Oversampling Technique (SMOTE) generates additional minority samples to achieve class balance, while Deep RNN (DRNN) learns hierarchical feature representations from the balanced network traffic data to perform discriminative classification.
- 2.
- DRNN and SMOTE-DRNN models are trained, validated and tested with the Bot-IoT dataset to classify network traffic samples in the normal class and ten botnet attack classes.
- 3.
- We investigate the effect of class imbalance on the accuracy, precision, recall, F1 score, false positive rate (FPR), negative predictive value (NPV), area under the receiver operating characteristic curve (AUC), geometric mean (GM) and Matthews correlation coefficient (MCC) of the DRNN and SMOTE-DRNN models.
- 4.
- The training time and the testing time of the DRNN and SMOTE-DRNN models are analysed to evaluate their training speed and detection speed.
The rest of the paper is organised as follows: In Section 2, we review the state-of-the-art ML and DL methods proposed for botnet attack detection in IoT networks; in Section 3, we present a detailed description of the SMOTE-DRNN algorithm and model development process; in Section 4, we discuss the results; and in Section 5, we summarise the main findings of the paper.
2. Review of Related Works
In this section, we review the state-of-the-art ML and DL models that were developed with the Bot-IoT dataset [16] to detect botnet attacks in IoT networks. Currently, the Bot-IoT dataset is the most relevant and up-to-date publicly available dataset for botnet attack detection in IoT networks because it (a) has IoT network traffic samples, (b) captures complete network information, (c) has a diversity of complex IoT botnet attack scenarios, (d) contains accurate ground truth labels and (e) provides a massive volume of labeled data required for effective supervised DL.
In recent literature, researchers have recommended diverse ML and DL model architectures for botnet detection in IoT networks. Odusami et al. [35] proposed LSTM for DDoS attack detection in web servers, but they did not perform any experiment to validate the performance of the proposed method. Biswas and Roy [36] proposed the GRU model because it outperformed the Artificial Neural Network (ANN) and LSTM models. However, the performance evaluation was based on accuracy only. Popoola et al. [21] proposed Stacked RNN (SRNN), which involves cascading multiple layers of RNN. Tyagi and Kumar [37] recommended the RF model because it performed better than the k-Nearest Neighbour (kNN), Logistic Regression (LR), SVM, Multi-Layer Perceptron (MLP) and Decision Tree (DT) models. Lo et al. [38] proposed the Edge-based Graph Sample and Aggregate (E-GraphSAGE) model and it outperformed the Extreme Gradient Boosting (XGBoost) and DT models. Chauhan and Atulkar [39] suggested the Light Gradient Boosting Machine (LGBM) model because it outperformed RF, Extra Tree (ET), Gradient Boost (GB) and XGBoost models. In [40], the Convolutional Neural Network (CNN) model outperformed the RNN, LSTM and GRU models. Huong et al. [41,42] proposed a low-complexity edge-cloud DNN model, which achieved better performance than the kNN, DT, RF and SVM models. Lee et al. [43] employed RF for botnet attack classification in an IoT smart factory. Shafiq et al. [44] developed the Bayes Network (BN), C4.5 DT, Naive Bayes (NB), RF and Random Tree (RT) models. The bijective soft set algorithm [45] was used to determine the most effective ML model based on accuracy, precision, recall and training time. Zakariyya et al. [46] recommended LGBM as a resource-efficient ML method. Susilo et al. [47] proposed the CNN model for botnet detection in Software-Defined Networks (SDN), and it outperformed the RF model. In [48], the DNN model achieved a higher classification accuracy than the LR, kNN, DT, Classification And Regression Tree (CART) and SVM models. Das et al. [49] developed the RF, RT, NB, C4.5 DT, Reduced Error Pruning Tree (REPT), BN and partial decision tree (PART) models with the 10 best features in [16]. In [50], the DT model outperformed the NB, kNN and SVM models. Sriram et al. [51] concluded that DL models perform better than classical ML models.
In another group of studies, two or more ML/DL architectures were combined to form a hybrid model. Popoola et al. [22] proposed a hybrid DL method based on the combination of LSTM Autoencoder (LAE) and deep Bidirectional LSTM (BLSTM) model architectures. LAE reduces the dimensionality of network traffic features to save memory space and to increase computation speed. On the other hand, deep BLSTM learns the long-term temporal relationships among the low-dimensional features to correctly distinguish between benign traffic and different classes of botnet attack traffic. Priya et al. [52] combined SVM, NB, DT, RF and ANN to develop an ensemble classifier for attack detection in Industrial IoT (IIoT). Kunang et al. [53] proposed a hybrid DL method by cascading Autoencoder (AE) and DNN model structures. AE performs feature extraction, while DNN performs the classification task. Zixu et al. [54] merged Generative Adversarial Network (GAN) with AE to detect botnet attacks in distributed IoT networks. Ge et al. [55] combined the concept of transfer learning with DNN. Bhuvaneswari and Selvakumar [56] developed the Vector Convolutional Deep Learning (VCDL) model, which employed a vector convolutional network for feature extraction and a fully connected network for classification. Asadi et al. [57] developed a hybrid ML model, which comprised the DNN, SVM and C4.5 decision tree algorithms. Khraisat et al. [58] developed a hybrid ML model, which comprised One-Class SVM (OCSVM) and C4.5 DT. Aldhaheri et al. [59] developed a hybrid between the Self Normalising Neural Network (SNN) and Dendritic Cell Algorithm (DCA) models with five optimal network traffic features, which were selected from the 10 best features in [16] using the information gain method [60].
Furthermore, different optimisation techniques were proposed to improve the classification performance of ML and DL models. Popoola et al. [23] proposed a method that helps determine the most appropriate set of hyperparameters for training the Bidirectional GRU (BGRU) model in an efficient manner. Samdekar et al. [61] recommended the Firefly Algorithm (FA) for feature dimensionality reduction because it outperformed the Chi-Square, ET and Principal Component Analysis (PCA) methods when SVM was used for classification. Kumar et al. [62] proposed the combination of the correlation coefficient, RF mean decrease accuracy and gain ratio for selection of the most relevant features. Kunang et al. [53] and Injadat et al. [63] proposed the Bayesian Optimisation Gaussian Process (BO-GP) method to optimise the hyperparameters of the AE-DNN and DT models, respectively. In [64], Binary Grey Wolf Optimisation (BGWO) was used for feature selection while NB was used for classification. Orevski and Androcec [65] used Genetic Algorithm (GA) to optimise the hyperparameters of ANN. In [66], Particle Swarm Optimisation (PSO) algorithm was used to determine the best hyperparameters that maximise AUC.
In the literature, botnet attack detection in IoT networks was treated as a classification task. Different ML and DL models have been developed for botnet attack detection in binary, 5-class or 11-class classification scenarios. For binary classification, ML/DL models were developed such that each sample of the network traffic data in the Bot-IoT dataset was classified as either normal or attack. For 5-class classification, four categories of botnet attacks, namely DDoS, DoS, reconnaissance and theft, were considered. For the 11-class classification scenario, ten categories of botnet attacks, namely DDoS-HTTP (DDH), DDoS-TCP (DDT), DDoS-UDP (DDU), DoS-HTTP (DH), DoS-TCP (DT), DoS-UDP (DU), OS fingerprinting (OSF), service scanning (SS), data exfiltration (DE) and keylogging (KL), were considered. In order to cover all of the available botnet attack types, our study focuses on botnet attack detection in an 11-class classification scenario.
Ferrag et al. [67] proposed an RNN model that employs a single hidden layer and 60 hidden neurons. The model was trained with 1,878,561 network traffic samples for five epochs using a batch size of 100. The classification performance of the RNN model was evaluated with 1,797,803 network traffic samples in the test set. The RNN model outperformed the SVM, RF and NB models. The RNN model had the highest recall value for each of the 10 botnet attack classes. Furthermore, the overall recall and the FPR of the RNN model were the highest and lowest, respectively.
Ferrag et al. [68] investigated the effectiveness of three deep discriminative models (DNN, RNN and CNN) and four deep generative models (Restricted Boltzmann Machine (RBM), Deep Belief Network (DBN), Deep Boltzmann Machine (DBM) and Deep AE (DAE)) for botnet attack detection in IoT networks. These models employed a single hidden layer and 15–100 hidden neurons. The activation functions at the hidden layer and the output layer were sigmoid and softmax, respectively. The DL models were trained with 5,877,647 network traffic samples for 100 epochs, given a learning rate of 0.01–0.5 and a batch size of 1000. The classification performance of the DL models was evaluated with 1,469,413 network traffic samples in the test set. The authors presented the recall of the DL models for the 10 botnet attack classes. Additionally, the overall recall, TNR, FPR and accuracy were reported. The CNN model outperformed the DNN and RNN models, while the DAE model outperformed the RBM, DBN and DBM models.
Ferrag et al. [69] combined the REP Tree, JRip and Forest PA algorithms to form a hybrid ML model named RDTIDS. The REP Tree and JRip models were trained with 5,877,647 network traffic samples to perform binary classification. The outputs of the two models were combined with the network traffic features in the training set to develop the Forest PA model for multi-class classification. The classification performance of the RDTIDS model was evaluated with 1,469,413 network traffic samples in the test set. The authors presented the recall of the RDTIDS model for the 10 botnet attack classes. Additionally, the overall recall, FPR and accuracy were reported. The RDTIDS model outperformed the RF, REP Tree, MLP, NB, JRip, SVM and J48 models.
Alkadi et al. [70] proposed a BLSTM model that employed a single hidden layer and 60 hidden neurons. BLSTM model was trained, validated and tested with , and of the network traffic samples for 200 epochs, given a batch size of 100 and an Adam optimiser. The activation functions at the hidden layer and the output layer were hyperbolic tangent (tanh) and softmax, respectively. The authors presented the recall of the BLSTM model for the 10 botnet attack classes. Additionally, the overall recall, FPR and accuracy were reported. The BLSTM model outperformed the SVM, RF and NB models.
SMOTE is a method that can effectively handle the class imbalance problem in training data, but it must be combined with the right classifier. Pokhrel et al. [71] proposed SMOTE-kNN to address the class imbalance problem in botnet detection. However, the study focused on binary classification, and the IR in the training data was 1:208. Bagui and Li [72] studied the effects of random undersampling (RU), random oversampling (RO), RU-RO, RU-SMOTE and RU with Adaptive Synthetic (ADSYN) methods on the performance of the ANN model. Qaddoura et al. [73] combined SVM-SMOTE with DNN to handle a class imbalance in binary classification. Derhab et al. [74] employed a combination of SMOTE and Temporal CNN to address the class imbalance in 5-class classification. However, the SMOTE method has not been previously combined with the DRNN model. Additionally, previous applications of SMOTE focused on binary and 5-class classification, but none of them applied it to solve the 11-class classification problem.
Table 1 shows that the distribution of network traffic samples in the training set is highly imbalanced across the 11 classes. The number of samples in the minority classes (DDH, DH, Norm, DE and KL) is relatively fewer than those in the majority classes (DDT, DDU, DT, DU, OF and SS). For majority classes, high class imbalance in the training set degrades the classification performance of state-of-the-art ML and DL models. Therefore, state-of-the-art ML and DL models may not detect DDH, DH, Norm, DE and KL correctly in IoT networks. In this paper, the number of samples in the Norm, DE and KL classes is relatively few compared to those in the previous studies. Therefore, the class imbalance problem in the present study is more challenging. Additionally, in previous related work [67,68,69,70], the recall values for the Norm class were not reported and the authors did not present the accuracy, precision, F1 score, FPR, NPV, AUC, GM and MCC of the ML/DL models for each of the 11 classes.

Table 1.
Sample distribution in the training set for the 11-class classification scenario.
3. SMOTE-DRNN Algorithm and Model Development
In this section, we present the SMOTE-DRNN algorithm and we describe the DL model development process shown in Figure 1. This includes information about the network traffic data, data pre-processing, SMOTE and DRNN.
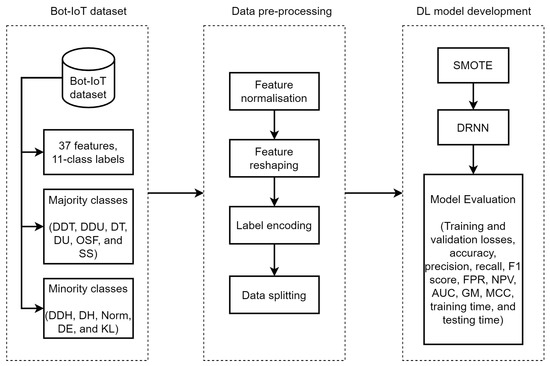
Figure 1.
SMOTE-DRNN for botnet attack detection in IoT networks.
3.1. Network Traffic Data
The Bot-IoT dataset contains 43 network traffic features and three categories of labels for binary, 5-class and 11-class classification each. The names and descriptions of the features and labels are provided in [16]. However, only 37 out of the 43 features were found to be relevant for botnet attack detection in IoT networks. Specifically, pkSeqID, saddr, daddr, proto, state and flgs were excluded. We observed that pkSeqID, saddr and daddr are device-specific, while proto, state and flgs give the same information as proto_number, state_number and flgs_number. In order to detect botnet attacks in a more specific manner, we considered an 11-class classification scenario.
Table 2 shows the sample distribution across the 11 classes in the training, validation and test sets. We noticed that there is high class imbalance in the network traffic data. This often degrades the classification performance of ML and DL models in the minority classes [31,32]. In this paper, the minority classes include DDH, DH, Norm, DE and KE because they have relatively few samples compared to the majority classes, i.e., DDT, DDU, DT, DU, OSF and SS.
Table 2.
Data samples in the training, validation and test sets.
3.2. Data Preprocessing
The network traffic features and 11-class labels in the training, validation and test sets were transformed into different forms for ease of computation and to achieve better convergence during the DL model development process. The data preprocessing includes feature normalisation, feature reshaping, label encoding and data splitting. First, each of the values of the network traffic features was scaled to a range of 0 and 1 using the min–max normalisation method given by Equation (1) [75,76]:
where x is a network traffic feature vector while and are the minimum and maximum values of , respectively. In order to enable development of the DRNN model, an extra dimension was included in the feature set to represent a unit time step (i.e., t = 1). This changed the dimension of the feature set from to , where p is the total number of samples and q is the total number of features. Numeric values of the 11 classes in the label vector were represented by integers 0–10. Lastly, as shown in Table 2, the complete network traffic data were randomly split into training (, validation () and test sets () to train and evaluate the robustness of DL models against underfitting and overfitting. In this paper, we employed the hold-out validation method to handle overfitting in the neural networks. During model training, the samples in the validation set were used to tune the model hyperparameters. In addition, the generalisation ability of DL models was evaluated with the previously unseen network traffic samples in the test set.
3.3. Synthetic Minority Oversampling Technique
The SMOTE algorithm was proposed to deal with the high class imbalance problem in the training set in an 11-class classification scenario. Unlike the method in [77,78], which oversamples minority classes with replacement, the method employed in this paper generates synthetic examples using techniques such as rotation and skew in order to achieve class balance [79].
These synthetic network traffic data were generated along the line segments joining the k nearest neighbours of the minority classes, where k . Therefore, the neighbours from the three nearest neighbours were randomly selected. The step-wise process of SMOTE is presented in Algorithm 1. The generation of synthetic samples (S) in the minority classes depends on the number of minority class samples (T), the oversampling rate () and the number of nearest neighbours (k). If N is less than , the minority class samples are randomised. We compute k nearest neighbours for each of the minority classes only. This is a function of N, the current minority class sample (i), the integral multiples of 100 in N (j) and an array of random numbers (). is an array of original minority class samples, r is the number of synthetic samples generated and is an array of synthetic samples.
| Algorithm 1: SMOTE algorithm. |
 |
3.4. Deep Recurrent Neural Network
The highly imbalanced network traffic data and its corresponding ground-truth labels are represented by and , respectively. The DRNN model was trained with and such that the developed classification models can accurately predict when only is provided in real-life applications. and represent known and previously unknown highly imbalanced network traffic data, respectively, while and are ground-truth labels of and , respectively. During model training, the performance of DRNN was confirmed with a different highly imbalanced network traffic data, , and its ground-truth labels, . The DL model has a single recurrent layer, four dense layers and a dense output layer.
Unlike Feedforward Neural Network (FNN), RNN has a hidden state that helps model temporal dynamics of input data. RNN learns the temporal dynamics of a mini-batch of highly imbalanced network traffic features, , by transforming the input data and initial hidden state, , with trainable parameters, as stated in Equation (2):
where is the new hidden state when RNN is trained with the mini-batch; and are the weights used for linear transformation of and , respectively; and is the bias. The RNN layer output is further processed based on Equations (3)–(9) to produce a DRNN layer output. Complete information about DRNN is presented in Algorithm 2.
The hidden states of the four dense hidden layers are obtained by Equation (3):
where ; is the hidden state of the hidden layer; ; is the weight used for linear transformation of previous hidden state, ; is the bias of the hidden layer; and is a Rectified Linear Unit (ReLU) activation function given by Equation (4):
If a is a negative value, the function returns 0; however, the same a is returned when it is a positive value.
| Algorithm 2: DRNN algorithm. |
 |
The hidden state of the fourth dense layer, , is transformed by the dense output layer, as stated in Equation (5):
where n is the sample size of mini-batch of and ; is the batch size, and ; is the weight used for linear transformation of ; is the bias of dense output layer; and is the activation function of dense output layer.
In the multi-class classification scenario, is a softmax function given by Equation (6):
where is the number of classes in while the difference between and is measured by the categorical cross-entropy loss function in Equation (7):
The performance of DRNN was validated with different previously unknown highly imbalanced network traffic data, , and its corresponding ground-truth labels, . Training loss and validation loss are minimised in mini-batches over u epochs using an efficient first-order stochastic gradient descent algorithm named Adam from [80]. The trainable parameters of the densely connected DL model are represented by Equation (8):
For each epoch, the Adam optimiser, , updates to minimise L, as stated in Equation (9):
where is the new set of trainable parameters, is the learning rate (), and and are the exponential decay rates ( and , respectively).
The DRNN and SMOTE-DRNN models were trained with network traffic features and ground truth labels in the Bot-IoT dataset to perform 11-class classification. The performance of ML and DL models depends on the quality of training data, choice of model architecture and selection of appropriate hyperparameters. The right set of model hyperparameters is often determined by extensive experimentation. We adopted the method proposed in [23], and the following hyperparameters were found to be most suitable for our classification task: 100 units each in the RNN and the four dense layers of the DL models, a batch size of 64 and 10 epochs. In this paper, all of the experiments were performed using the Numpy, Pandas, Scikit-learn and Keras libraries that were developed using Python programming language. The Python codes were written and implemented within Spyder Integrated Development Environment (IDE) running on an Ubuntu 16.04 LTS workstation.
4. Results and Discussion
In this section, we evaluate the effectiveness of the DRNN and SMOTE-DRNN models with respect to their robustness against underfitting and overfitting as well as their generalisation ability.
4.1. Classification Performance Metrics
We compared the classification performance of thet SMOTE-DRNN model with that of the DRNN model and the state-of-the-art ML/DL models based on training loss, validation loss, accuracy, precision, recall, F1 score, FPR, NPV, area under the receiver operating characteristic curve (AUC), geometric mean (GM), Matthews correlation coefficient (MCC), training time and testing time. One of the objectives of this paper is to investigate the effect of highly imbalanced network traffic data on the performance of the DRNN and SMOTE-DRNN models. Therefore, we decided to conduct an extensive investigation that includes all of the performance metrics that are relevant to a typical classification task. Accuracy, precision, recall, F1 score, FPR, NPV, AUC, GM and MCC are represented by Equations (10)–(18):
where TP is the number of IoT botnet attack samples that are correctly classified as IoT botnet attack traffic, FP is the number of normal samples that are misclassified as IoT botnet attack traffic, TN is the number of normal samples that are correctly classified as normal traffic and FN is the number of IoT botnet attack samples that are misclassified as normal traffic.
4.2. Robustness against Model Underfitting and Overfitting
In this subsection, we analyse the cross-entropy losses of the DRNN and SMOTE-DRNN models during training and validation to evaluate their robustness against underfitting and overfitting, respectively.
Figure 2 shows the cross-entropy losses of DRNN and SMOTE-DRNN models during training. Generally, the cross-entropy losses were reduced as the number of epochs increased from 1 to 10. Specifically, the cross-entropy loss of the DRNN model was reduced from to while that of the SMOTE-DRNN model was reduced from to . At the end of model training, the cross-entropy loss of the SMOTE-DRNN model was lower by compared to that of the DRNN model. This implies that the SMOTE-DRNN model is robust against underfitting compared to the DRNN model.
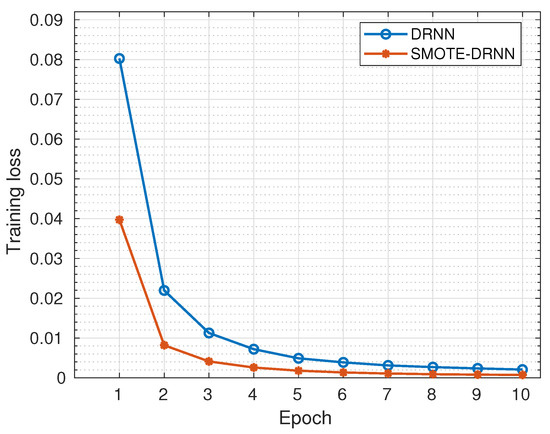
Figure 2.
Training losses of the DRNN and SMOTE-DRNN models.
Figure 3 shows the cross-entropy losses of the DRNN and SMOTE-DRNN models during validation. Generally, the cross-entropy losses were reduced as the number of epochs increased from 1 to 10. Specifically, the cross-entropy loss of the DRNN model was reduced from to while that of the SMOTE-DRNN model was reduced from to . At the end of model training, the cross-entropy loss of the SMOTE-DRNN model was lower by compared to that of the DRNN model. This implies that the SMOTE-DRNN model is robust against overfitting compared to the DRNN model.
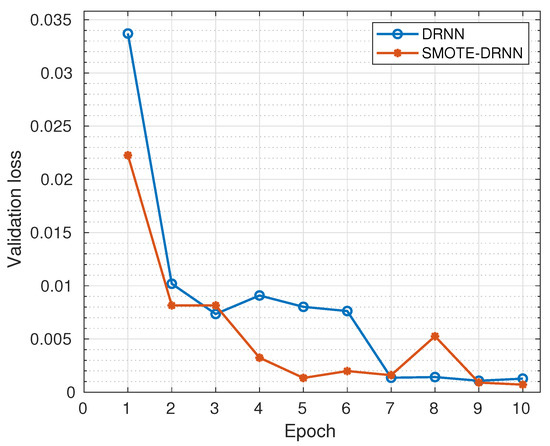
Figure 3.
Validation losses of the DRNN and SMOTE-DRNN models.
The training speeds of the DRNN and SMOTE-DRNN models were evaluated based on the number of samples in the training set and the training time. The DRNN model spent s learning the feature representation of highly imbalanced network traffic from 2,201,112 samples. On the other hand, the SMOTE-DRNN model generated more minority samples to achieve class imbalance, and this increased its computation time. The generation of minority samples took s, and the SMOTE-DRNN model spent s learning the feature representation of balanced network traffic from 6,813,554 samples.
4.3. Classification Performance
In this subsection, we analyse the accuracy, precision, recall, F1 score, FPR, NPV, AUC, GM and MCC of the DRNN and SMOTE-DRNN models to evaluate their classification performance with network traffic samples in the test set.
Table 3 presents the accuracy, precision, recall, F1 score, FPR, NPV, AUC, GM and MCC of DRNN and SMOTE-DRNN models for each of the 11 classes. Despite the class imbalance in the training set, the accuracy and NPV of the DRNN model were very high (≈100%) and its FPR was very low (≈0%) for all of the classes. Similarly, the precision, recall, F1 score, AUC, GM and MCC of the DRNN model for the majority classes were very high (≈100%). However, the precision, recall, F1 score, AUC, GM and MCC of the DRNN model for the minority classes were relatively lower compared to those of the majority classes.
Table 3.
Classification performance of ML and DL models across 11 classes (all metrics are in %).
On the contrary, the SMOTE-DRNN model achieved higher precision, recall, F1 score, AUC, GM and MCC for the minority classes compared to the DRNN model. For DDH class, the precision, recall, F1 score, AUC, GM and MCC were higher by , , , , and , respectively. For the DH class, the precision, recall, F1 score, AUC, GM and MCC were , , , , and , respectively. For the Norm class, the precision, F1 score, GM and MCC were higher by , , and , respectively. Table 2 shows that there is only one sample for the DE class in the test set. Unfortunately, the DRNN model did not correctly classify this sample. The confusion matrix of the DRNN model in Figure 4 shows that TP, TN, FP and FN were 0, 733, 531, 0 and 1, respectively. Based on Equations (10)–(18), the accuracy and the NPV were each; the precision, GM and MCC were undefined; while the recall and F1 score were each. These seemingly improbable results were due to the high class imbalance in the training set. In this case, the DRNN model became biased in favour of the majority classes because the number of samples in these classes was relatively larger. Hence, most of the samples in the majority classes were correctly classified while the lone sample in the minority class (DE) was incorrectly classified. For the KL class, the precision, recall, F1 score and MCC were higher by each, the AUC was higher by while GM was higher by . These imply that the SMOTE-DRNN model achieved better generalisation ability for minority classes.
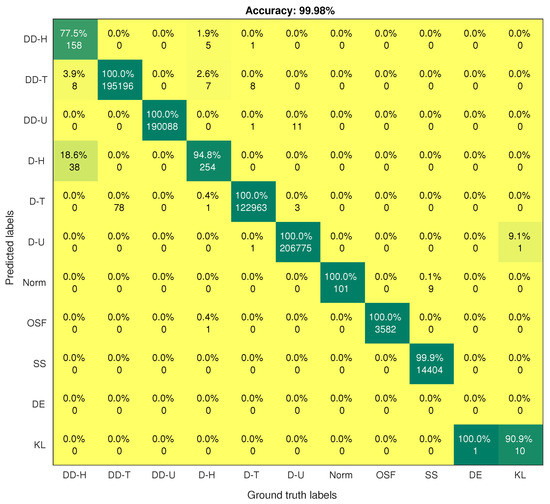
Figure 4.
Confusion matrix of the DRNN model.
Highly imbalanced network traffic data in the training set adversely affect the precision, recall, F1 score, AUC, GM and MCC of the DRNN model. The accuracy, FPR and NPV of DL models that were trained with highly imbalanced data can be misleading. Hence, researchers should not rely only on accuracy, FPR and NPV to evaluate DL models when the training data are highly imbalanced. Other research works that involve highly imbalanced data also confirmed that accuracy can be very high and misleading in this case [32,81].
Figure 4 and Figure 5 show the confusion matrices of the DRNN and SMOTE-DRNN models, respectively. For DDH attack detection, the DRNN model classified of the samples in the DDH class correctly, and the detection rate of the SMOTE-DRNN model was higher by . For DH attack detection, the DRNN model classified of the samples in the DH class correctly, and the detection rate of the SMOTE-DRNN model was higher by . For DE attack detection, the DRNN model could not classify any of the samples in the DE class correctly, and the detection rate of the SMOTE-DRNN model was higher by . For KL attack detection, the DRNN model classified of the samples in KL class correctly, and the detection rate of the SMOTE-DRNN model was higher by . These imply that the SMOTE-DRNN model is more efficient for botnet attack detection in IoT networks than the DRNN model.
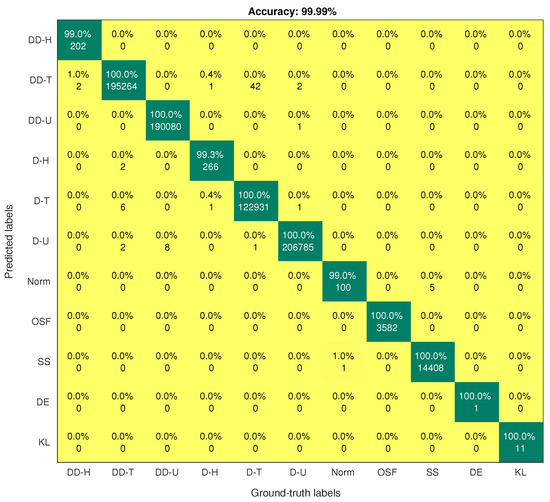
Figure 5.
Confusion matrix of the SMOTE-DRNN model.
The detection speeds of the DRNN and SMOTE-DRNN models were evaluated based on the number of samples in the test set and on the testing time. The DRNN model classified samples in s, while it took the SMOTE-DRNN model s to classify the same number of samples.
4.4. Comparison with State-of-the-Art ML/DL Models
In this subsection, we compare the classification performance, the training speed and the detection speed of the SMOTE-DRNN model with those of the state-of-the-art ML/DL models. First, we analyse the accuracy, precision, recall, F1 score, FPR, NPV, AUC, GM and MCC of SMOTE-DRNN model and state-of-the-art ML/DL models to evaluate their ability to correctly detect normal traffic and the ten botnet attacks in IoT networks. Then, we evaluate the training speed based on the time taken to train the models with network traffic samples in the training set. Finally, the detection speed is evaluated based on the time taken to classify the network traffic samples in the test set.
Table 4 shows the recall of the SMOTE-DRNN model and those of the state-of-the-art ML/DL models. Unlike the state-of-the-art ML/DL models, the SMOTE-DRNN model achieved a very high recall (>) in each of the 11 classes. Specifically, the SMOTE-DRNN model achieved higher recall than the state-of-the-art ML/DL models in the following cases:
Table 4.
Recall of the ML and DL models across 11 classes (all metrics are in %).
- 1.
- The OSF, SS and KL classes for the RNN model in [67];
- 2.
- All classes, except DU, for the SVM model in [67];
- 3.
- All classes for the RF and NB models in [67];
- 4.
- All classes, except DE, for the DL models in [68];
- 5.
- All classes, except DT, DU, DE and KL, for the RDTIDS model in [69]; and
- 6.
- The OSF, SS, DE and KL classes for the BLSTM model in [70].
Recall of the state-of-the-art ML/DL models for the Norm class was not reported in the literature. Additionally, the accuracy, precision, F1 score, FPR, NPV, AUC, GM and MCC of the state-of-the-art ML/DL models in each of the 11 classes were not reported in the literature. Furthermore, we performed the Friedman test with the corresponding post hoc Nemenyi test to compare the recall of the ML and DL models. Although the differences in the recall of the models are not statistically significant, Figure 6 shows that the classification performance of the SMOTE-DRNN model is better than those of the state-of-the-art ML/DL models.
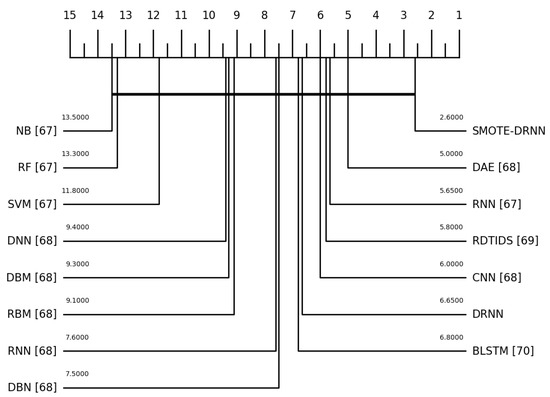
Figure 6.
Critical distance diagram showing the mean ranks of the ML/DL models.
Table 5 presents the overall classification performance, training time and the testing time of the SMOTE-DRNN model and those of the state-of-the-art ML/DL models. The overall accuracy of the SMOTE-DRNN model was higher and its FPR was lower than those of the state-of-the-art ML/DL models. The overall precision, recall, F1 score, NPV, AUC, GM and MCC of the state-of-the-art ML/DL models were not reported in the literature. The time taken to train the SMOTE-DRNN model with network traffic samples in the training set was shorter than that of the state-of-the-art ML/DL models, except RNN [67], DNN [68], RDTIDS [69] and BLSTM [70]. Ferrag et al. [67] did not report the training time of the SVM, RF and NB models. The testing time of most of the state-of-the-art ML/DL models was not reported in the literature. The time taken to classify the network traffic samples in the test set was shorter than that of the RNN [67] and BLSTM [70] models.
Table 5.
Overall classification performance of the ML and DL models (all metrics are in %).
5. Conclusions
In this paper, a hybrid algorithm, SMOTE-DRNN, was proposed for the multi-class classification of highly imbalanced network traffic data to detect ten classes of botnet attacks, namely DDH, DDT, DDU, DH, DT, DU, OSF, SS, DE and KL, in IoT networks. First, the SMOTE oversampling method generates more samples in the minority classes to achieve class balance. Then, DRNN learns the hierarchical feature representations from the balanced network traffic data to perform discriminative classification. The DRNN and SMOTE-DRNN models were trained, validated and tested with the Bot-IoT dataset, and their classification performance was analysed. Finally, the classification performance of the SMOTE-DRNN model was compared with the state-of-the-art ML/DL models. The major findings of this study are as follows:
- 1.
- The training and validation losses of the SMOTE-DRNN model were lower by and , respectively, compared to those of the DRNN model.
- 2.
- The DRNN and SMOTE-DRNN models achieved high classification performance in the majority classes (DDT, DDU, DT, DU, OSF and SS).
- 3.
- Accuracy, FPR and NPV are not suitable metrics for evaluating classification performance when the sample distribution across the classes of network traffic data is highly imbalanced.
- 4.
- For minority classes (DDH, DH, Norm, DE and KL), the precision, recall, F1 score, AUC, GM and MCC of the DRNN model were low due to high class imbalance.
- 5.
- On the other hand, the SMOTE-DRNN model achieved higher values of precision, recall, F1 score, AUC, GM and MCC in all 11 classes than the DRNN model.
- 6.
- The SMOTE-DRNN model outperformed the state-of-the-art ML/DL models.
These results showed that the SMOTE-DRNN model is robust against underfitting and overfitting. Additionally, SMOTE-DRNN demonstrated a better generalisation ability in minority classes. The major limitation/trade-off in the SMOTE-DRNN model is that it has a higher computation cost and longer training time than the DRNN model. In the future, we plan to investigate the effectiveness of the most recent versions of SMOTE (such as SMOTE-Cov) as well as generative DL models including Generative Adversarial Network (GAN) and Variational Autoencoder (VAE).
Author Contributions
Conceptualisation, S.I.P., B.A. and R.A.; methodology, S.I.P., B.A., R.A., M.H., K.A. and A.A.A.; software, S.I.P.; validation, S.I.P., B.A. and R.A.; formal analysis, S.I.P. and B.A.; investigation, S.I.P.; resources, B.A. and R.A.; data curation, S.I.P.; writing—original draft preparation, S.I.P.; writing—review and editing, B.A., R.A., M.H., K.A. and A.A.A.; visualisation, S.I.P. and B.A.; supervision, B.A. and M.H.; project administration, B.A., R.A. and M.H.; funding acquisition, B.A. and A.A.A. All authors have read and agreed to the published version of the manuscript.
Funding
This research was funded in part by Cyraatek Ltd UK; the Faculty of Science & Engineering, Manchester Metropolitan University; ENERGY-IQ project, a UK–Canada Power Forward Smart Grid Demonstrator project funded by The Department for Business, Energy and Industrial Strategy (BEIS) under Grant 7454460; the NICE (Nigerian Intelligent Clean Energy) Marketplace project funded by the Department for International Development (DFID); and the Covenant University Centre for Research, Innovation and Discovery (CUCRID).
Institutional Review Board Statement
Not applicable.
Informed Consent Statement
Not applicable.
Data Availability Statement
Bot-IoT dataset is available from https://ieee-dataport.org/documents/bot-iot-dataset (accessed on 12 January 2021).
Conflicts of Interest
The authors declare no conflict of interest. The funders had no role in the design of the study; in the collection, analyses or interpretation of data; in the writing of the manuscript; or in the decision to publish the results.
References
- Zanella, A.; Bui, N.; Castellani, A.; Vangelista, L.; Zorzi, M. Internet of things for smart cities. IEEE Internet Things J. 2014, 1, 22–32. [Google Scholar] [CrossRef]
- Cisco. Annual Internet Report (2018–2023). Available online: https://www.cisco.com/c/en/us/solutions/collateral/executive-perspectives/annual-internet-report/white-paper-c11-741490.html (accessed on 19 September 2020).
- Vormayr, G.; Zseby, T.; Fabini, J. Botnet communication patterns. IEEE Commun. Surv. Tutor. 2017, 19, 2768–2796. [Google Scholar] [CrossRef]
- Antonakakis, M.; April, T.; Bailey, M.; Bernhard, M.; Bursztein, E.; Cochran, J.; Durumeric, Z.; Halderman, J.A.; Invernizzi, L.; Kallitsis, M.; et al. Understanding the mirai botnet. In Proceedings of the 26th USENIX Security Symposium (USENIX Security 17), Vancouver, BC, Canada, 16–18 August 2017; pp. 1093–1110. [Google Scholar]
- Kolias, C.; Kambourakis, G.; Stavrou, A.; Voas, J. DDoS in the IoT: Mirai and other botnets. Computer 2017, 50, 80–84. [Google Scholar] [CrossRef]
- Lee, R.M.; Assante, M.J.; Tim, C. Analysis of the cyber attack on the Ukrainian power grid. Electr. Inf. Shar. Anal. Cent. 2016, 388, 1–23. [Google Scholar]
- Davis, B.D.; Mason, J.C.; Anwar, M. Vulnerability Studies and Security Postures of IoT Devices: A Smart Home Case Study. IEEE Internet Things J. 2020, 7, 10102–10110. [Google Scholar] [CrossRef]
- Zhou, W.; Jia, Y.; Peng, A.; Zhang, Y.; Liu, P. The effect of iot new features on security and privacy: New threats, existing solutions, and challenges yet to be solved. IEEE Internet Things J. 2018, 6, 1606–1616. [Google Scholar] [CrossRef]
- Stoyanova, M.; Nikoloudakis, Y.; Panagiotakis, S.; Pallis, E.; Markakis, E.K. A Survey on the Internet of Things (IoT) Forensics: Challenges, Approaches and Open Issues. IEEE Commun. Surv. Tutor. 2020, 22, 1191–1221. [Google Scholar] [CrossRef]
- Stellios, I.; Kotzanikolaou, P.; Psarakis, M.; Alcaraz, C.; Lopez, J. A survey of iot-enabled cyberattacks: Assessing attack paths to critical infrastructures and services. IEEE Commun. Surv. Tutor. 2018, 20, 3453–3495. [Google Scholar] [CrossRef]
- Qiu, T.; Chen, N.; Li, K.; Atiquzzaman, M.; Zhao, W. How can heterogeneous Internet of Things build our future: A survey. IEEE Commun. Surv. Tutor. 2018, 20, 2011–2027. [Google Scholar] [CrossRef]
- McMillen, D.; Gao, W.; DeBeck, C. A New Botnet Attack Just Mozied into Town. Available online: https://securityintelligence.com/posts/botnet-attack-mozi-mozied-into-town/ (accessed on 18 September 2020).
- Soltan, S.; Mittal, P.; Poor, H.V. BlackIoT: IoT botnet of high wattage devices can disrupt the power grid. In Proceedings of the 27th USENIX Security Symposium (USENIX Security 18), Baltimore, MD, USA, 15–17 August 2018; pp. 15–32. [Google Scholar]
- Soltan, S.; Mittal, P.; Poor, H.V. Protecting the grid against iot botnets of high-wattage devices. arXiv 2018, arXiv:1808.03826. [Google Scholar]
- Lallie, H.S.; Shepherd, L.A.; Nurse, J.R.; Erola, A.; Epiphaniou, G.; Maple, C.; Bellekens, X. Cyber security in the age of covid-19: A timeline and analysis of cyber-crime and cyber-attacks during the pandemic. arXiv 2020, arXiv:2006.11929. [Google Scholar]
- Koroniotis, N.; Moustafa, N.; Sitnikova, E.; Turnbull, B. Towards the development of realistic botnet dataset in the internet of things for network forensic analytics: Bot-iot dataset. Future Gener. Comput. Syst. 2019, 100, 779–796. [Google Scholar] [CrossRef]
- Zhang, M.; Li, J.; Li, Y.; Xu, R. Deep Learning for Short-Term Voltage Stability Assessment of Power Systems. IEEE Access 2021, 9, 29711–29718. [Google Scholar] [CrossRef]
- Ajdani, M.; Ghaffary, H. Introduced a new method for enhancement of intrusion detection with random forest and PSO algorithm. Secur. Priv. 2021, 4, e147. [Google Scholar]
- Mohammadi, M.; Rashid, T.A.; Karim, S.H.T.; Aldalwie, A.H.M.; Tho, Q.T.; Bidaki, M.; Rahmani, A.M.; Hoseinzadeh, M. A comprehensive survey and taxonomy of the SVM-based intrusion detection systems. J. Netw. Comput. Appl. 2021, 178, 102983. [Google Scholar] [CrossRef]
- Ramaiah, M.; Chandrasekaran, V.; Ravi, V.; Kumar, N. An intrusion detection system using optimized deep neural network architecture. Trans. Emerg. Telecommun. Technol. 2021, 32, e4221. [Google Scholar]
- Popoola, S.I.; Adebisi, B.; Hammoudeh, M.; Gacanin, H.; Gui, G. Stacked recurrent neural network for botnet detection in smart homes. Comput. Electr. Eng. 2021, 92, 107039. [Google Scholar] [CrossRef]
- Popoola, S.I.; Adebisi, B.; Hammoudeh, M.; Gui, G.; Gacanin, H. Hybrid Deep Learning for Botnet Attack Detection in the Internet of Things Networks. IEEE Internet Things J. 2020, 8, 4944–4956. [Google Scholar] [CrossRef]
- Popoola, S.I.; Ande, R.; Fatai, K.B.; Adebisi, B. Deep Bidirectional Gated Recurrent Unit for Botnet Detection in Smart Homes. In Machine Learning and Data Mining for Emerging Trend in Cyber Dynamics: Theories and Applications; Springer: Cham, Switzerland, 2021; p. 29. [Google Scholar]
- Aversano, L.; Bernardi, M.L.; Cimitile, M.; Pecori, R. A systematic review on Deep Learning approaches for IoT security. Comput. Sci. Rev. 2021, 40, 100389. [Google Scholar] [CrossRef]
- Chauhan, M.; Agarwal, M. Study of Various Intrusion Detection Systems: A Survey. Smart Sustain. Intell. Syst. 2021, 25, 355–372. [Google Scholar]
- Sarker, I.H. Machine learning: Algorithms, real-world applications and research directions. SN Comput. Sci. 2021, 2, 1–21. [Google Scholar] [CrossRef]
- Khraisat, A.; Alazab, A. A critical review of intrusion detection systems in the internet of things: Techniques, deployment strategy, validation strategy, attacks, public datasets and challenges. Cybersecurity 2021, 4, 1–27. [Google Scholar] [CrossRef]
- Hamid, H.; Noor, R.M.; Omar, S.N.; Ahmedy, I.; Anjum, S.S.; Shah, S.A.A.; Kaur, S.; Othman, F.; Tamil, E.M. IoT-based botnet attacks systematic mapping study of literature. Scientometrics 2021, 126, 2759–2800. [Google Scholar] [CrossRef]
- Ahmad, R.; Alsmadi, I. Machine learning approaches to IoT security: A systematic literature review. Internet Things 2021, 14, 100365. [Google Scholar] [CrossRef]
- Fernández, A.; García, S.; del Jesus, M.J.; Herrera, F. A study of the behaviour of linguistic fuzzy rule based classification systems in the framework of imbalanced data-sets. Fuzzy Sets Syst. 2008, 159, 2378–2398. [Google Scholar] [CrossRef]
- Van Hulse, J.; Khoshgoftaar, T.M.; Napolitano, A. Experimental perspectives on learning from imbalanced data. In Proceedings of the 24th International Conference on Machine Learning, Corvallis, OR, USA, 20–24 June 2007; pp. 935–942. [Google Scholar]
- Jing, X.Y.; Zhang, X.; Zhu, X.; Wu, F.; You, X.; Gao, Y.; Shan, S.; Yang, J.Y. Multiset feature learning for highly imbalanced data classification. IEEE Trans. Pattern Anal. Mach. Intell. 2019, 43, 139–156. [Google Scholar] [CrossRef] [PubMed]
- Jo, T.; Japkowicz, N. Class imbalances versus small disjuncts. ACM Sigkdd Explor. Newsl. 2004, 6, 40–49. [Google Scholar] [CrossRef]
- Lu, Y.; Cheung, Y.m.; Tang, Y.Y. Bayes Imbalance Impact Index: A Measure of Class Imbalanced Data Set for Classification Problem. IEEE Trans. Neural Netw. Learn. Syst. 2019, 31, 3525–3539. [Google Scholar] [CrossRef] [PubMed]
- Odusami, M.; Misra, S.; Adetiba, E.; Abayomi-Alli, O.; Damasevicius, R.; Ahuja, R. An improved model for alleviating layer seven distributed denial of service intrusion on webserver. J. Phys. Conf. Ser. 2019, 1235, 012020. [Google Scholar] [CrossRef]
- Biswas, R.; Roy, S. Botnet traffic identification using neural networks. Multimed. Tools Appl. 2021. [Google Scholar] [CrossRef]
- Tyagi, H.; Kumar, R. Attack and Anomaly Detection in IoT Networks Using Supervised Machine Learning Approaches. Rev. d’Intell. Artif. 2021, 35, 11–21. [Google Scholar]
- Lo, W.W.; Layeghy, S.; Sarhan, M.; Gallagher, M.; Portmann, M. E-GraphSAGE: A Graph Neural Network based Intrusion Detection System. arXiv 2021, arXiv:2103.16329. [Google Scholar]
- Chauhan, P.; Atulkar, M. Selection of Tree Based Ensemble Classifier for Detecting Network Attacks in IoT. In Proceedings of the 2021 International Conference on Emerging Smart Computing and Informatics (ESCI), Pune, India, 5–7 March 2021; pp. 770–775. [Google Scholar]
- Idrissi, I.; Boukabous, M.; Azizi, M.; Moussaoui, O.; El Fadili, H. Toward a deep learning-based intrusion detection system for IoT against botnet attacks. IAES Int. J. Artif. Intell. 2021, 10, 110. [Google Scholar]
- Huong, T.T.; Bac, T.P.; Long, D.M.; Thang, B.D.; Luong, T.D.; Binh, N.T. An Efficient Low Complexity Edge-Cloud Framework for Security in IoT Networks. In Proceedings of the 2020 IEEE Eighth International Conference on Communications and Electronics (ICCE), Phu Quoc Island, Vietnam, 13–15 January 2021; pp. 533–539. [Google Scholar]
- Huong, T.T.; Bac, T.P.; Long, D.M.; Thang, B.D.; Binh, N.T.; Luong, T.D.; Phuc, T.K. LocKedge: Low-Complexity Cyberattack Detection in IoT Edge Computing. IEEE Access 2021, 9, 29696–29710. [Google Scholar] [CrossRef]
- Lee, S.; Abdullah, A.; Jhanjhi, N.; Kok, S. Classification of botnet attacks in IoT smart factory using honeypot combined with machine learning. PeerJ Comput. Sci. 2021, 7, e350. [Google Scholar] [CrossRef] [PubMed]
- Shafiq, M.; Tian, Z.; Sun, Y.; Du, X.; Guizani, M. Selection of effective machine learning algorithm and Bot-IoT attacks traffic identification for internet of things in smart city. Future Gener. Comput. Syst. 2020, 107, 433–442. [Google Scholar] [CrossRef]
- Tiwari, V.; Jain, P.K.; Tandon, P. A bijective soft set theoretic approach for concept selection in design process. J. Eng. Des. 2017, 28, 100–117. [Google Scholar] [CrossRef]
- Zakariyya, I.; Al-Kadri, M.O.; Kalutarage, H. Resource Efficient Boosting Method for IoT Security Monitoring. In Proceedings of the 2021 IEEE 18th Annual Consumer Communications & Networking Conference (CCNC), Las Vegas, NV, USA, 9–12 January 2021; pp. 1–6. [Google Scholar]
- Susilo, B.; Sari, R.F. Intrusion Detection in Software Defined Network Using Deep Learning Approach. In Proceedings of the 2021 IEEE 11th Annual Computing and Communication Workshop and Conference (CCWC), Las Vegas, NV, USA, 27–30 January 2021; pp. 0807–0812. [Google Scholar]
- Ahmed, H.I.; Nasr, A.A.; Abdel-Mageid, S.M.; Aslan, H.K. DADEM: Distributed Attack Detection Model Based on Big Data Analytics for the Enhancement of the Security of Internet of Things (IoT). Int. J. Ambient. Comput. Intell. 2021, 12, 114–139. [Google Scholar] [CrossRef]
- Das, A.; Ajila, S.A.; Lung, C.H. A Comprehensive Analysis of Accuracies of Machine Learning Algorithms for Network Intrusion Detection. In Proceedings of the International Conference on Machine Learning for Networking, Paris, France, 3–5 December 2019; pp. 40–57. [Google Scholar]
- Alshamkhany, M.; Alshamkhany, W.; Mansour, M.; Khan, M.; Dhou, S.; Aloul, F. Botnet Attack Detection using Machine Learning. In Proceedings of the 2020 14th International Conference on Innovations in Information Technology (IIT), Abu Dhabi, United Arab Emirates, 16–17 November 2020; pp. 203–208. [Google Scholar]
- Sriram, S.; Vinayakumar, R.; Alazab, M.; Soman, K. Network Flow based IoT Botnet Attack Detection using Deep Learning. In Proceedings of the IEEE INFOCOM 2020—IEEE Conference on Computer Communications Workshops (INFOCOM WKSHPS), Toronto, ON, Canada, 6–9 July 2020; pp. 189–194. [Google Scholar]
- Priya, V.; Thaseen, I.S.; Gadekallu, T.R.; Aboudaif, M.K.; Nasr, E.A. Robust attack detection approach for IIoT using ensemble classifier. arXiv 2021, arXiv:2102.01515. [Google Scholar]
- Kunang, Y.N.; Nurmaini, S.; Stiawan, D.; Suprapto, B.Y. Improving Classification Attacks in IOT Intrusion Detection System using Bayesian Hyperparameter Optimization. In Proceedings of the 2020 3rd International Seminar on Research of Information Technology and Intelligent Systems (ISRITI), Yogyakarta, Indonesia, 10–11 December 2020; pp. 146–151. [Google Scholar]
- Zixu, T.; Liyanage, K.S.K.; Gurusamy, M. Generative Adversarial Network and Auto Encoder based Anomaly Detection in Distributed IoT Networks. In Proceedings of the GLOBECOM 2020—2020 IEEE Global Communications Conference, Taipei, Taiwan, 7–11 December 2020; pp. 1–7. [Google Scholar]
- Ge, M.; Syed, N.F.; Fu, X.; Baig, Z.; Robles-Kelly, A. Towards a deep learning-driven intrusion detection approach for Internet of Things. Comput. Netw. 2021, 186, 107784. [Google Scholar] [CrossRef]
- NG, B.A.; Selvakumar, S. Anomaly detection framework for Internet of things traffic using vector convolutional deep learning approach in fog environment. Future Gener. Comput. Syst. 2020, 113, 255–265. [Google Scholar]
- Asadi, M.; Jamali, M.A.J.; Parsa, S.; Majidnezhad, V. Detecting botnet by using particle swarm optimization algorithm based on voting system. Future Gener. Comput. Syst. 2020, 107, 95–111. [Google Scholar] [CrossRef]
- Khraisat, A.; Gondal, I.; Vamplew, P.; Kamruzzaman, J.; Alazab, A. A Novel Ensemble of Hybrid Intrusion Detection System for Detecting Internet of Things Attacks. Electronics 2019, 8, 1210. [Google Scholar] [CrossRef]
- Aldhaheri, S.; Alghazzawi, D.; Cheng, L.; Alzahrani, B.; Al-Barakati, A. DeepDCA: Novel Network-Based Detection of IoT Attacks Using Artificial Immune System. Appl. Sci. 2020, 10, 1909. [Google Scholar] [CrossRef]
- Kayacik, H.G.; Zincir-Heywood, A.N.; Heywood, M.I. Selecting features for intrusion detection: A feature relevance analysis on KDD 99 intrusion detection datasets. In Proceedings of the Third Annual Conference on Privacy, Security and Trust, St. Andrews, NB, Canada, 12–14 October 2005; Volume 94, pp. 1722–1723. [Google Scholar]
- Samdekar, R.; Ghosh, S.; Srinivas, K. Efficiency Enhancement of Intrusion Detection in Iot Based on Machine Learning Through Bioinspire. In Proceedings of the 2021 Third International Conference on Intelligent Communication Technologies and Virtual Mobile Networks (ICICV), Tirunelveli, India, 4–6 February 2021; pp. 383–387. [Google Scholar]
- Kumar, P.; Gupta, G.P.; Tripathi, R. Toward Design of an Intelligent Cyber Attack Detection System using Hybrid Feature Reduced Approach for IoT Networks. Arab. J. Sci. Eng. 2021, 46, 3749–3778. [Google Scholar] [CrossRef]
- Injadat, M.; Moubayed, A.; Shami, A. Detecting botnet attacks in IoT environments: An optimized machine learning approach. arXiv 2020, arXiv:2012.11325. [Google Scholar]
- Ülker, E.; Nur, I.M. A Novel Hybrid IoT Based IDS Using Binary Grey Wolf Optimizer (BGWO) and Naive Bayes (NB). Avrupa Bilim ve Teknoloji Dergisi 2020, 279–286. [Google Scholar]
- Oreški, D.; Andročec, D. Genetic algorithm and artificial neural network for network forensic analytics. In Proceedings of the 2020 43rd International Convention on Information, Communication and Electronic Technology (MIPRO), Opatija, Croatia, 28 September–2 October 2020; pp. 1200–1205. [Google Scholar]
- Koroniotis, N.; Moustafa, N.; Sitnikova, E. A new network forensic framework based on deep learning for Internet of Things networks: A particle deep framework. Future Gener. Comput. Syst. 2020, 110, 91–106. [Google Scholar] [CrossRef]
- Ferrag, M.A.; Maglaras, L. DeepCoin: A Novel Deep Learning and Blockchain-Based Energy Exchange Framework for Smart Grids. IEEE Trans. Eng. Manag. 2019, 67, 1285–1297. [Google Scholar] [CrossRef]
- Ferrag, M.A.; Maglaras, L.; Moschoyiannis, S.; Janicke, H. Deep learning for cyber security intrusion detection: Approaches, datasets, and comparative study. J. Inf. Secur. Appl. 2020, 50, 102419. [Google Scholar] [CrossRef]
- Ferrag, M.A.; Maglaras, L.; Ahmim, A.; Derdour, M.; Janicke, H. RDTIDS: Rules and Decision Tree-Based Intrusion Detection System for Internet-of-Things Networks. Future Internet 2020, 12, 44. [Google Scholar] [CrossRef]
- Alkadi, O.; Moustafa, N.; Turnbull, B.; Choo, K.K.R. A Deep Blockchain Framework-enabled Collaborative Intrusion Detection for Protecting IoT and Cloud Networks. IEEE Internet Things J. 2020. [Google Scholar] [CrossRef]
- Pokhrel, S.; Abbas, R.; Aryal, B. IoT Security: Botnet detection in IoT using Machine learning. arXiv 2021, arXiv:2104.02231. [Google Scholar]
- Bagui, S.; Li, K. Resampling imbalanced data for network intrusion detection datasets. J. Big Data 2021, 8, 1–41. [Google Scholar] [CrossRef]
- Qaddoura, R.; Al-Zoubi, A.; Almomani, I.; Faris, H. A Multi-Stage Classification Approach for IoT Intrusion Detection Based on Clustering with Oversampling. Appl. Sci. 2021, 11, 3022. [Google Scholar] [CrossRef]
- Derhab, A.; Aldweesh, A.; Emam, A.Z.; Khan, F.A. Intrusion Detection System for Internet of Things Based on Temporal Convolution Neural Network and Efficient Feature Engineering. Wirel. Commun. Mob. Comput. 2020, 2020, 6689134. [Google Scholar] [CrossRef]
- Friedman, L.; Komogortsev, O.V. Assessment of the Effectiveness of Seven Biometric Feature Normalization Techniques. IEEE Trans. Inf. Forensics Secur. 2019, 14, 2528–2536. [Google Scholar] [CrossRef]
- Patro, S.; Sahu, K.K. Normalization: A preprocessing stage. arXiv 2015, arXiv:1503.06462. [Google Scholar] [CrossRef]
- Ling, C.X.; Li, C. Data mining for direct marketing: Problems and solutions. KDD 1998, 98, 73–79. [Google Scholar]
- Japkowicz, N. The class imbalance problem: Significance and strategies. In Proceedings of the International Conference on Artificial Intelligence, Acapulco, Mexico, 11–14 April 2000; Volume 56. [Google Scholar]
- Chawla, N.V.; Bowyer, K.W.; Hall, L.O.; Kegelmeyer, W.P. SMOTE: Synthetic minority over-sampling technique. J. Artif. Intell. Res. 2002, 16, 321–357. [Google Scholar] [CrossRef]
- Kingma, D.P.; Ba, J. Adam: A method for stochastic optimization. arXiv 2014, arXiv:1412.6980. [Google Scholar]
- Luque, A.; Carrasco, A.; Martín, A.; de las Heras, A. The impact of class imbalance in classification performance metrics based on the binary confusion matrix. Pattern Recognit. 2019, 91, 216–231. [Google Scholar] [CrossRef]


Publisher’s Note: MDPI stays neutral with regard to jurisdictional claims in published maps and institutional affiliations. |
© 2021 by the authors. Licensee MDPI, Basel, Switzerland. This article is an open access article distributed under the terms and conditions of the Creative Commons Attribution (CC BY) license (https://creativecommons.org/licenses/by/4.0/).