Article

VOC Detections by p-Type Semiconducting Sensors Using Nano-Sized SmFeO3 Particles

Graduate School of Science and Engineering, Ehime University, Matsuyama 790-8577, Japan
*
Author to whom correspondence should be addressed.
Sensors 2022, 22(15), 5616; https://doi.org/10.3390/s22155616
Submission received: 29 June 2022 / Revised: 23 July 2022 / Accepted: 25 July 2022 / Published: 27 July 2022

Abstract

:
Nano-sized SmFeO3 particles are prepared by the pyrolysis of heteronuclear cyano-complex, Sm[Fe(CN)6]·4H2O at a temperature of 600 °C in ozone. The low temperature decomposition followed in ozone successfully yielded fine particles with a high specific surface area of 20.0 m3/g (sample A). The fine particles were classified into further smaller particles with a unimodal size distribution and this process yielded a high specific surface area of 26.0 m3/g (sample B). These semiconducting powders were deposited on a sensor electrode by electrophoretic deposition (EPD) and tested on their sensing properties to VOCs. The sensors consisting of samples A and B both showed good responses to ethanol at 285 and 320 °C. The sensor with sample B showed extraordinarily good selectivity of ethanol for toluene at 320 °C. This could be because the detection film of sample B with moderately grown particles selectively reduced the reaction activity of toluene. The sensor with sample B also exhibited good selectivity of ethanol for hexane and dichloromethane.

1. Introduction

Environmental monitoring is an urgent task to control ambient air quality at a variety of locations. Analytical techniques are currently adopted for monitoring systems, but their usage is rather restricted due to their high cost and the large size of the equipment. Use of semiconductor gas sensors instead of analytical has aimed at solving these problems. Since integration of sensor elements is inevitable to add a gas recognition function in ambient air, each element is required to be of small size, low cost, and low energy consumption, as well as high sensing performance. Semiconducting gas sensors convert a reaction of a detected gas with the adsorbed oxygen on the surface into a change in electrical resistance. The semiconducting gas sensors have a simple structure and detect a variety of gasses sensitively [1,2]. So far, n-type semiconducting oxides such as SnO2 have been widely studied and have already been put into practical use [3]. In the atmosphere, the surface of SnO2 particles covered with negatively charged adsorbed oxygen forms the depletion layer near the particle surface, inducing a potential barrier for electron transfer at the grain boundaries. The potential barrier is reduced when the target gas reacts to eliminate the adsorbed oxygen. In the case of p-type semiconducting oxides, negatively charged adsorbed oxygen forms a hole accumulation layer near the particle surface, and holes only migrate through the layer. Therefore, it is generally accepted that p-type semiconducting gas sensors tend to be inferior in sensitivity compared to n-type; it is generally accepted that the sensitivity of a p-type semiconductor is the square root of that of n-type [4]. Some p-type semiconductor oxides, however, have a high oxidation catalytic activity [5,6]. Catalytic reactions taking place on a p-type semiconducting oxide effectively change the hole concentration in the accumulation layer. In fact, previous studies have revealed that p-type perovskite oxides such as LaFeO3 [7,8,9,10] and SmFeO3 [8,9,10,11,12,13,14] were promising materials to detect pollutant gasses such as NOx with high sensitivity and reliability. A powder of SmFeO3 prepared by the thermal decomposition of the cyano-complex, Sm[Fe(CN)6]·4H2O, has a high surface concentration of Sm3+ ions at the A site [9]. The SmFeO3 thick films screen-printed on a comb-type electrode showed a high response, specifically to some target gases [15,16,17].
A conventional solid-state synthesis requires temperature of over 1000 °C to obtain a single phase of SmFeO3 [12]. As a result, the specific surface area of the SmFeO3 particles decreases owing to grain growth during the high temperature decomposition. The thermal decomposition of the cyano-complex in air allows reduction of pyrolysis temperature to 600 °C, and the specific surface area of SmFeO3 powder prepared by this method is around 10 m2/g [12]. We previously examined sensor characteristics of SmFeO3 for volatile organic compounds (VOCs) [15]. The SmFeO3 sensor, in that study, exhibited a good response especially to alcohols; S = RVOC/Rair was around 30. Since VOC sensing characteristics of p-type semiconductors significantly depend on the oxidation activity for VOC, surface area of the oxide powder will be deeply related to the sensor response. To further increase the surface area of SmFeO3 powder, we, in this study, used ozone-air mixed gas instead of pure air as an oxidizer of the cyano-complex, since ozone has a much larger oxidizing power than air and is assumed to decompose the cyano-complex rapidly at low temperature. In this study, a SmFeO3 powder obtained by the ozone oxidation at 600 °C was found to have a higher surface area than those by conventional air oxidation. We thus examined VOC sensing characteristics of the SmFeO3 powders prepared by ozone pyrolysis.

2. Materials and Methods

The heteronuclear complex, Sm[Fe(CN)6]·4H2O, was synthesized at room temperature by mixing aqueous solutions of equimolar amounts of Sm(NO3)3 and K3[Fe(CN)6] under continuous stirring. The resulting precipitate was washed with water, ethanol, and diethyl ether, before drying in air at 50 °C. The complex was set in a tubular furnace and heated at 600 °C for 2 h under ozone gas flow at a rate of 100 mL/min. Ozone gas was generated from compressed air with an ozone gas generator (Funatech SO-250). The products were measured by X-ray diffraction (XRD; X’pert Pro MPD using a Cu Kα radiation, PANalytical) and confirmed the formation of a single phase of the SmFeO3. The obtained SmFeO3 powder was crushed by wet ball milling in ethanol and dried in an oven (sample A). The powder of sample A was then dispersed in acetyl acetone and sonicated for 1 h at room temperature. The suspension was left to stand for 1h to separate it into the components of supernatant and precipitate. The particles in the supernatant layer were collected by a centrifugal separation (sample B). The surface area of the powders was measured by BET analysis using N2 adsorbent (fine precision surface area and porosimetry system, BELsorp-mini, microtracBEL) and the particle size was analyzed by FE-SEM (S-5500, HITACHI).
Alumina sheets (1.0 mm × 1.0 mm) attached with Pt counter electrodes and microheater were used as a sensor substrate. SmFeO3 powder was deposited on the Pt electrode by the EPD method. To prepare an organic suspension of the oxide particle for EPD, 0.04 g of SmFeO3 was dispersed in 10 mL of acetylacetone and 2.5 mg of I2 was added as a charging agent. The added I2 reacts with the solvents to form HI and the free protons generated by HI dissociation are adsorbed on the suspended SmFeO3 particle [18]. The mixture was stirred and then sonicated for 30 min at room temperature to obtain a good dispersion. The positively charged SmFeO3 particle is expected to migrate and deposit on the cathodic electrode during the EPD process. The deposition was performed at constant DC voltage of 3 or 5 V for 1–3 min. After the EPD process, the deposits were dried at 70 °C in a drying oven for one day, and then sintered at 600 °C for 3 h with an electric furnace. The surface of the sintered films was observed by FE-SEM.
Figure 1 shows the setup for the sensor tests. The sensor was placed in the stainless chamber and the Pt electrodes and Pt microheater were connected to a d.c. power and a digital electrometer as a heater power source and a resistance meter (Advantest Co., TR8652, Tokyo, Japan). Test gasses were evaporated at a constant temperature from a diffusion tube loaded in a permeator (GASTECH, Co., PD-1B, Ayase, Japan). Compressed air from an oil-free air compressor was introduced in the permeator along with a water bubbler to control humidity of the test gasses at 50% RH. Test gasses and air were alternately introduced in the chamber with a flow rate of 400 mL/min. The conductance of the elements was measured using a digital electrometer (Advantest, TR8652) at different gas concentrations and operating temperatures.

3. Results

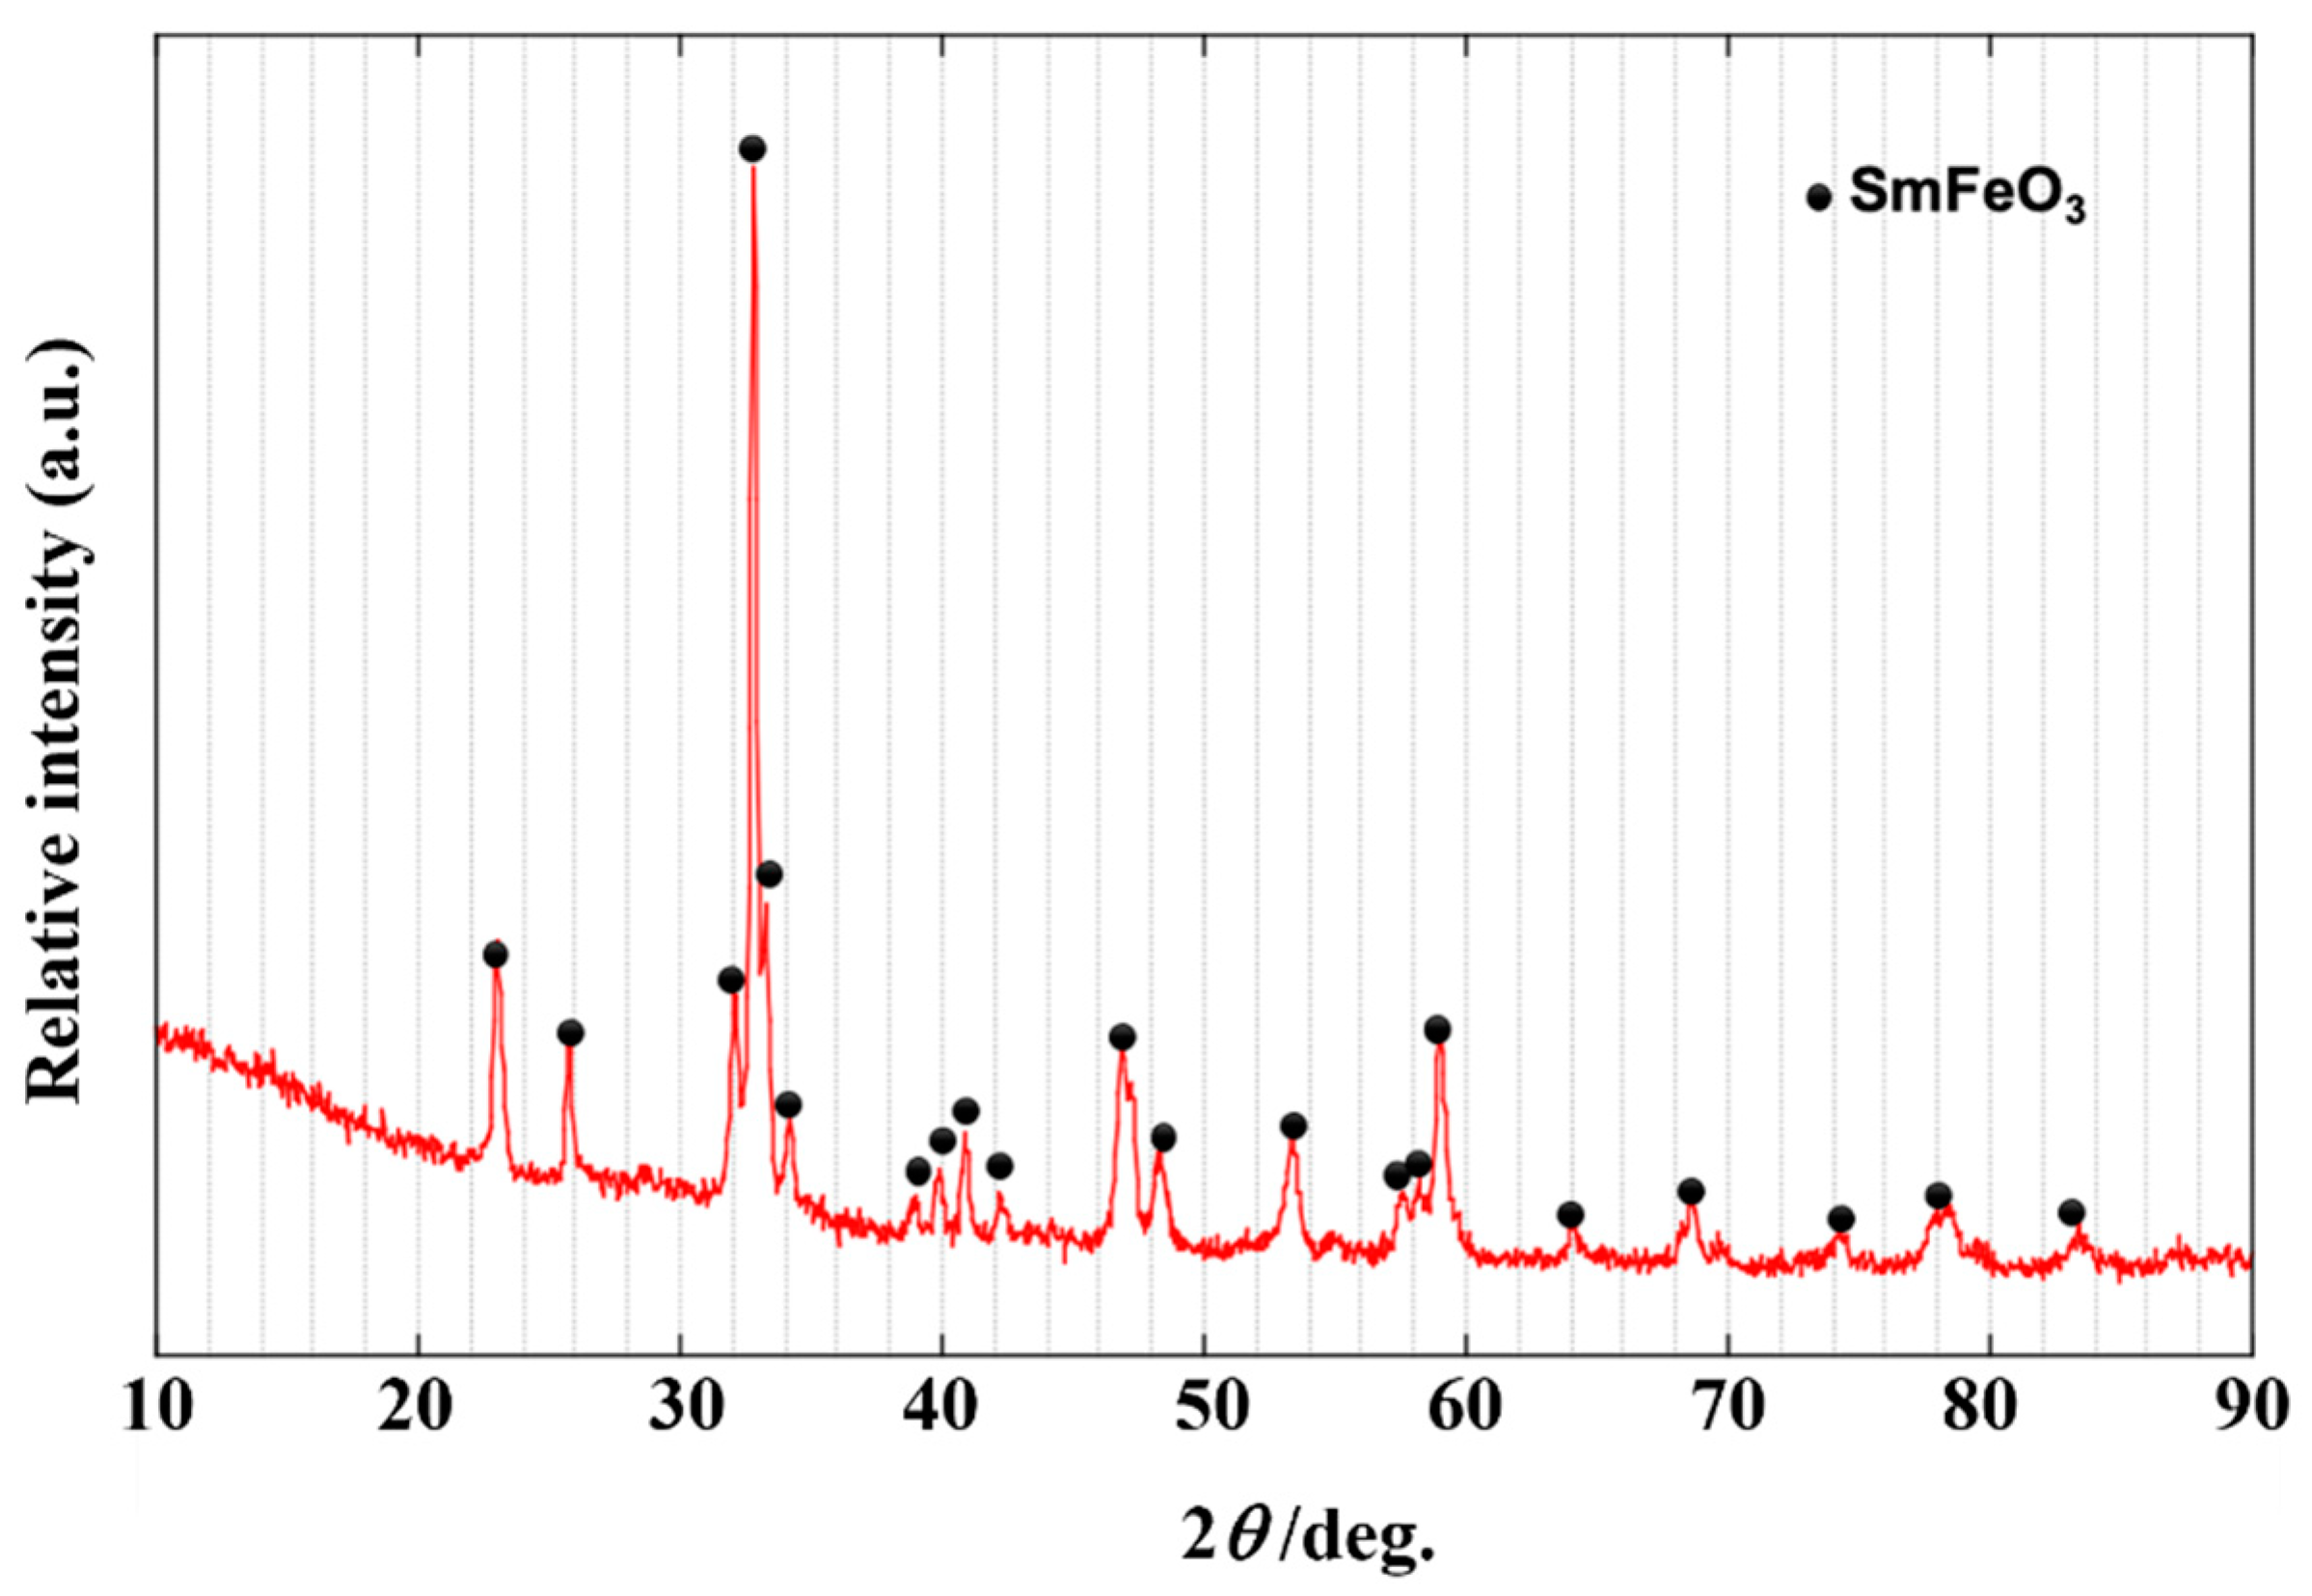
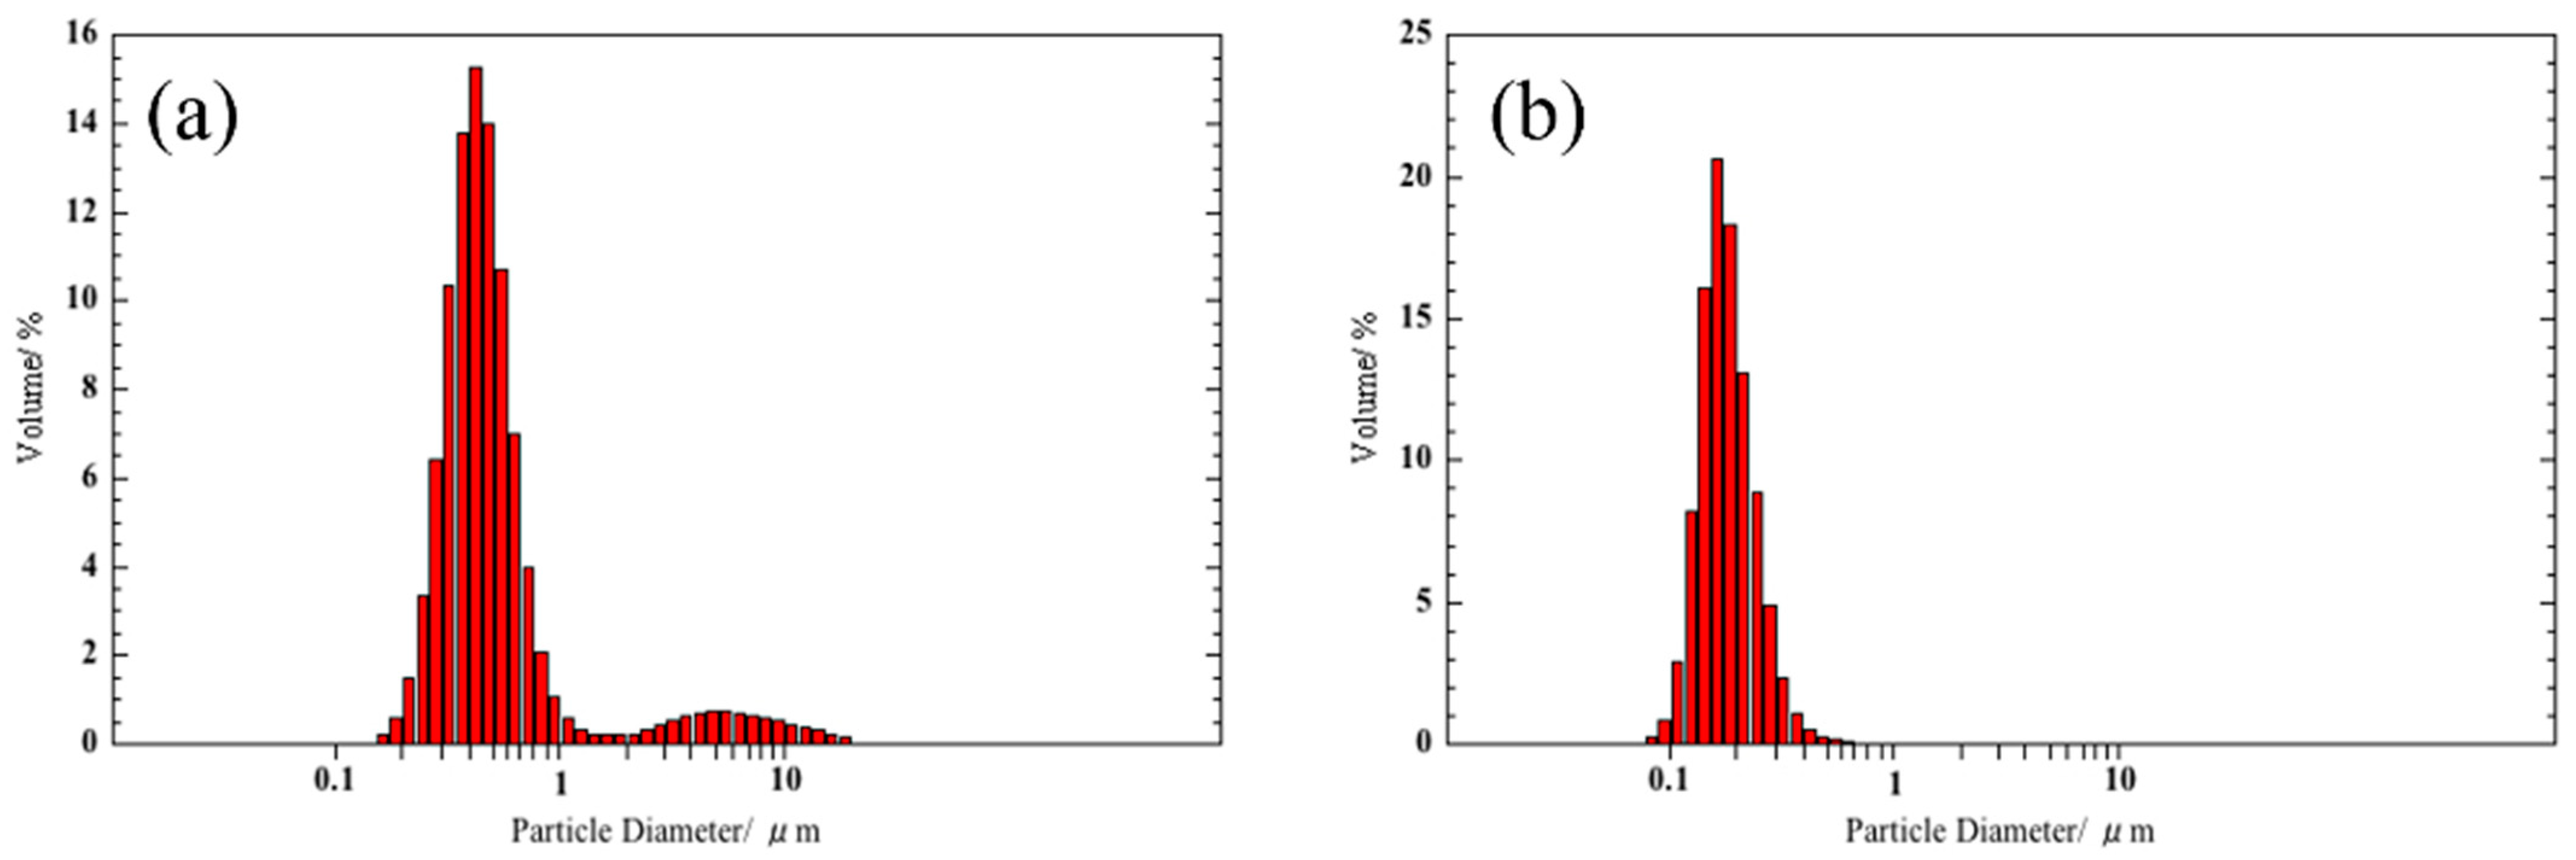
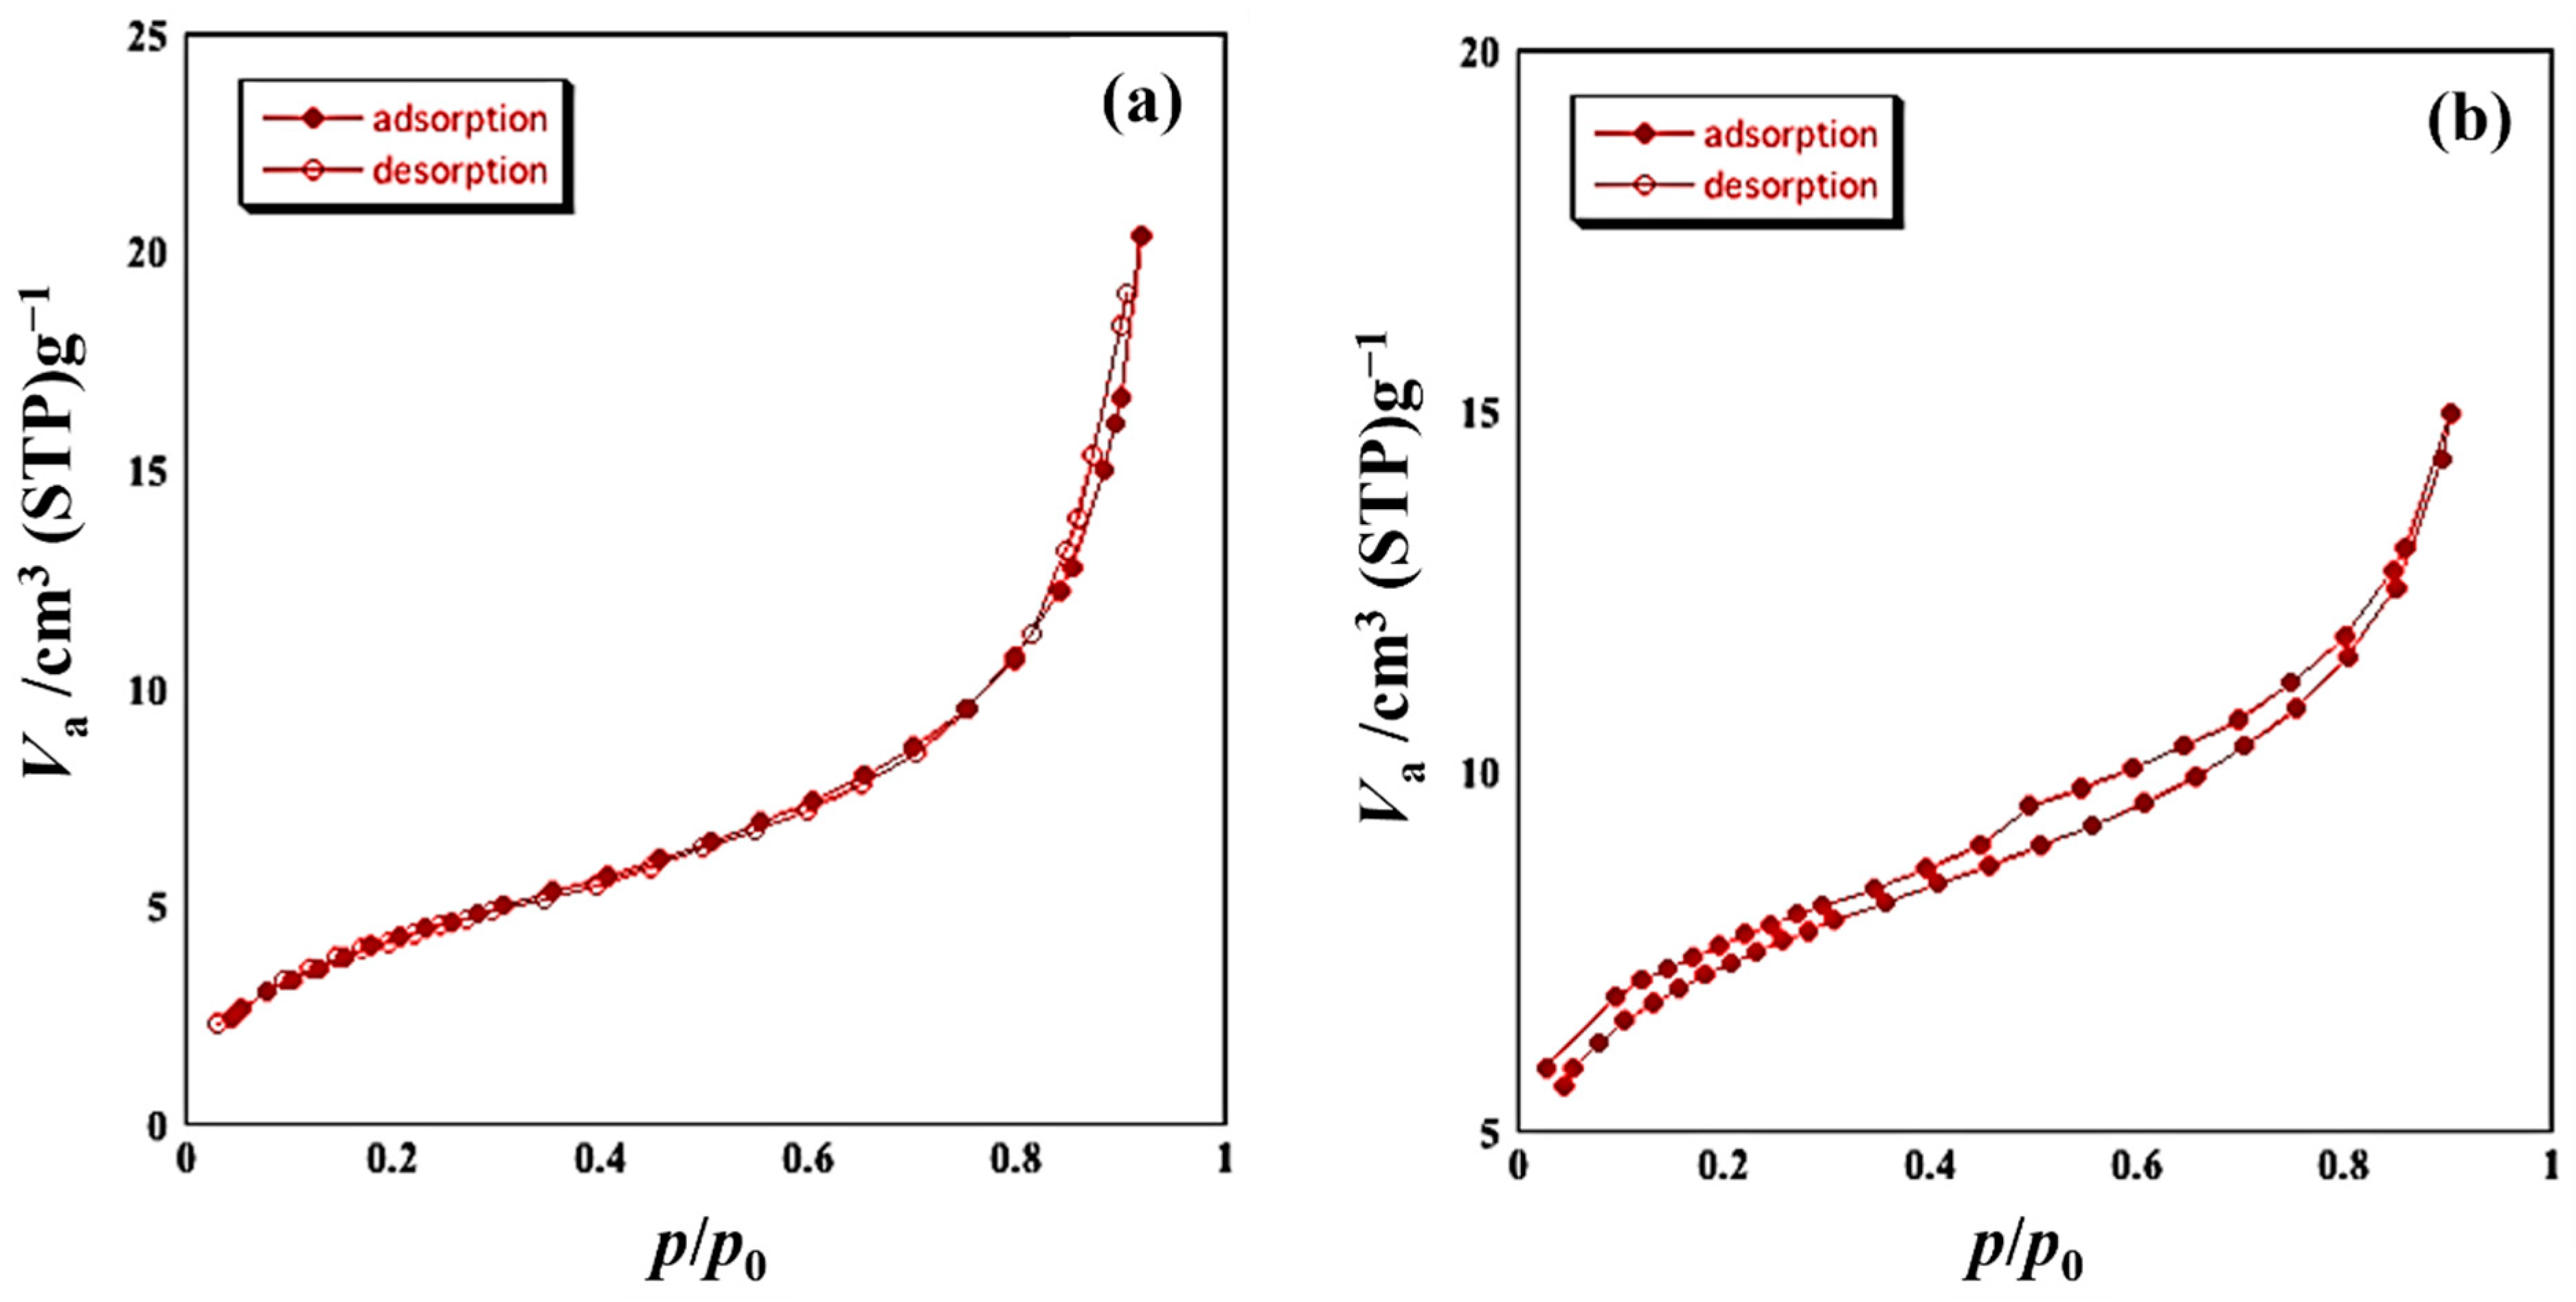
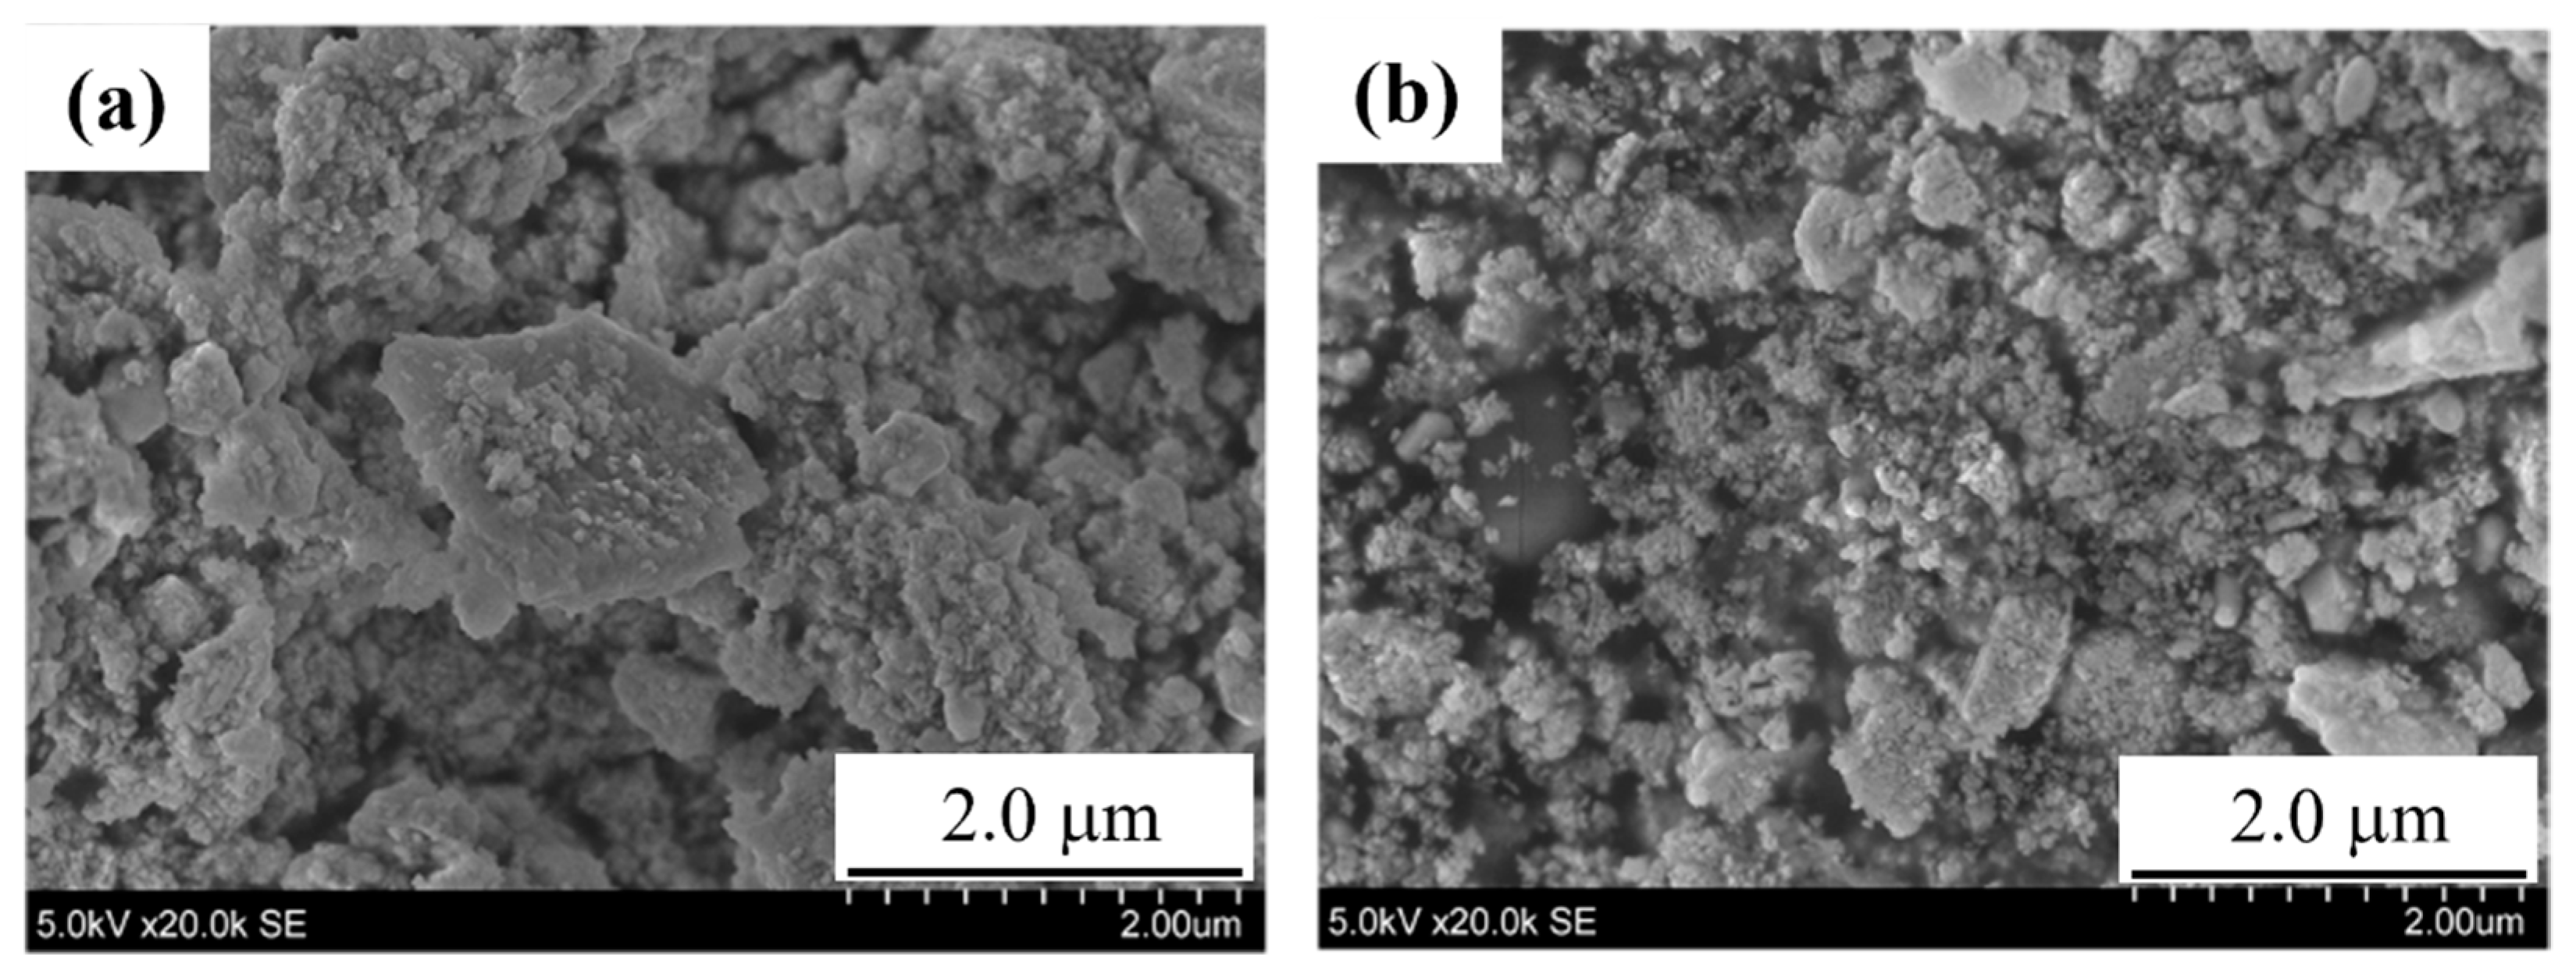
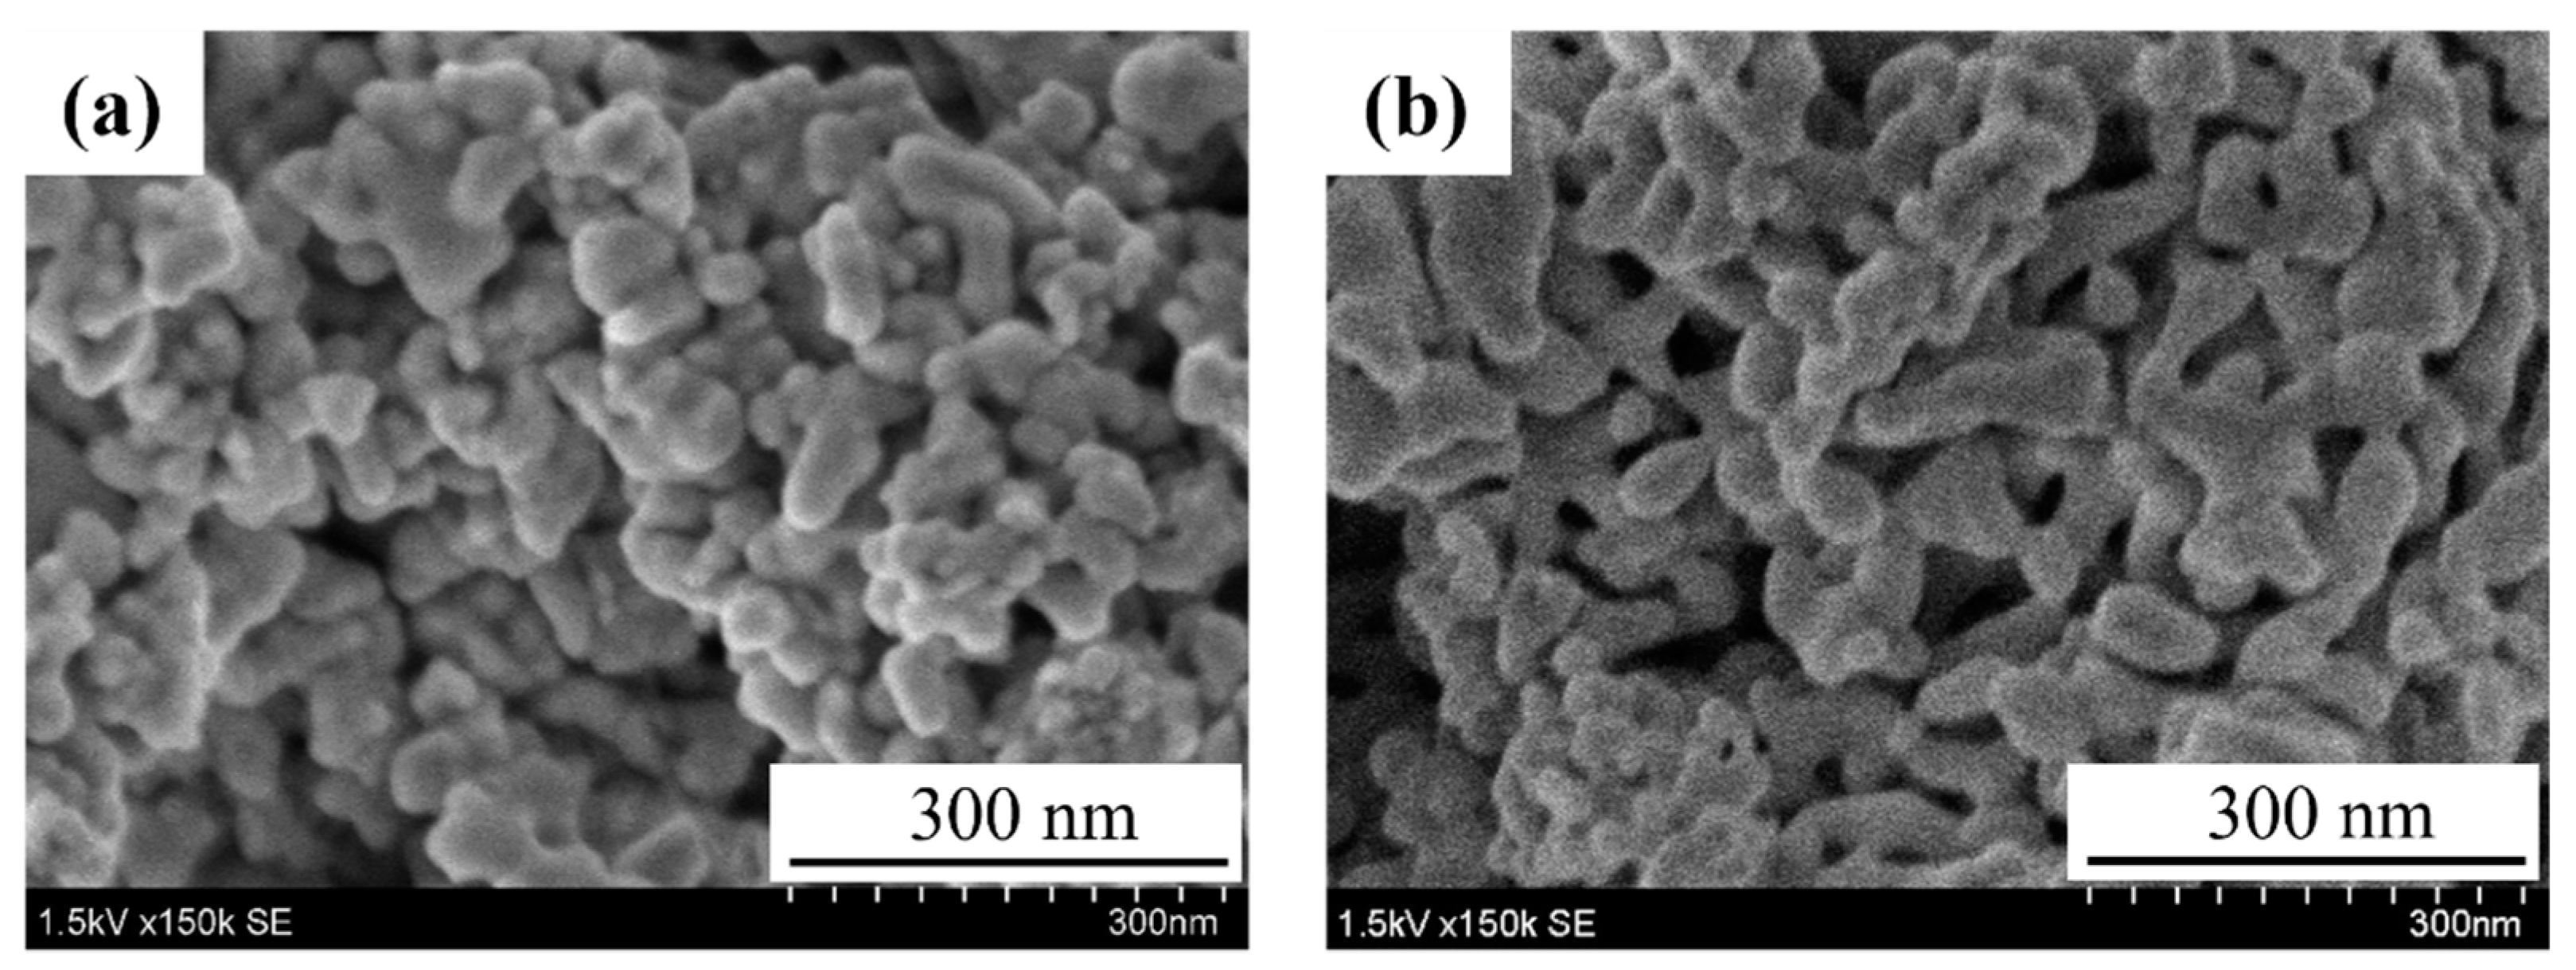
3.1. Preparation of SmFeO3 Nanoparticles

The XRD pattern of sample A shown in Figure 2 indicates that a single phase of SmFeO3 perovskite was formed by the pyrolysis of the complex at 600 °C in ozone.
Figure 3 shows the volume distributions of the sample powders. Sample A possesses two peaks of distributions centered at 0.40 and 5.5 μm, and the smaller component was predominant. The powder of sample B possesses nearly single modal distribution peaked around 0.17 μm. Median diameters of the powders were evaluated as follows: 0.44 μm (sample A) > 0.17 μm (sample B).
Figure 4 shows the nitrogen adsorption isotherms of the powder samples. The adsorption isotherm of sample A shows an intermediate pattern between type II and type IV in which the presence of slight hysteresis can be confirmed, along with macropores (pores of 50 nm or larger) and mesoporous adsorbent (pores of 2 to 50 nm). The hysteresis obtained from sample A is H3 type (IUPAC classification) [19,20], which is a pattern often seen in plate-like aggregates. The powder of sample B can also be judged to be mesoporous adsorbent. The isotherm of this powder shows low pressure hysteresis with no closing point of the hysteresis loop. From the above results, sample A contains a mixture of mesopore particles with different surface areas. The classification operation separated the mixture in sample A into sample B, with a large surface area, and the residue. From the nitrogen adsorption isotherm, specific surface area of samples A and B were evaluated with the BET equation, resulting in 20.0 m3/g for sample A and 26.0 m3/g for sample B. It should be noted that specific surface area of the SmFeO3 powder before milling was 17.9 m2/g.
Figure 5 shows FE-SEM photographs of samples A and B. SmFeO3 particles with a particle size of 50 nm or smaller were observed for the both samples.

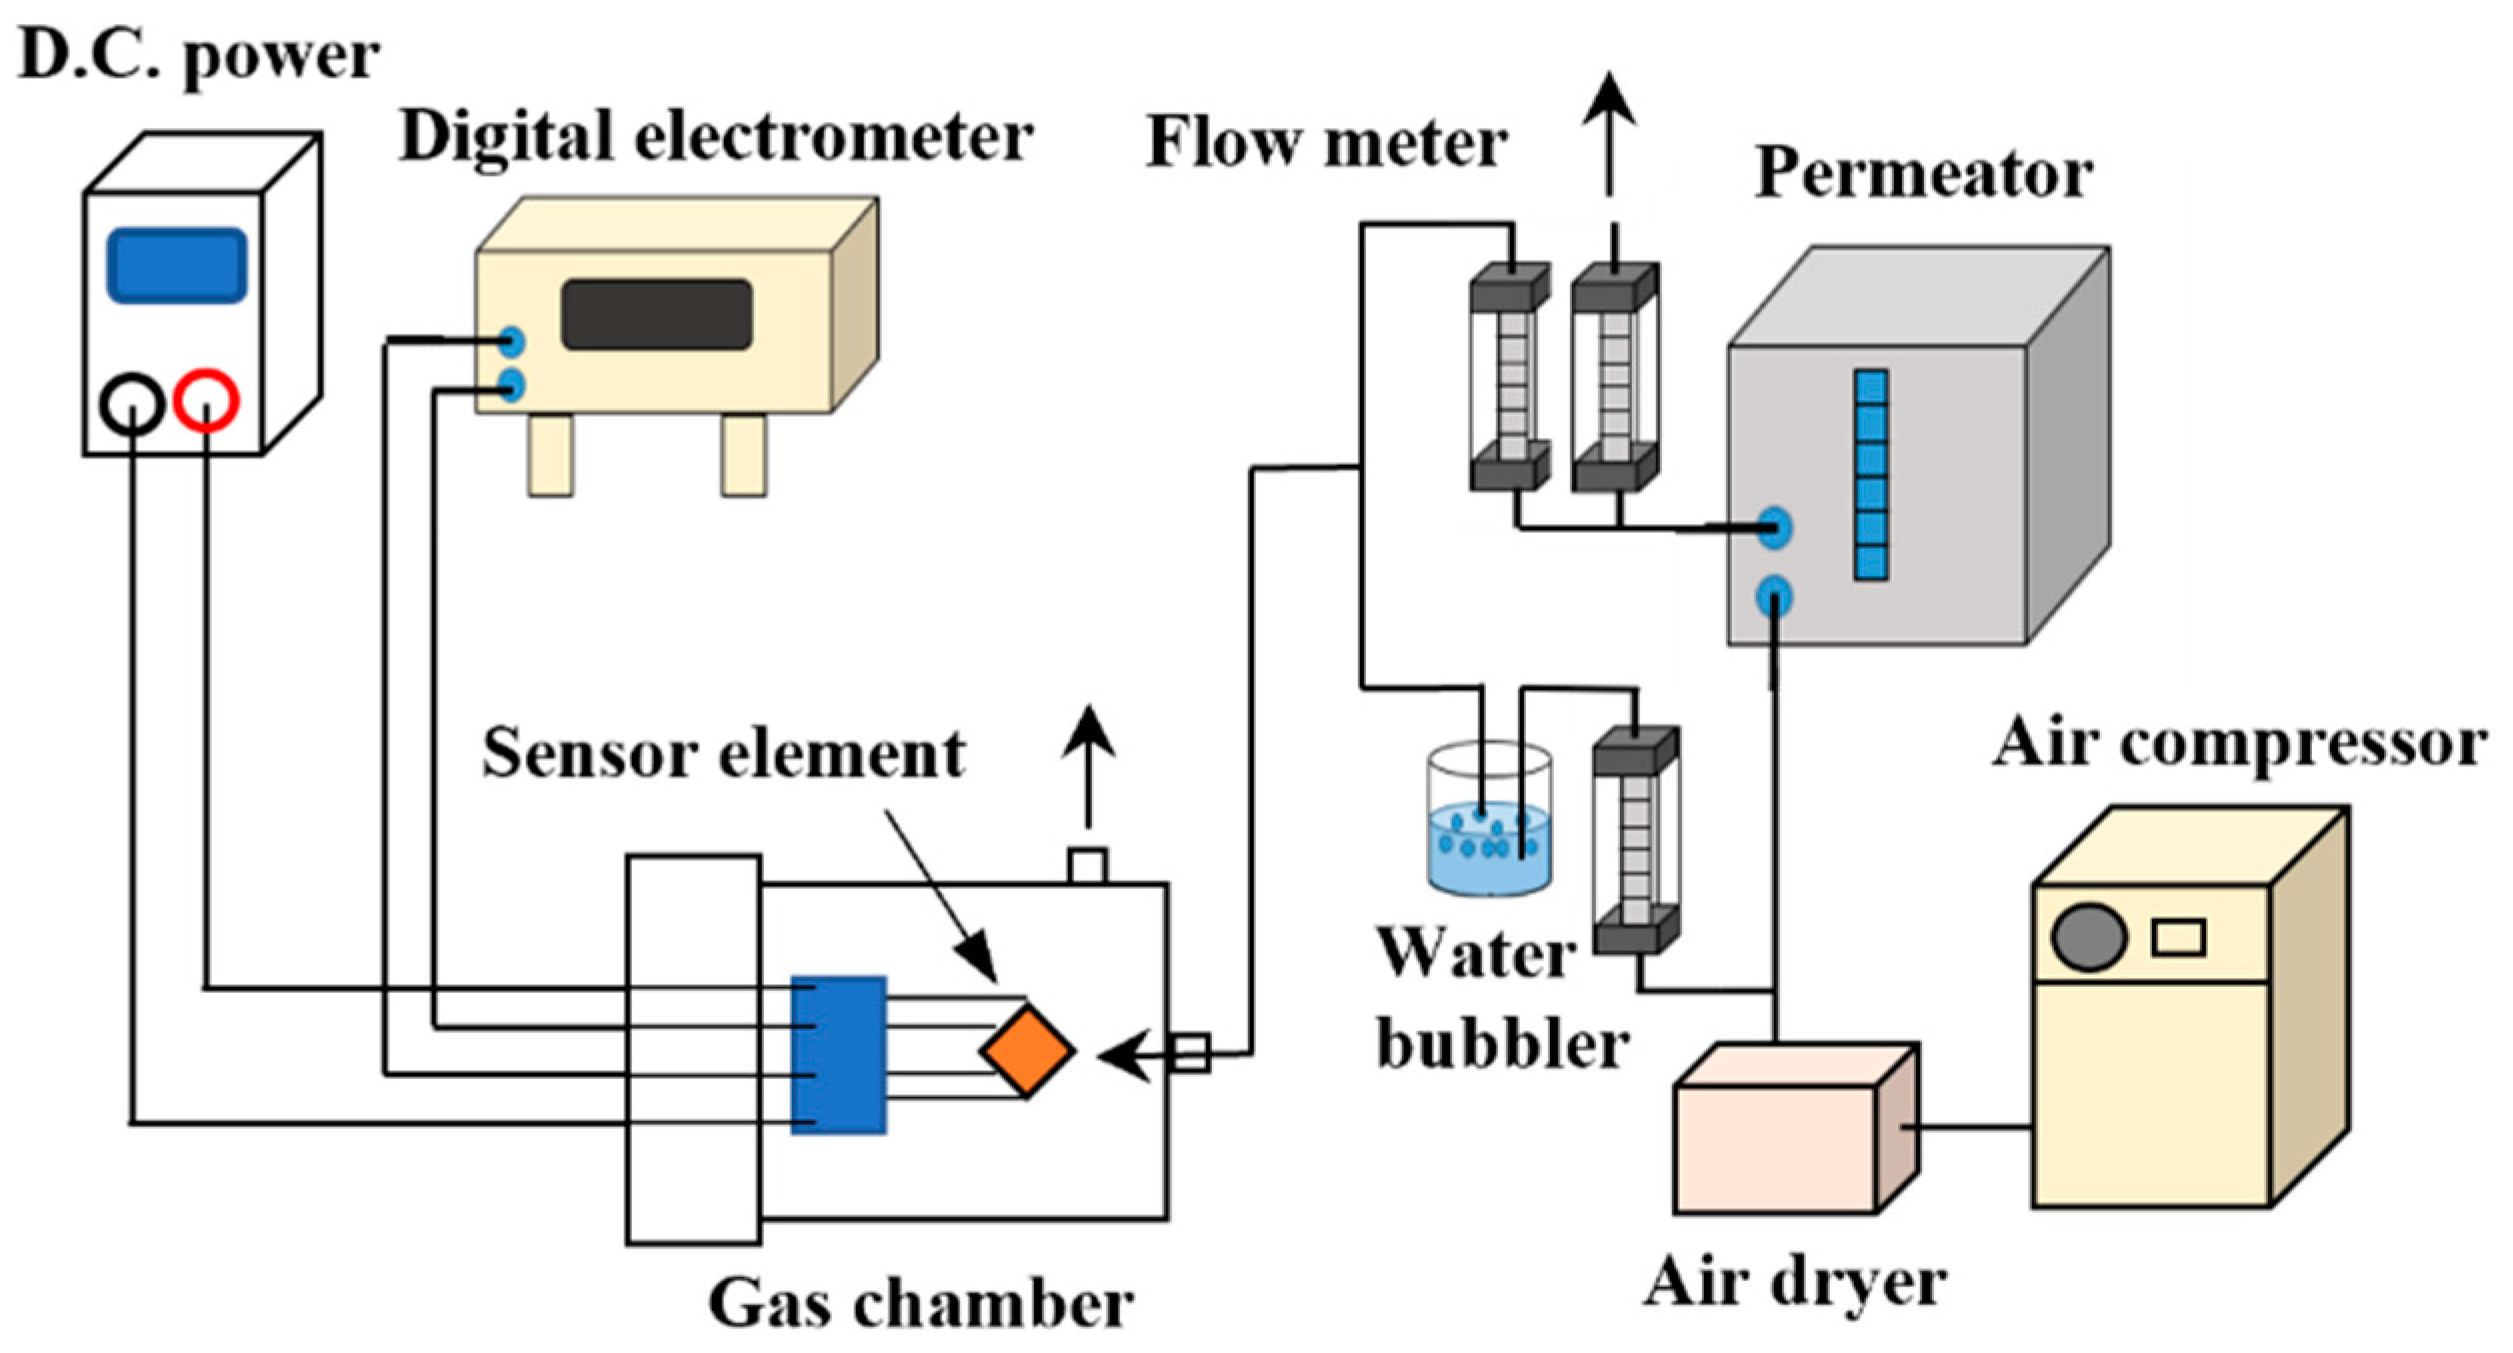
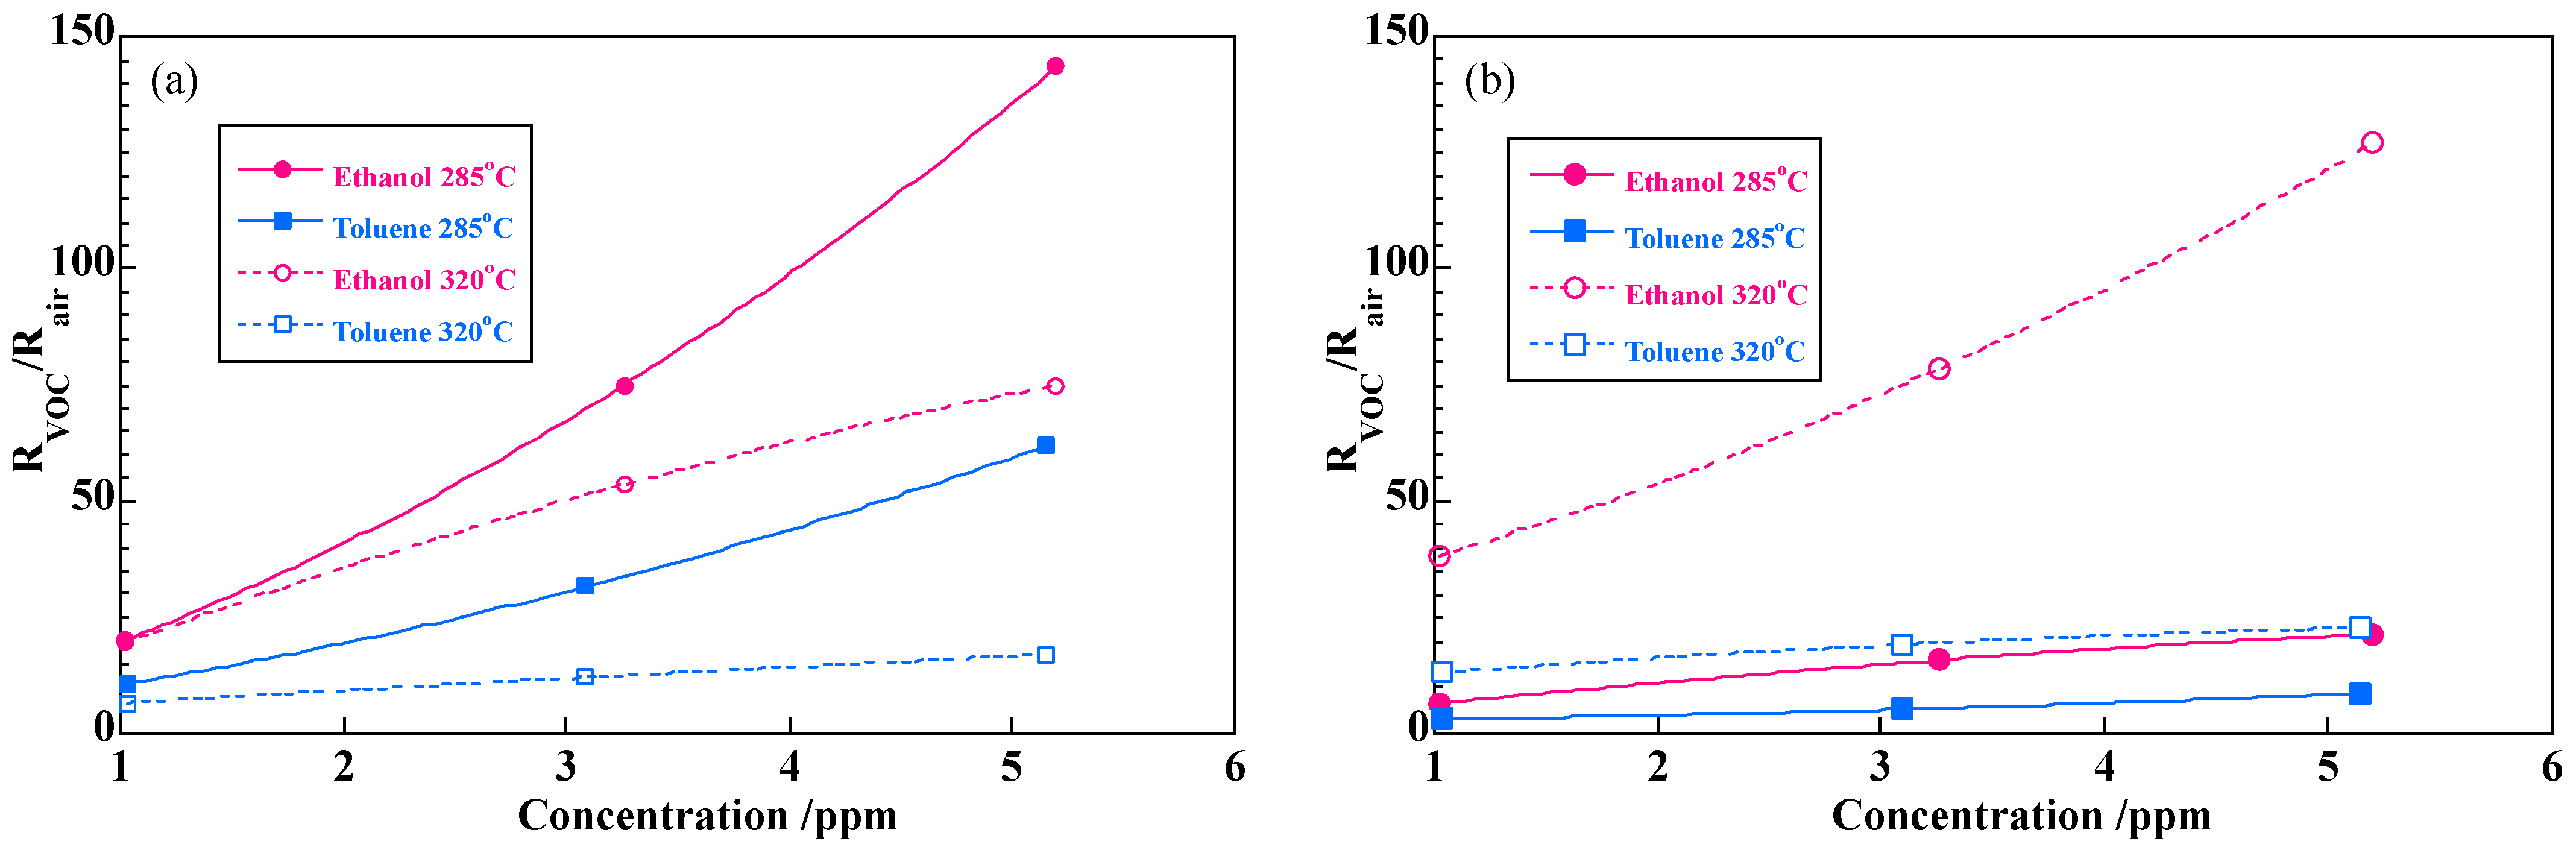
3.2. Evaluation of Sensor Response Characteristics

In this study the powders of samples A and B were tested as sensor materials. Figure 6 shows SEM photographs of the surface of the sensing layers sintered at 600 °C. The particle size of the powder was smaller in sample B than in sample A, but when the film was formed on the sensor substrate by the EPD method and fired at 600 °C, particle growth due to aggregation occurred. The surface of sample A shows aggregation of particles with a size of 50–60 nm, whereas the particles of sample B clearly coarsened with the neck growth. The detection layers were prepared by the EPD method three time for each sample, resulting in similar morphologies with those in Figure 6.
Resistance of SmFeO3 sensors in air is in the range of 1 × 10⁵–1 × 10⁷ Ω at operating temperatures [15]. The present sensors were in the resistance range of 107 and 106 Ω in air at 285 and 320 °C, respectively. For this reason, we, in this study, set temperature of sensor operation to 285 and 320 °C. Figure 7 shows the transient response curves of the sensors in 5 ppm ethanol at 320 °C. The resistance value of sample A in air was 1 × 10⁷ Ω, and that of sample B in air was 1 × 10⁶ Ω. The difference in the resistance in air may be ascribed to the surface morphology, where sample B showed a more sintered phase. It should be noted that resistance values in dry air are about a half of those in wet air. Li et al. [21] reported on the humidity property of MoS2@CuO heterogenous photocatalyst. They proposed that the separated holes by photo-illumination are captured by water to form proton and hydroxyl radical Equation (1). This reaction, if taking place on the surface of SmFeO3, would increase resistance of SmFeO3. At present, we are investigating the humidity dependence of the VOC sensing property.
h+ + H2O → H+ + OH
The 90% response time was 1–2 min, but the recovery time when switching from ethanol to air was very slow, i.e., more than 20 min to return to the resistance in air. Both the sensors exhibited rapid responses from air to ethanol. Recovery from ethanol to air was very slow and recovery time is >20 min. This is due to reaction products, CO2 and/or H2O, strongly adsorbed on the surface of the SmFeO3 particles. It should be noted that a signal fluctuation was observed in Figure 7 under the air flow. The cause of this phenomenon is still unknown, but possibly due to an instability of the electrometer induced by an interference from peripheral devices such as a switching timer or others.
Figure 8 shows the responses of the sensors with samples A and B in ethanol and toluene at 285 and 320 °C. The sensor responses are higher at 285 °C than at 320 °C in the sensor with sample A, and vice versa in sample B. The response of sample A to 5 ppm ethanol reached 145, and that in 5 ppm toluene was about 60. On the other hand, the sensor response with sample B is about 125 to 5 ppm ethanol at 320 °C, but the response to 5 ppm toluene is no more than 25 which is much lower than that in the sensor with sample A. It was thus revealed that a SmFeO3 fine particles (samples A and B) can both detect ppm level ethanol with the outstandingly high response. Sample B is more effective to detect ethanol selectively for toluene. The power law is widely accepted in semiconducting sensor where sensor resistance is related to the power of gas concentration [22], hence R = aPn, where a and n are constants, and P is partial pressure of a target gas. The response curves in Figure 8 were thus re-plotted in Figure 9 with a log-log plot to obtain the constants in the power law. The log-log plot showed a good linearity and constants a and n were obtained as summarized in Table 1. Clearly a-values correlate to sensitivity to each VOC as seen in the concentration dependence curves in Figure 8. It seems that the difference in a-values of sample A is smaller than that of sample B. The a-value of the sensor with sample B in ethanol at 320 °C is specifically large, resulting in the high selectivity to ethanol at 320 °C. As regards n-values, those of sample A are close to 1 except for toluene at 320 °C. If VOCs in gas phase behave according to the Henry’s law, the amount of adsorption of VOCs is expected to be proportional to partial pressure of the gasses. The sensor with sample A shows responses nearly proportional to concentration of VOCs, suggesting that surface adsorption process of VOC or reaction products are predominant in the sensor mechanism. The fact that the sensor response increases with decreasing temperature is consistent with the above mechanism. On the other hand, the n-values of sample B are significantly smaller than those of sample A, and the sensor response increases with increasing temperature in the case of sample B. This indicates that oxidation reaction of the VOCs is rather dominant in sample B. Although sample B possesses larger specific surface area than sample A, it moderately coarsened during the heating process at 600 °C. This particle growth may reduce catalytic activity to both VOCs, especially to toluene. We previously examined catalytic activity and sensor response of Sm2O3 loaded SmFeO3 powders to 30 ppm ethanol and toluene [23]. The catalytic activity of toluene and the sensor response largely depended on the amount of Sm2O3 added.
This indicates that Sm3+ acts as an adsorption site of toluene and catalytic activity and sensor response strongly depends on the amount of toluene. On the other hand, ethanol, having slight acidity, may adsorb more favorably on the Sm3+ ion, having slight basicity, regardless of the number of Sm3+ ions on the surface. The sensing mechanism of VOC on the different morphology of semiconducting film should be discussed more quantitatively. The present research, however, gave us one qualitative conclusion: that a slightly agglomerated surface effectively suppresses the amount of toluene adsorption, but this is not the case in ethanol, and provides a large difference in sensor response between ethanol and toluene. Figure 10 shows the sensor responses of the sensor with sample B to 4 types of VOCs: ethanol (alcohol), hexane (aliphatic hydrocarbon), dichloromethanes (organic halide), and toluene (aromatic hydrocarbon). The sensor with sample B also exhibited high selectivity to ethanol among these VOCs, especially at 320 °C.

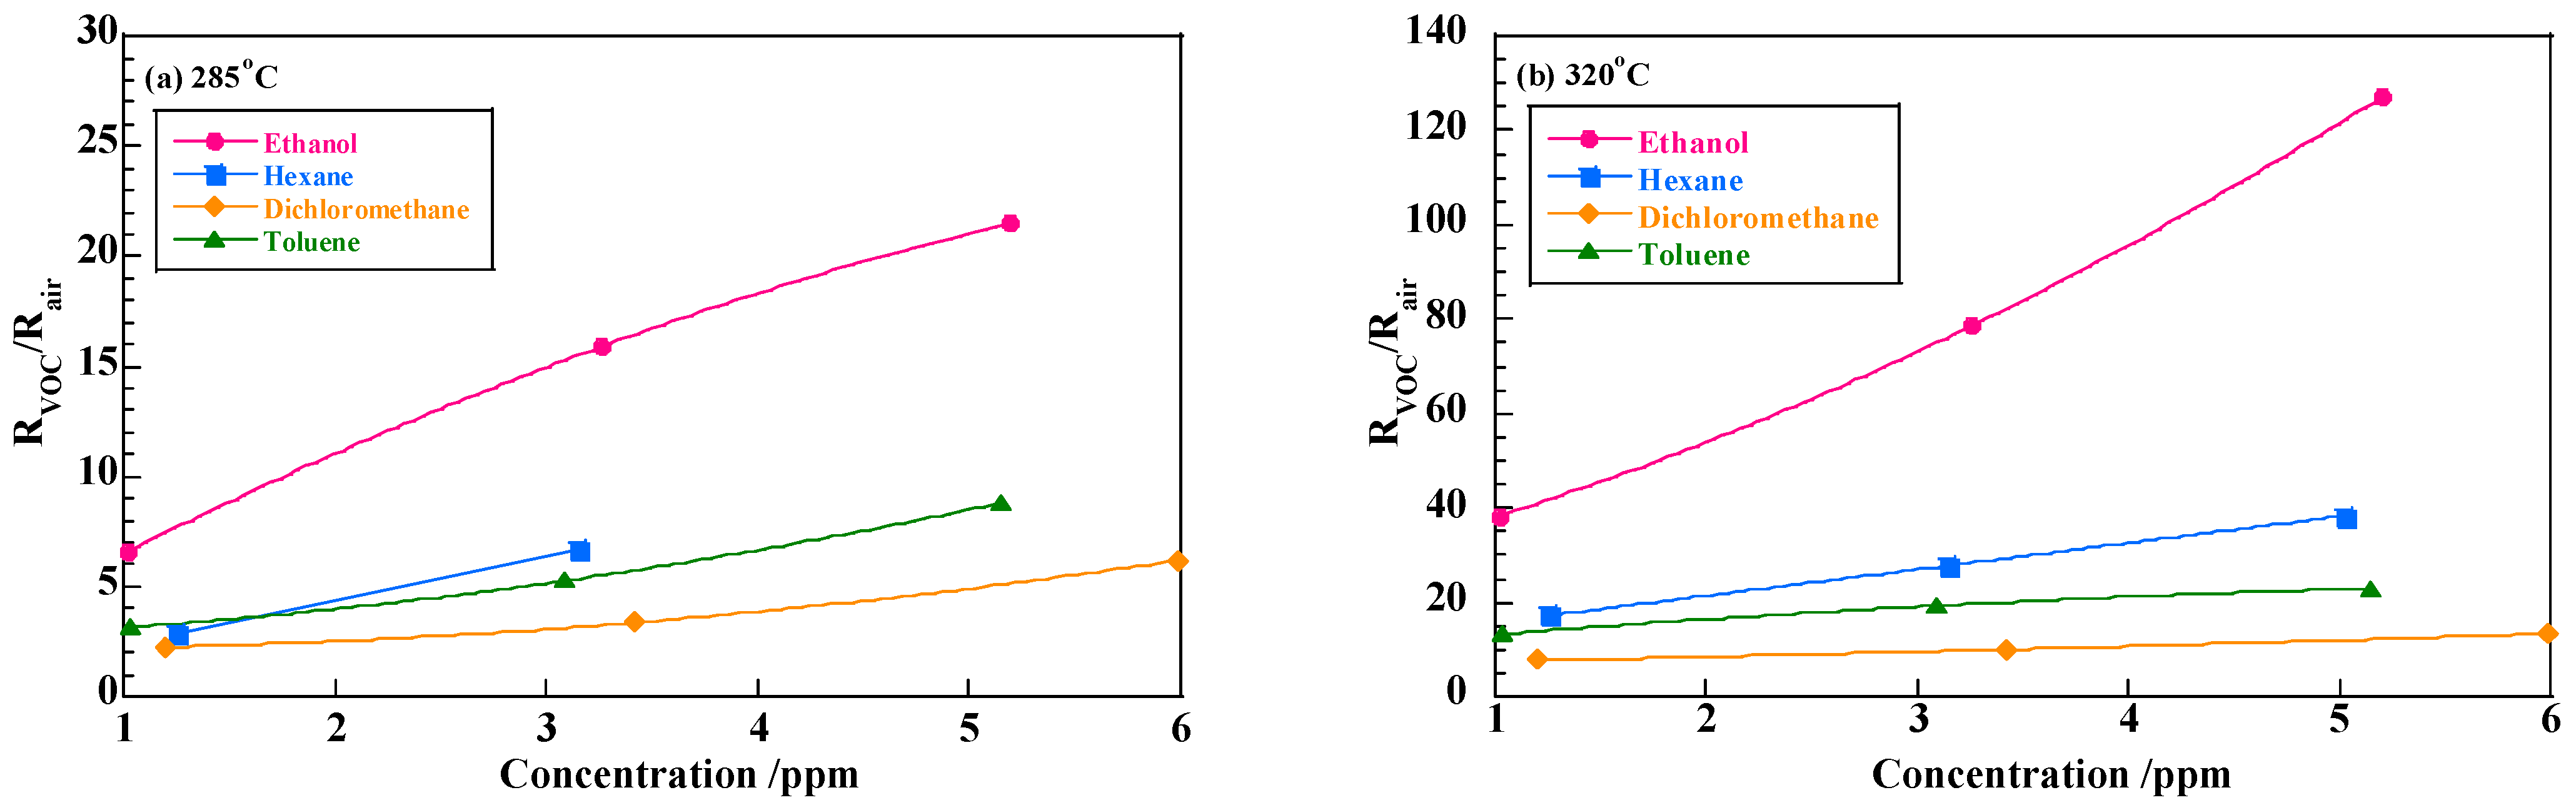
3.3. VOC Detection Using p-Type Semiconducting Oxides

VOC detection has been conducted using p-type semiconducting oxides such as NiO [24,25], Co3O4 [26] and some perovskite-type oxides [27]. Carbone et al. [24] reported a sensor response of RVOC/Rair = 35 at 200 °C to 150 ppm ethanol using NiO grained flowers having a significantly high specific surface area of 240.3 m2/g. Kruefu et al. [25] obtained the response value of around 40 at 350 °C to 2000 ppm ethanol sensing using Ru-loaded NiO particles with a dimension range of 10–40 nm. Zhang et al. [26] reported the response of 221.99 to 100 ppm ethanol using porous Co3O4 with a specific surface area of 28.509 m2/g. For perovskite-type oxides, LaFeO3 has been tested by some research groups [27,28]. Dai et al. [27] prepared LaFeO3 thin film with the periodic pores of 500 nm in dimension and yielded the response of 14 to 5 ppm ethanol at 450 °C. Yu et al. [28] prepared the Ag-modified LaFeO3 with a specific surface area of 16.45 m2/g and obtained the response value of 20.9 to 20 ppm ethanol at 180 °C. It is thus obvious that high specific surface area or small particle size of p-type semiconducting oxides is a critical factor for a highly sensitive VOC detection. We previously conducted VOC sensing using the SmFeO3 particle [15]. The SmFeO3 particles possessed the specific surface area of 21.6 m2/g after the pyrolysis of the cyano-complex at 900 °C in air and the ball-mill crushing process. The sensor response to 3 ppm ethanol was 30 at 400 °C. The SmFeO3 sensor exhibited an outstandingly high response to ethanol of a low concentration. The SmFeO3 powder, in this study, prepared by the ozone-decomposition possesses a comparable surface area without the ball-milling process, that is 17.9 m2/g. The SmFeO3 sensor based on the ozone-decomposed powder exhibited an even higher response to ethanol, as shown in Figure 10. This suggests that specific surface area is not a sole factor in sensor response. It is predictable that the SmFeO3 particles prepared by the ozone decomposition possess a more favorable surface compared to those by air decomposition.

4. Conclusions

Nano-sized particles of SmFeO3 with larger specific surface area were obtained by pyrolyzing cyano-complex, Sm[Fe(CN)6]·4H2O, in ozone at a low temperature of 600 °C. The obtained fine particles possessed a bimodal volume distribution (sample A) and were further classified into finer particles with a unimodal one (sample B). By using the EPD method in the organic suspension with the applied voltage of 3–5 V, SmFeO3 particles were uniformly deposited on the tiny electrode with a dimension of 1.0 × 1.0 mm. The two sensors with samples A and B were tested to detect ethanol and toluene at 285 and 320 °C. The sensors exhibited high responses to ethanol, at around RVOC/Rair = 140 at 5 ppm. However, the sensor sample B exhibited a specifically high selectivity to ethanol at 320 °C. We tentatively speculate that the moderately agglomerated morphology of the sample B film selectively reduced the amount of adsorption of toluene. The sensor also exhibited good selectivity of ethanol to hexane and dichloromethane.

Author Contributions

Conceptualization, Y.I. and M.M.; methodology, M.M.; validation, Y.I.; formal analysis, A.N.; investigation, A.N.; resources, Y.I.; data curation, M.M.; writing—original draft preparation, Y.I. and M.M.; writing—review and editing, Y.I.; supervision, Y.I.; project administration, Y.I.; funding acquisition, Y.I. All authors have read and agreed to the published version of the manuscript.

Funding

This research received no external funding.

Institutional Review Board Statement

Not applicable.

Informed Consent Statement

Not applicable.

Data Availability Statement

Not applicable.

Acknowledgments

This work was carried out as a part of the studies in Research Unit for Power Generation and Storage Materials (PGeS) at Ehime University.

Conflicts of Interest

The authors declare no conflict of interest.

References

  1. Seiyama, T.; Kato, A.; Fujiishi, K.; Nagatani, M. A New Detector for Gaseous Components Using Semiconductive Thin Films. Anal. Chem. 1962, 34, 1502–1503. [Google Scholar] [CrossRef]
  2. Yamazoe, N. New approaches for improving semiconductor gas sensors. Sens. Actuators B Chem. 1991, 5, 7–19. [Google Scholar] [CrossRef]
  3. Matthias, B. Surface science studies of gas sensing materials: SnO2. Sensors 2006, 6, 1345–1366. [Google Scholar]
  4. Kim, H.-J.; Lee, J.-H. Highly sensitive and selective gas sensors using p-type oxide semiconductors: Overview. Sens. Actuators B 2014, 192, 607–627. [Google Scholar] [CrossRef]
  5. Mori, M.; Iwamoto, Y.; Asamoto, M.; Itagaki, Y.; Yahiro, H.; Sadaoka, Y.; Takase, S.; Shimizu, Y.; Yuasa, M.; Shimanoe, K.; et al. Effect of preparation routes on the catalytic activity over SmFeO3 oxide. Catal. Today 2008, 139, 125–129. [Google Scholar] [CrossRef]
  6. Hui, L.; Futai, M.; Zuzhu, M.; Haiyang, L.; Yabo, X. Study of the reactivity of surface oxygen species on SmMnO3 and SmFeO3 catalysts. J. Alloys Compd. 1993, 193, 68–69. [Google Scholar] [CrossRef]
  7. Toan, N.; Saukko, S.; Lantto, V. Gas sensing with semiconducting perovskite oxide LaFeO3. Phys. B Condens. Matter 2003, 327, 279–282. [Google Scholar] [CrossRef]
  8. Aono, H.; Ohmori, J.; Sadaoka, Y. Effects of sintering atmosphere on surface structure and electrical properties of LaFeO3 prepared by thermal decomposition of La[Fe(CN)6]⋅4H2O. J. Ceram. Soc. Jpn. 2000, 108, 892. [Google Scholar] [CrossRef]
  9. Aono, H.; Traversa, E.; Sakamoto, M.; Sadaoka, Y. Crystallographic characterization and NO2 gas sensing property of LaFeO3 prepared by thermal decomposition of Ln-Fe hexacyanocomplexes, Ln[Fe(CN)6]⋅4H2O, La, Ln = Nd, Sm, Gd, and Dy. Sens. Actuators B 2003, 94, 132. [Google Scholar] [CrossRef]
  10. Martinelli, G.; Carotta, M.C.; Ferroni, M.; Sadaoka, Y.; Traversa, E. Screen-printed perovskite-type thick films as gas sensors for environmental monitoring. Sens. Actuators B Chem. 1999, 55, 99–110. [Google Scholar] [CrossRef]
  11. Traversa, E.; Sadaoka, Y.; Carotta, M.C.; Martinelli, G. Environmental monitoring field tests using screen-printed thick-film sensors based on semiconducting oxides. Sens. Actuators B Chem. 2000, 65, 181. [Google Scholar] [CrossRef]
  12. Aono, H.; Sato, M.; Traversa, E.; Sakamoto, M.; Sadaoka, Y. Design of Ceramic Materials for Chemical Sensors: Effect of SmFeO3 Processing on Surface and Electrical Properties. J. Am. Ceram. Soc. 2004, 84, 341–347. [Google Scholar] [CrossRef]
  13. Carotta, M.C.; Martinelli, G.; Sadaoka, Y.; Nunziante, P.; Traversa, E. Gas-sensitive electrical properties of perovskite-type SmFeO3 thick films. Sens. Actuators B Chem. 1998, 48, 270–276. [Google Scholar] [CrossRef]
  14. Tomoda, M.; Okano, S.; Itagaki, Y.; Aono, H.; Sadaoka, Y. Air quality prediction by using semiconducting gas sensor with newly fabricated SmFeO3 film. Sens. Actuators B Chem. 2003, 97, 190–197. [Google Scholar] [CrossRef]
  15. Mori, M.; Itagaki, Y.; Iseda, J.; Sadaoka, Y.; Ueda, T.; Mitsuhashi, H.; Nakatani, M. Influence of VOC structures on sensing property of SmFeO3 semiconductive gas sensor. Sens. Actuators B Chem. 2014, 202, 873–877. [Google Scholar] [CrossRef]
  16. Hosoya, Y.; Itagaki, Y.; Aono, H.; Sadaoka, Y. Ozone detection in air using SmFeO3 gas sensor. Sens. Actuators B Chem. 2005, 108, 198–201. [Google Scholar] [CrossRef]
  17. Mathe, V.L. Structural, dielectric and electrical properties of SmxBi1−xFeO3 ceramics. J. Magn. Magn. Mater. 2003, 263, 344–352. [Google Scholar] [CrossRef]
  18. Ishihara, T.; Sato, K.; Takita, Y. Electrophoretic Deposition of Y2O3-Stabilized ZrO2 Electrolyte Films in Solid Oxide Fuel Cells. J. Am. Ceram. Soc. 1996, 79, 913–919. [Google Scholar] [CrossRef]
  19. Sing, K.S.W.; Everett, D.H.; Haul, R.A.W.; Moscou, L.; Pierotti, R.A.; Rouquerol, J.; Siemieniewska, T. Reporting physisorption data for gas/solid systems with special reference to the determination of surface area and porosity (Recommendations 1984). Pure Appl. Chem. 1985, 57, 603–619. [Google Scholar] [CrossRef]
  20. Gregg, S.J.; Sing, K.S.W.; Salzberg, H.W. Adsorption, Surface Area and Porosity, 2nd ed.; Academic Press: London, UK, 1982. [Google Scholar]
  21. Li, H.; Yu, K.; Lei, X.; Guo, B.; Li, C.; Fu, H.; Zhu, Z. Synthesis of the MoS2@CuO heterogeneous structure with improved photocatalysis performance and H2O adsorption analysis. Dalton Trans. 2015, 44, 10438–10447. [Google Scholar] [CrossRef]
  22. Yamazoe, N.; Shimanoe, K. Theory of power laws for semiconductor gas sensors. Sens. Actuators B Chem. 2008, 128, 566–573. [Google Scholar] [CrossRef]
  23. Itagaki, Y.; Fujihashi, K.; Aono, H.; Mori, M.; Sadaoka, Y. VOC sensing behavior of semiconducting Sm2O3/SmFeO3 mixtures. J. Ceram. Soc. Jpn. 2015, 123, 961–966. [Google Scholar] [CrossRef] [Green Version]
  24. Carbone, M.; Tagliatesta, P. NiO Grained-Flowers and Nanoparticles for Ethanol Sensing. Materials 2020, 13, 1880. [Google Scholar] [CrossRef] [Green Version]
  25. Kruefu, V.; Wisitsoraat, A.; Phokharatkul, D.; Tuantranont, A.; Phanichphant, S. Enhancement of p-type gas-sensing performance of NiO nanoparticles prepared by precipitation with RiO2 impregnation. Sens. Actuators B Chem. 2016, 236, 466–473. [Google Scholar] [CrossRef]
  26. Zhang, X.; Xu, Y.; Liu, H.; Zhao, W.; Ming, A.; Wei, F. Preparation of porous Co3O4 and its response to ethanol with low energy consumption. RSC Adv. 2020, 10, 2191–2197. [Google Scholar] [CrossRef] [Green Version]
  27. Dai, Z.; Lee, C.-S.; Kim, B.-Y.; Kwak, C.-H.; Yoon, J.-W.; Jeong, H.-M.; Lee, J.-H. Honeycomb-like Periodic Porous LaFeO3 Thin Film Chemiresistors with Enhanced Gas-Sensing Performances. ACS Appl. Mater. Interfaces 2014, 6, 16217–16226. [Google Scholar] [CrossRef]
  28. Yu, J.; Wang, C.; Yuan, Q.; Yu, X.; Wang, D.; Chen, Y. Ag-Modified Porous Perovskite-Type LaFeO3 for Efficient Ethanol Detection. Nanomaterials 2020, 12, 1768. [Google Scholar] [CrossRef] [PubMed]
Figure 1. Experimental setup for the sensor test.
Sensors 22 05616 g001
Figure 2. XRD patterns of the SmFeO3 powder (sample A).
Sensors 22 05616 g002
Figure 3. Volume distribution of the classified SmFeO3 powders: (a) as balled milled (sample A), and (b) the supernatant component of the suspension of sample A (sample B).
Sensors 22 05616 g003
Figure 4. Nitrogen adsorption isotherms of samples A (a) and B (b) measured at 77K.
Sensors 22 05616 g004
Figure 5. FE-SEM images of the powders of samples A (a) and B (b).
Sensors 22 05616 g005
Figure 6. SEM images of the surface of the SmFeO3 detection layers of sample A (a) and B (b) sintered at 600 °C.
Sensors 22 05616 g006
Figure 7. Transient response curves of the sensors with sample A (a) and B (b) in ethanol at 320 °C.
Sensors 22 05616 g007
Figure 8. Concentration dependences of sensors responses (RVOC/Rair) in ethanol and toluene: (a) sample A and (b) sample B at 285 and 320 °C.
Sensors 22 05616 g008
Figure 9. Log-log plots of concentration of ethanol and toluene vs. sensor responses at 285 and 320 °C with sample A (a) and sample B (b).
Sensors 22 05616 g009
Figure 10. Sensor responses to VOCs with sample B at 285 °C and 320 °C.
Sensors 22 05616 g010
Table 1. Characteristic parameters of a and n assuming RVOC/Rair = aPn for the sensors with samples A and B.
Target GasTemp. (°C)Sample ASample B
anan
Ethanol28519.31.196.550.732
32019.40.83336.90.714
Toluene28510.21.072.990.609
3206.490.57613.20.337
Publisher’s Note: MDPI stays neutral with regard to jurisdictional claims in published maps and institutional affiliations.

