1. Introduction
Silica glass doped with Gd
3+-ions fabricated through the sol–gel process has been shown to be suitable for use in dosimeters for X-ray beams [
1], proton beams [
2], and electron beams [
3]. The radiation-induced luminescence (RIL) generated in the doped silica glass has in these studies been shown to be proportional to the ionizing dose on the tested samples, by studying the light generated in the doped glass, which was transported away from the irradiation area through an optical fiber, fusion-spliced to the doped glass.
The RIL response under steady-state irradiation was studied using X-rays in [
1]. There, the response was found to be at least linear in the dose rate range 125 μGy(SiO
2)/s to 12.25 Gy(SiO
2)/s. In the study using proton irradiation [
2], the sample was irradiated by the proton beams of energies between 6 MeV and 63 MeV, with dose rates from 0.02 Gy/s to 0.30 Gy/s. The dose profile of the proton beams in water was also investigated in the study, along with the samples doped with Ce
3+-ions and Cu
+-ions. The doped glass samples’ ability to resolve the proton Bragg peak was compared with a reference Markus chamber, where the Gd
3+-doped sample came close to the performance of the Markus chamber, and showed better capabilities in this aspect than the samples with other dopants. The response to the electron radiation of doped silica glasses was tested in [
3], where samples doped with Ce
3+-ions, Cu
+-ions, and Gd
3+-ions were investigated. In that study, a pulsed beam was used and the RIL response to the variations of the electron bunch sizes were studied. The tested samples showed a linear RIL response in the dose-per-bunch range 10
−5 Gy/bunch–1.5 × 10
−2 Gy/bunch, for the 3 μs long electron bunches. The RIL of Gd
3+-ions is ascribed to the transition between the
6P
7/2 and
8S
7/2 levels [
1,
2,
4]. This transition produces a narrow emission peak at 314 nm [
1,
3,
4]. The decay time of this transition is fairly long, and has been measured to be 1.80 ms in [
5] for the comparable doping level of 0.05 mol%, and to 1.35 ms in [
1], a similar sample as the one tested in this paper, with a dopant level of 0.1 wt%
0.04 mol%.
SiO
2 also has radiation-induced absorption (RIA) and RIL bands, which are not related to the Gd
3+-dopant ions. Studies of the transient RIA was performed on amorphous SiO
2 samples using pulsed electron beams in [
6], where transient absorption bands were observed at 5.3 eV (234 nm), and at 4.2 eV (295 nm). These absorption bands are ascribed to the metastable centers formed after electron–hole pair generation, called self-trapped excitons (STEXs) [
6,
7]. The STEX centers in [
8] were found to be formed by an Si-O bond breaking when an electron was excited, and the lattice subsequently distorting, trapping the excited electron and the hole, respectively, on the broken apart Si and O atoms. The STEXs causing the transient RIA were in [
6] found to have a luminescent decay by emission energies around 2.4 eV (517 nm), also exhibiting a blue-shift over the time of the decay. The luminescence in [
9] was measured to have a peak energy around 2.8 eV, and a decay time close to 1 ms when the sample was cooled down to temperatures below 170 K. At temperatures above 170 K, the decay time was found to decrease with increasing temperature.
An important quality for dosimeter systems used in radiotherapy contexts is the ability to represent dose as a function of depth in water, since the dose deposited in human tissue is the key parameter for radiotherapy. For the Gd
3+-doped silica glass dosimeters studied in this paper, the ability to measure the dose–depth curves of protons in water has been previously demonstrated [
2]. The corresponding dose–depth curves of electron beams measured with this type of sample have not yet been studied in the literature to the best of the authors’ knowledge.
When measuring the light output of an optical fiber irradiated by electrons at a depth in water or another material, a signal from Cherenkov light will be induced with increasing intensity as a function of depth, as the electrons scatter more frequently at larger angles [
10]. The depth profile of emitted Cherenkov light in an optical fiber differs from the depth profile of an ionizing dose. The dose–depth profile from electron beams displays an initial increase due to the generation of secondary particles up to the maximum dose value, then a decrease of deposited dose due to the decrease in the primary beam intensity, and finally, a longer tail by induced X-ray secondaries (see, e.g., [
11] for further descriptions).
The dose–depth profiles of electron beams in an acrylic phantom, measured using a Gd
3+-doped silica glass sample, were studied in this paper. Acrylic is commonly used as a substitute to water in the dosimetric measurements of clinical beams due to its similar properties to water [
12], and thus, provides a good understanding of the behavior of the Gd
3+-doped sample under electron beams in tissue for medical applications. The sample was also studied under electron beams at varying angles relative to the sample to for further study the properties of the induced Cherenkov emission. The properties of the RIL from the Gd
3+-doped glass was also investigated in narrow wavelength regions selected with a monochromator setup, where the decay times of the RIL emissions were measured.
2. Materials and Methods
2.1. Tested Sample
A Gd
3+-doped sol–gel silica glass rod was tested. The rod was 1 cm-long and had a diameter of approximately 500 μm, and a dopant concentration of 0.1 wt% Gd
3+-ions. The descriptions of the fabrication process of this type of sample were found in, e.g., [
13,
14]. The Gd
3+-doped rod, drawn at a temperature of approximately 2000 °C, was fusion-spliced to a 500 μm pure-silica core multimode optical fiber, with a numerical aperture of 0.4. This optical fiber was used to transport the RIL to the signal analysis and read-out systems described in
Section 2.2.
2.2. Test Setup
A monochromator was used to select specific wavelength regions of the RIL for analysis. The monochromator was a 996 mm focal length Fastie–Ebert type monochromator with a 2200 grooves/mm holographic diffraction grating, which was further described in [
15]. The RIL-light from the 500 μm transport fiber was sent to the monochromator through two aspheric lenses, which converted the numerical aperture and focused the light to fit a fiber bundle which led the light into the monochromator.
At the output end of the monochromator, the light was detected by a Hamamatsu R9880U-110 photomultiplier tube (PMT) [
16]. The spectral resolution of a monochromator is partly determined by the width of its output aperture, and the total photon flux measured at the output is determined by the aperture area. Typically, a narrow slit is used in front of the output aperture in order to achieve the desired spectral resolution, at the expense of measured light intensity. However, in order to obtain a detectable light signal in these experiments, no exit slit was used and the detection resolution was limited by the 8 mm-diameter photosensitive area of the PMT window, resulting in an instrumental FWHM of approximately 3.5 nm.
The output wavelength of the monochromator was selected by rotating the diffraction grating with a stepping motor. The stepper motor was driven by an ST-7128 Microstep Driver, and controlled by an Arduino UNO. The amount of steps taken was set with the measurement PC via a USB serial connection using Python. The same Python program also controlled the data transfer to the PC of the digitized PMT signal through a CAEN N6751 digitizer module [
17].
The PMT signal was sent to a fast linear amplifier then to the digitizer. The electron beam used for the tests was pulsed (further described in
Section 2.3), and the digitizer acquisition was controlled by a trigger signal coming from an external Si-diode detector in the electron beam. The induced signal from the Si diode when it was struck by an electron bunch was sent to a single channel analyzer, which generated a trigger signal transmitted to the digitizer. Upon the trigger signal arrival, the digitizer acquired a signal trace consisting of a predefined length of the PMT signal. The trace was up to 1 ms-long, with a sampling interval of 0.5 ns within the trace. This allowed the detection of emitted photons by the sample at a specific wavelength, and with a known timing relative to the electron bunch.
To take wider emission spectra, an Ocean Optics USB2000+ UV–VIS–ES spectrometer [
18] was used. When the spectrometer was used, the end of the transport fiber was directly fixed by the spectrometer input window.
2.3. Irradiation Facility
The irradiation tests were carried out at the Radiation Effects Facility (RADEF), in the accelerator laboratory of the University of Jyväskylä, Finland. A Varian Clinac 2100C/D linear electron accelerator [
3,
19] was used to generate the electron beam for the experiments. Electrons with energies of 6, 9, 12, 16, and 20 MeV are available from the Clinac, along with 6 and 15 MV photon beams, consisting of photons with energy spectra, respectively, reaching up to 6 and 15 MeV. The photon beams are bremsstrahlung spectra generated by electrons with energies of 6 and 15 MeV impinging on a metal target.
This study focuses on electron beams, where the energies 6, 12, and 20 MeV were used. The dose rates of the electron beams can be set between 100 rad(H2O)/min and 1 krad(H2O)/min, corresponding to average dose rates of 17 mGy(H2O)/s–0.17 Gy(H2O)/s. The dose rate was monitored by an internal ionization chamber in the machine, which was calibrated against an external ionization chamber at the maximum dose–depth in water. The dose and dose rate levels set by the machine therefore refer to the dose in water.
When changing the dose rate, the electron bunch frequency is modulated, but the size of the bunches stays the same. A ten-fold increase in dose rate thus corresponds to a ten-fold higher bunch frequency. At the lowest dose rate setting from the machine, 100 rad(H2O)/min, the average electron bunch frequency is approximately 20 Hz. This means that the dose per electron bunch is approximately 0.83 mGy, and the instantaneous dose rate from the machine is close to 280 Gy/s during the approximately 3 μs-long electron bunches.
The Clinac at RADEF is an accelerator that was previously used in a hospital for radiotherapy purposes. The gantry is rotatable around the machine isocenter, which is the position at which the dosimetry calibration of the machine is performed, and the location where the tested sample was positioned.
2.4. Test Methodology
When using the monochromator setup, in combination with the PMT and digitizer, the lowest available dose rate of 100 rad(H2O)/min (17 mGy(H2O)/s) from the machine was always used. This was due to the long data traces saved through the digitizer (up to 1 ms), which was associated with a long data processing and transfer time. The digitizer was always busy when recording the data; thus, a higher bunch frequency would not have resulted in any benefits regarding the data collection rate.
The total light transfer efficiency from the doped sample to the PMT was not measured explicitly. The amount of emitted light on the PMT was, however, not large, and irradiation runs of approximately 1 h were utilized for each measurement point and test configuration. To be able to compare the results between different test configurations, the number of detected photon signals per saved digitizer trace were used as a comparable metric. Here, one trace in the digitizer corresponds to one electron bunch from the accelerator.
With the spectrometer setup, the dose rate from the electron accelerator that was used was instead the highest available, 1 krad(H2O)/min (0.17 Gy(H2O)/s). In this case, the acquired spectra were generated by summing up the emitted photons from the sample during 20 s-long time intervals. Three such intervals were used for each irradiation configuration, reaching 1 min of irradiation per tested configuration.
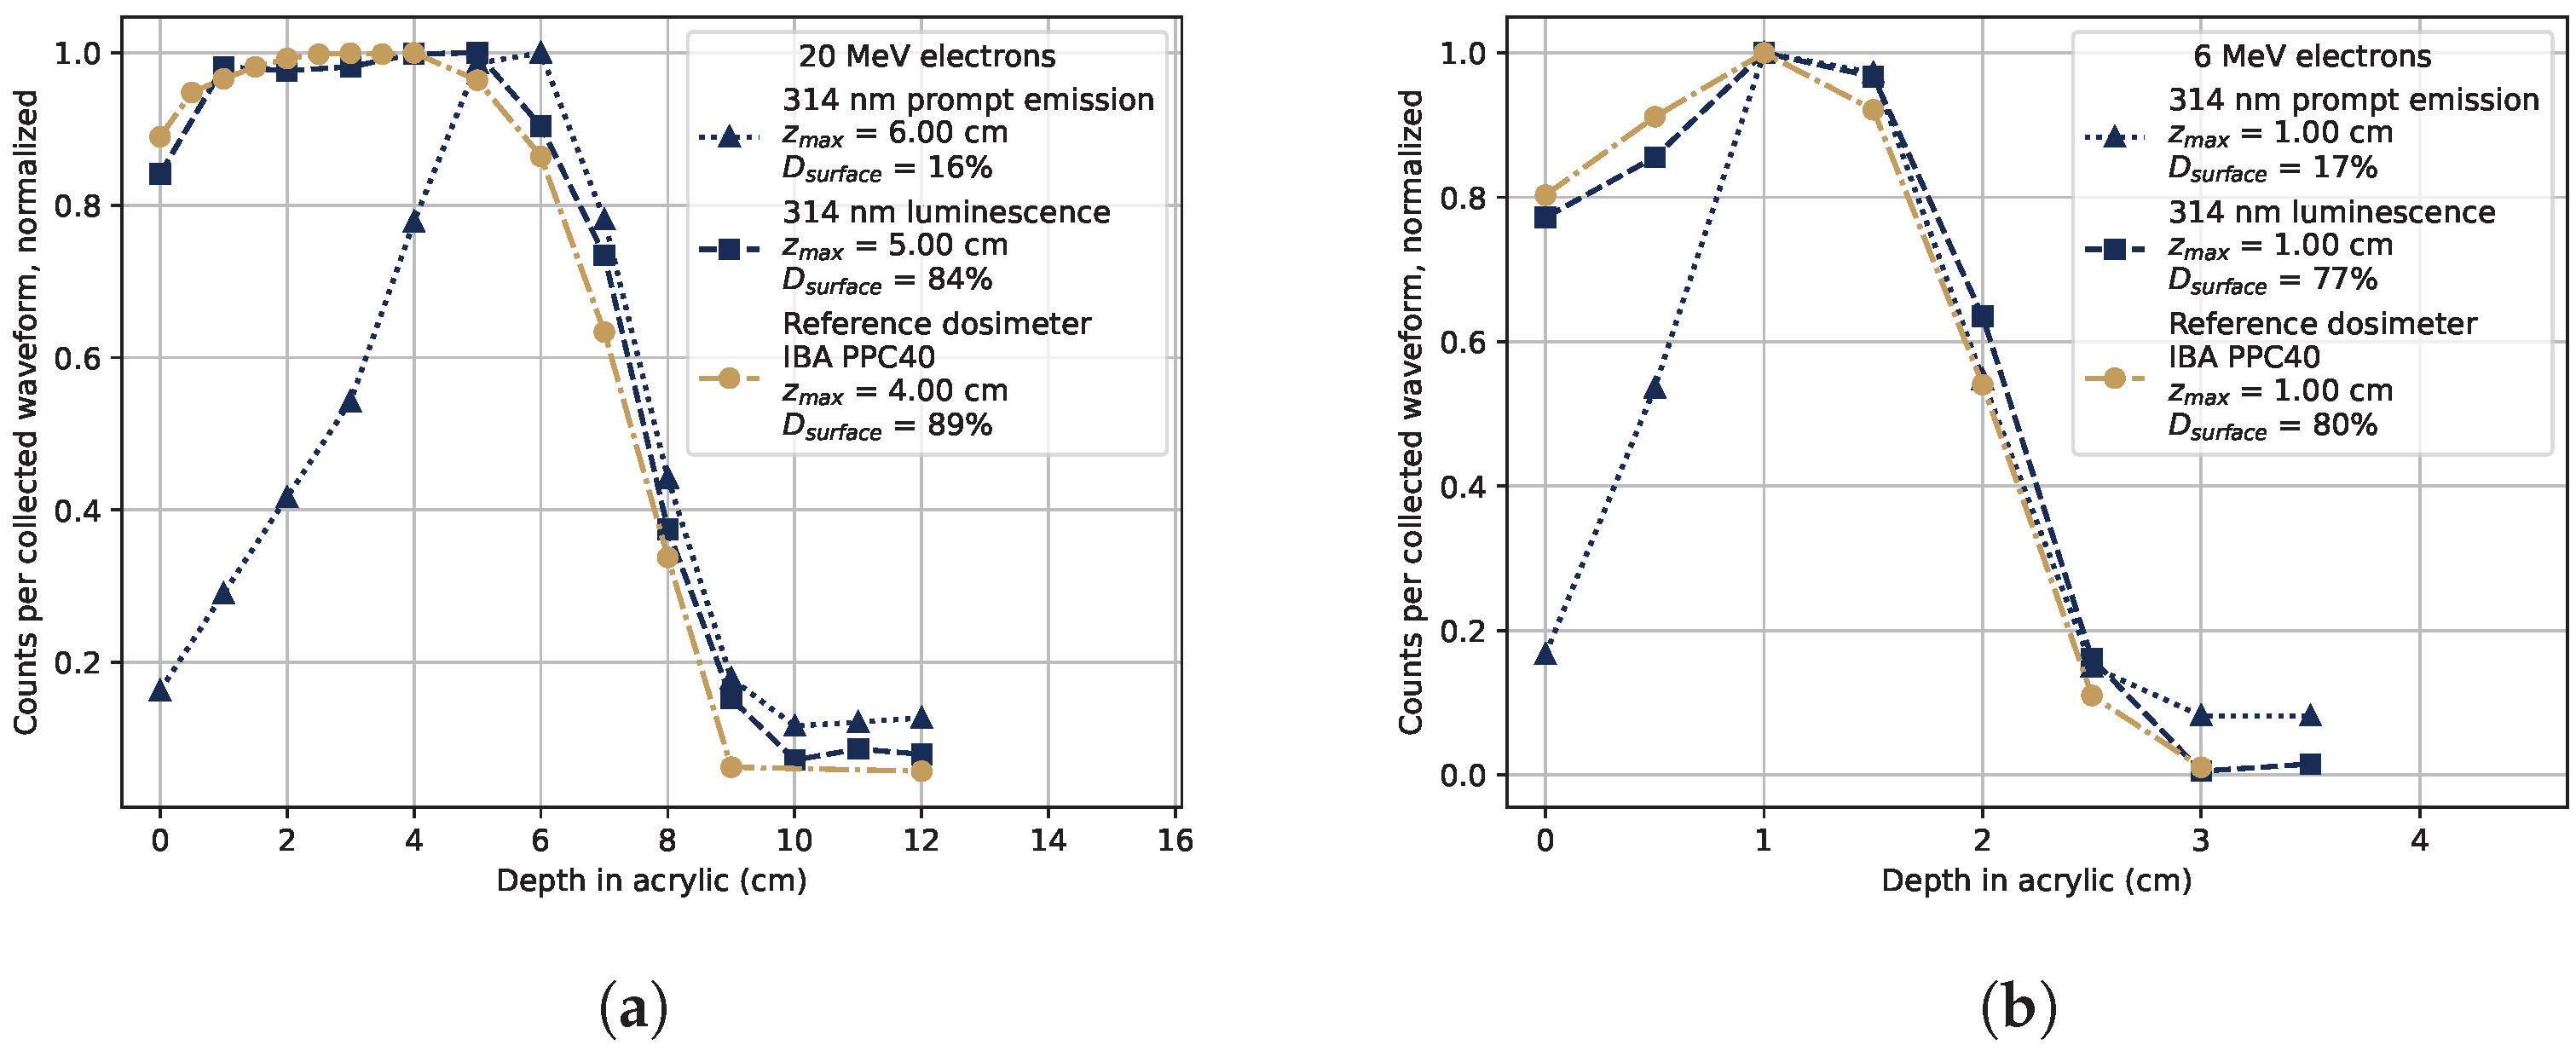
The deposited dose as a function of depth in acrylic was tested, and discussed in
Section 3.2. This was performed by placing the sample in the machine isocenter on top of a 5 cm thick block of acrylic, and placing the sample and transport fiber between two sheets of acrylic with a thickness of 2 mm. The depth in acrylic was then varied by placing layers of acrylic sheets of 5 and 10 mm thickness on top of the sample.
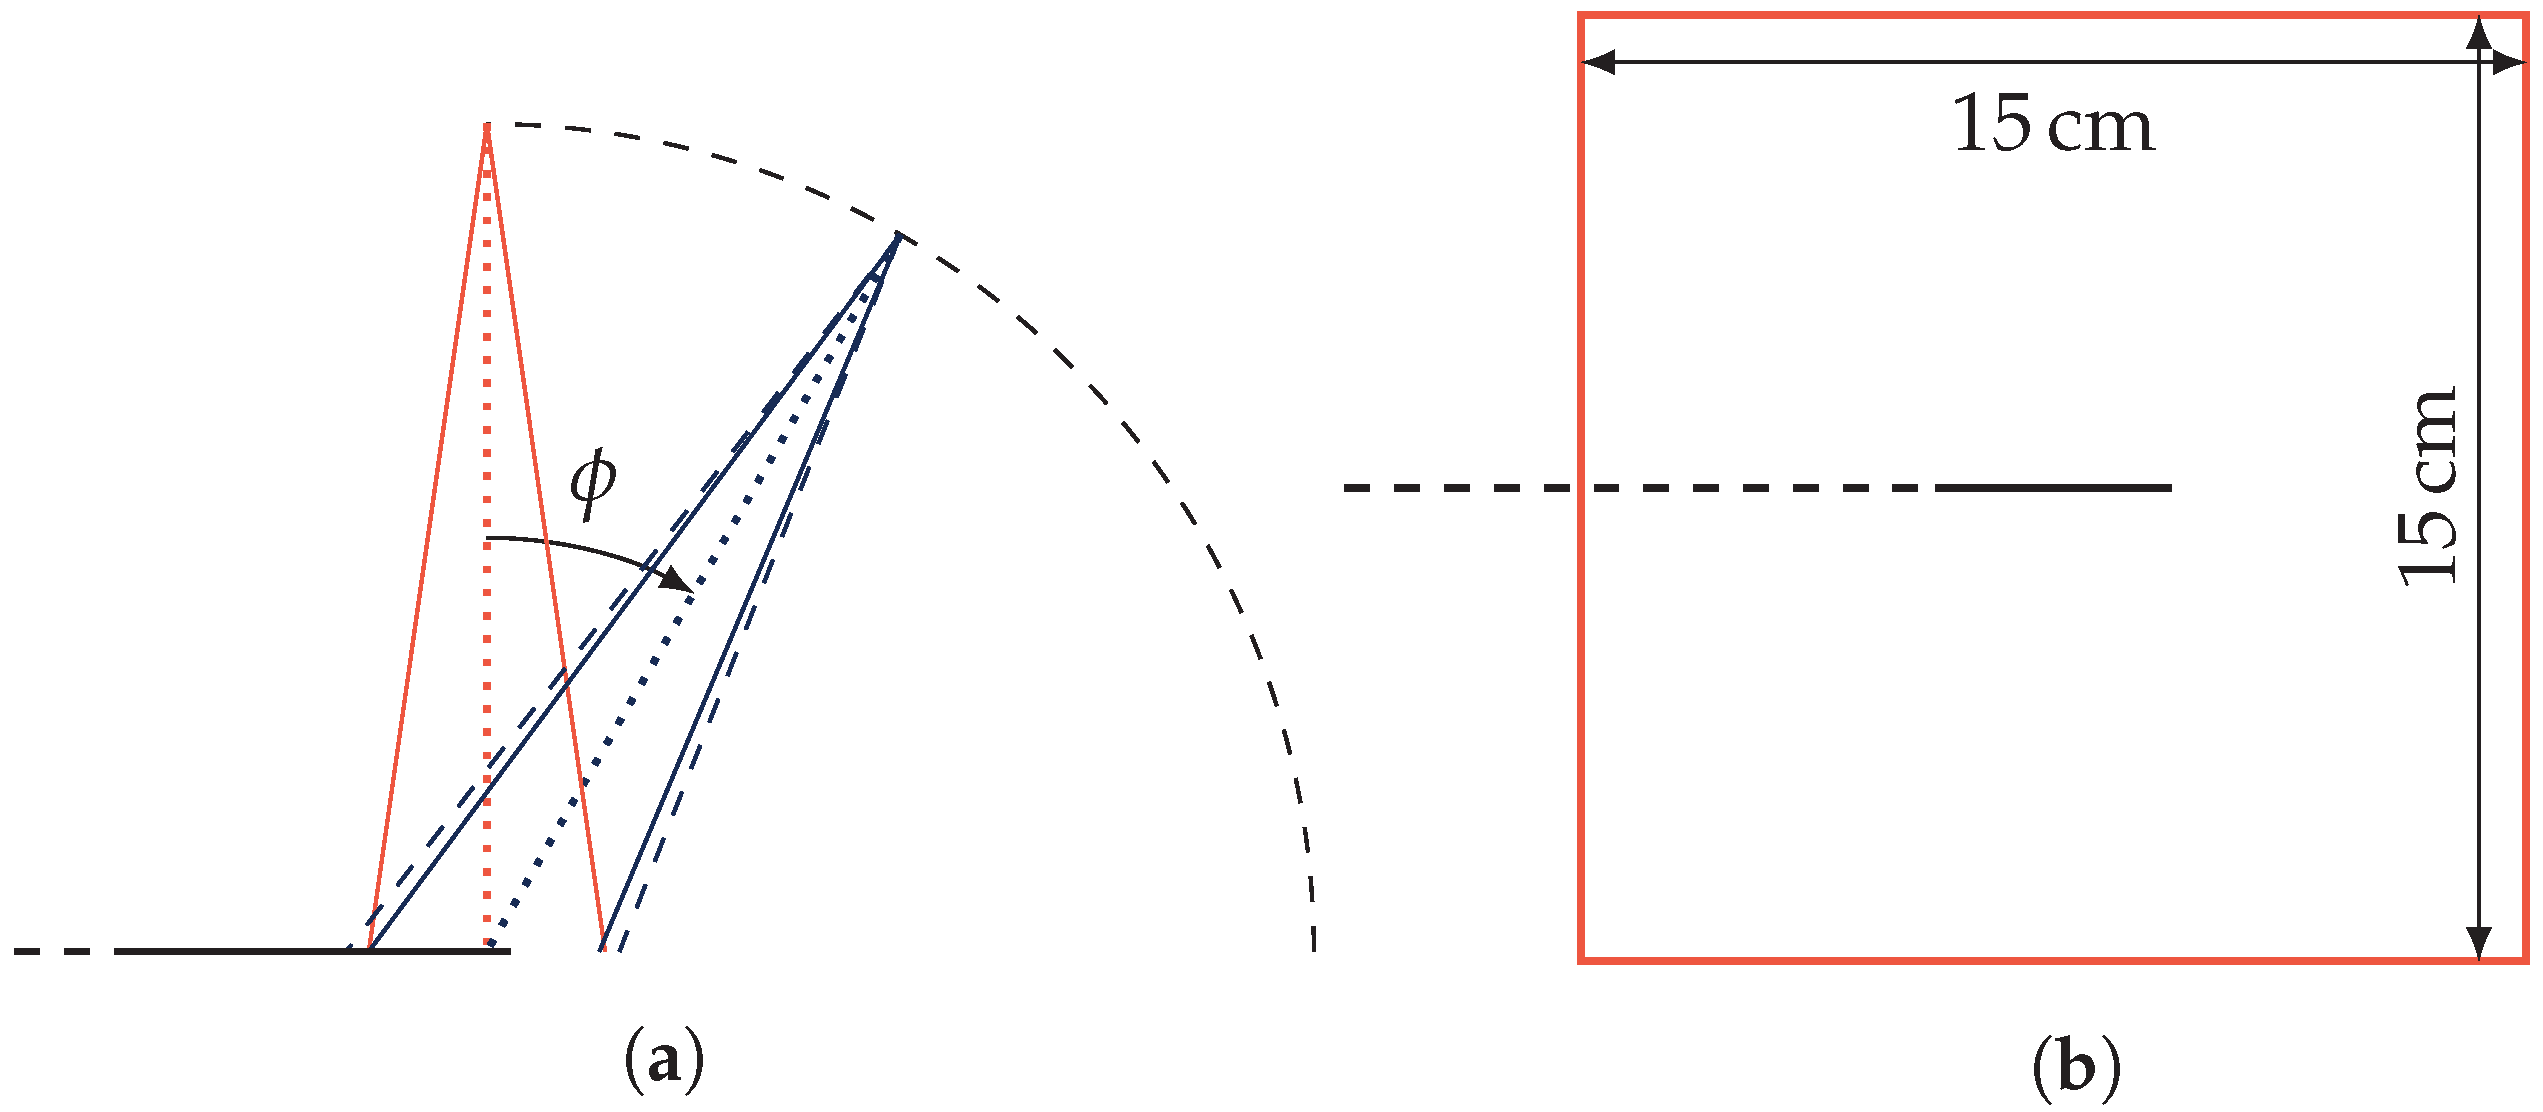
Tests at different beam rotation angles were performed as well, as shown in
Section 3.3. These were performed by suspending the sample freely in air, only supported by a thin plastic sheet. The amount of material surrounding the tested sample was minimized to lessen the scattering of electrons onto the sample from varying angles, potentially producing additional Cherenkov radiation. The transport fiber was oriented away from the beam tilting direction, which is schematically shown in
Figure 1a, where
is the tilt angle of the gantry.
A beam window size of 15 cm × 15 cm was used for the tests at the normal incidence angle (
, and for dose–depth tests in acrylic), which is shown in
Figure 1b, where the sample is seen in the center of the beam window. The total length of sample and transport fiber in the beam is thus 8 cm. After beam rotation, the beam area was changed so that the portion of the sample and transport fiber that was irradiated was always the same. This is shown in
Figure 1a, where the 15 cm × 15 cm beam after rotation is drawn with a dashed line, and the corrected beam after rotation is marked by full blue lines.
4. Conclusions
Sol–gel silica glass doped with Gd3+-ions shows great promise for applications in dosimetry as a point dosimeter using the RIL from ionizing radiation, which has an intensity proportional to the rate of deposited dose. In this study, the properties of the RIE under electron irradiation were studied under different irradiation conditions, allowing for the novel measurements of dose–depth curves, RIL decay times, transient RIA properties, and RIE spectra in this type of sample.
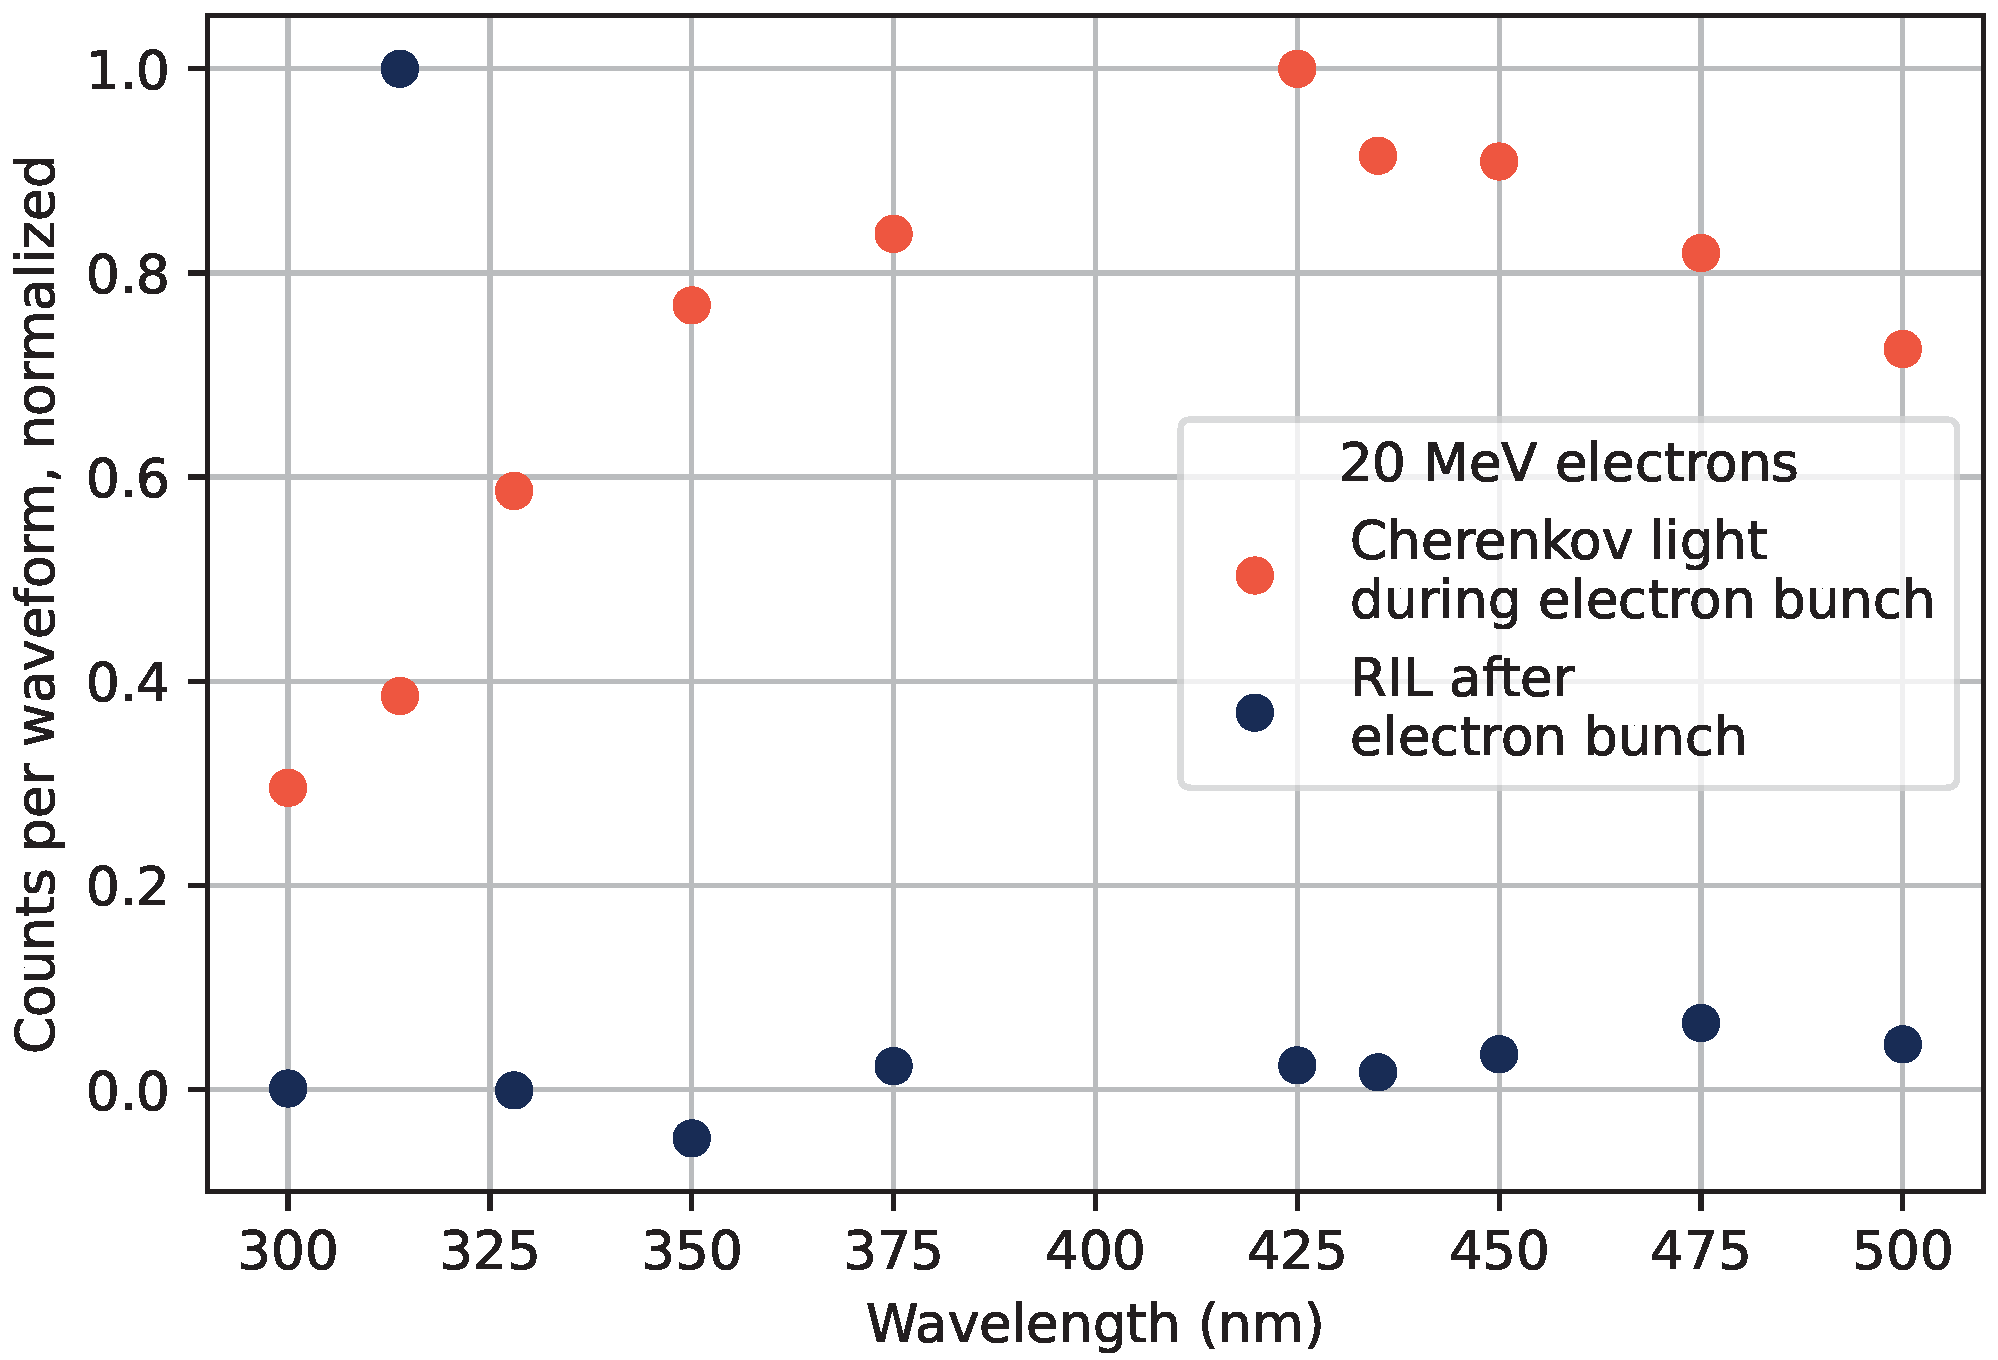
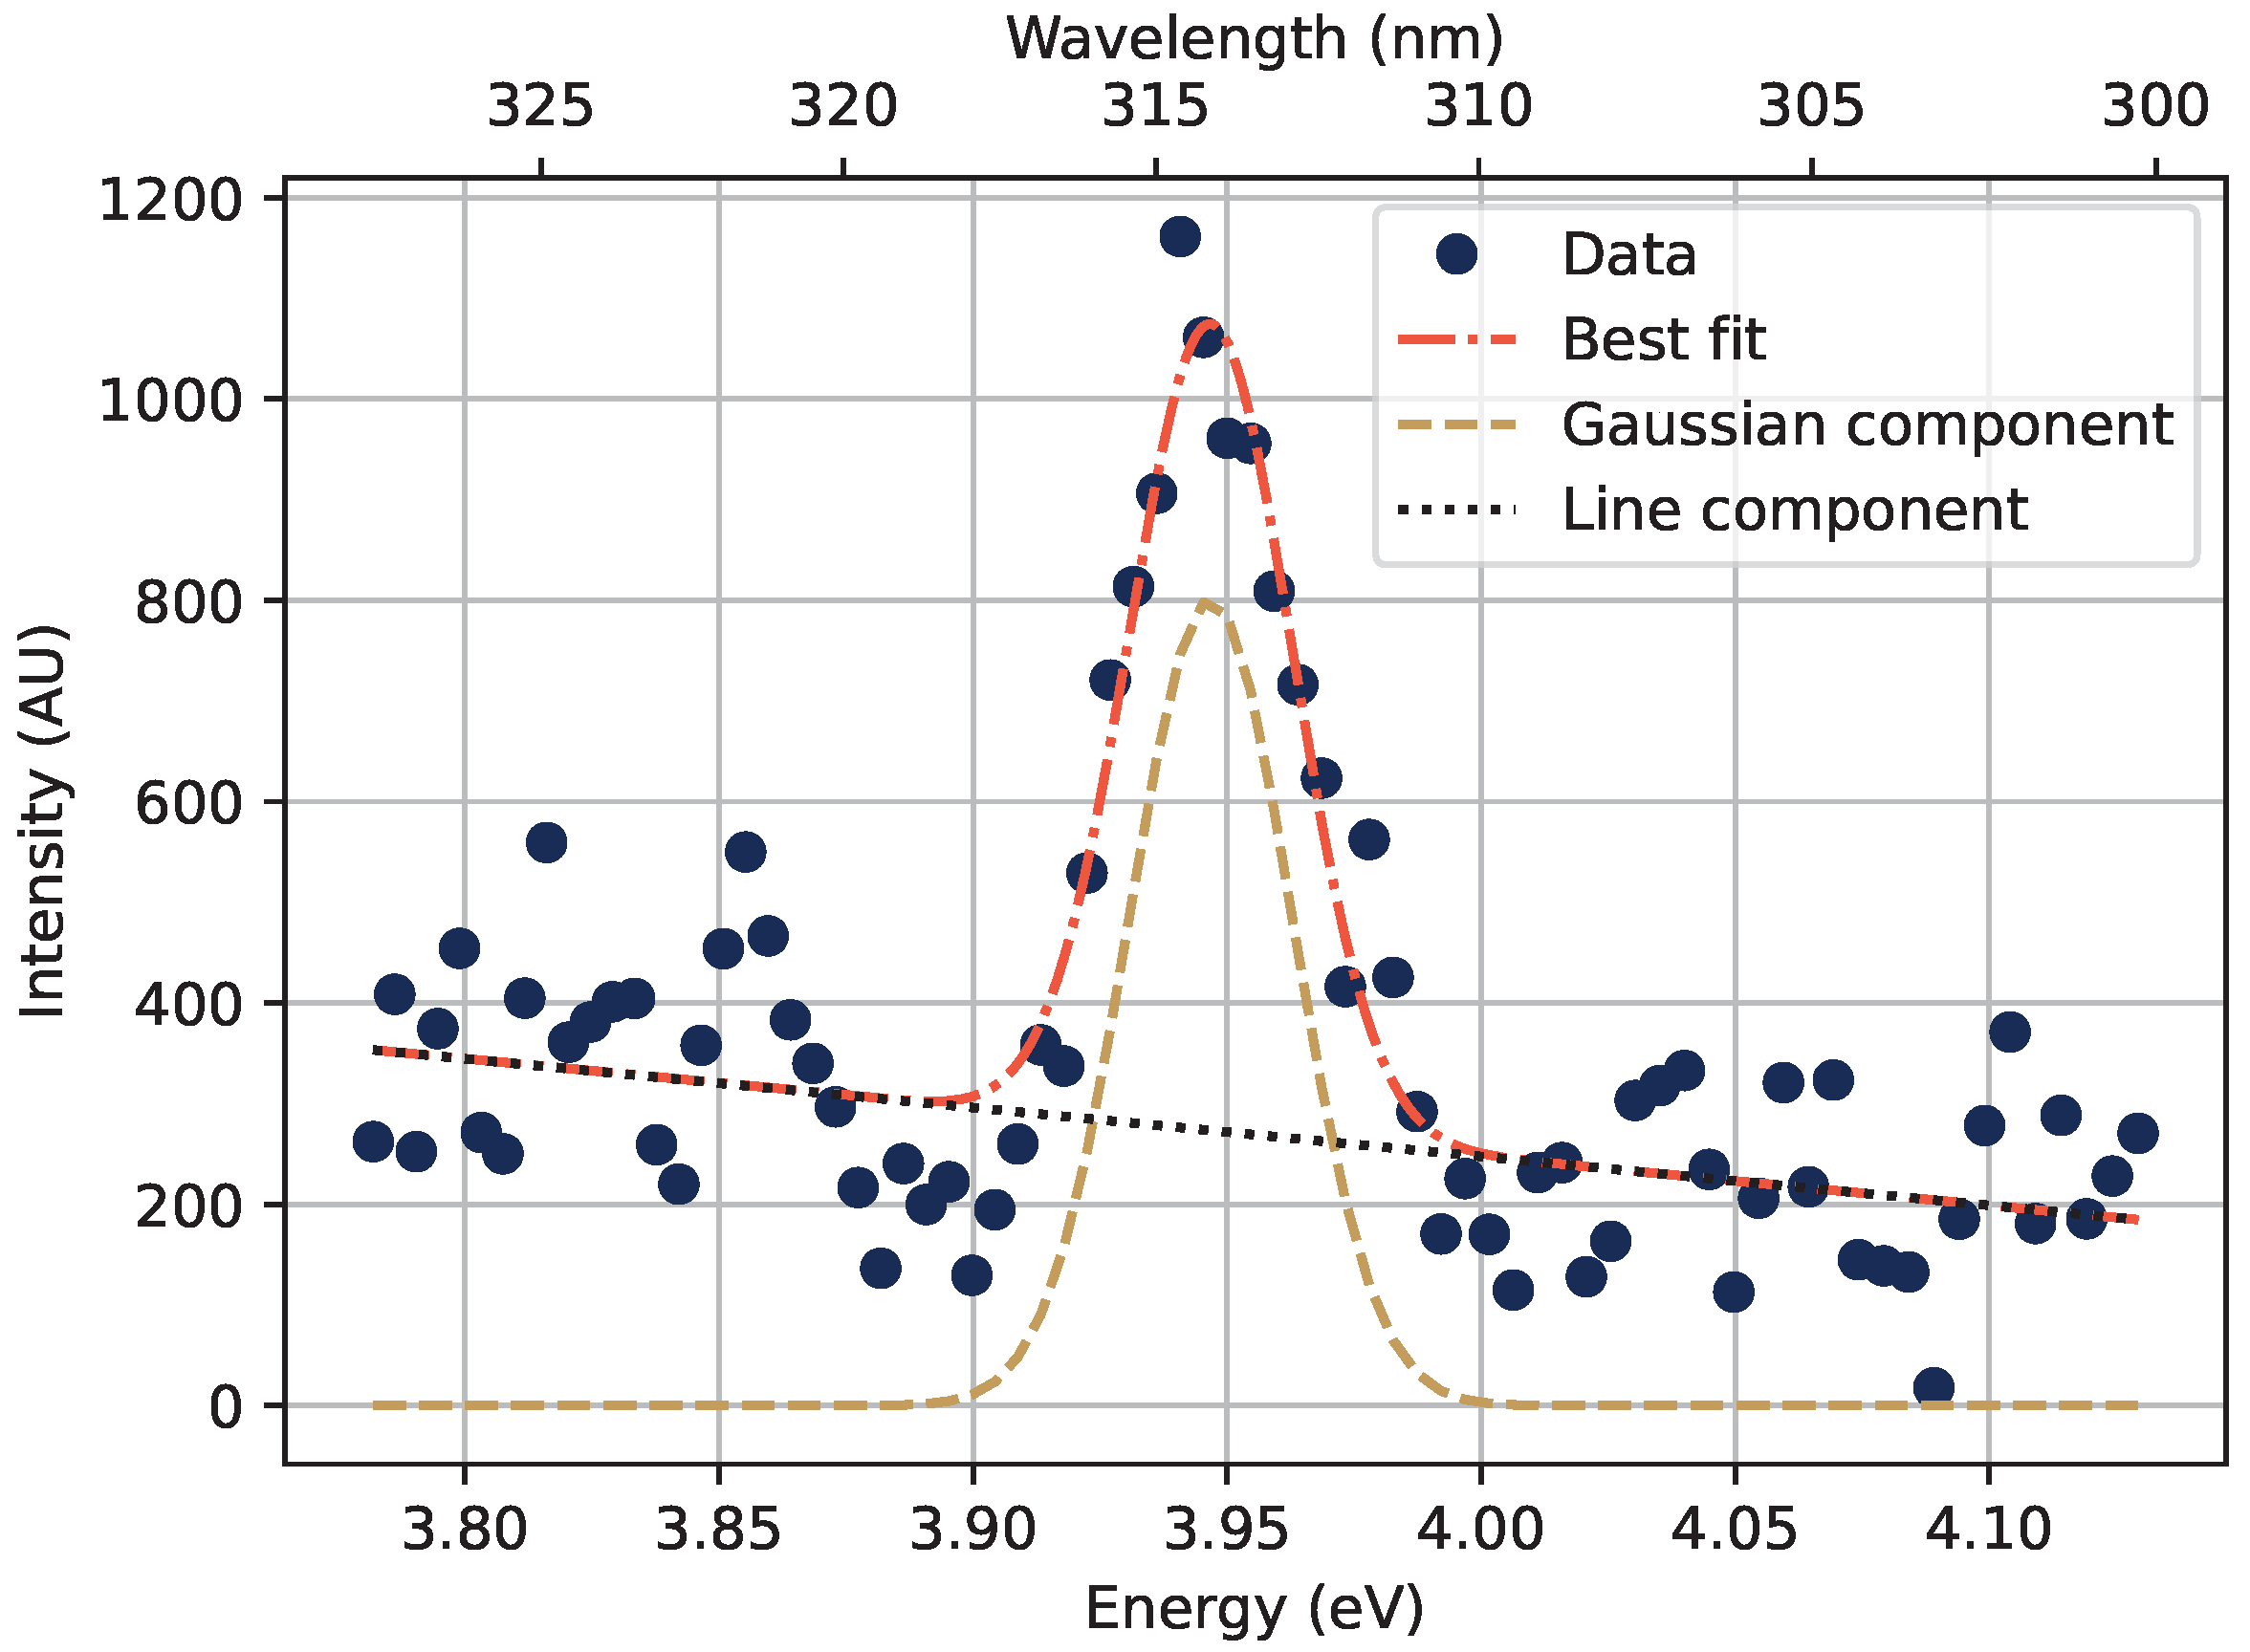
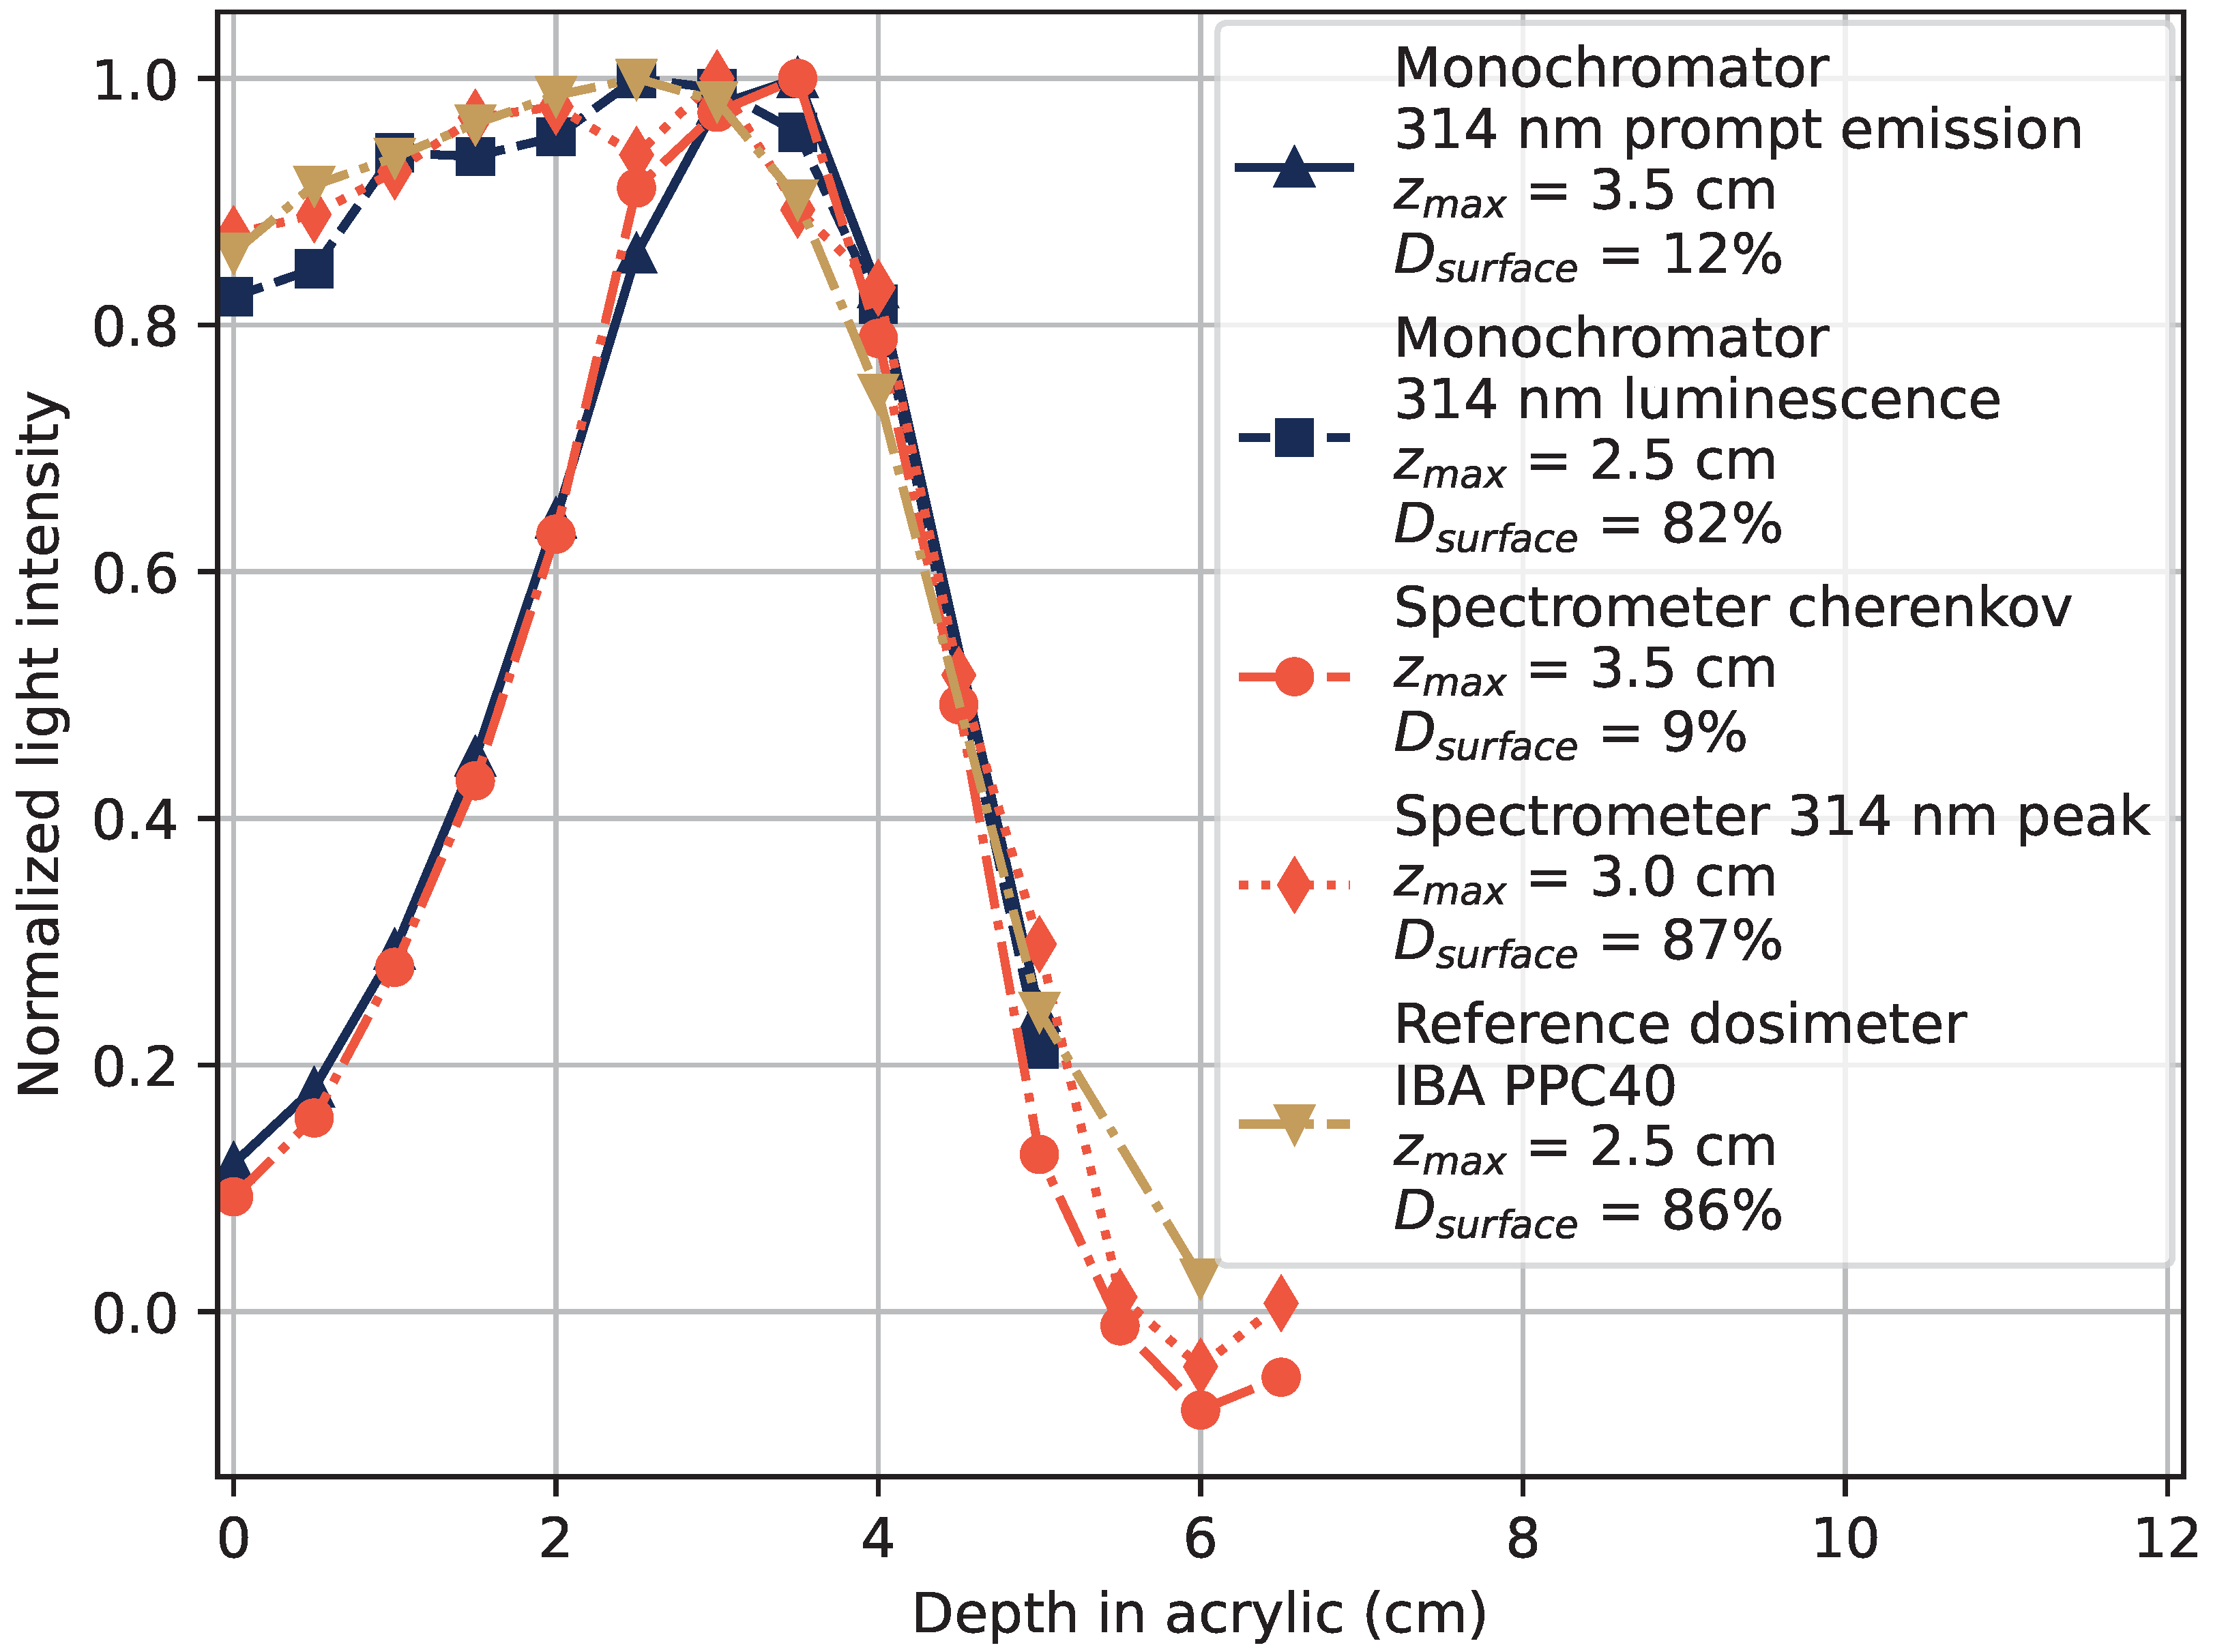
The RIL at 314 nm was found to be proportional to the deposited dose as a function of depth in acrylic for electron beams at 6, 12, and 20 MeV. The luminescence at 314 nm followed the dose–depth profile measured with a reference parallel plate ionization chamber dosimeter, while the Cherenkov radiation induced in the sample follows a different depth profile. To accurately represent the dose at varying depths in materials, it is thus necessary to only select the 314 nm RIL component.
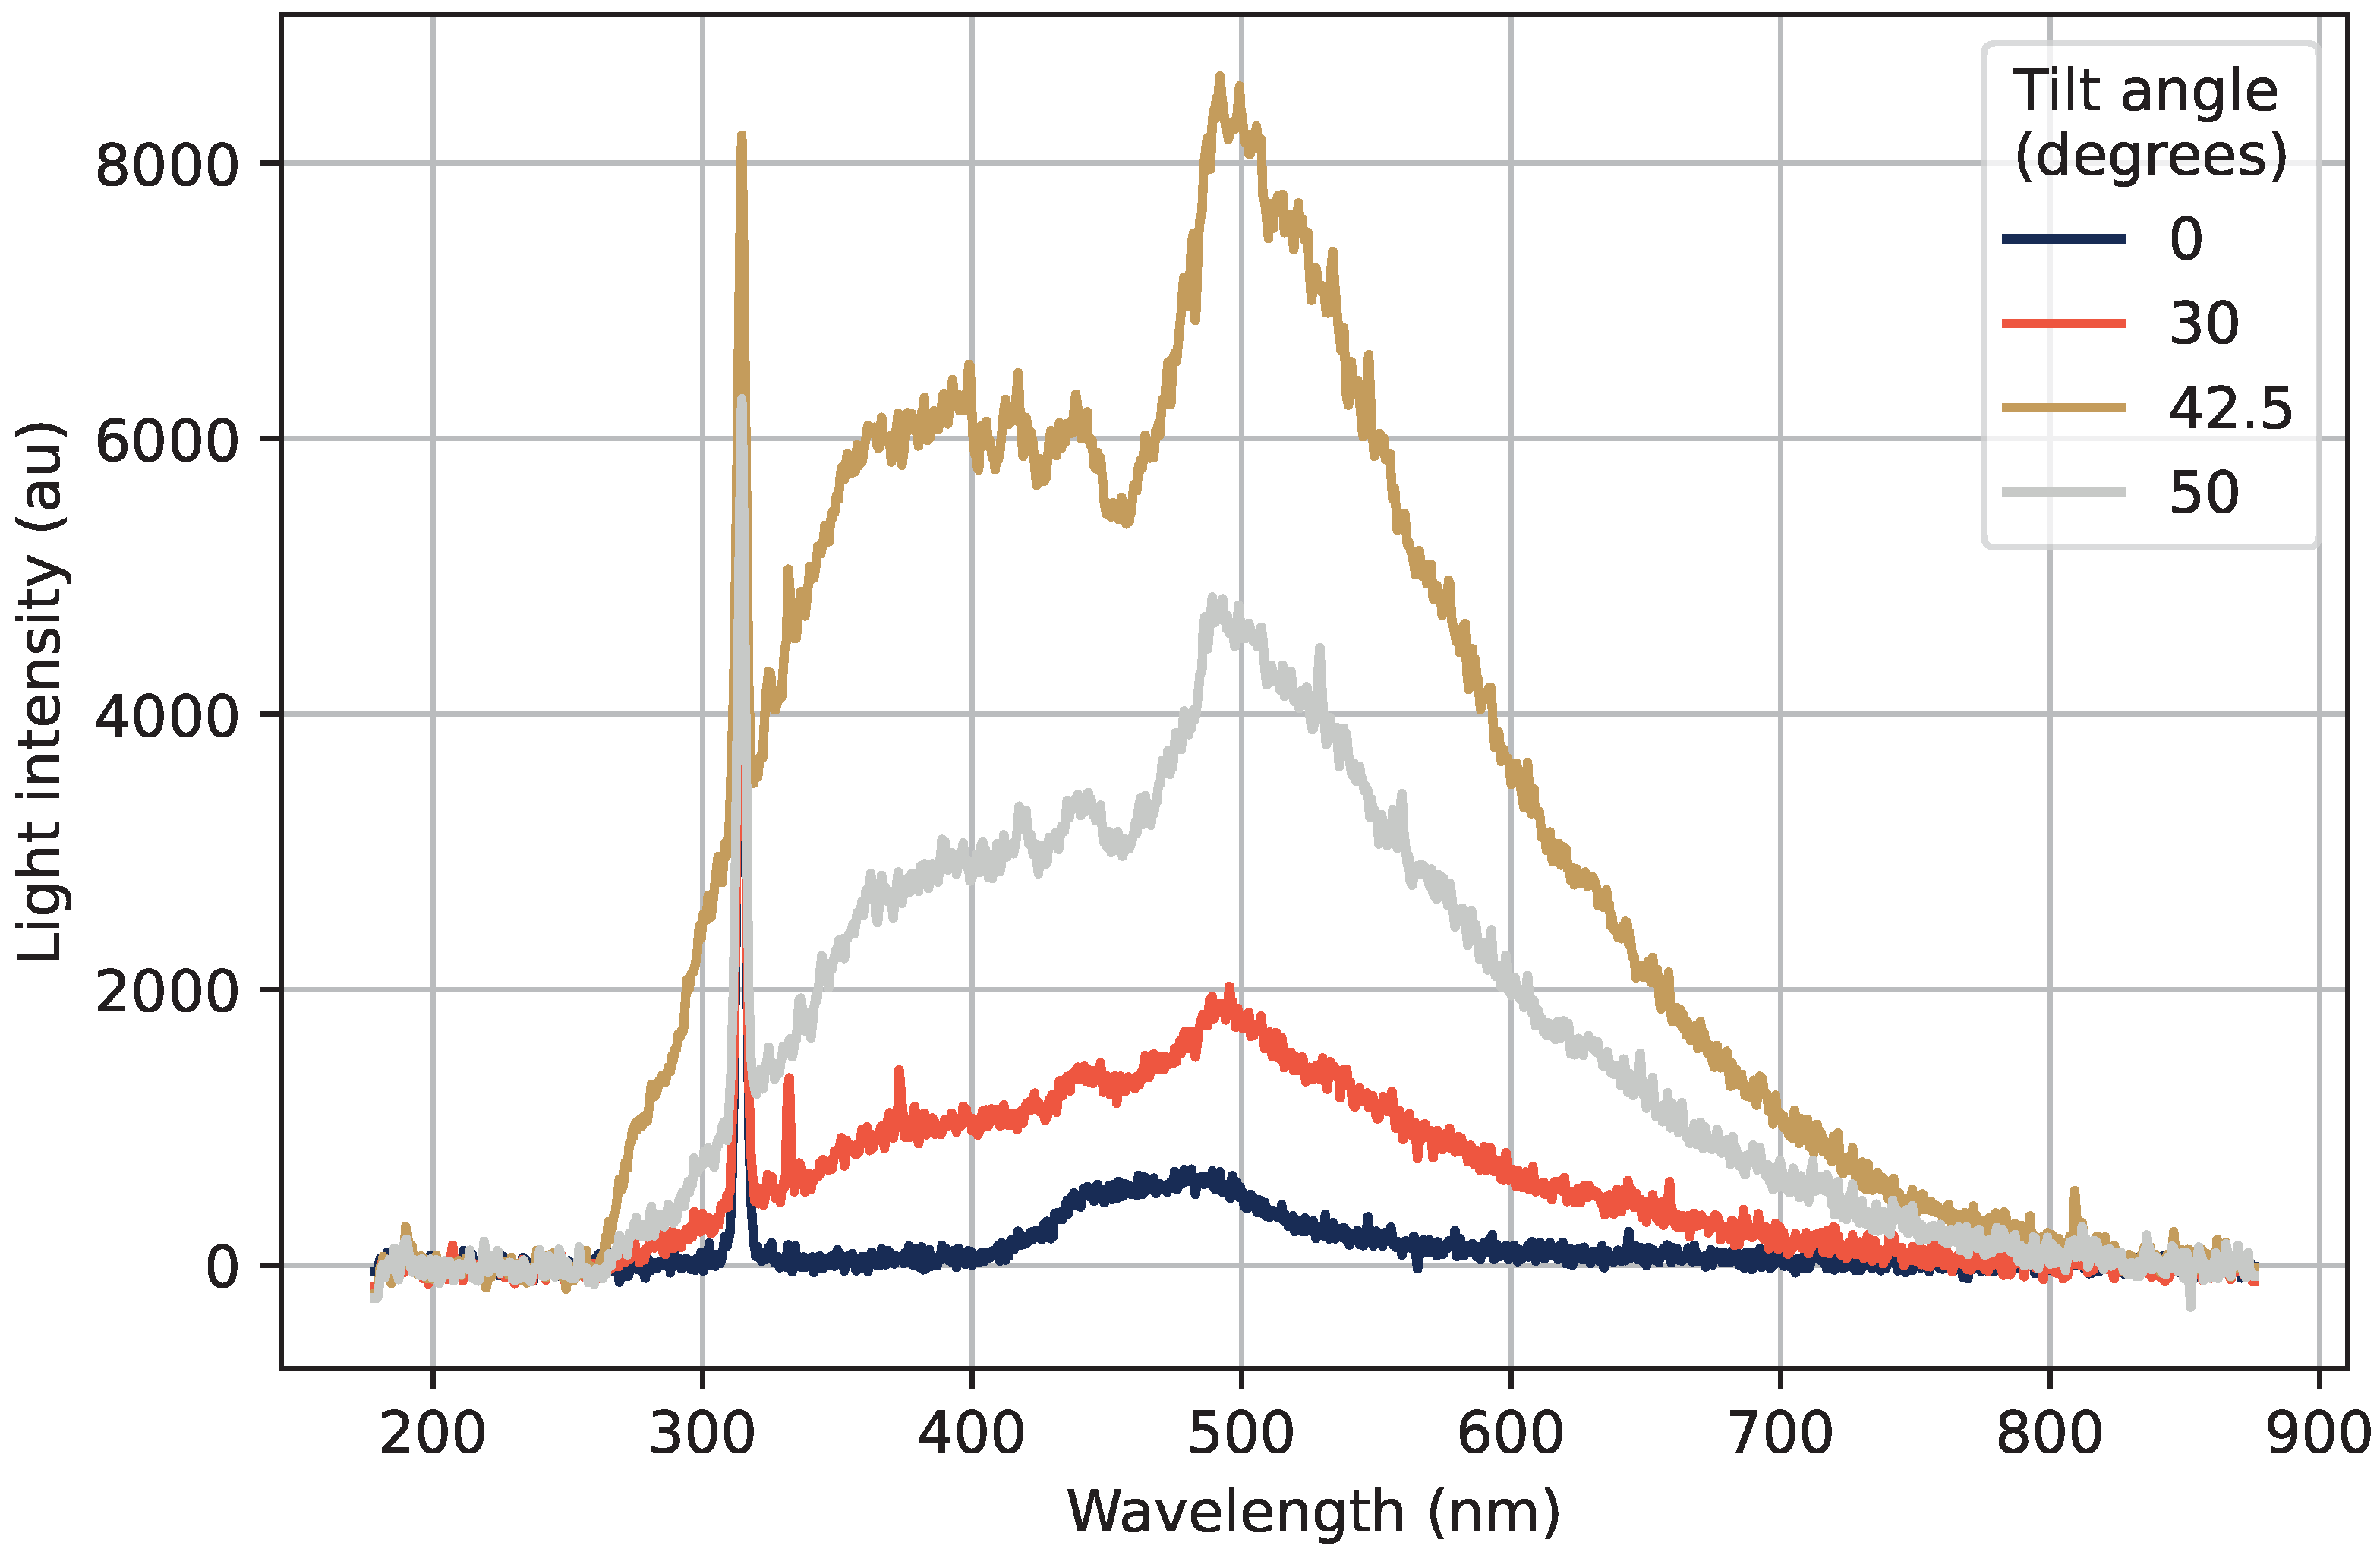
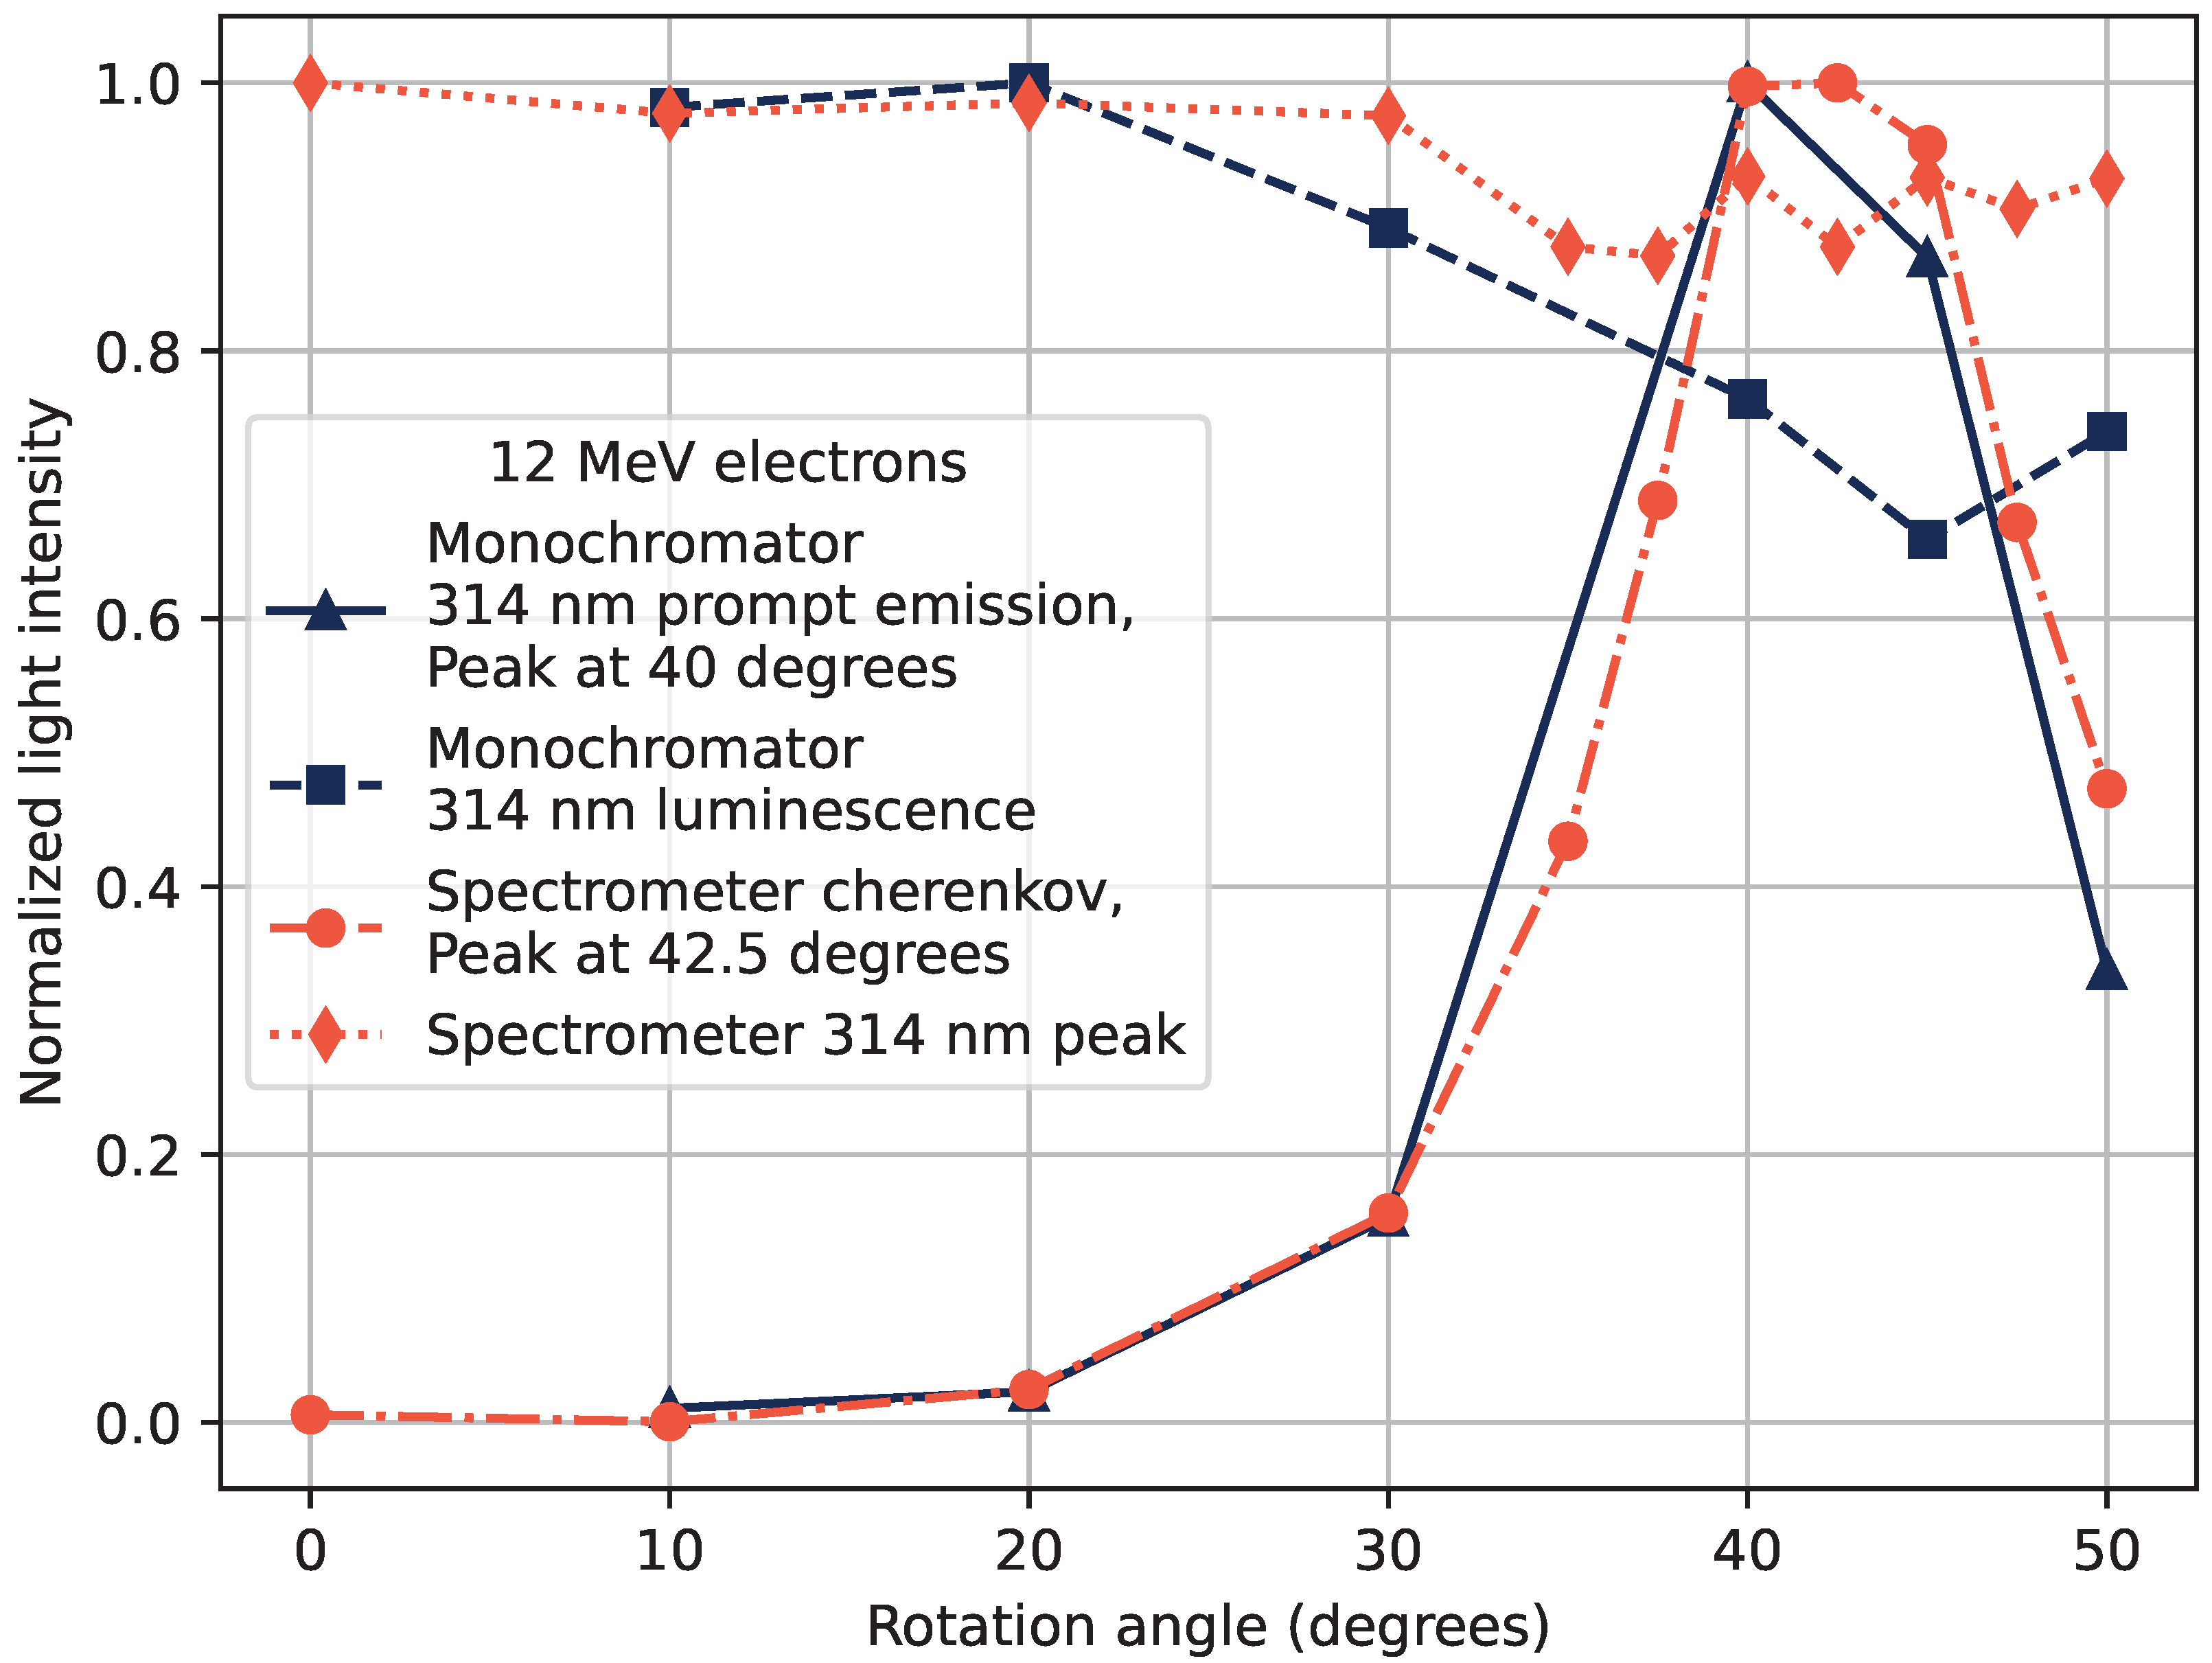
The light emission was also investigated at a varying incidence angle of the beam, confirming a large presence of Cherenkov radiation in the measured RIE. A clear dominance of the Cherenkov light over the 314 nm RIL component was found for the angles allowing maximum Cherenkov light injection through the transport fiber.
The experiments were performed with two different setups: a commercial spectrometer and a monochromator with a PMT for light detection, which provided complementary data to each other. The systems offered different methods of discriminating the Cherenkov background, and only selecting the desired 314 nm RIL component.
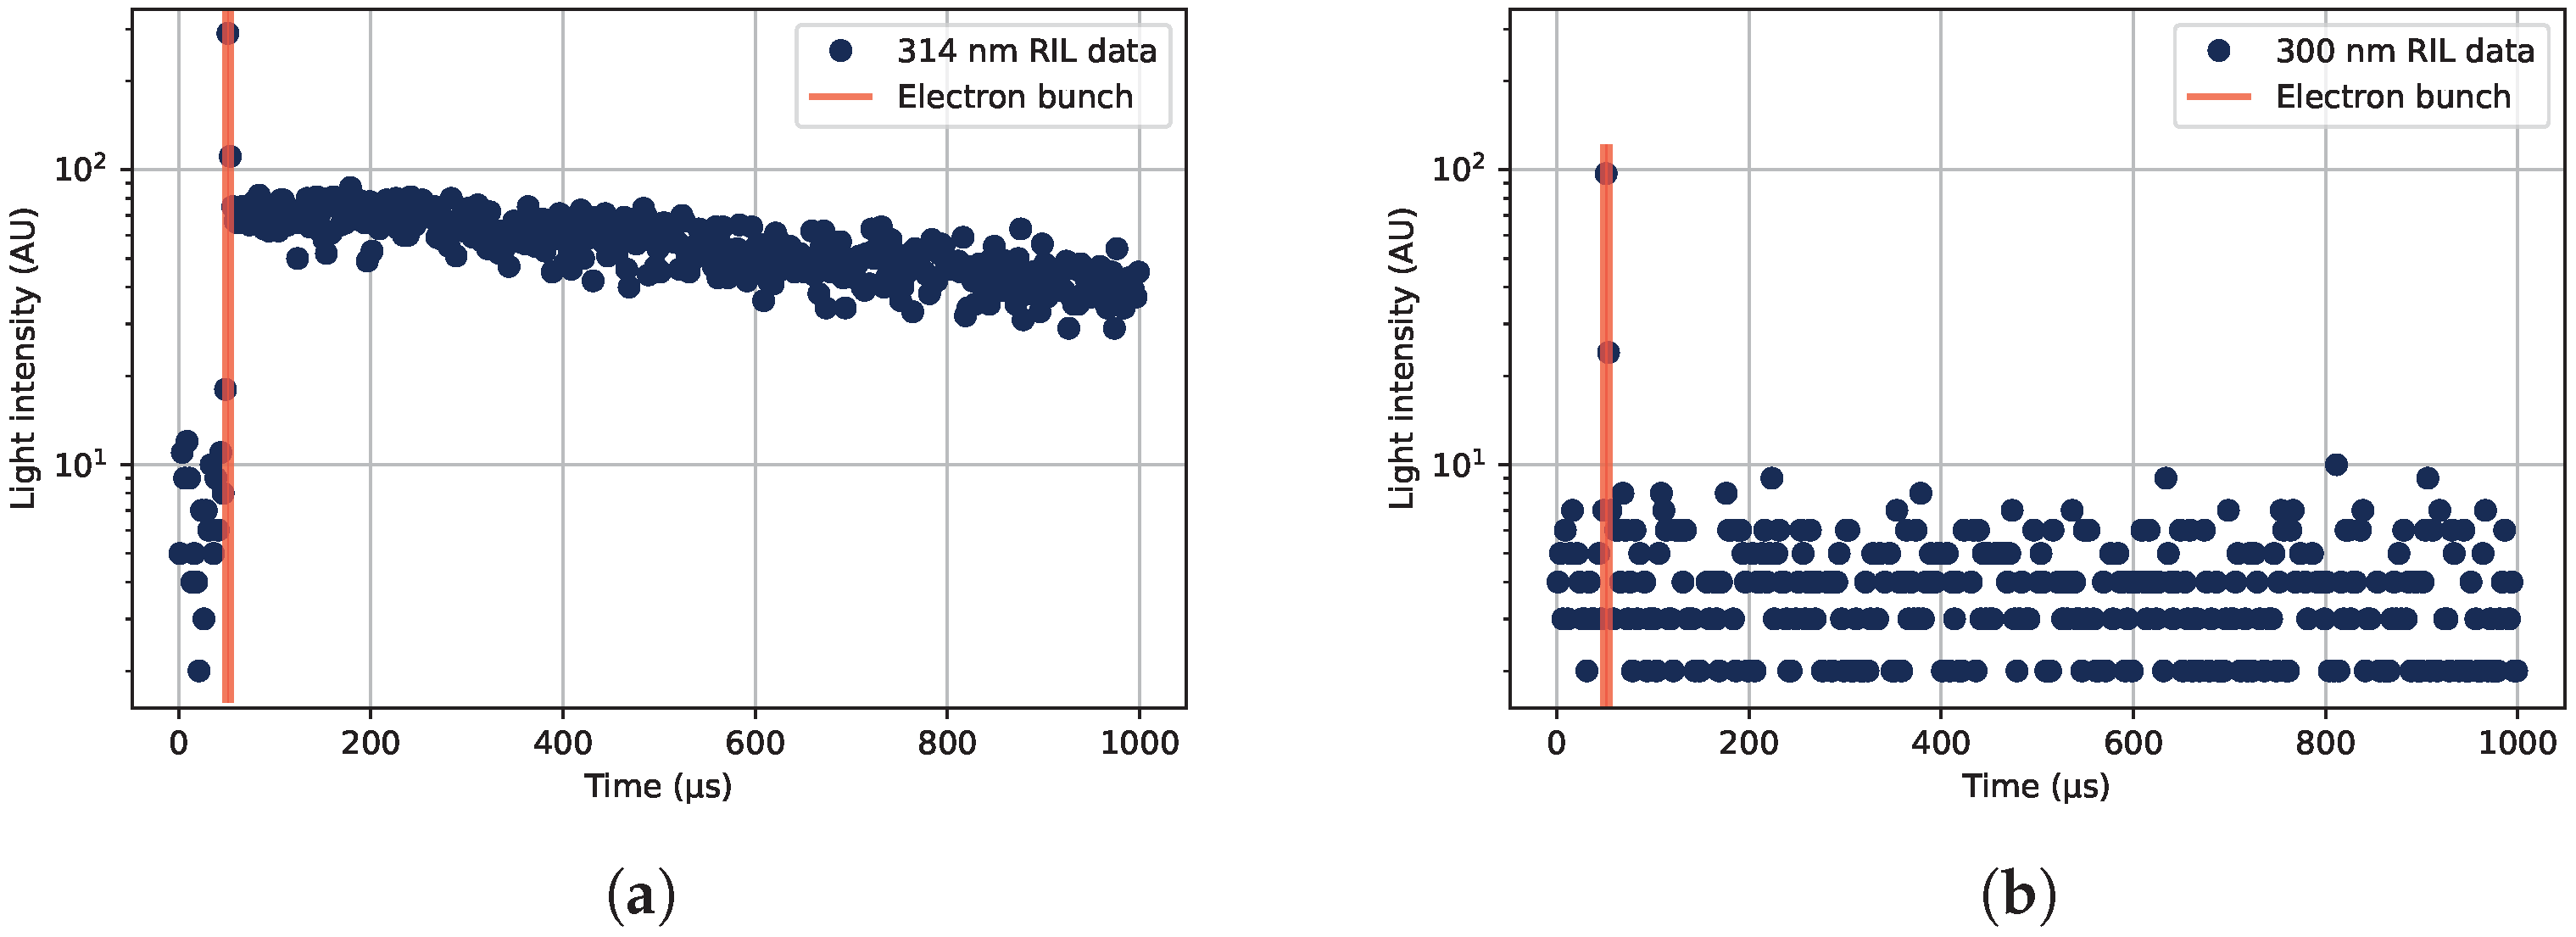
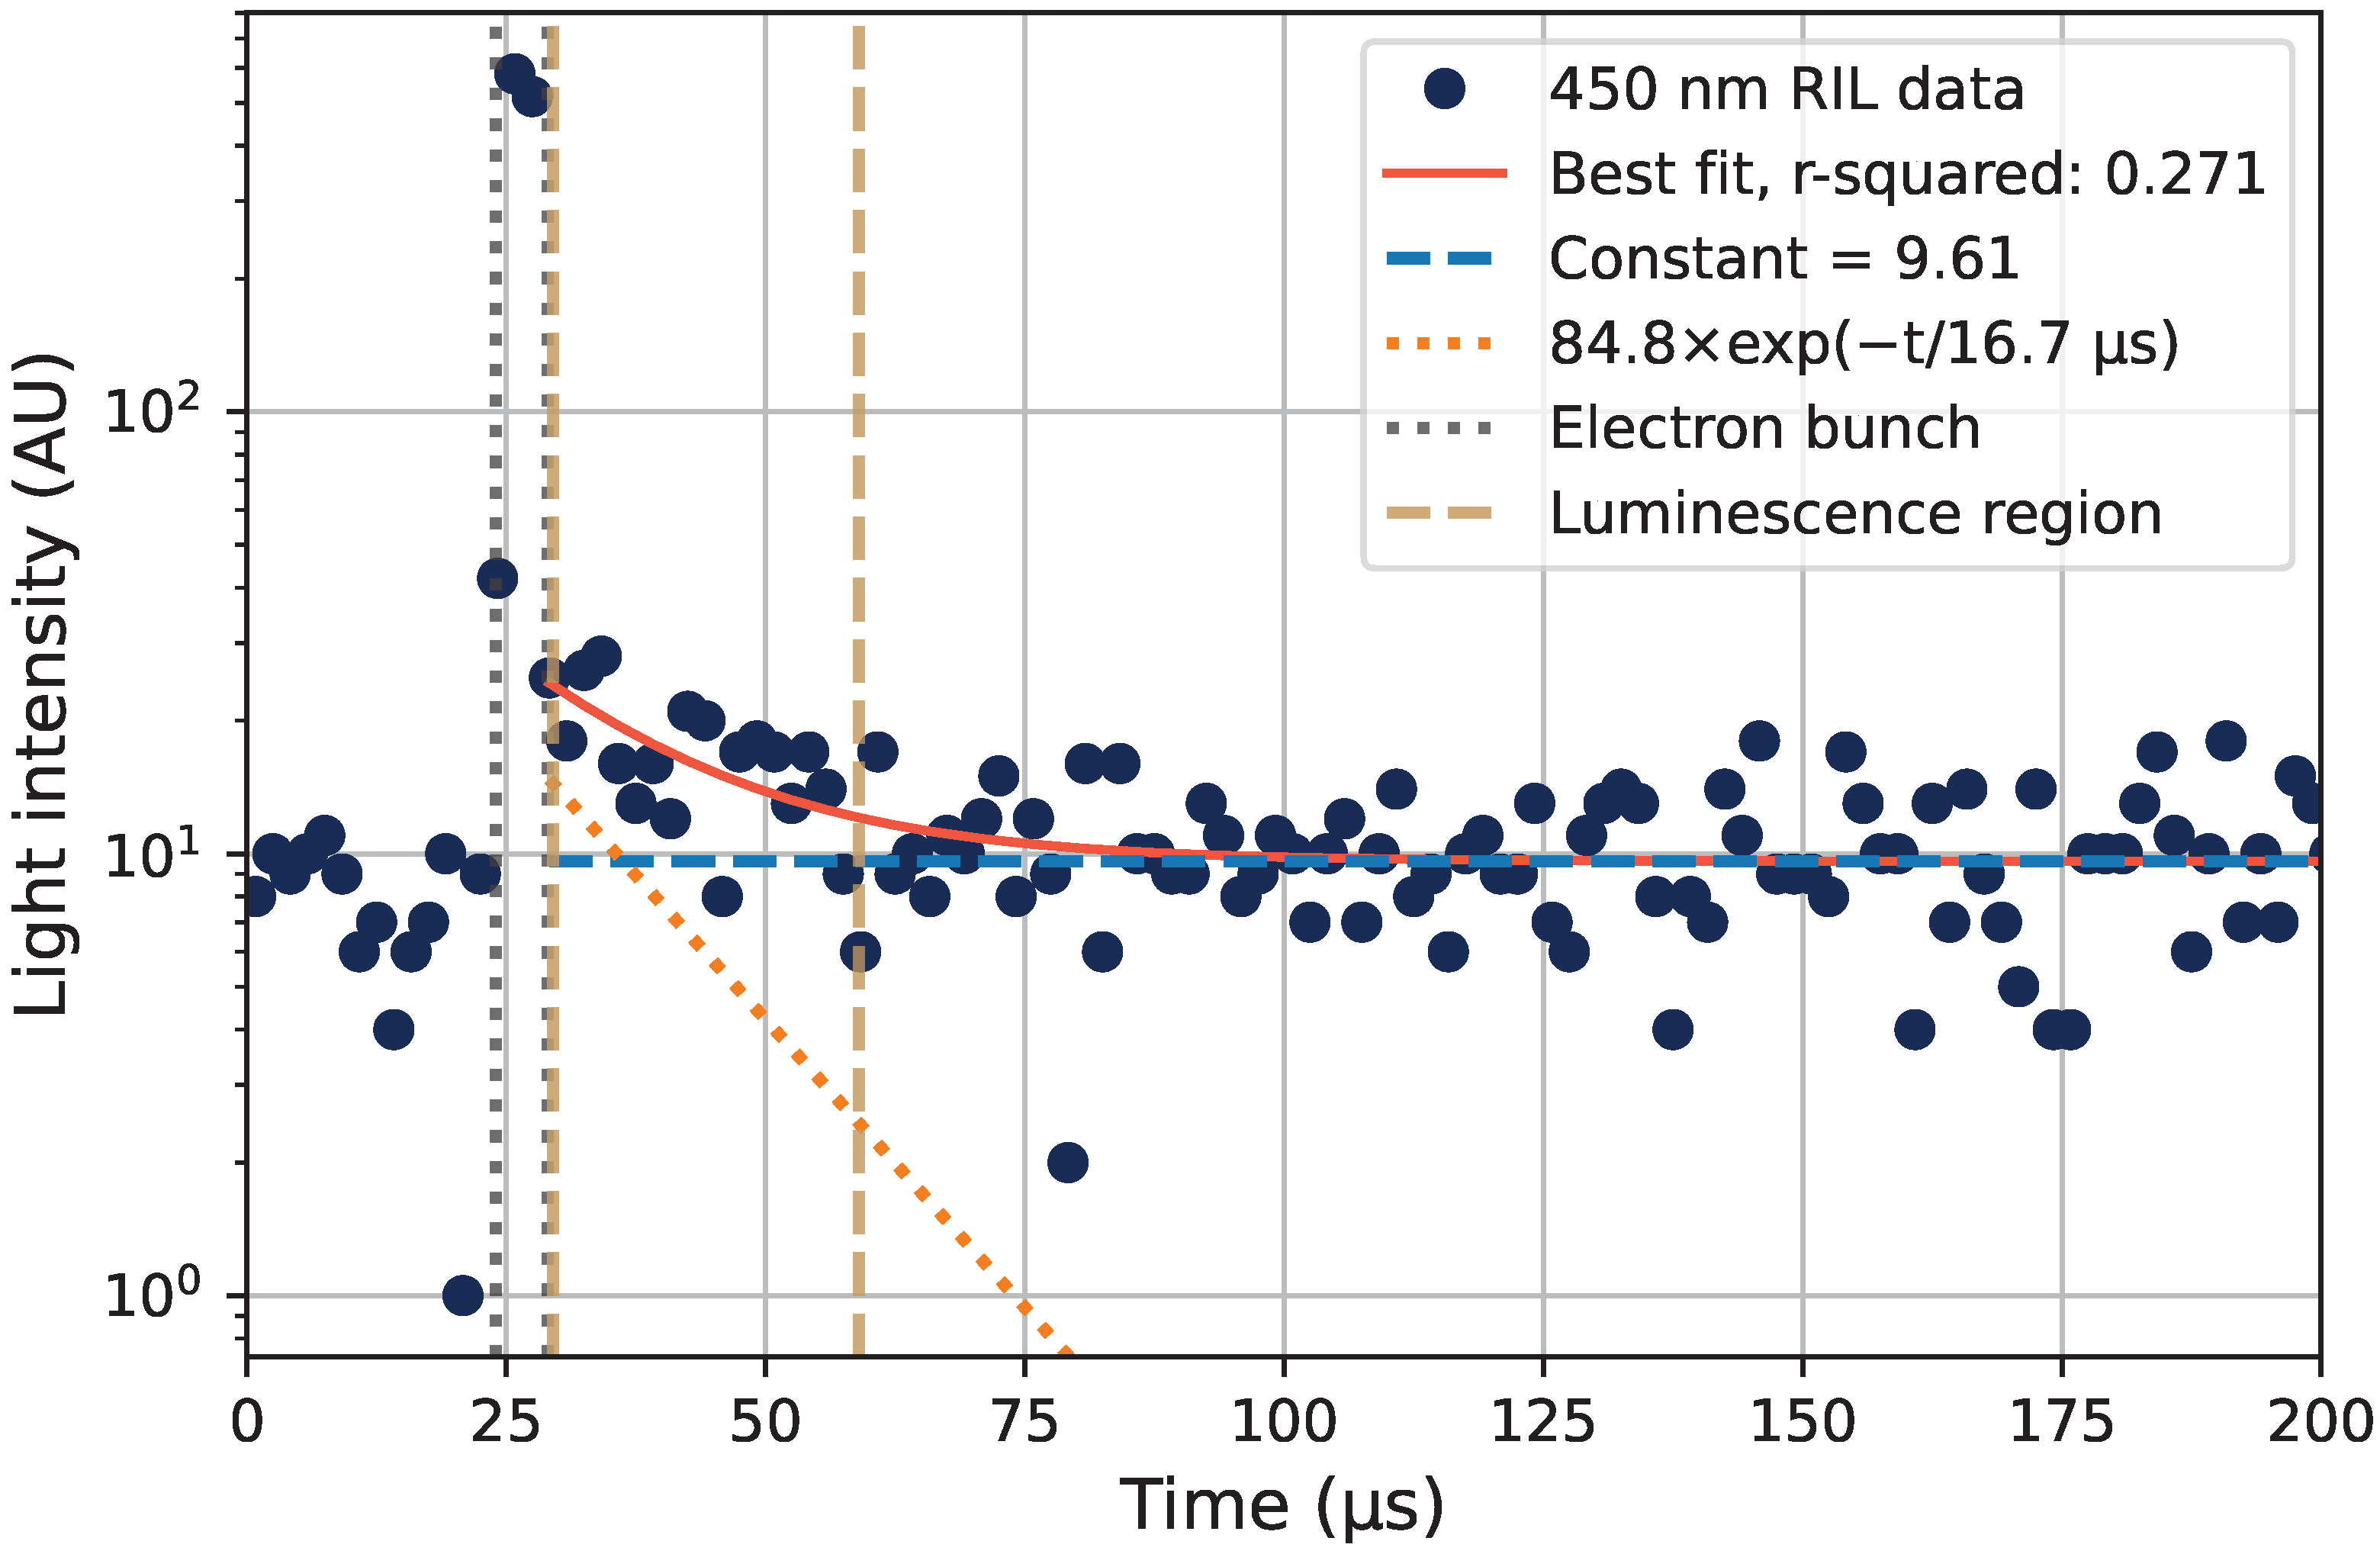
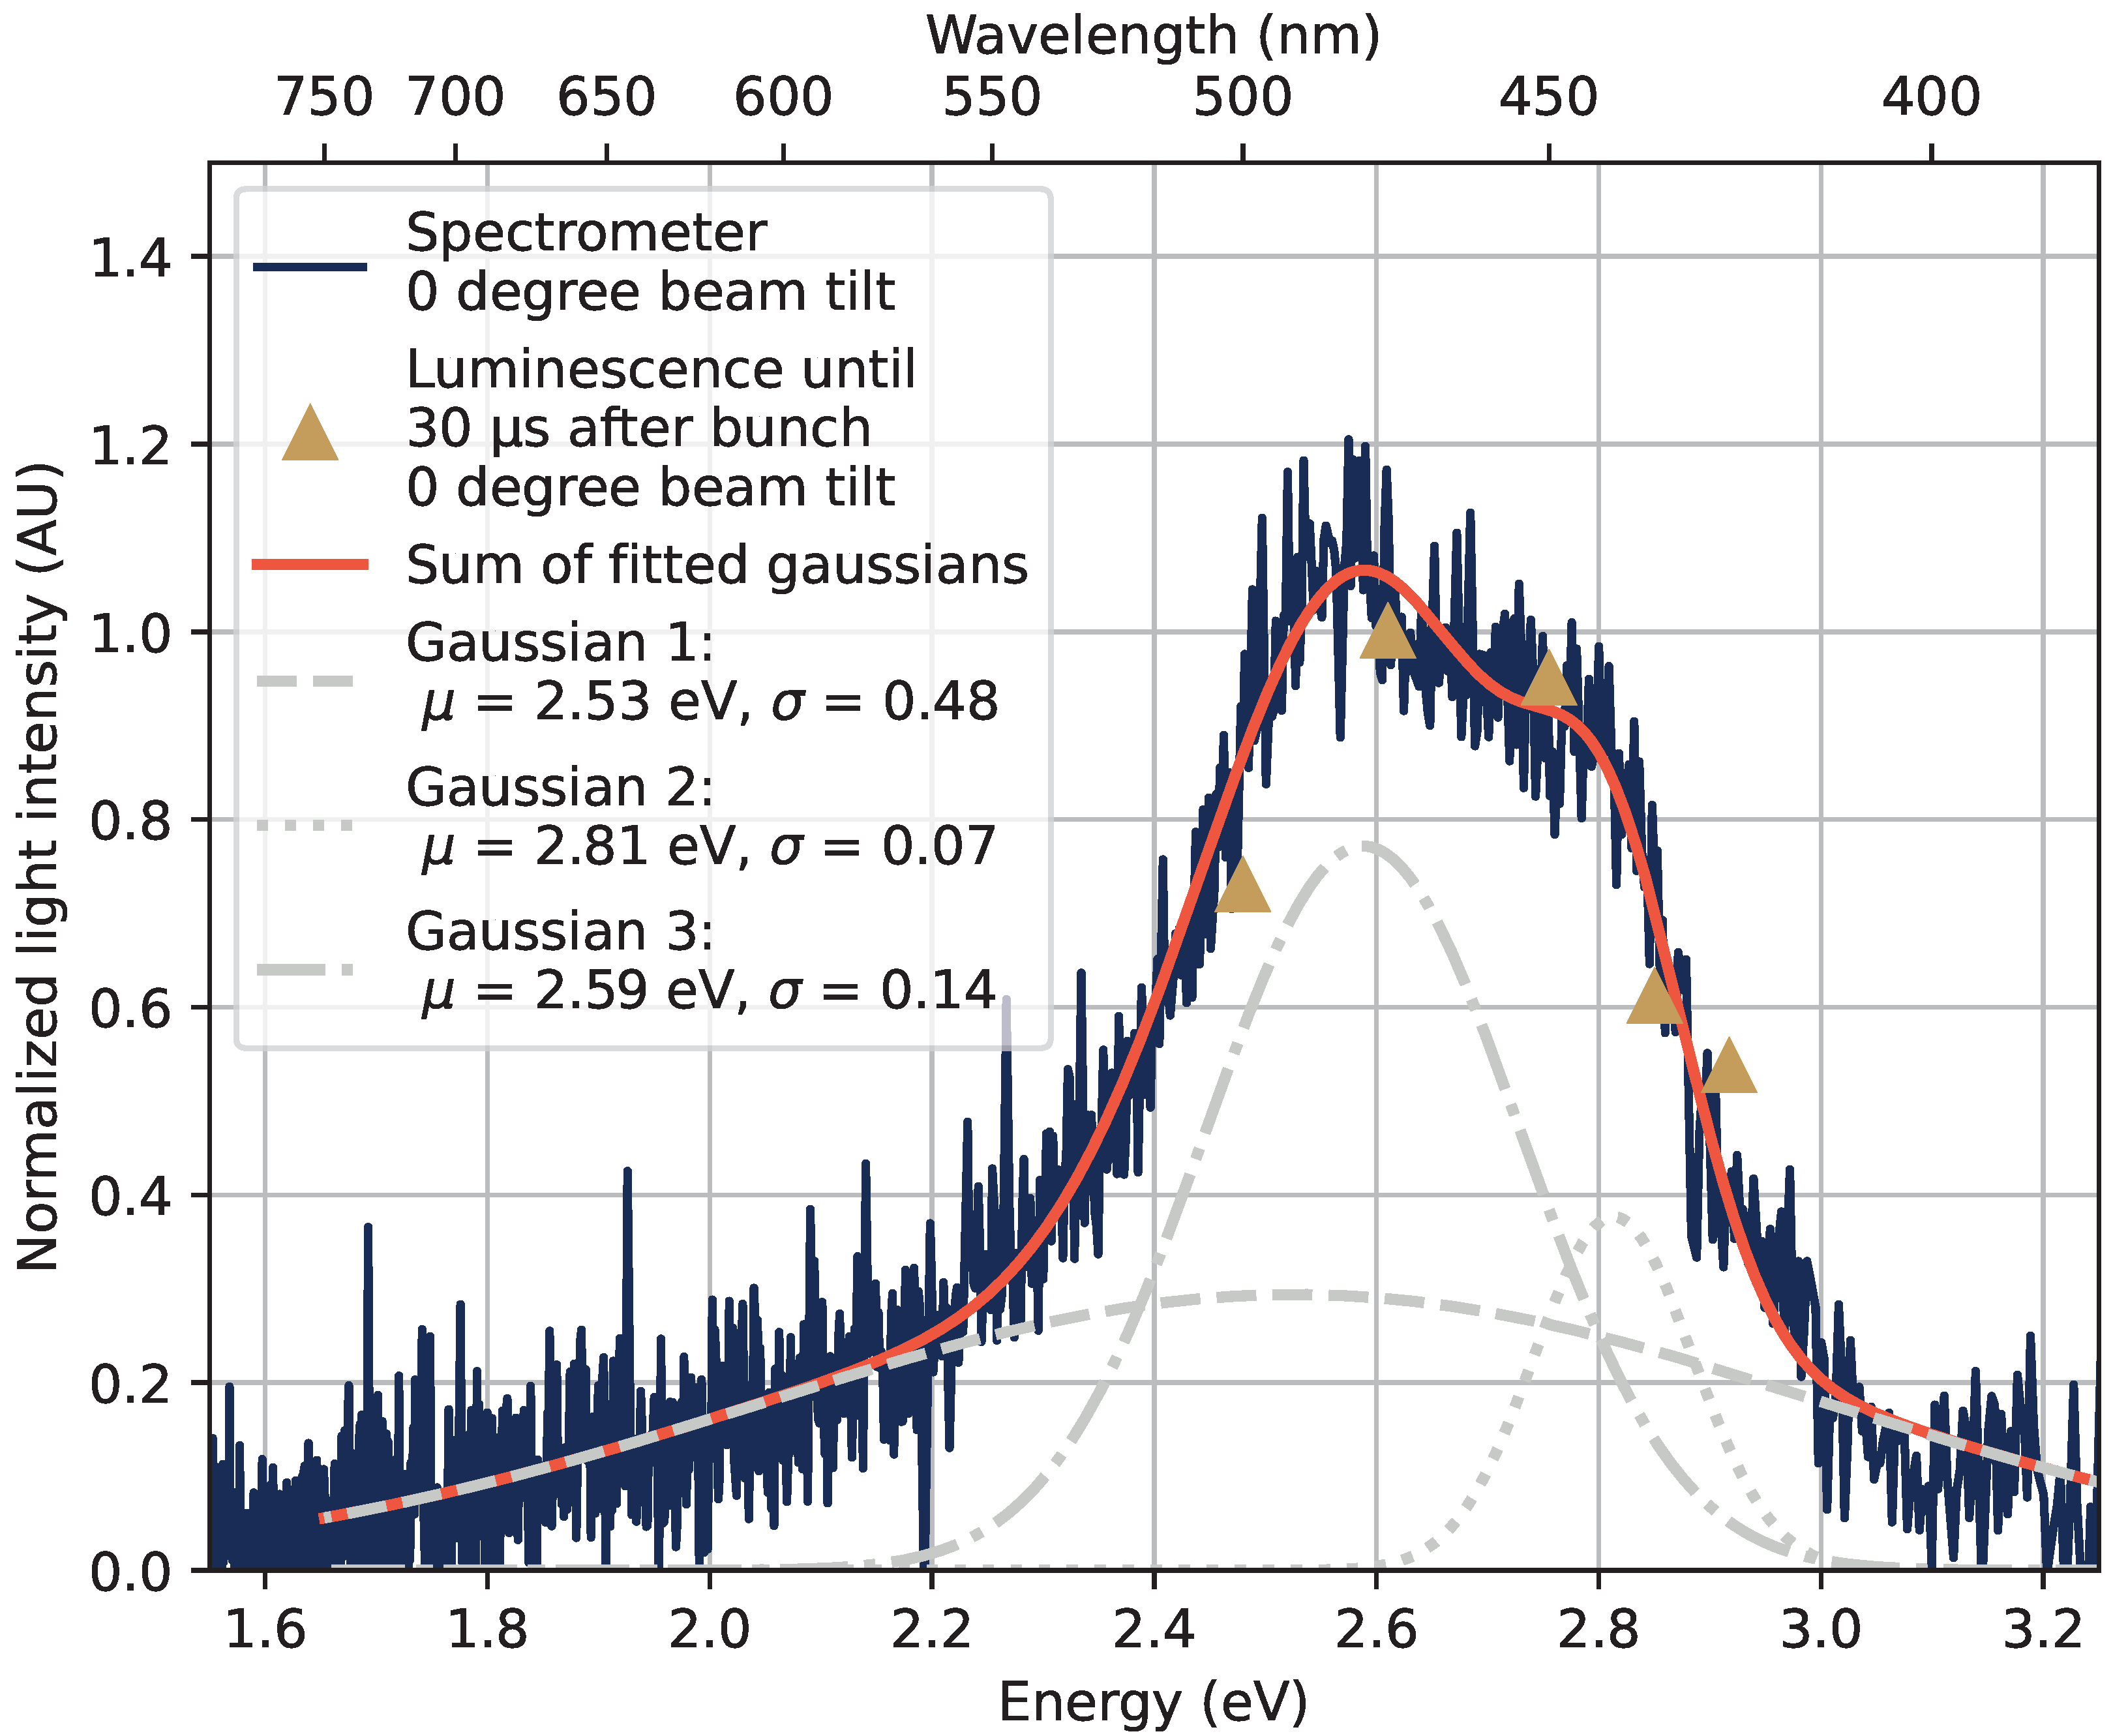
With the monochromator and PMT setup, the decay time of the luminescence at selected wavelengths could be investigated. An emission band between 400 nm and 600 nm, with decay times of approximately 10 μs to 15 μs was observed. These emissions can be ascribed to the luminescent decay of STEX centers caused by the radiation on the sample. These emissions were not clearly observed in earlier tests with the same sample, which suggests an increase in these emissions with an increasing dose history. This should be further studied by obtaining emission spectra from this type of sample at increasing dose levels.
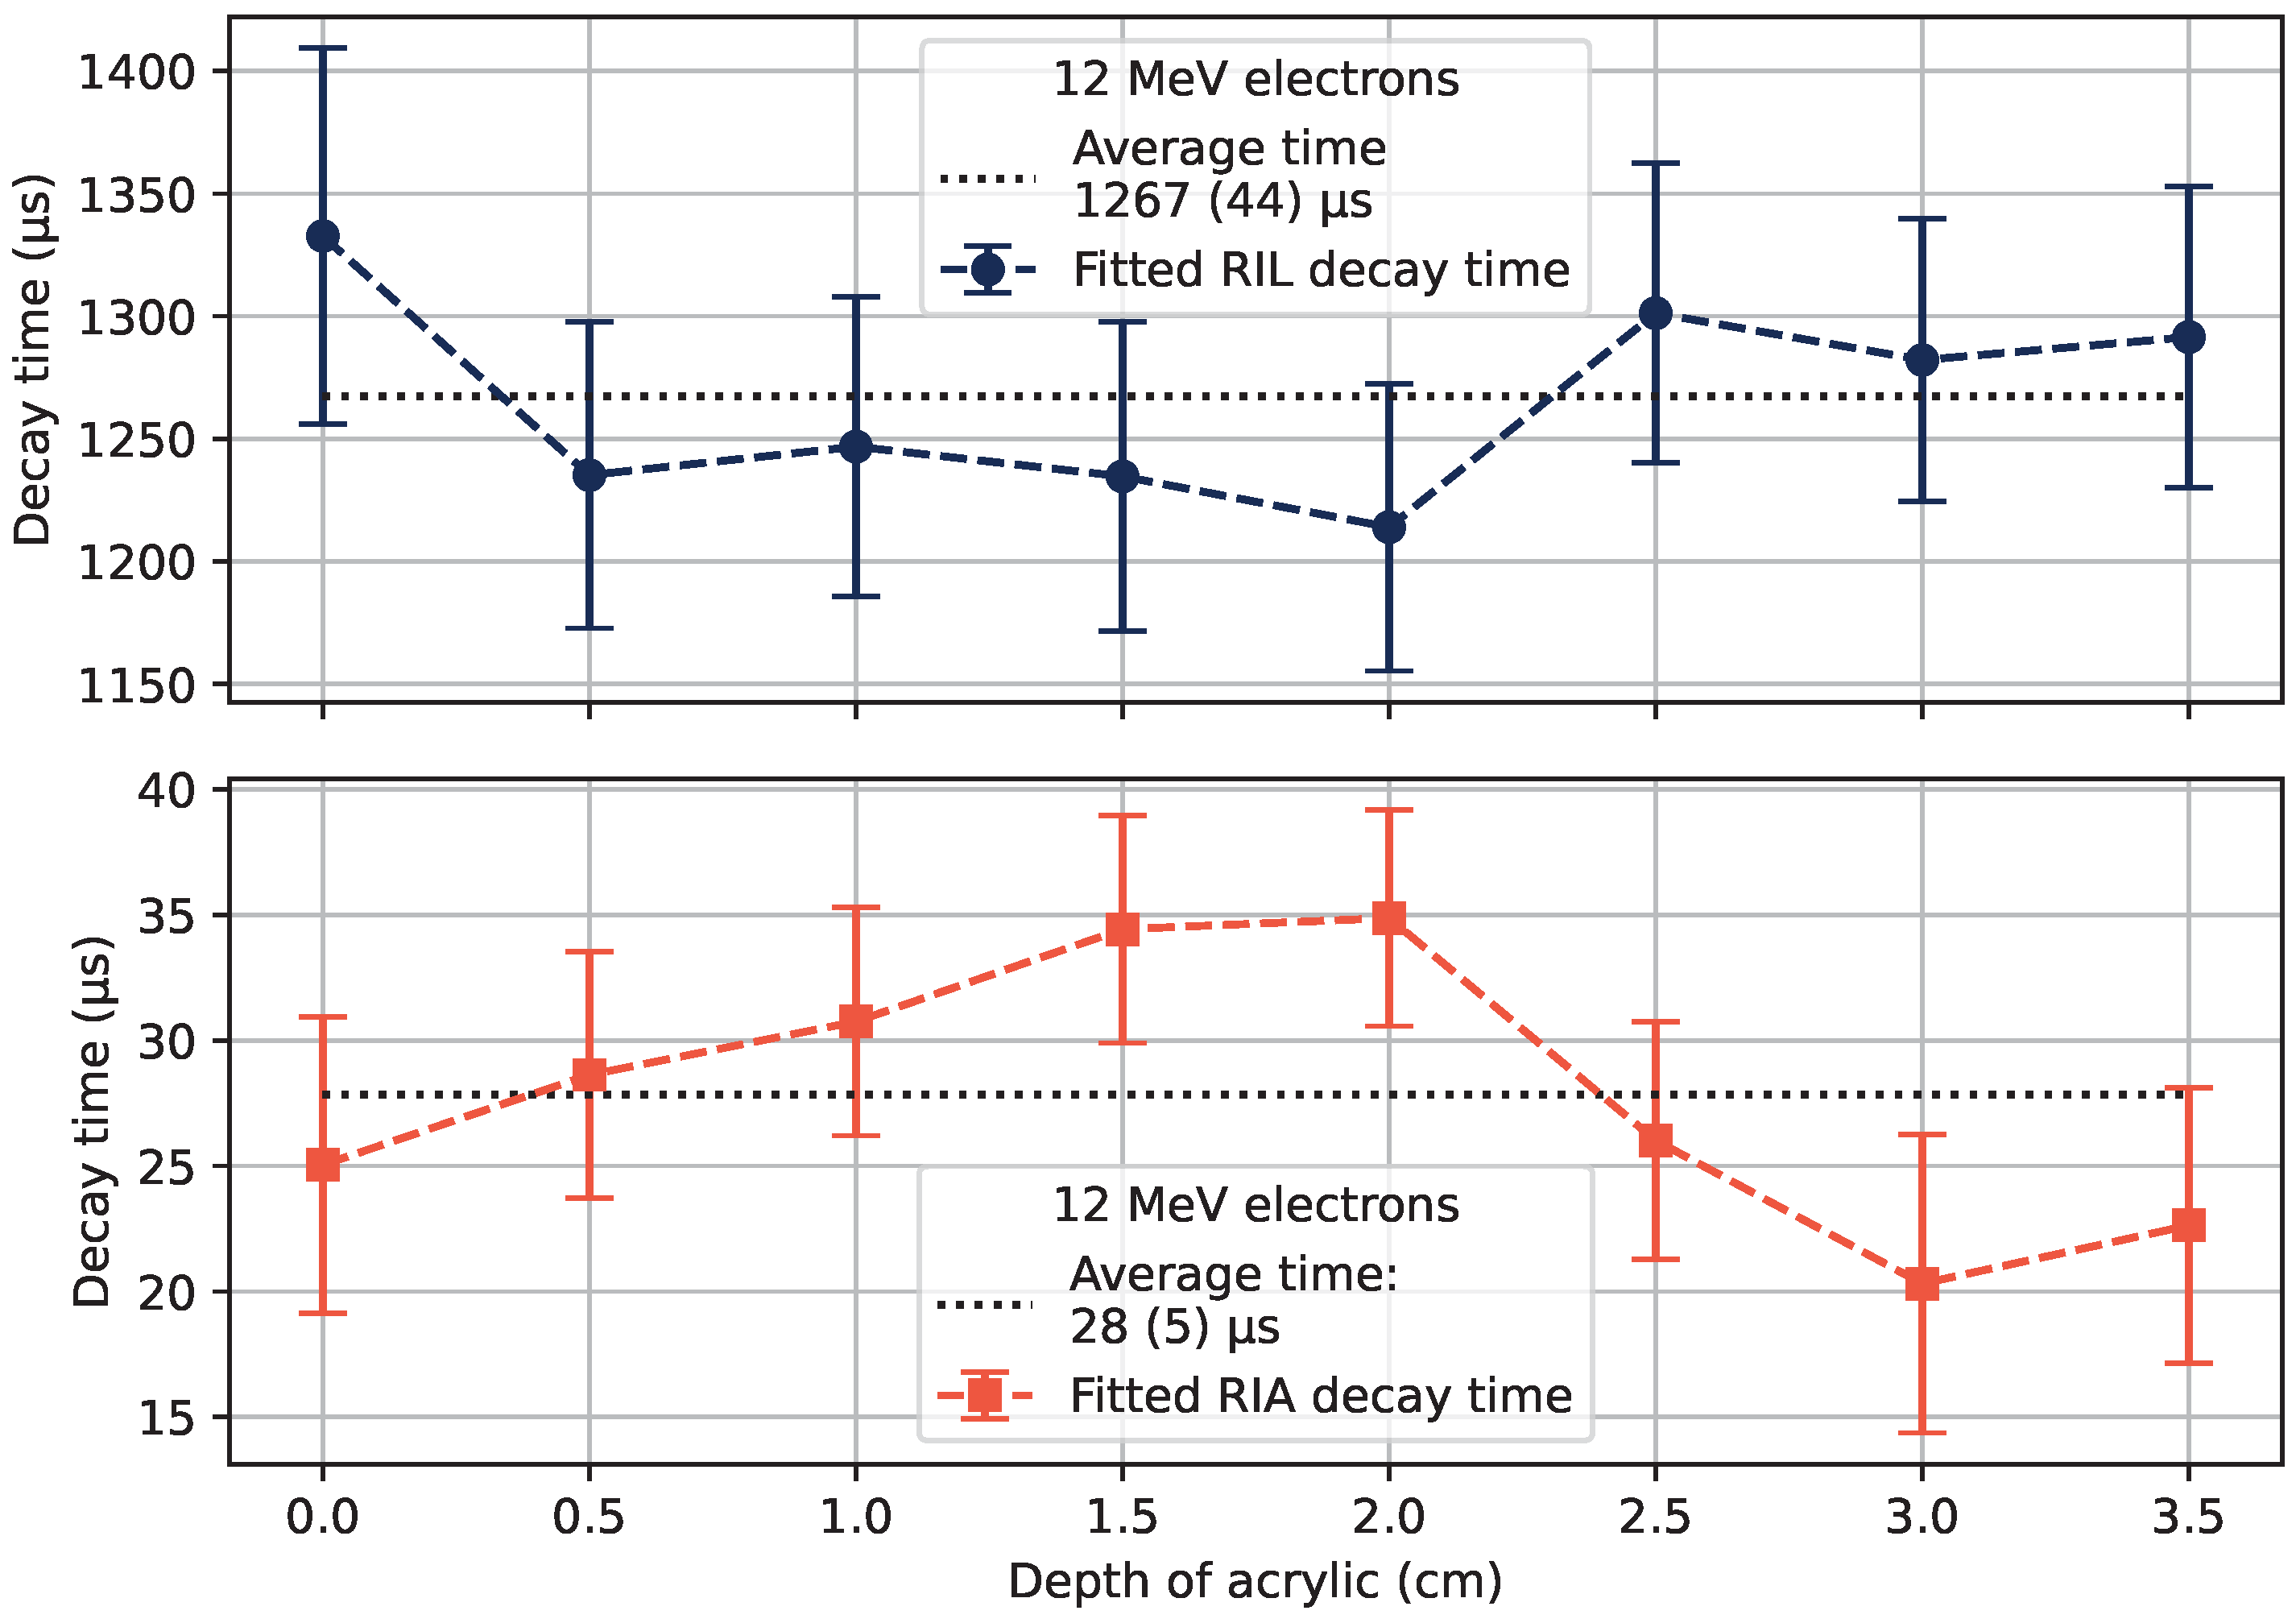
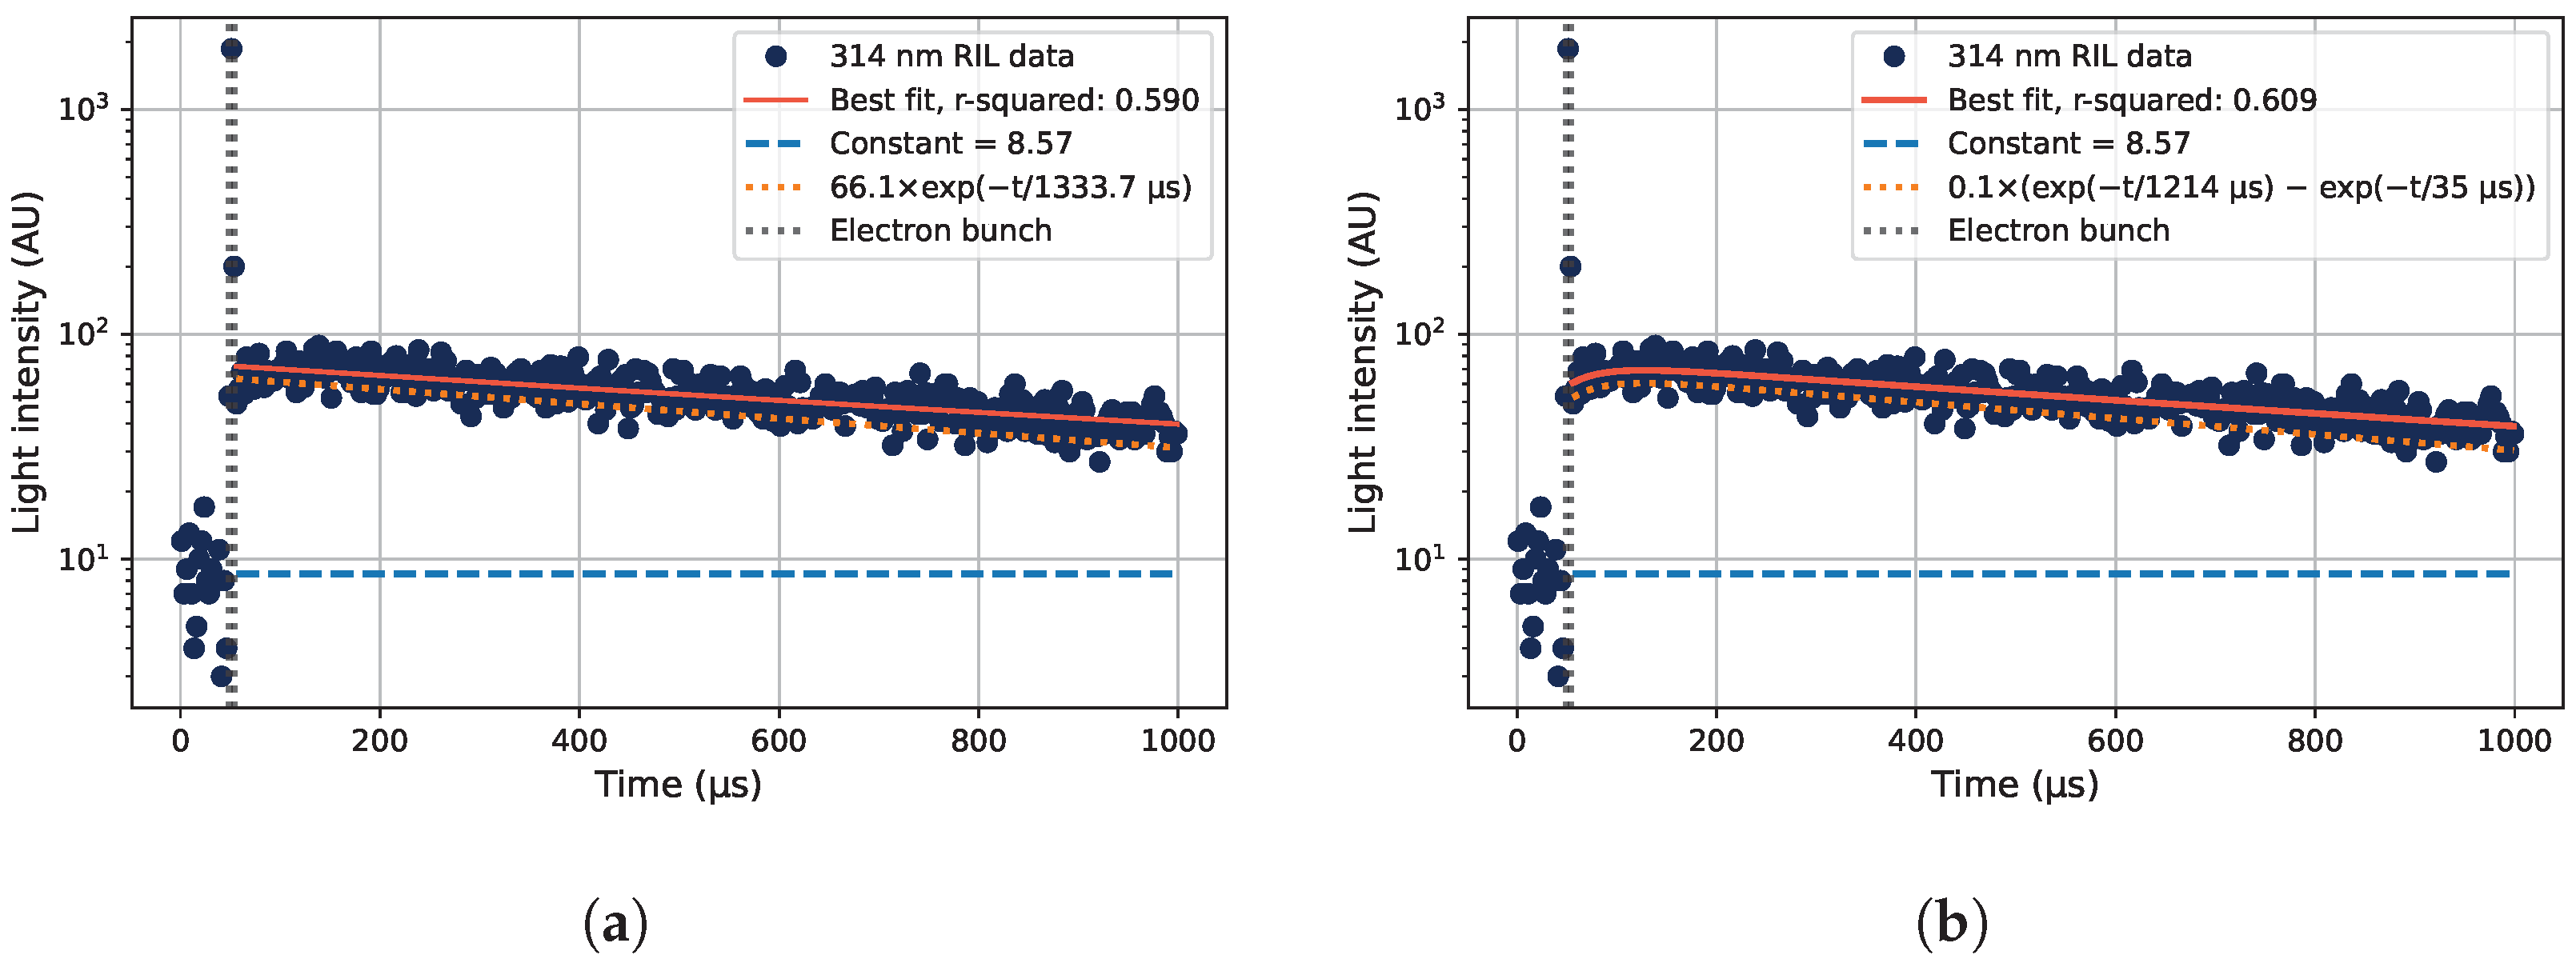
At the main emission line from Gd3+-ions in silica glass at 314 nm, the RIL intensity was found to first increase after the end of the impinging electron pulses. This is likely due to a transient RIA caused by the pulsed electron beam, which has a large instantaneous dose rate of approximately 280 Gy/s, attenuating the RIL signal at times close to the electron bunch. The characteristic decay time of the transient RIA was found to be approximately 20 μs to 30 μs. The transient RIA is ascribed to the STEX absorption centers observed in previous studies at 4.2 eV.
The decay time of the 314 nm RIL was measured to be approximately 1.3 ms for 6, 12, and 20 MeV electrons at various depths of acrylic, with some fluctuations in the exact fitted value. This decay time value is comparable with previously reported values of 1.35 ms in [
1] and 1.80 ms in [
5].
Further research into the formation of STEX centers, and the link to the property of increasing luminescence from the STEX-center decay as a function of radiation history on the sample, is needed. A study of the properties of the emission bands which form the RIE structure from 400 nm to 600 nm is also of interest.


 ,
, 


