Article

LASSO Homotopy-Based Sparse Representation Classification for fNIRS-BCI

1
Department of Mechatronics and Biomedical Engineering, Air University, Islamabad 44000, Pakistan
2
School of Mechanical and Manufacturing Engineering, National University of Science and Technology, Islamabad 44000, Pakistan
3
Department of Mechanical Engineering, University of Saskatchewan, Saskatoon, SK S7N 5A9, Canada
4
Department of Mechatronics Engineering, National University of Sciences and Technology, H-12, Islamabad 44000, Pakistan
5
National Centre of Robotics and Automation (NCRA), Rawalpindi 46000, Pakistan
*
Author to whom correspondence should be addressed.
Sensors 2022, 22(7), 2575; https://doi.org/10.3390/s22072575
Submission received: 28 January 2022 / Revised: 7 March 2022 / Accepted: 23 March 2022 / Published: 28 March 2022
(This article belongs to the Special Issue Signal Processing for Brain–Computer Interfaces)

Abstract

:
Brain-computer interface (BCI) systems based on functional near-infrared spectroscopy (fNIRS) have been used as a way of facilitating communication between the brain and peripheral devices. The BCI provides an option to improve the walking pattern of people with poor walking dysfunction, by applying a rehabilitation process. A state-of-the-art step-wise BCI system includes data acquisition, pre-processing, channel selection, feature extraction, and classification. In fNIRS-based BCI (fNIRS-BCI), channel selection plays a vital role in enhancing the classification accuracy of the BCI problem. In this study, the concentration of blood oxygenation (HbO) in a resting state and in a walking state was used to decode the walking activity and the resting state of the subject, using channel selection by Least Absolute Shrinkage and Selection Operator (LASSO) homotopy-based sparse representation classification. The fNIRS signals of nine subjects were collected from the left hemisphere of the primary motor cortex. The subjects performed the task of walking on a treadmill for 10 s, followed by a 20 s rest. Appropriate filters were applied to the collected signals to remove motion artifacts and physiological noises. LASSO homotopy-based sparse representation was used to select the most significant channels, and then classification was performed to identify walking and resting states. For comparison, the statistical spatial features of mean, peak, variance, and skewness, and their combination, were used for classification. The classification results after channel selection were then compared with the classification based on the extracted features. The classifiers used for both methods were linear discrimination analysis (LDA), support vector machine (SVM), and logistic regression (LR). The study found that LASSO homotopy-based sparse representation classification successfully discriminated between the walking and resting states, with a better average classification accuracy (p < 0.016) of 91.32%. This research provides a step forward in improving the classification accuracy of fNIRS-BCI systems. The proposed methodology may also be used for rehabilitation purposes, such as controlling wheelchairs and prostheses, as well as an active rehabilitation training technique for patients with motor dysfunction.

1. Introduction

Nowadays, many elderly people have motor dysfunction and joint problems because of age factors, stroke, and spinal cord injuries. Due to this, they face many problems when walking, which strongly influences their lives [1]. According to WHO data, mental illnesses and neurological disorders are major sources of morbidity, death, and disability. Mental, neurological, and behavioral diseases have a major impact on the world’s population, impacting more than 450 million individuals. According to the Global Burden of Disease Report, neurological and mental disorders account for four out of the six primary causes of years lived with disability, accounting for 33 percent of the years lived with disability and 13 percent of disability-adjusted life years (DALYs) [2]. People with walking disabilities need to improve their walking patterns or capability by using rehabilitation and assistive devices [3]. The brain-computer interface (BCI) is the best way to accommodate the neuro-rehabilitation process, by providing a communication pathway between the brain and the peripheral devices [4]. The field of perceptible neuroscience scrutinizes itself with calibrating information processing models of the brain with the operational and structural (e.g., hemodynamic, metabolic, and electrical) features of the brain [
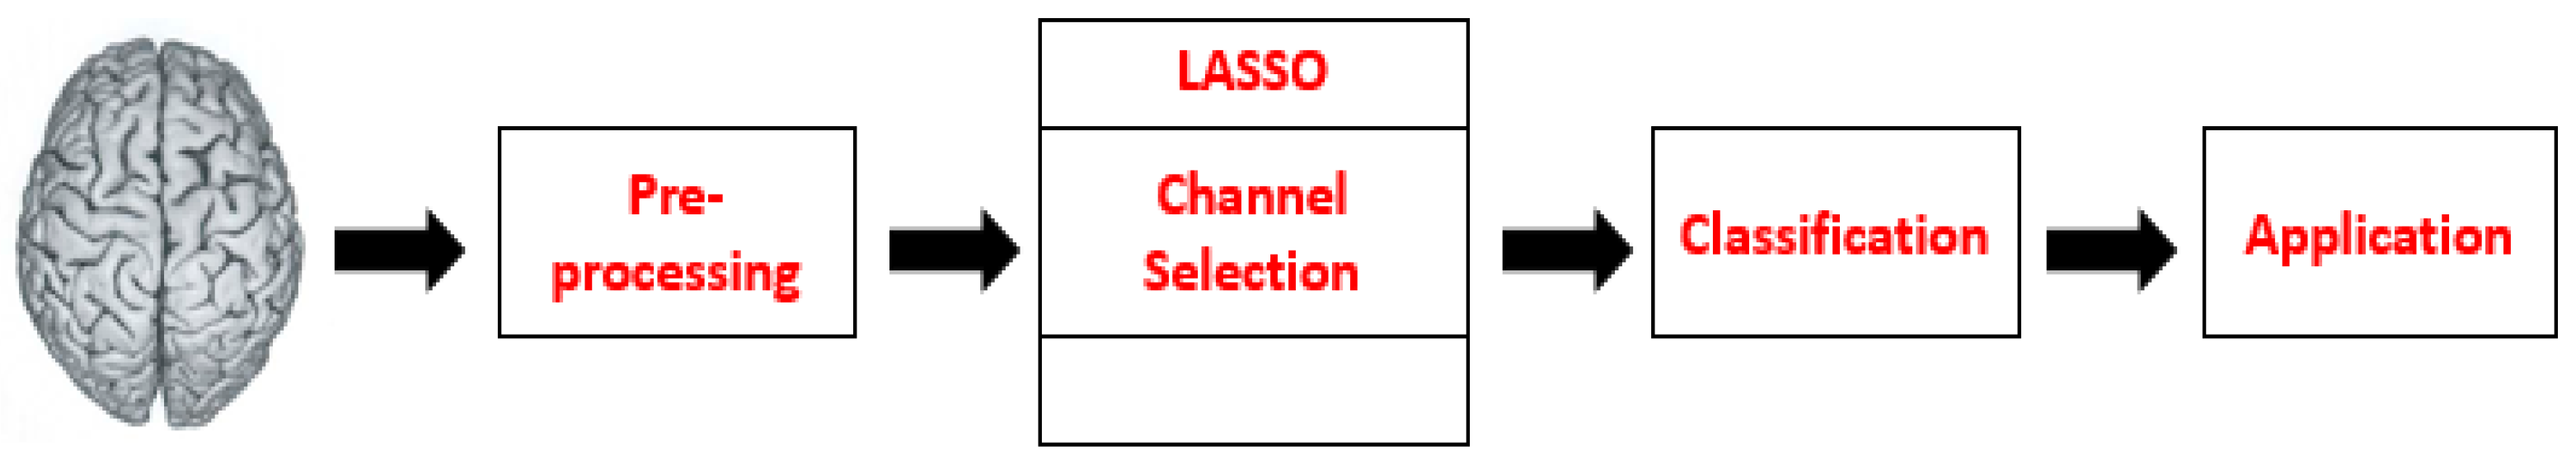
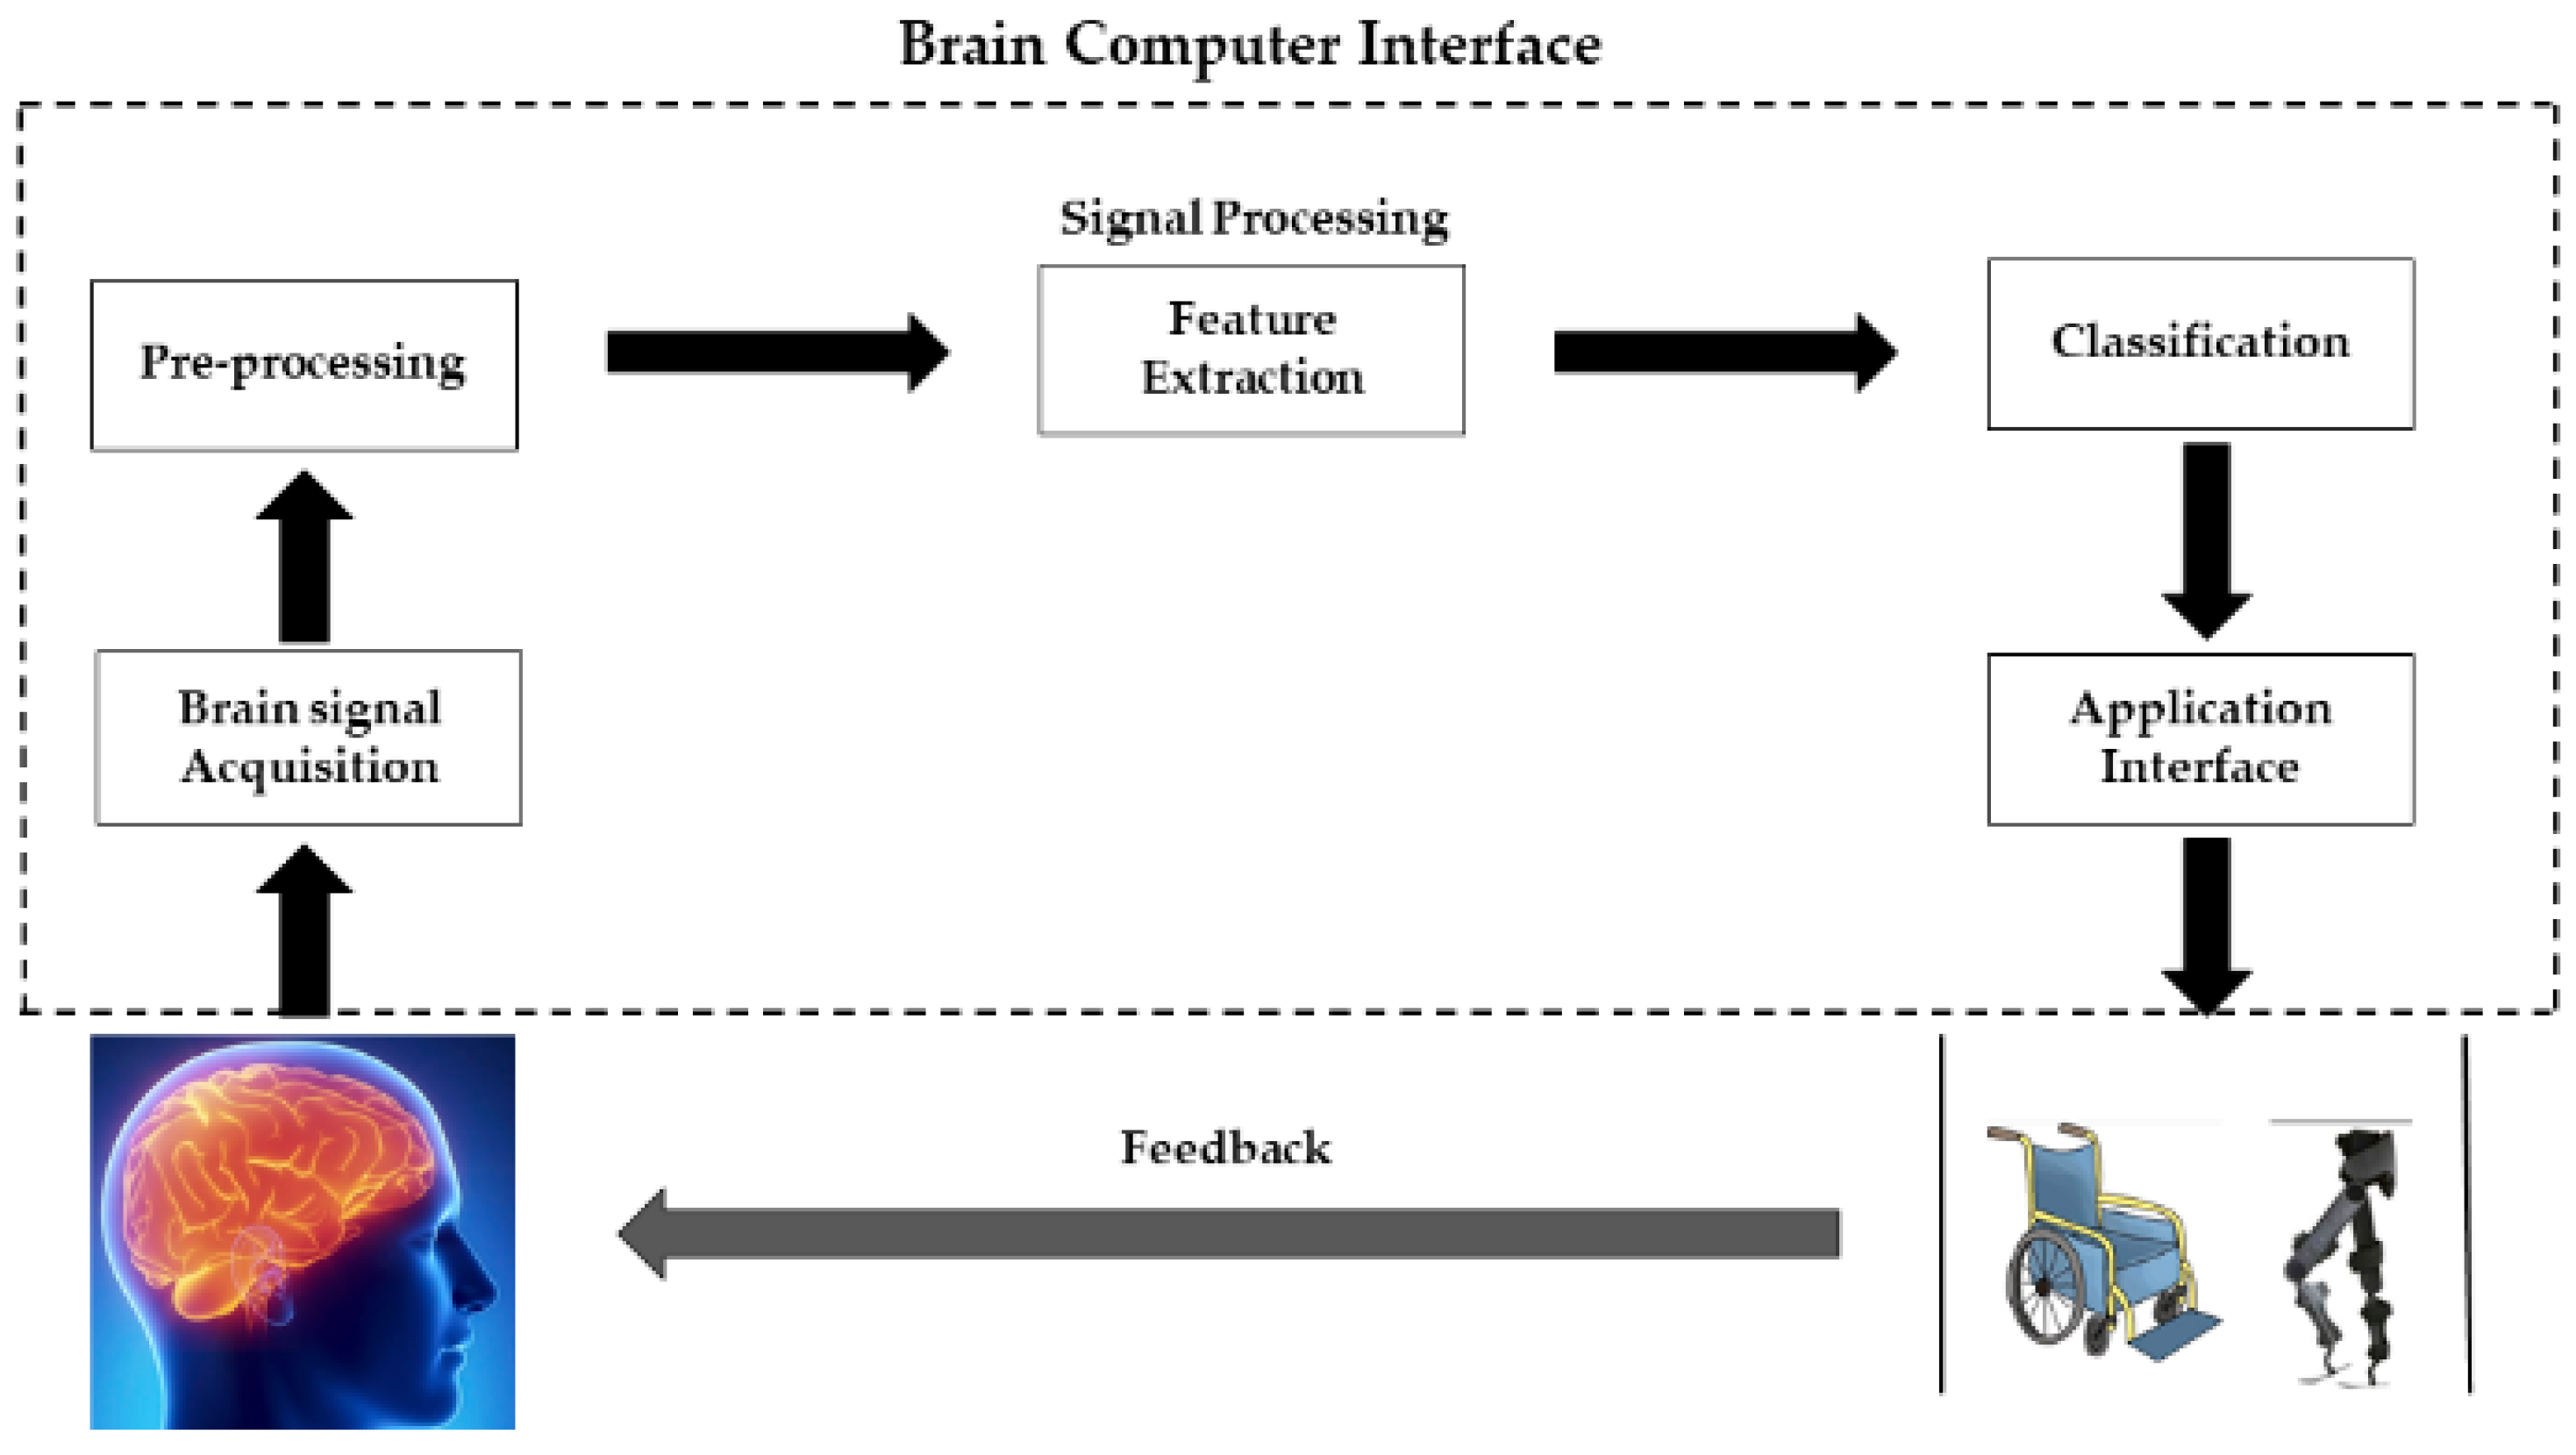
5]. In the last few years, the development of BCI has played an important role in the analysis of brain dysfunction disorders and musculoskeletal gait. A typical BCI system consists of the following five major stages: signal acquisition, pre-processing, feature extraction, classification, and control commands to peripheral devices. In the signal acquisition stage, brain signals are acquired using brain signal acquisition modalities. The acquired signals contain noises such as physiological, instrumentation, and motion artifacts. These errors can be removed with the help of appropriate filters in the pre-processing stage. After obtaining filtered and processed data, some useful features can be extracted. These extracted features contain intrinsic information related to brain activity. In the classification stage, the most suitable classifier is employed for the extracted features, to predict the response to a particular class. Furthermore, the brain activity discriminated by the classifier is used as a command to control the external devices. The general flow diagram of functional near-infrared spectroscopy (fNIRS)-BCI is shown in Figure 1. BCI systems provide the end-user with full control over the channels used to communicate with the brain and external devices, regardless of the level of dependence on the output channel [1].
For improving mild cognitive impairment (MCI), BCI based on functional near-infrared spectroscopy (fNIRS) had a positive result [3]. It has been widely used in the rehabilitation process [6]. fNIRS is utilized to concentrate on the brain areas of interest in eleven sicknesses, including stroke, MCI, traumatic brain injury, and harm recognition [7]. There are several modalities used to acquire brain signals for rehabilitation, such as magnetic field measurement using magnetoencephalography (MEG) [8,9], electroencephalography (EEG), radioactive tracer-based positron emission tomography (PET) [10,11], functional magnetic resonance imaging (fMRI) [12,13], gamma emission-based single-photon emission computed tomography (SPECT) [14,15], and fNIRS. fNIRS is widely used due to its advantages of mobility and ease of use compared to other neuroimaging modalities when researching the brain basis of cognitive inputs during gait [16,17]. The fNIRS modality has been most commonly used over the recent decades, because of its portability and high spatial resolution. fNIRS is operated in wavelengths between 650 and 1000 nm; in this range, the blood oxygenation concentration (HbO) and the blood deoxygenation concentration (HbR) are more clear [7]. Several classifiers and techniques are applied to fNIRS signals [6,18], to improve the accuracy and efficiency of BCI systems, to help disabled and elderly people in their daily life [7,19].
For the classification of different brain activity, fNIRS-based BCI mostly extracted features such as mean, peak, variance, skewness, kurtosis values, etc., from the obtained data [20]. In the literature, studies have been performed using single, multiple or a combination of features to classify two- or multiple-class fNIRS-BCI problems [21]. Support vector machine (SVM) and linear discrimination analysis (LDA) are mainly used to classify walking and resting states, but the classification accuracy is low and needs to be improved [22].
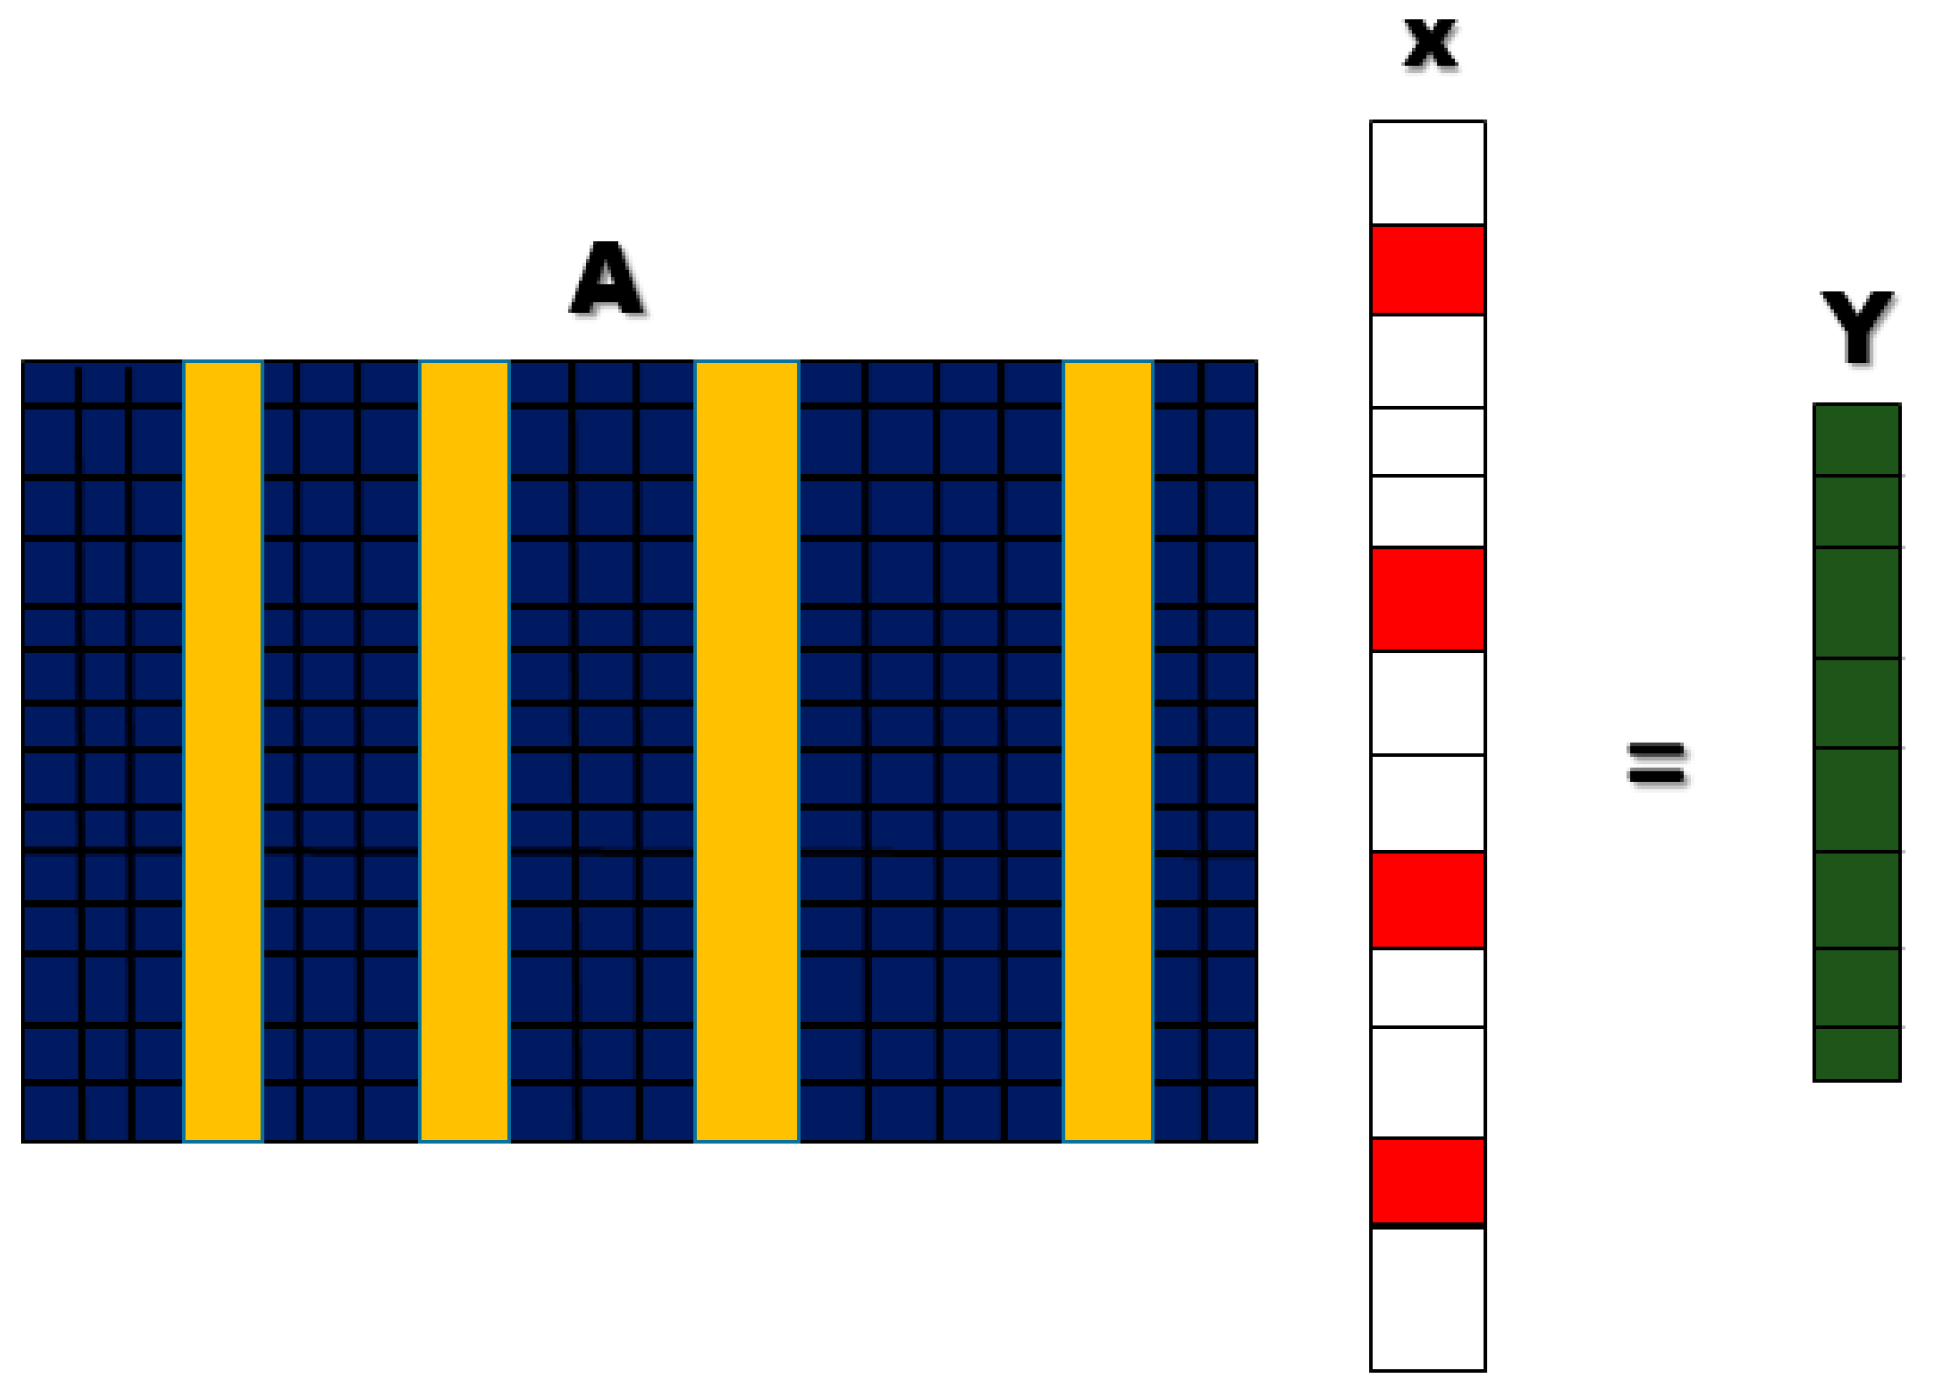
To improve the classification accuracy, it is important to introduce some new methods and technologies in the field of fNIRS-BCI. In this study, a new classification method is discussed, which is sparse representation-based classification (SRC). SRC has been used in the compressed sensing (CS) theory; the core concept of CS is that we can represent a huge amount of data with a few data points [23]. Weighted SRC was applied to EEG-BCI to classify motor imagery, and achieved good classification accuracy results [24]. Sparse representation-based classification was used to translate the motor imagery of a single index finger classification, with an accuracy of 81.32%; the results were used to construct a BCI-enhanced finger rehabilitation system [25]. Optimization features, such as spatial-frequency-temporal, were calculated from the public dataset of EEG, and were used as predictors for SRC. The classification accuracy achieved was higher than on the original basis [26]. Shin et al. classified motor images using SRC and compared the results with SVM. They discovered that SRC had better results than SVM and LDA, in terms of classification accuracy, testing duration, and noise robustness [
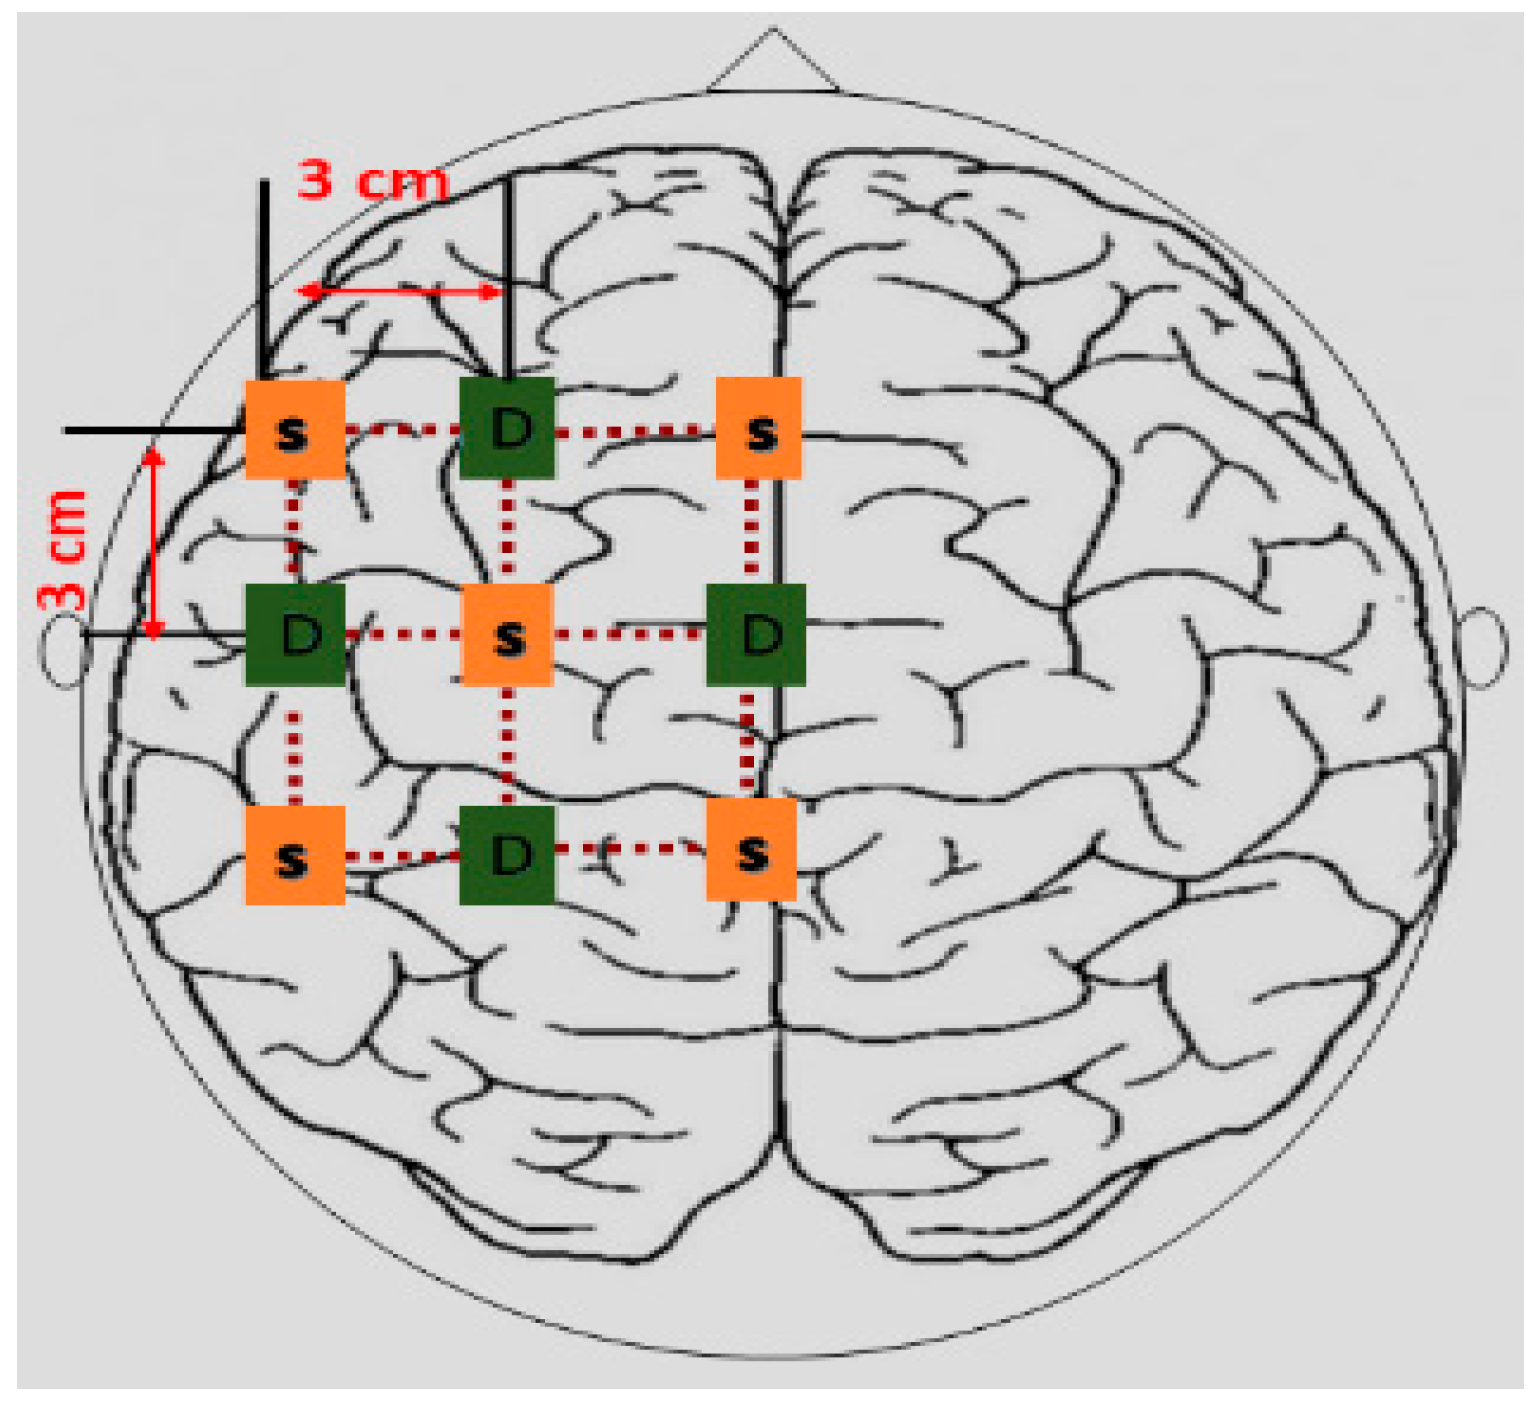
27]. This study includes the use of LASSO homotopy-based SRC for channel selection for the fNIRS-BCI system, to identify walking and resting states, Figure 2.

2. Materials and Methods

2.1. Experimental Design

The raw optical signals from the brain during activity and resting states were collected by dynamic near-infrared optical tomography (DYNOT; NIRx Medical Technologies, New York, NY, USA). For signal acquisition, the sampling frequency was set to 1.81 Hz, with operating wavelengths of 760 and 830 nm. A total of nine healthy male subjects, aged approximately 30 ± 3, were called up for the study. All the subjects were right-handed and had no neurological disorders. The experiments were conducted in accordance with the latest Declaration of Helsinki, and verbal consent from the subjects was collected before experimentation.

2.2. Experimental Paradigm

The subjects were asked to take an initial rest in a quiet room for 30 s before the start of the activity. After the initial rest, subjects were asked to start walking with their right leg on the treadmill for 10 s, followed by a 20 s rest while standing on the treadmill. Ten trials were performed for each subject. For baseline correction, a 30 s rest was given at the end of each experiment. The length of the experiment for each subject was 300 s. The experimental paradigm is shown in Figure 3.

2.3. Experimental Configuration

In accordance with the literature [28], the twelve-channel configuration maintained a minimum distance distribution of 3 cm between the source and the detector. Brain signals from the left hemisphere of the primary motor cortex (M1) were acquired. There were nine optodes, out of which five were sources and four were light detectors. The configuration of the source and detector, with channels, is shown in Figure 4.

2.4. Data Acquisition

Raw optical density signals were converted into oxy and deoxyhemoglobin concentration changes ( Δ C H b O ( t ) and Δ C H b R ( t ) by using the modified Beer–Lambert law (MBLL) shown in Equation (1) [29].
[ Δ C H b O ( t ) Δ C H b R ( t ) ] = [ α H b O ( λ 1 ) α H b R ( λ 1 ) α H b O ( λ 2 ) α H b R ( λ 2 ) ] 1 [ Δ A ( t , λ 1 ) Δ A ( t , λ 2 ) ] d × l ,
where α H b R ( λ 1 , 2 ) and α H b O ( λ 1 , 2 ) are the extinction coefficients of H b O and H b R in μM−1 cm−1, respectively, and C H b R ( t ) and C H b O ( t ) are the concentration changes in H b R and HbO in μM, respectively. Furthermore, l is the source and detector distance, d is the curved path length factor, and A ( t ,   λ 1 )   and   A ( t ,   λ 2 ) are the absorption coefficients at two different instants.

2.5. Signal Processing

In this study, we only used the HbO response of brain activity for further processing. Noises including respiration between 1 and 1.5 Hz, heartbeat 0.5 Hz, and instrumental noise are present in the signals. These noises were removed using high-pass and low-pass filters with cut-off frequencies of 0.01 and 0.5 Hz [7]. The Hemodynamic Response filter and Gaussian filter were applied to the acquired signal for the removal of drift noise, using the NIRS-SPM toolbox [30]. For the motion artifacts, a hemodynamic response filter and discrete cosine transform were applied using the NIRS-SPM toolbox. Figure 5 shows the average trial Δ C H b R ( t ) signals of subject four for channels 9–12.

2.6. Feature Extraction

A prior study explained several combinations of statistical features, with the goal of finding an effective filter for a given cortical region [31]. In this paper, spatial features were extracted from HbO data of all the active channels. The features were calculated for the entire task and rest session. The signal mean was calculated as follows:
mean = 1 N i = 0 N X i ,
where the total number of observations is represented as N, and X i represents the Δ C H b O ( t ) across each observation. The variance was calculated as follows:
V a r = ( X i X ) 2 n 1 ,
where Xi represents the C H b O ( t ) across each observation, X is the mean value of observations, and N is the total number of observations. The Skewness was calculated as follows:
S k e w n e s s = ( X i μ ) 2 N × σ ,
where X i is each observation, μ is the mean of each observation, σ is the standard deviation of data, and N is the total number of observations. The peak values were calculated using the max function in MATLAB.

2.7. Channel Selection

Selecting channels of interest (COI) or a region of interest (ROI) in BCI can save processing time, reduce dimensionality, improve performance, and provide adequate brain region identification with low noise signals. In the literature, the z-score approach, which uses cross-correlation and z-scores for ROI/COI selection, was utilized to improve the performance of the fNIRS-BCI system [21]. The hemodynamic responses with positive t-values were selected by using the t-value method [32]. For pain-related cortical activations, the cross-correlation approach was employed to identify potentially dominating channels in both hemispheres. The response delay was calculated after a visual check, to identify probable dominating channels. The active channels that were next to each other were chosen [33]. In this paper, the LASSO homotopy-based sparse representation method is used for channel selection.

2.7.1. Sparse Representation Classification

The basic idea of the SRC method is to recognize the true class of new signals by learning the sparsest representation (fewest significant coefficients) of the test signals, in terms of training signals [34]. A principle that a signal can be approximated by, using a linear combination of dictionary atoms, is formulated as follows [35]:
( b A ,   x ,   k ) = x 1 a 1 + + x k a k + ε ,
where the dictionary is represented as A = [a1, · · ·, ak], dictionary atom is represented as ai, x is a sparse coefficient vector, and ε is an error term. A, x, and k are the model parameters. In general, the SRC algorithm produces a dictionary before solving the optimization problem, reconstructing, and calculating the residual.
For a certain category, when the residual is very small and the other categories are very large, the unknown category of the object belongs to that category [3]. The simplest sparse representation classification model is shown in Figure 6.

2.7.2. LASSO Homotopy

The notion of homotopy comes from topology, and the homotopy technique is mostly used to solve problems involving nonlinear systems of equations. The homotopy approach was first developed to tackle the l1 penalty least squares problem [36]. Least absolute selection and shrinkage operator are representative approaches that use the homotopy-based strategy to tackle the sparse representation problem with l1-norm regularization (LASSO) [36]. Regularization is a crucial concept for avoiding data overfitting, especially when the learned and test data differ significantly. Regularization is implemented by adding a penalty term to the best fit produced from the trained data, in order to attain lower variance with the tested data, as well as by compressing the coefficients of the least important predictor or channel variable over the output variable. L1 regularization forces the weights of uninformative features and channels to be zero, by subtracting a small amount from the weight at each iteration, and, thus, making the weight of each channel or predictor equal to zero. LASSO homotopy starts optimization at a large value of λ parameter along the solution path and terminates at a point of λ, which is approximately zero, giving an optimal solution. The mathematical model of LASSO homotopy is represented as follows:
1 2 N ( y X β ) ( y X β ) + λ   j = 1 P | β j | ,
In the first term, y is the prediction value or test sample, X is the feature vector or trained sample, and β is the vector of coefficients (weights on the basis of significance). The first term in the equation is the residual sum of squares (error term) and the second is product of λ× sum of the absolute values of the magnitude of coefficients (penalty term). λ denotes the amount of shrinkage. λ = 0 implies that all the features are considered and is equivalent to the linear regression, where the only residual square is considered to build a predictive model. λ = ∞ implies that no features are considered (i.e., as λ approaches infinity, it eliminates more and more features and channels).

2.8. Classification Algorithms

K-fold cross-validation is used to estimate classification performance. To ensure data separation for training and testing of classifiers for each channel selection method and activity utilized, the dataset was separated into training and testing sets, and the value of k was set to five-fold cross-validation.
In MATLAB®, the classification learner app was used for classification and validation of data. Several classifiers were selected and employed on the data, on the basis of prediction speed and training time. Following the literature [22], the following classifiers were used: linear discrimination analysis (LDA), logistic regression (LR), and support vector machine (SVM). The following settings were made during classification: covariance structure for LDA was set to diagonal covariance, and the kernel function for SVM was the Gaussian function.

3. Results

In this study, the LASSO homotopy method was employed for the channel selection of H b O signals with significant information; Table 1 shows the channels selected for each subject. From Table 1, we observe that the maximum and minimum channels selected by the LASSO homotopy method are nine and two for distinct subjects, respectively. The classification was performed using LDA, LR, and SVM on the data of the selected channels. The subject-wise average classification accuracies of all the classifiers used are given in Table 2. For comparison purpose, classification accuracies were calculated using conventional statistical features. Table 3 and Table 4 show the subject-wise classification accuracies of three- and four-feature combinations of statistical features. A comparison of the overall average classification accuracies of all the classifiers after channel selection using LASSO homotopy, and without channel selection, is shown in Table 5. In Table 6, the results of the t-test are shown [37]. A comparative bar graph is shown in Figure 7, for the average classification accuracies of all the classifiers.

4. Discussion

In the literature, recent studies have focused on enhancing the classification accuracies of fNIRS-BCI systems using the optimal classification technique [22], general linear model [38], vector-based phase analysis [38,39,40,41], optimal feature selection [31,38], optimal feature combination [42], t-value method [43,44], cross-correlation [45], and dominant channel selection [46]. An accurate and reliable fNIRS-BCI performance may lead to producing applications in neuro-robotics, rehabilitation, clinical BCI, for monitoring and analysis, and neuro-ergonomics.
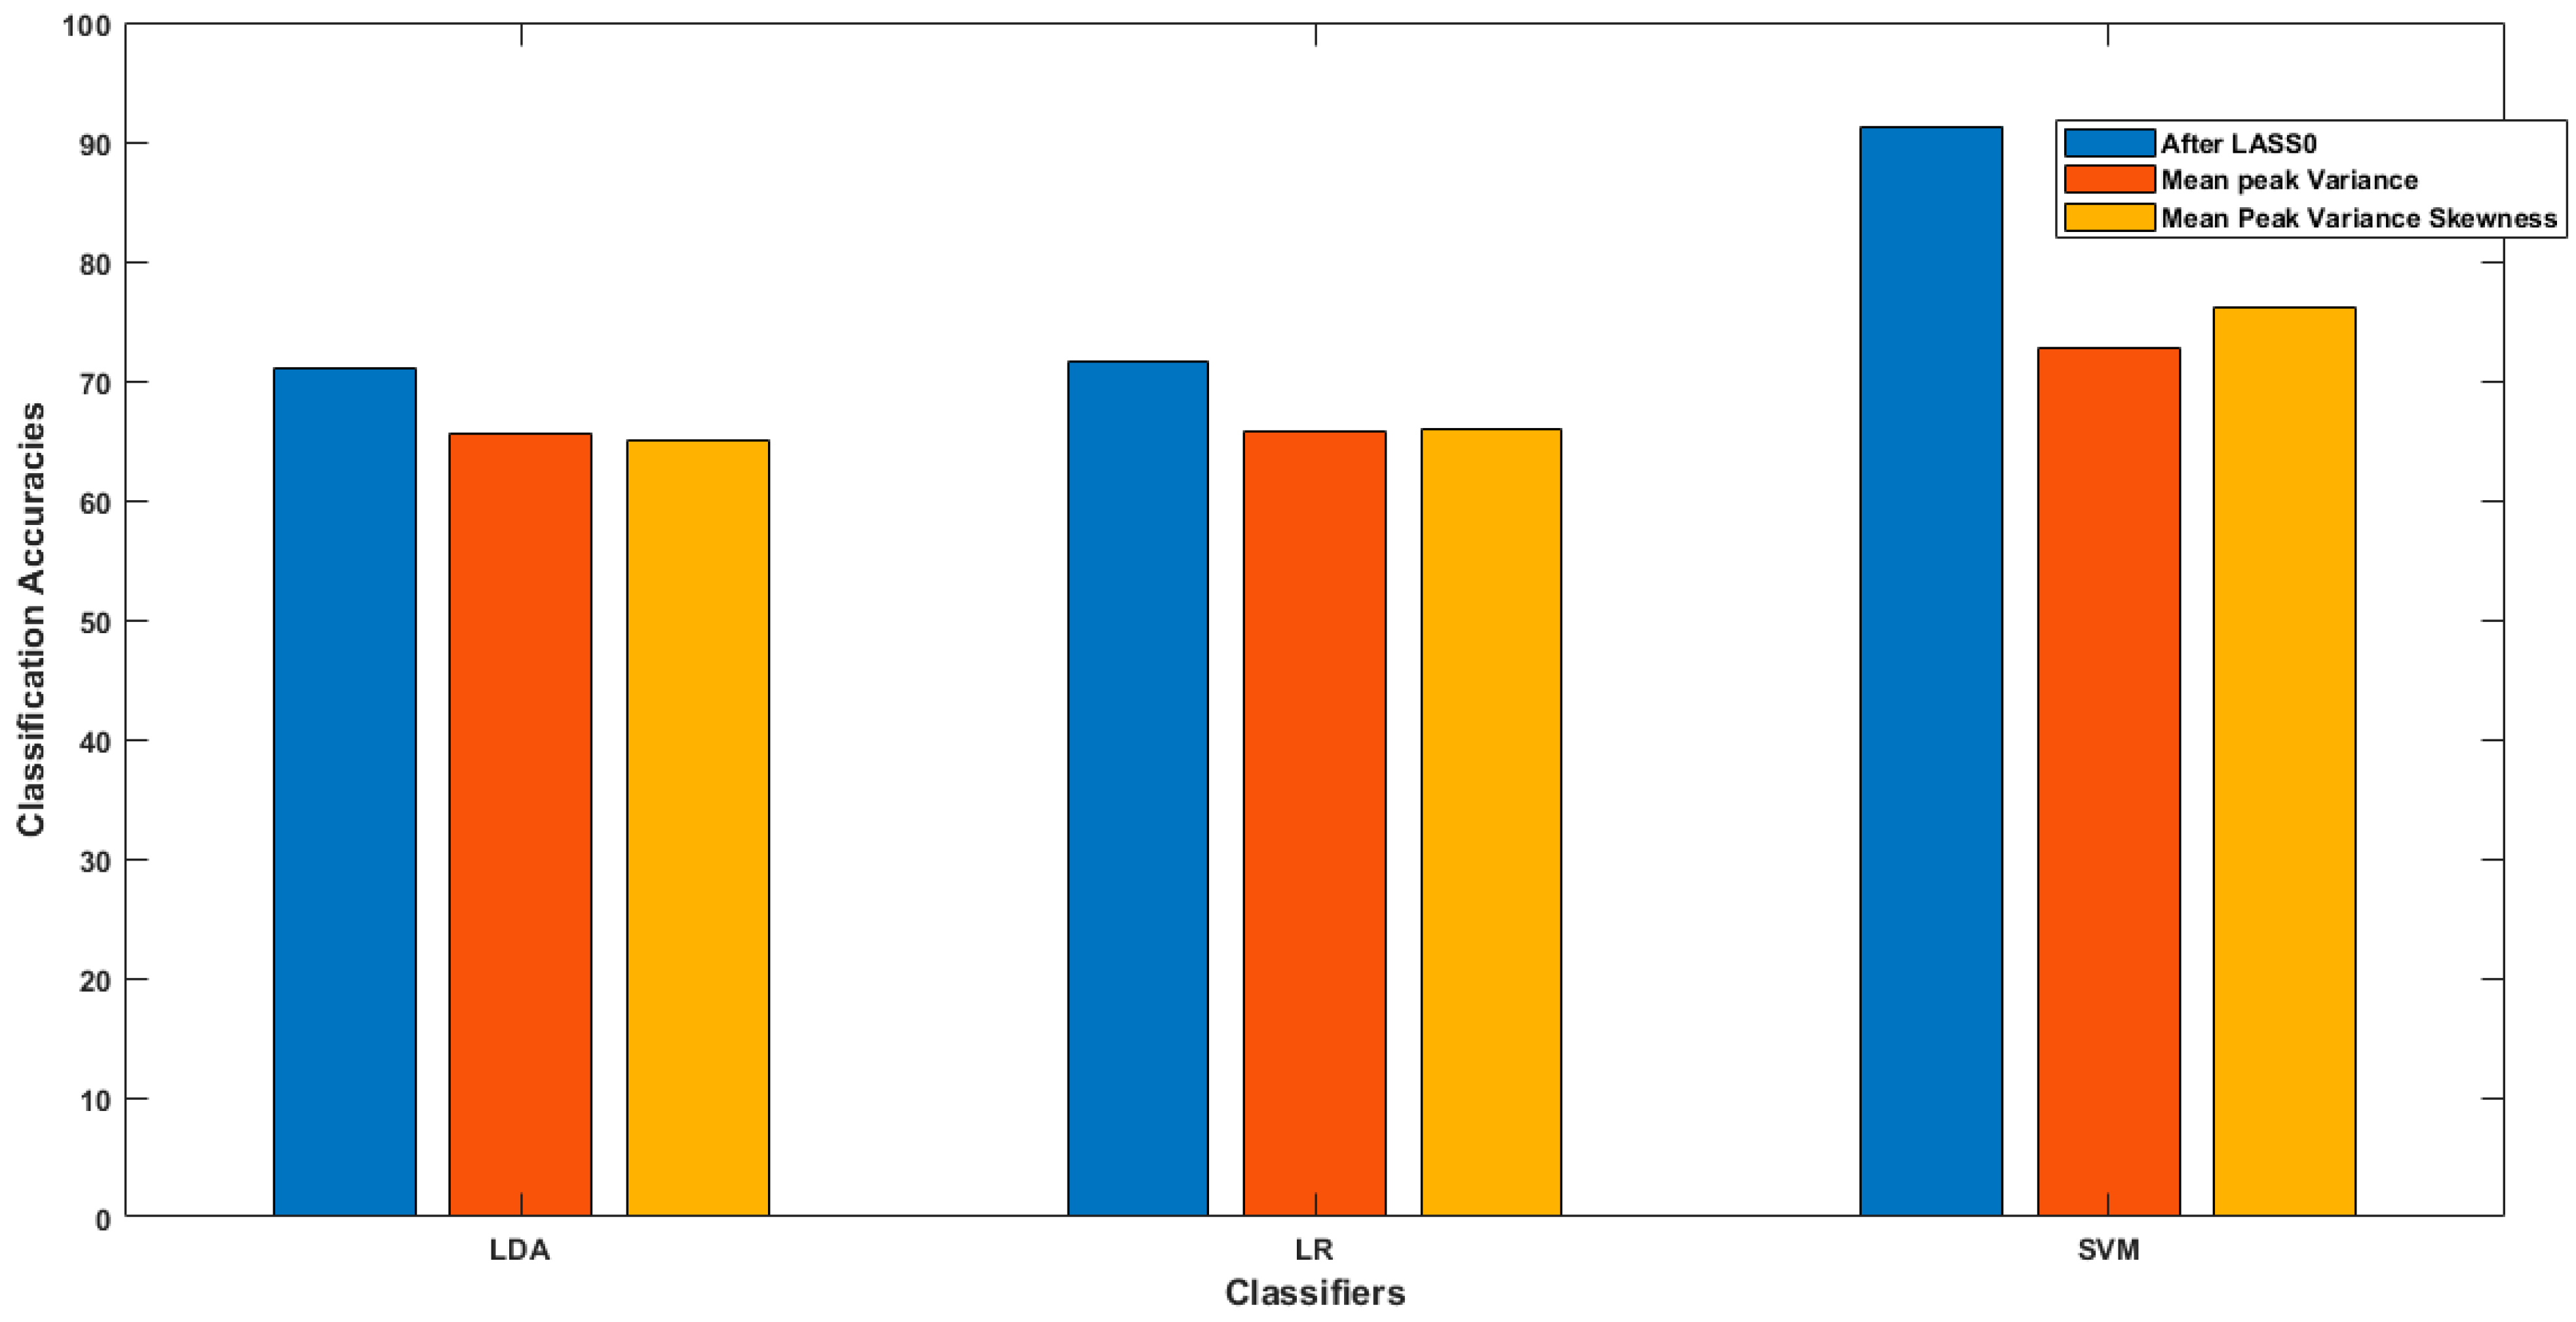
In the present study, a new method for selecting channels on the basis of the strong influence of individual input variables on the output response was introduced to increase fNIRS-BCI performance, especially in terms of classification accuracy. In the literature, there were many optimization techniques used to enhance the classification accuracy of the fNIRS-BCI system, to make it more robust and reliable. A comparative analysis between classifications of fNIRS-BCI, based on two methods, was conducted. The classification accuracies based on the proposed method were compared with the accuracies based on the conventional method of excessively used feature extractions, without channel selection, using all the channel data. In the first method, we observed that by using two different combinations of spatial features, we achieved average classification accuracies, for LDA, LR, and SVM, of 65 ± 1.34%, 65 ± 1.6%, and 72 ± 4.9%, respectively. After the implementation of the other method, LASSO homotopy-based sparse representation for channel selection, the classification accuracies of LDA, LR, and SVM improved to 71.01, 71.6, and 91.32%, respectively. This study shows that selecting the channels with intrinsic brain information as features for classification improves the classification accuracy of fNIRS-BCI. LASSO homotopy-based SRC enhances both the prediction accuracy and model interpretability. It lowers the variability of the system estimations, by precisely decreasing some of the coefficients, and making models that are easy to understand, produce, and interpret [47]. For the channel selection method used for EEG-BCI, the classification accuracy was 93.08%, by selecting only eight channels out of 64 when classifying motor imagery tasks [48]. A similar study was performed to select cortical activation-based channel selection using the z-score method for fNIRS-BCI problems, achieving a classification accuracy of 88% [21]. LASSO homotopy-based SRC autonomously selects the most significant channels for the fNIRS-BCI system, thus greatly improving the overall classification accuracy.
This study has a few limitations, including the fact that it only applies to a single activity at a time, because specific tasks are linked to certain brain regions, and subject-based channels were selected due to the different brain sizes. LASSO homotopy-based SRC selects channels with the minimum residual sum of error. Furthermore, the offline study is performed and analyzed, while the online study may be conducted for other cognitive activities. Moreover, several machine learning algorithms are applied in this study to analyze performance. Further deep learning algorithms may be implemented with LASSO homotopy-based SRC for analysis, and may perform better.

5. Conclusions

This study attempts to apply LASSO homotopy-based sparse representation to fNIRS to identify the following two binary classes of data: walking state and resting state. The average classification accuracies are 71.01, 71.6, and 91.32% for LDA, LR, and SVM, respectively. The results show that LASSO homotopy-based SRC can effectively identify classes with significantly (p < 0.0167) improved classification accuracies. This study shows the better performance of LASSO homotopy-based SRC as a step to improve the classification performance of state-of-the-art fNIRS-BCI problems.

Author Contributions

Conceptualization, A.G. and N.N.; methodology, A.G.; software, R.A.K.; validation, M.J.K. and H.N.; formal analysis, A.G. and R.A.K.; investigation, H.N.; resources, U.S.K.; data curation, M.J.K. and H.N.; writing—original draft preparation, A.G. and H.N.; writing—review and editing, N.N.; visualization, A.G. and H.N.; supervision, N.N.; project administration, N.N.; funding acquisition, U.S.K. All authors have read and agreed to the published version of the manuscript.

Funding

This research was funded by the National Centre of Robotics and Automation Rawalpindi, Pakistan, grant No. NCRA-RF-027.

Institutional Review Board Statement

The study was conducted according to the guidelines of the Declaration of Helsinki and approved by the Institutional Review Board of Pusan National University, Busan, Republic of Korea.

Informed Consent Statement

Informed consent was obtained from all subjects involved in the study.

Data Availability Statement

The original data used for this study can be shared upon reasonable request by the associate author.

Acknowledgments

We would like to acknowledge the National Centre of Robotics and Automation (NCRA), Rawalpindi, Pakistan, for providing the necessary support, laboratory equipment, and facilities to conduct this study.

Conflicts of Interest

The authors declare that there are no conflict of interest regarding the publication of this paper.

References

  1. Naseer, N.; Hong, K.-S. fNIRS-based brain-computer interfaces: A review. Front. Hum. Neurosci. 2015, 9, 3. [Google Scholar] [CrossRef] [Green Version]
  2. Hussain, G.; Rasul, A.; Anwar, H.; Sohail, M.U.; Kamran, S.K.S.; Baig, S.M.; Shabbir, A.; Iqbal, J. Epidemiological Data of Neurological Disorders in Pakistan and Neighboring Countries: A Review. Pak. J. Neurol. Sci. 2017, 12, 52–70. [Google Scholar]
  3. Li, H.; Gong, A.; Zhao, L.; Zhang, W.; Wang, F.; Fu, Y. Decoding of Walking Imagery and Idle State Using Sparse Representation Based on fNIRS. Intell. Neurosci. 2021, 2021, 6614112. [Google Scholar] [CrossRef]
  4. Shih, J.J.; Krusienski, D.J.; Wolpaw, J. Brain-Computer Interfaces in Medicine. Mayo Clin. Proc. 2012, 87, 268–279. [Google Scholar] [CrossRef] [PubMed] [Green Version]
  5. Pinti, P.; Aichelburg, C.; Gilbert, S.; Hamilton, A.; Hirsch, J.; Burgess, P.; Tachtsidis, I. A Review on the Use of Wearable Functional Near-Infrared Spectroscopy in Naturalistic Environments. Jpn. Psychol. Res. 2018, 60, 347–373. [Google Scholar] [CrossRef] [Green Version]
  6. Ghaffar, M.S.B.A.; Khan, U.S.; Iqbal, J.; Rashid, N.; Hamza, A.; Qureshi, W.S.; Tiwana, M.I.; Izhar, U. Improving classification performance of four class FNIRS-BCI using Mel Frequency Cepstral Coefficients (MFCC). Infrared Phys. Technol. 2020, 112, 103589. [Google Scholar] [CrossRef]
  7. Hong, K.-S.; Yaqub, M.A. Application of functional near-infrared spectroscopy in the healthcare industry: A review. J. Innov. Opt. Health Sci. 2019, 12, 91. [Google Scholar] [CrossRef]
  8. James, L.M.; Enghdal, B.E.; Leuthold, A.C.; Georgopoulos, A.P. Classification of Trauma-Related Outcomes in US Veterans Using Magnetoencephalography (MEG). J. Neurol. Neuromed. 2021, 6, 13–20. [Google Scholar] [CrossRef]
  9. Thorpe, D.R.; Engdahl, B.E.; Leuthold, A.; Georgopoulos, A.P. Assessing Recovery from Mild Traumatic Brain Injury (Mtbi) using Magnetoencephalography (MEG): An Application of the Synchronous Neural Interactions (SNI) Test. J. Neurol. Neuromed. 2020, 5, 28–34. [Google Scholar] [CrossRef]
  10. Bokhari, S.; Schneider, R.H.; Salerno, J.W.; Rainforth, M.V.; Gaylord-King, C.; Nidich, S.I. Effects of cardiac rehabilitation with and without meditation on myocardial blood flow using quantitative positron emission tomography: A pilot study. J. Nucl. Cardiol. 2019, 28, 1596–1607. [Google Scholar] [CrossRef]
  11. Nelles, G.; Jentzen, W.; Jueptner, M.; Müller, S.; Diener, H.C. Arm Training Induced Brain Plasticity in Stroke Studied with Serial Positron Emission Tomography. NeuroImage 2001, 13, 1146–1154. [Google Scholar] [CrossRef] [PubMed]
  12. Nishida, D.; Mizuno, K.; Yamada, E.; Hanakawa, T.; Liu, M.; Tsuji, T. The neural correlates of gait improvement by rhythmic sound stimulation in adults with Parkinson’s disease–A functional magnetic resonance imaging study. Parkinsonism Relat. Disord. 2021, 84, 91–97. [Google Scholar] [CrossRef] [PubMed]
  13. Boyne, P.; Doren, S.; Scholl, V.; Staggs, E.; Whitesel, D.; Maloney, T.; Awosika, O.; Kissela, B.; Dunning, K.; Vannest, J. Functional magnetic resonance brain imaging of imagined walking to study locomotor function after stroke. Clin. Neurophysiol. 2020, 132, 167–177. [Google Scholar] [CrossRef] [PubMed]
  14. Du, Y.; Zaidi, H. Single-Photon Emission Computed Tomography: Principles and Applications. In Encyclopedia of Biomedical Engineering; Narayan, R., Ed.; Elsevier: Oxford, UK, 2019; pp. 493–506. [Google Scholar] [CrossRef]
  15. Dorraji, E.S.; Oteiza, A.; Kuttner, S.; Martin-Armas, M.; Kanapathippillai, P.; Garbarino, S.; Kalda, G.; Scussolini, M.; Piana, M.; Fenton, K.A. Positron emission tomography and single photon emission computed tomography imaging of tertiary lymphoid structures during the development of lupus nephritis. Int. J. Immunopathol. Pharmacol. 2021, 35, e005772. [Google Scholar] [CrossRef]
  16. Khan, H.; Nazeer, H.; Engell, H.; Naseer, N.; Korostynska, O.; Mirtaheri, P. Prefrontal Cortex Activation Measured during Different Footwear and Ground Conditions Using fNIRS—A Case Study. In Proceedings of the 2021 International Conference on Artificial Intelligence and Mechatronics Systems (AIMS), Delft, The Netherlands, 12–16 July 2021. [Google Scholar]
  17. Khan, H.; Naseer, N.; Yazidi, A.; Eide, P.K.; Hassan, H.W.; Mirtaheri, P. Analysis of Human Gait Using Hybrid EEG-fNIRS-Based BCI System: A Review. Front. Hum. Neurosci. 2021, 14, 613254. [Google Scholar] [CrossRef]
  18. Hamid, H.; Naseer, N.; Nazeer, H.; Khan, M.J.; Khan, R.A.; Khan, U.S. Analyzing Classification Performance of fNIRS-BCI for Gait Rehabilitation Using Deep Neural Networks. Sensors 2022, 22, 1932. [Google Scholar] [CrossRef]
  19. Khan, R.A.; Naseer, N.; Qureshi, N.K.; Noori, F.M.; Nazeer, H.; Khan, M.U. fNIRS-based Neurorobotic Interface for gait rehabilitation. J. Neuroeng. Rehabil. 2018, 15, 7. [Google Scholar] [CrossRef]
  20. Abdalmalak, A.; Milej, D.; Yip, L.; Khan, A.R.; Diop, M.; Owen, A.M.; Lawrence, K.S. Assessing Time-Resolved fNIRS for Brain-Computer Interface Applications of Mental Communication. Front. Neurosci. 2020, 14, 105. [Google Scholar] [CrossRef] [Green Version]
  21. Nazeer, H.; Naseer, N.; Mehboob, A.; Khan, M.J.; Khan, R.A.; Khan, U.S.; Ayaz, Y. Enhancing classification performance of fNIRS-BCI by identifying cortically active channels using the z-score method. Sensors 2020, 20, 6995. [Google Scholar] [CrossRef]
  22. Naseer, N.; Qureshi, N.K.; Noori, F.M.; Hong, K.-S. Analysis of different classification techniques for two-class functional near-infrared spectroscopy-based brain-computer interface. Comput. Intell. Neurosci. 2016, 2016, 5480760. [Google Scholar] [CrossRef] [Green Version]
  23. Zhu, Z.; Yin, H.; Chai, Y.; Li, Y.; Qi, G. A novel multi-modality image fusion method based on image decomposition and sparse representation. Inf. Sci. 2018, 432, 516–529. [Google Scholar] [CrossRef]
  24. Sreeja, S.; Samanta, D. Distance-based weighted sparse representation to classify motor imagery EEG signals for BCI applications. Multimed. Tools Appl. 2020, 79, 13775–13793. [Google Scholar] [CrossRef]
  25. Miao, M.; Zhao, F.; Liu, F.; Zeng, H.; Wang, A. Index finger motor imagery EEG pattern recognition in BCI applications using dictionary cleaned sparse representation-based classification for healthy people. Rev. Sci. Instrum. 2017, 88, 094305. [Google Scholar] [CrossRef] [PubMed]
  26. Miao, M.; Wang, A.; Liu, F. A spatial-frequency-temporal optimized feature sparse representation-based classification method for motor imagery EEG pattern recognition. Med. Biol. Eng. Comput. 2017, 55, 1589–1603. [Google Scholar] [CrossRef] [PubMed]
  27. Shin, Y.; Lee, S.; Ahn, M.; Cho, H.; Jun, S.C.; Lee, H.-N. Noise robustness analysis of sparse representation based classification method for non-stationary EEG signal classification. Biomed. Signal Process. Control 2015, 21, 8–18. [Google Scholar] [CrossRef]
  28. Gratton, G.; Brumback, C.R.; Gordon, B.; Pearson, M.A.; Low, K.A.; Fabiani, M. Effects of measurement method, wavelength, and source-detector distance on the fast optical signal. NeuroImage 2006, 32, 1576–1590. [Google Scholar] [CrossRef] [PubMed]
  29. Delpy, D.T.; Cope, M.; van der Zee, P.; Arridge, S.; Wray, S.; Wyatt, J. Estimation of optical pathlength through tissue from direct time of flight measurement. Phys. Med. Biol. 1988, 33, 1433–1442. [Google Scholar] [CrossRef] [Green Version]
  30. Ye, J.C.; Tak, S.; Jang, K.E.; Jung, J.; Jang, J. NIRS-SPM: Statistical parametric mapping for near-infrared spectroscopy. NeuroImage 2009, 44, 428–447. [Google Scholar] [CrossRef]
  31. Noori, F.M.; Naseer, N.; Qureshi, N.K.; Nazeer, H.; Khan, R. Optimal feature selection from fNIRS signals using genetic algorithms for BCI. Neurosci. Lett. 2017, 647, 61–66. [Google Scholar] [CrossRef]
  32. Santosa, H.; Hong, M.J.; Hong, K.-S. Lateralization of music processing with noises in the auditory cortex: An fNIRS study. Front. Behav. Neurosci. 2014, 8, 418. [Google Scholar] [CrossRef] [Green Version]
  33. Rojas, R.F.; Huang, X.; Ou, K.L.; Lopez-Aparicio, J. Cross Correlation Analysis of Multi-Channel Near Infrared Spectroscopy. Comput. Sci. Inf. Technol. 2016, 6, 23–33. [Google Scholar] [CrossRef]
  34. Zhang, H.; Patel, V.M. Sparse representation-based open set recognition. IEEE Trans. Pattern Anal. Mach. Intell. 2016, 39, 1690–1696. [Google Scholar] [CrossRef] [Green Version]
  35. Li, Y.; Ngom, A. Sparse representation approaches for the classification of high-dimensional biological data. BMC Syst. Biol. 2013, 7, S6. [Google Scholar] [CrossRef] [PubMed] [Green Version]
  36. Zhang, Z.; Xuelong, L.; Yang, J.; Li, X.; Zhang, D. A Survey of Sparse Representation: Algorithms and Applications. IEEE Access 2015, 3, 490–530. [Google Scholar] [CrossRef]
  37. Cleophas, T.J.; Zwinderman, A.H. Statistical Analysis of Clinical Data on a Pocket Calculator; Springer: Berlin/Heidelberg, Germany, 2011. [Google Scholar]
  38. Qureshi, N.K.; Naseer, N.; Noori, F.M.; Nazeer, H.; Khan, R.; Saleem, S. Enhancing Classification Performance of Functional Near-Infrared Spectroscopy- Brain–Computer Interface Using Adaptive Estimation of General Linear Model Coefficients. Front. Neurorobotics 2017, 11, 33. [Google Scholar] [CrossRef] [PubMed]
  39. Zafar, A.; Hong, K.-S. Neuronal Activation Detection Using Vector Phase Analysis with Dual Threshold Circles: A Functional Near-Infrared Spectroscopy Study. Int. J. Neural Syst. 2018, 28, 1850031. [Google Scholar] [CrossRef]
  40. Zafar, A.; Ghafoor, U.; Yaqub, M.; Hong, K.-S. Initial-dip-based classification for fNIRS-BCI. In Neural Imaging and Sensing; SPIE: Bellingham, WA, USA, 2019. [Google Scholar]
  41. Nazeer, H.; Naseer, N.; Khan, R.A.; Noori, F.M.; Qureshi, N.K.; Khan, U.S.; Khan, M.J. Enhancing classification accuracy of fNIRS-BCI using features acquired from vector-based phase analysis. J. Neural Eng. 2020, 17, 056025. [Google Scholar] [CrossRef]
  42. Naseer, N.; Noori, F.M.; Qureshi, N.K.; Hong, K.-S. Determining Optimal Feature-Combination for LDA Classification of Functional Near-Infrared Spectroscopy Signals in Brain-Computer Interface Application. Front. Hum. Neurosci. 2016, 10, 237. [Google Scholar] [CrossRef] [Green Version]
  43. Hong, K.-S.; Santosa, H. Decoding four different sound-categories in the auditory cortex using functional near-infrared spectroscopy. Hear. Res. 2016, 333, 157–166. [Google Scholar] [CrossRef]
  44. Nguyen, H.-D.; Hong, K.-S. Bundled-optode implementation for 3D imaging in functional near-infrared spectroscopy. Biomed. Opt. Express 2016, 7, 3491–3507. [Google Scholar] [CrossRef] [Green Version]
  45. Petrantonakis, P.C.; Kompatsiaris, I. Single-Trial NIRS Data Classification for Brain–Computer Interfaces Using Graph Signal Processing. IEEE Trans. Neural Syst. Rehabil. Eng. 2018, 26, 1700–1709. [Google Scholar] [CrossRef] [PubMed]
  46. Muthukrishnan, R.; Rohini, R. LASSO: A feature selection technique in predictive modeling for machine learning. In Proceedings of the 2016 IEEE International Conference on Advances in Computer Applications (ICACA), Coimbatore, India, 24 October 2016. [Google Scholar]
  47. Varsehi, H.; Firoozabadi, S.M.P. An EEG channel selection method for motor imagery based brain–computer interface and neurofeedback using Granger causality. Neural Netw. 2020, 133, 193–206. [Google Scholar] [CrossRef] [PubMed]
  48. Naseer, N.; Hong, K.-S.; Bhutta, M.R.; Khan, M.J. Improving classification accuracy of covert yes/no response decoding using support vector machines: An fNIRS study. In Proceedings of the 2014 International Conference on Robotics and Emerging Allied Technologies in Engineering (iCREATE), Islamabad, Pakistan, 22–24 April 2014. [Google Scholar]
Figure 1. Block diagram of BCI system.
Sensors 22 02575 g001
Figure 2. BCI system with LASSO-based sparse representation classification for channel selection.
Sensors 22 02575 g002
Figure 3. Experimental paradigm for data acquisition: after an initial 30 s rest, a single trial consisted of a 10 s period of walking followed by a 20 s rest.
Sensors 22 02575 g003
Figure 4. Position of source and detectors on the left hemisphere of the motor cortex. D represents the detectors and S represents sources.
Sensors 22 02575 g004
Figure 5. Average trial ΔCHbO signals of subject four for channels 9–12.
Sensors 22 02575 g005
Figure 6. Sparse representation model. The dictionary is represented as A = [a1, ⋯, ak], dictionary atom is represented as ai, x is a sparse coefficient vector and Y is the output signal result as combination of A × x.
Sensors 22 02575 g006
Figure 7. This figure shows a bar chart comparison of average classification accuracies for walking and resting states of all classifiers using both methods.
Sensors 22 02575 g007
Table 1. Subject-wise channel selection using LASSO homotopy-based spare representation.
SubjectsSelected Channels
11, 2, 3, 4, 7, 8, 9, 10, 11
22, 3, 4, 5, 6, 7, 9, 11
32, 6, 8, 9, 10, 11
48, 9, 12
51, 2, 5, 6, 7, 8, 12
61, 5, 8, 11, 12
72, 4, 5, 6, 8, 9, 11, 12
86, 10
91, 2, 3, 4, 6, 7, 8, 9
Table 2. Subject-wise classification accuracies of all subjects (%) were obtained by implementing LASSO homotopy for channel selection of H b O signals and classification using SVM, LDA, and LR of the walking and resting states (binary classification) of 9 subjects.
SubjectsLDALRSVM
172.6%69.1%95.7%
275.7%76.7%95.9%
374.6%83%95.2%
468%67.4%85.4%
571.9%72.4%91.3%
668%70.4%95.2%
775.9%74.6%95.4%
862.6%62.2%75.9%
969.8%69.8%91.3%
Table 3. Subject-wise classification accuracies of all subjects (%) were obtained by extracting features (i.e., SM. SP, and SV) of H b O signals and classification using SVM, LDA, and LR of the walking and resting states (binary classification) of 9 subjects.
SubjectsLDALRSVM
165.5%63.9%75.5%
266.5%65.2%72.4%
363.9%62.8%70.4%
466.9%68.1%68.9%
566.7%66.7%71.5%
661.9%65.7%71.3%
763.9%64.8%71.7%
866.5%66.5%71.7%
968.1%67.4%81.5%
Table 4. Subject-wise classification accuracies of all subjects (%) were obtained by extracting features (i.e., SM. SP, SV, and SK) of H b O signals and classification using SVM, LDA, and LR of the walking and resting states (binary classification) of 9 subjects.
SubjectsLDALRSVM
165.4%65.2%78.1%
266.5%69.4%78.5%
364.6%63%71.9%
465%65.9%73%
566.1%65.4%74.8%
661.5%65.9%73.5%
762.8%64.1%72.6%
866.3%68%85.2%
967.6%68%85.2%
Table 5. Average classification accuracies of all subjects (%) were obtained by extracting features and selecting channels of H b O signals and classification using SVM, LDA, and LR of the walking and resting states (binary classification) of 9 subjects.
LDALRSVM
After LASSO Homotopy71.01%71.6%91.32%
Mean, Peak and Variance65.54%65.67%72.7%
Mean, Peak, Variance and Skewness65.08%65.9%76.2%
Table 6. Statistical significance of the LASSO homotopy-based sparse representation method.
Bonferroni Correction Applied (p < 0.0167)
SVMvs.LDA1.0886 × 10−6
LR6.8421 × 10−6
Publisher’s Note: MDPI stays neutral with regard to jurisdictional claims in published maps and institutional affiliations.

