
Multi-Technology Multi-Operator Site Sharing: Compliance Distance Analysis for EMF Exposure


Abstract
:1. Introduction
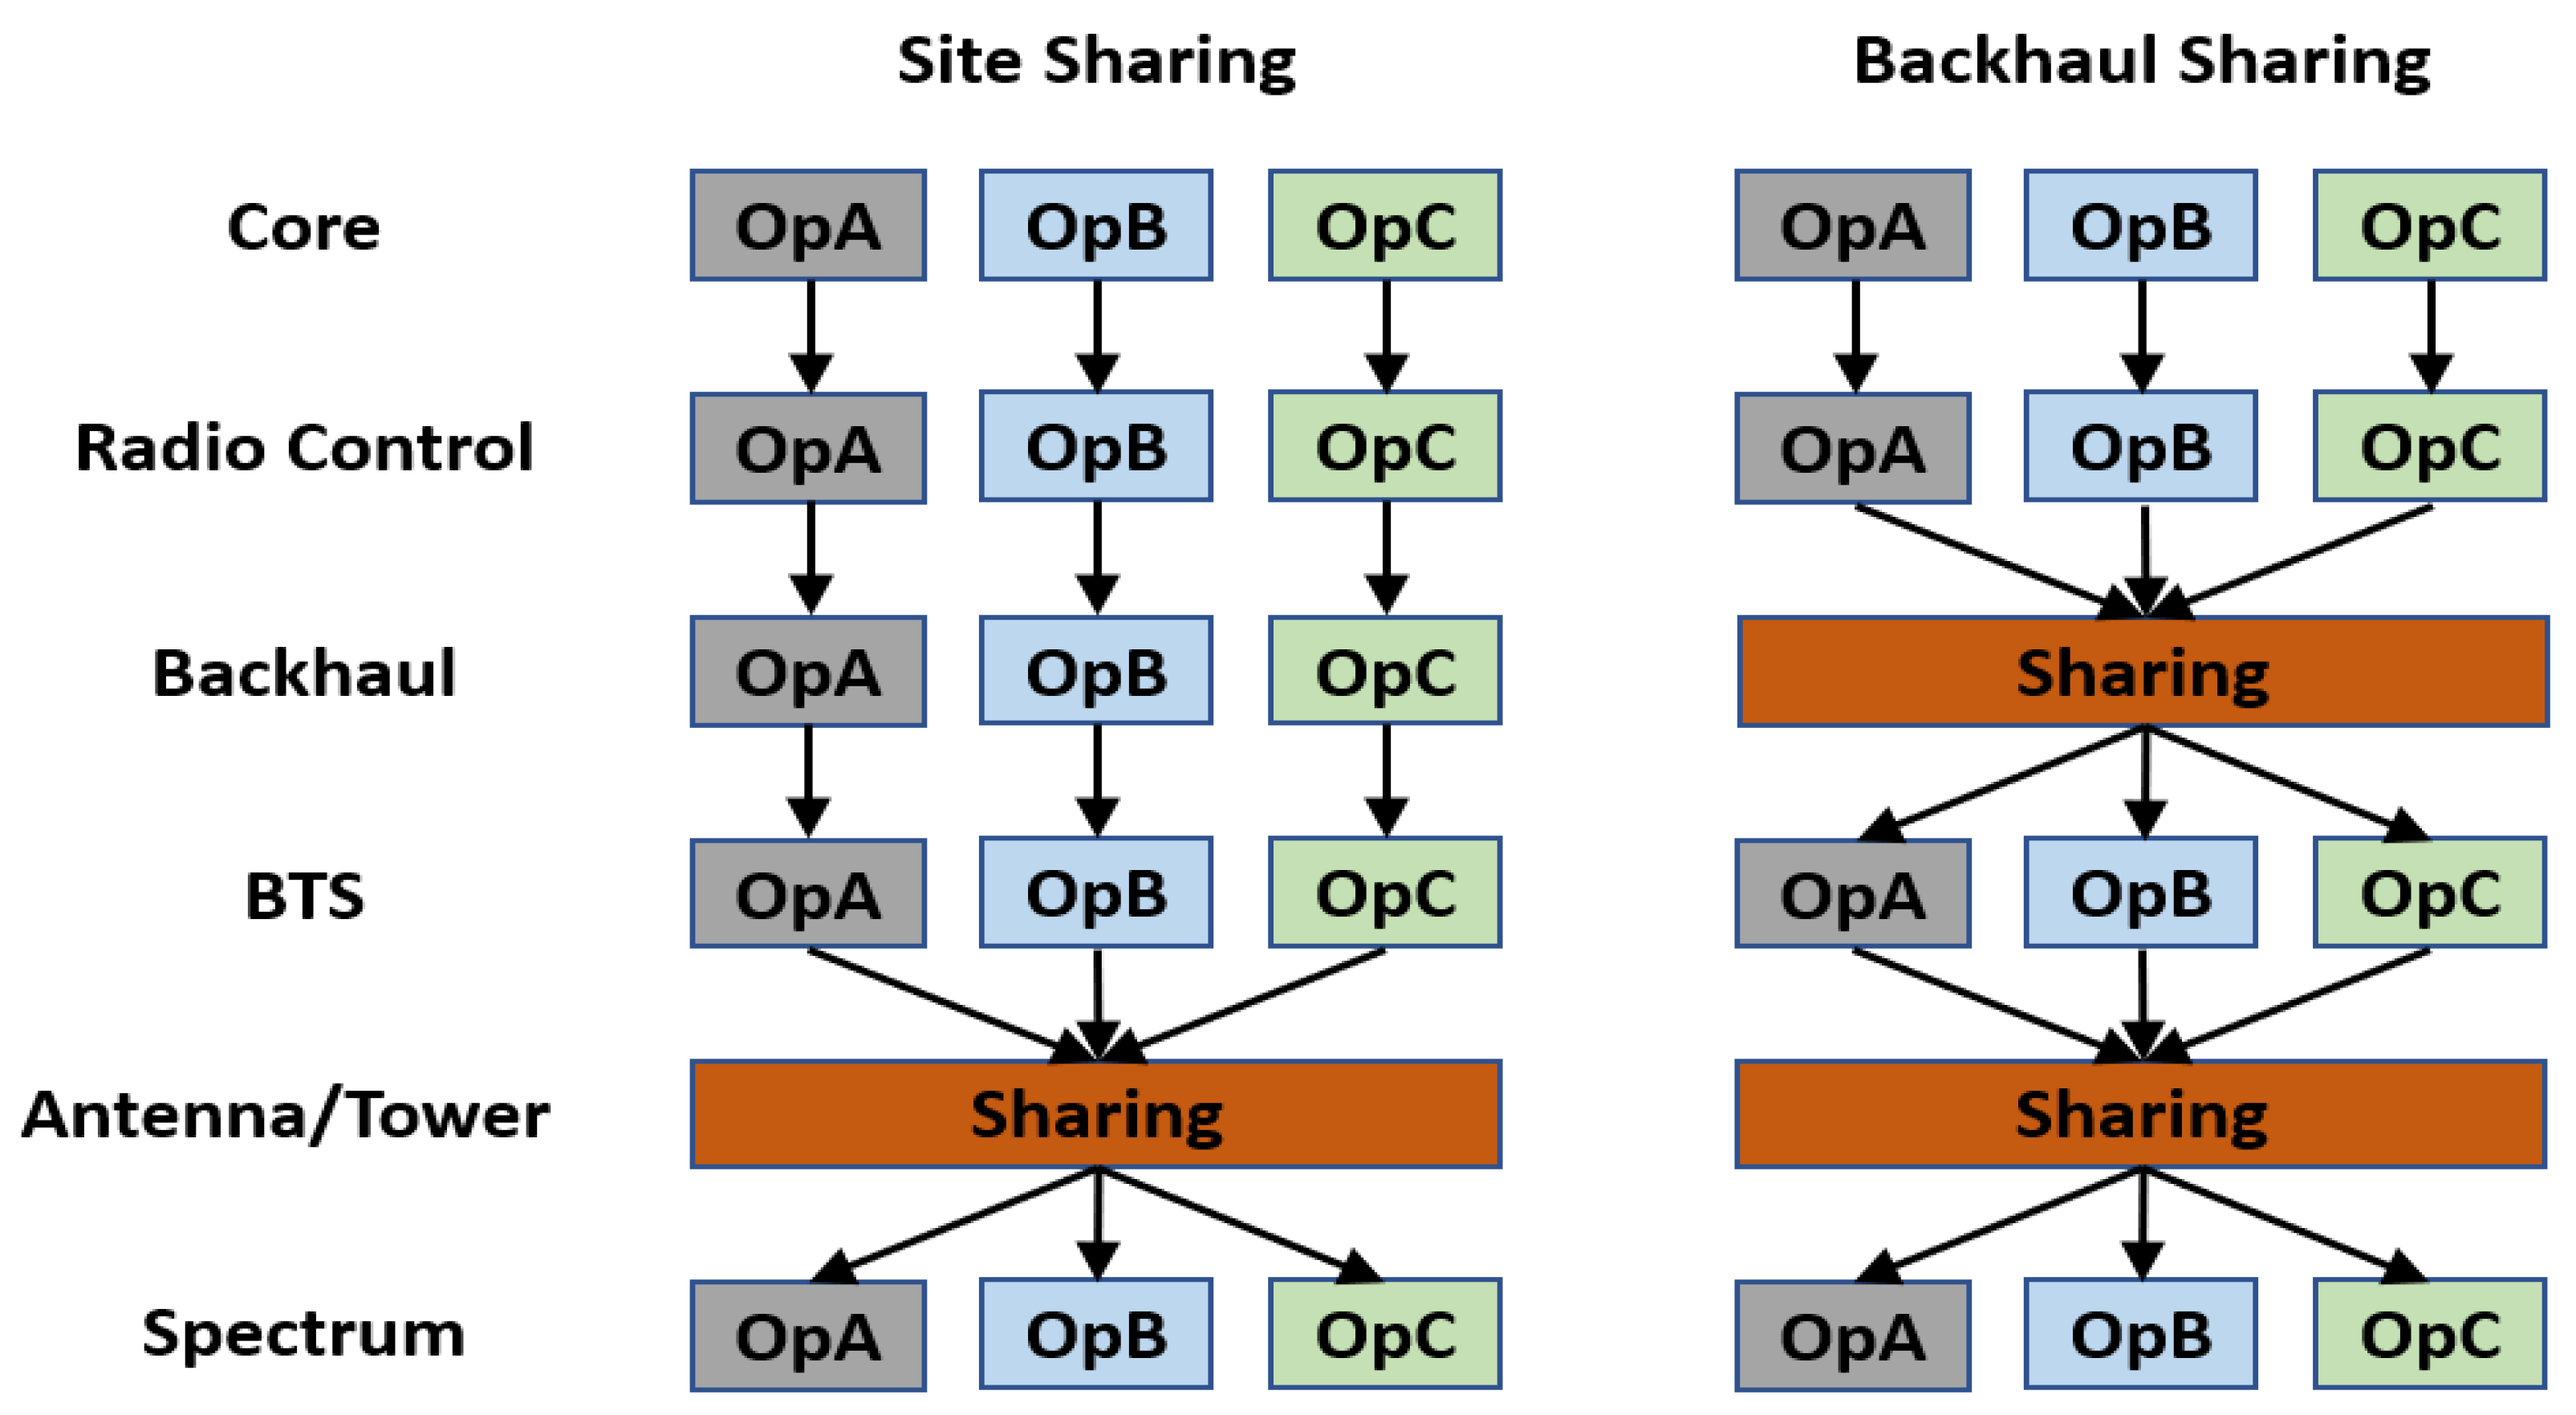
- It is less expensive to share a site than to build a new one. According to [17], infrastructure sharing can result in significant cost savings—up to 40% of assets can be saved by site sharing, and cash flow can improve by 31% as a result.
- The densification of the existing sites increases the difficulty of acquiring more physical sites within the required nominal locations and leads to fewer options.
- Site sharing enables the rationalization of the legacy 2G and 3G networks, taking into account the declining revenues from 2G and 3G networks and the higher spectral efficiency of the next generation of 4G and 5G technologies.
- Site sharing enables diverting the investment to other important innovations, such as the deployment of more 5G sites.
- Site sharing has some social benefits because it lowers network costs, which lowers the customer’s service fee.
- Tower sharing benefits the environment by reducing the number of sites with better looks and views.
2. Exposure Standard Limits
3. Compliance Distance Calculations
4. Results and Discussion
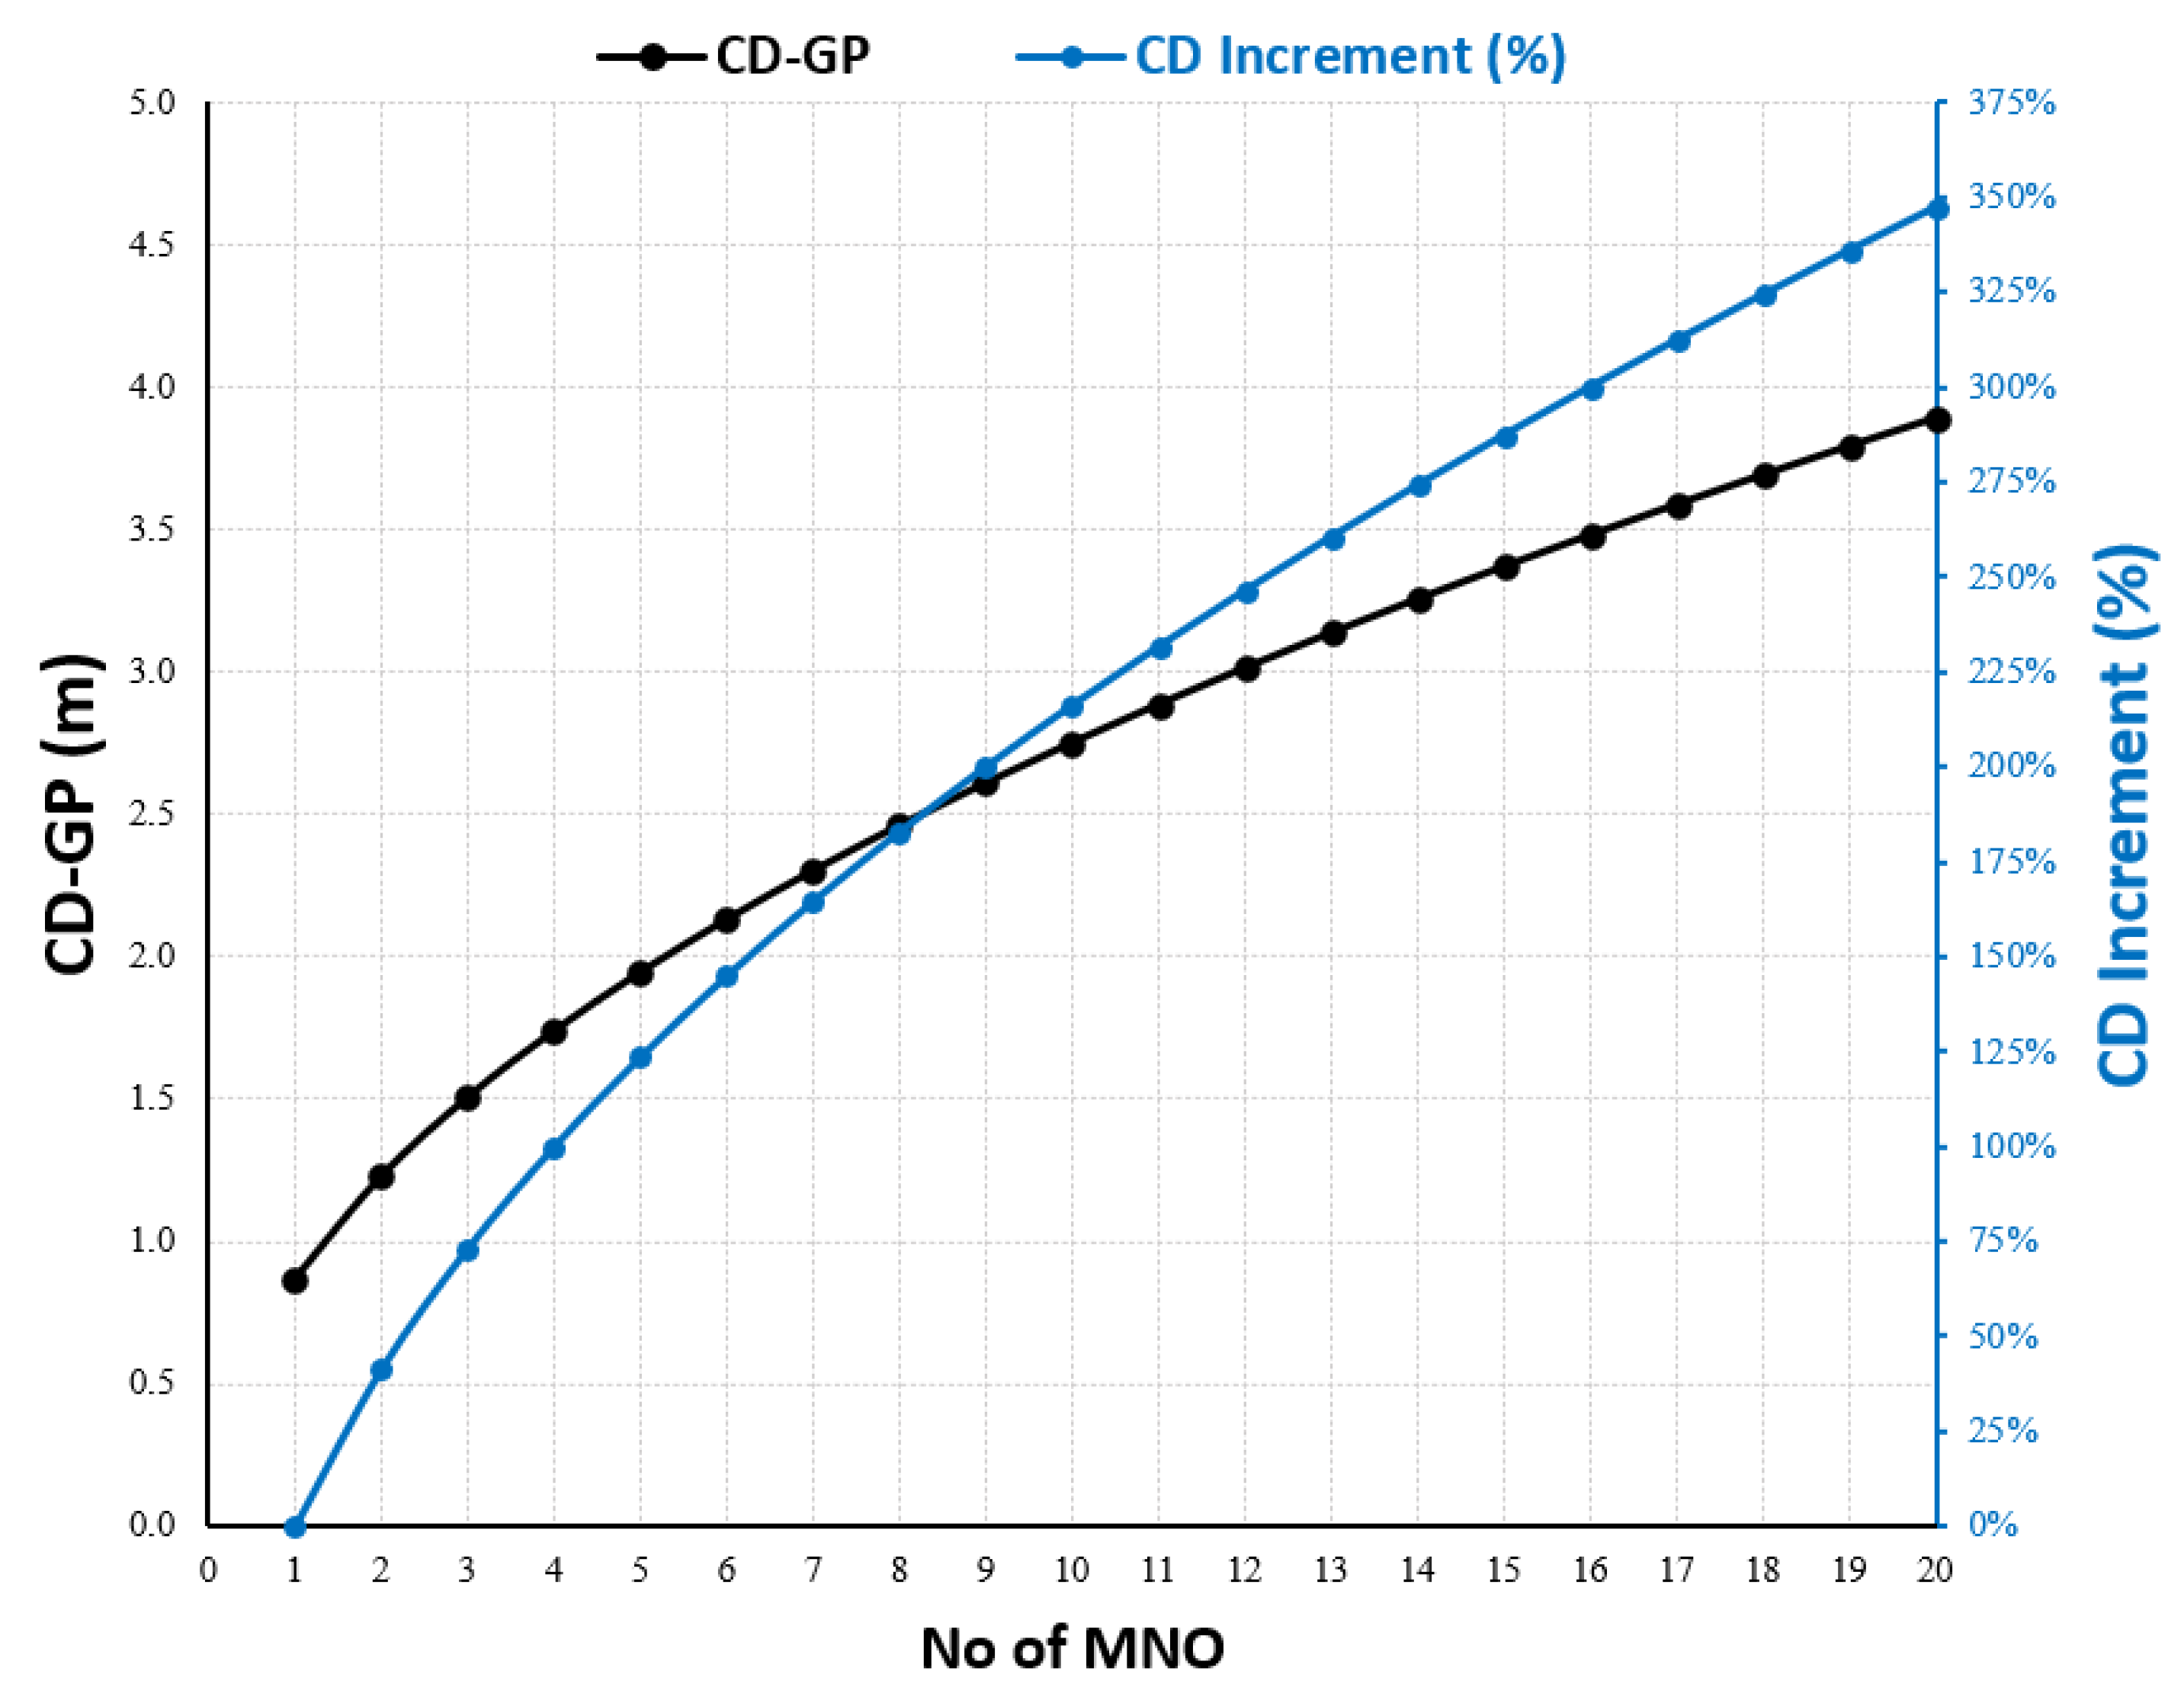
4.1. Shared Macro Site
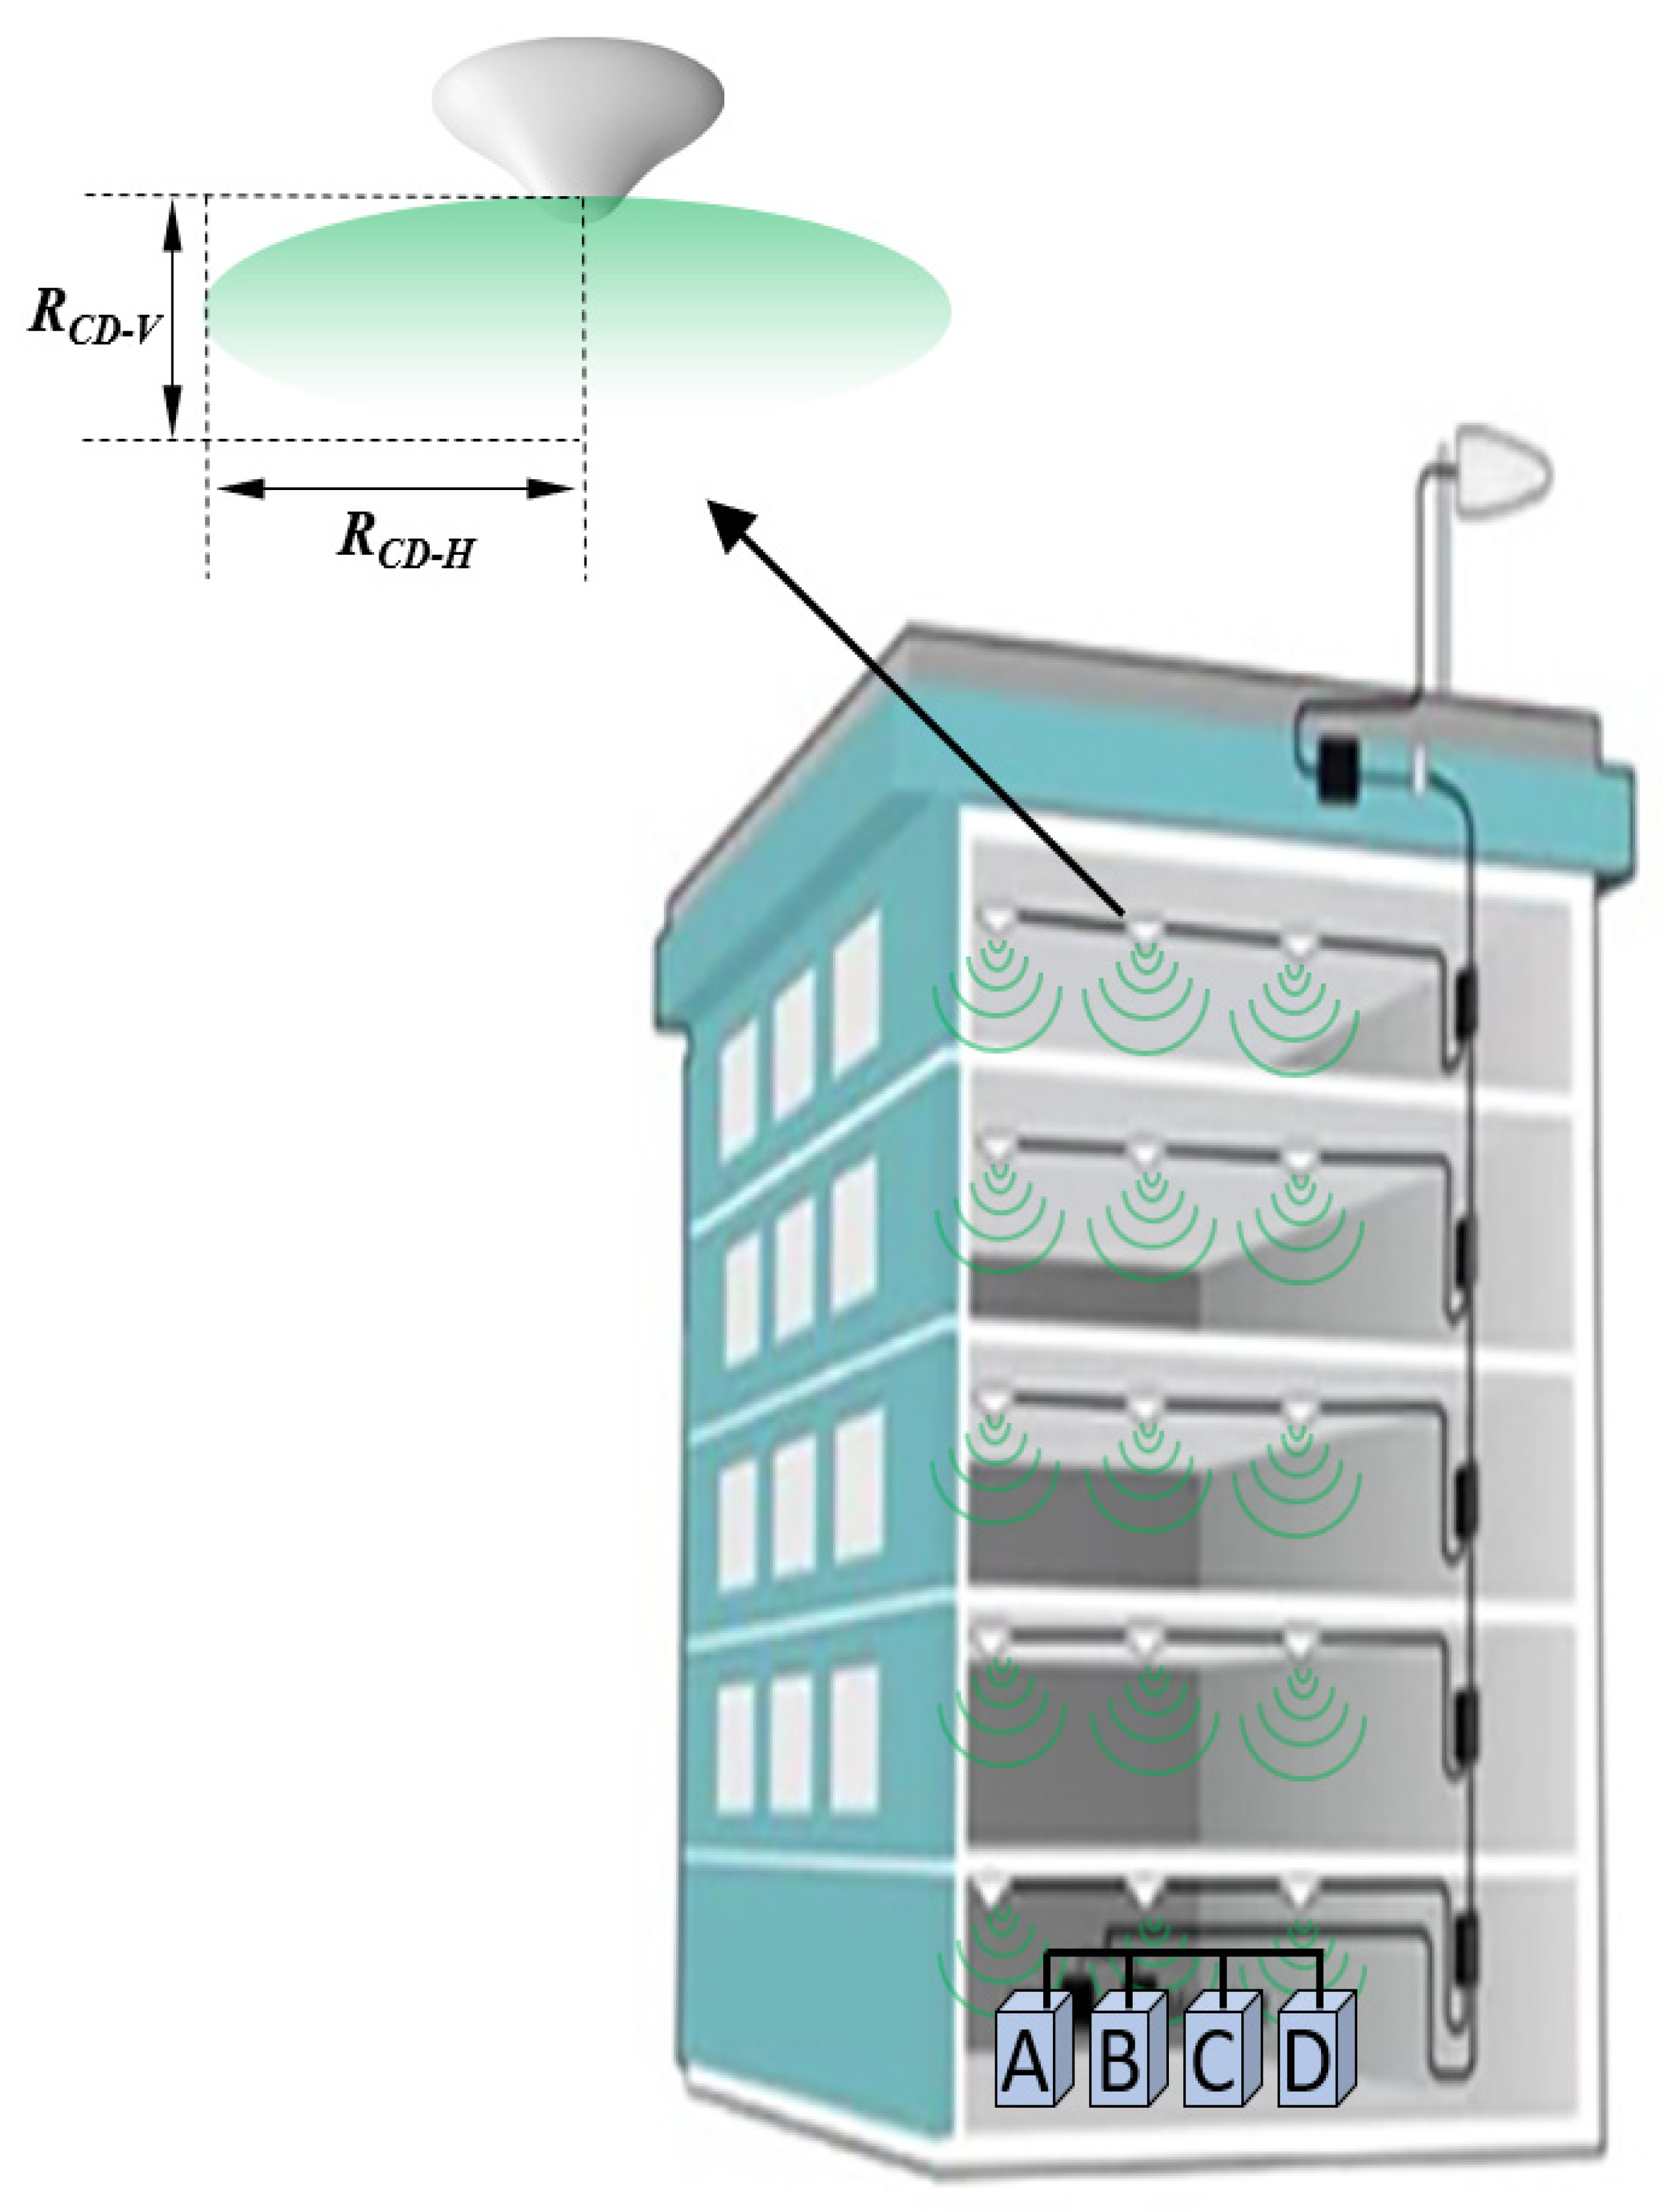
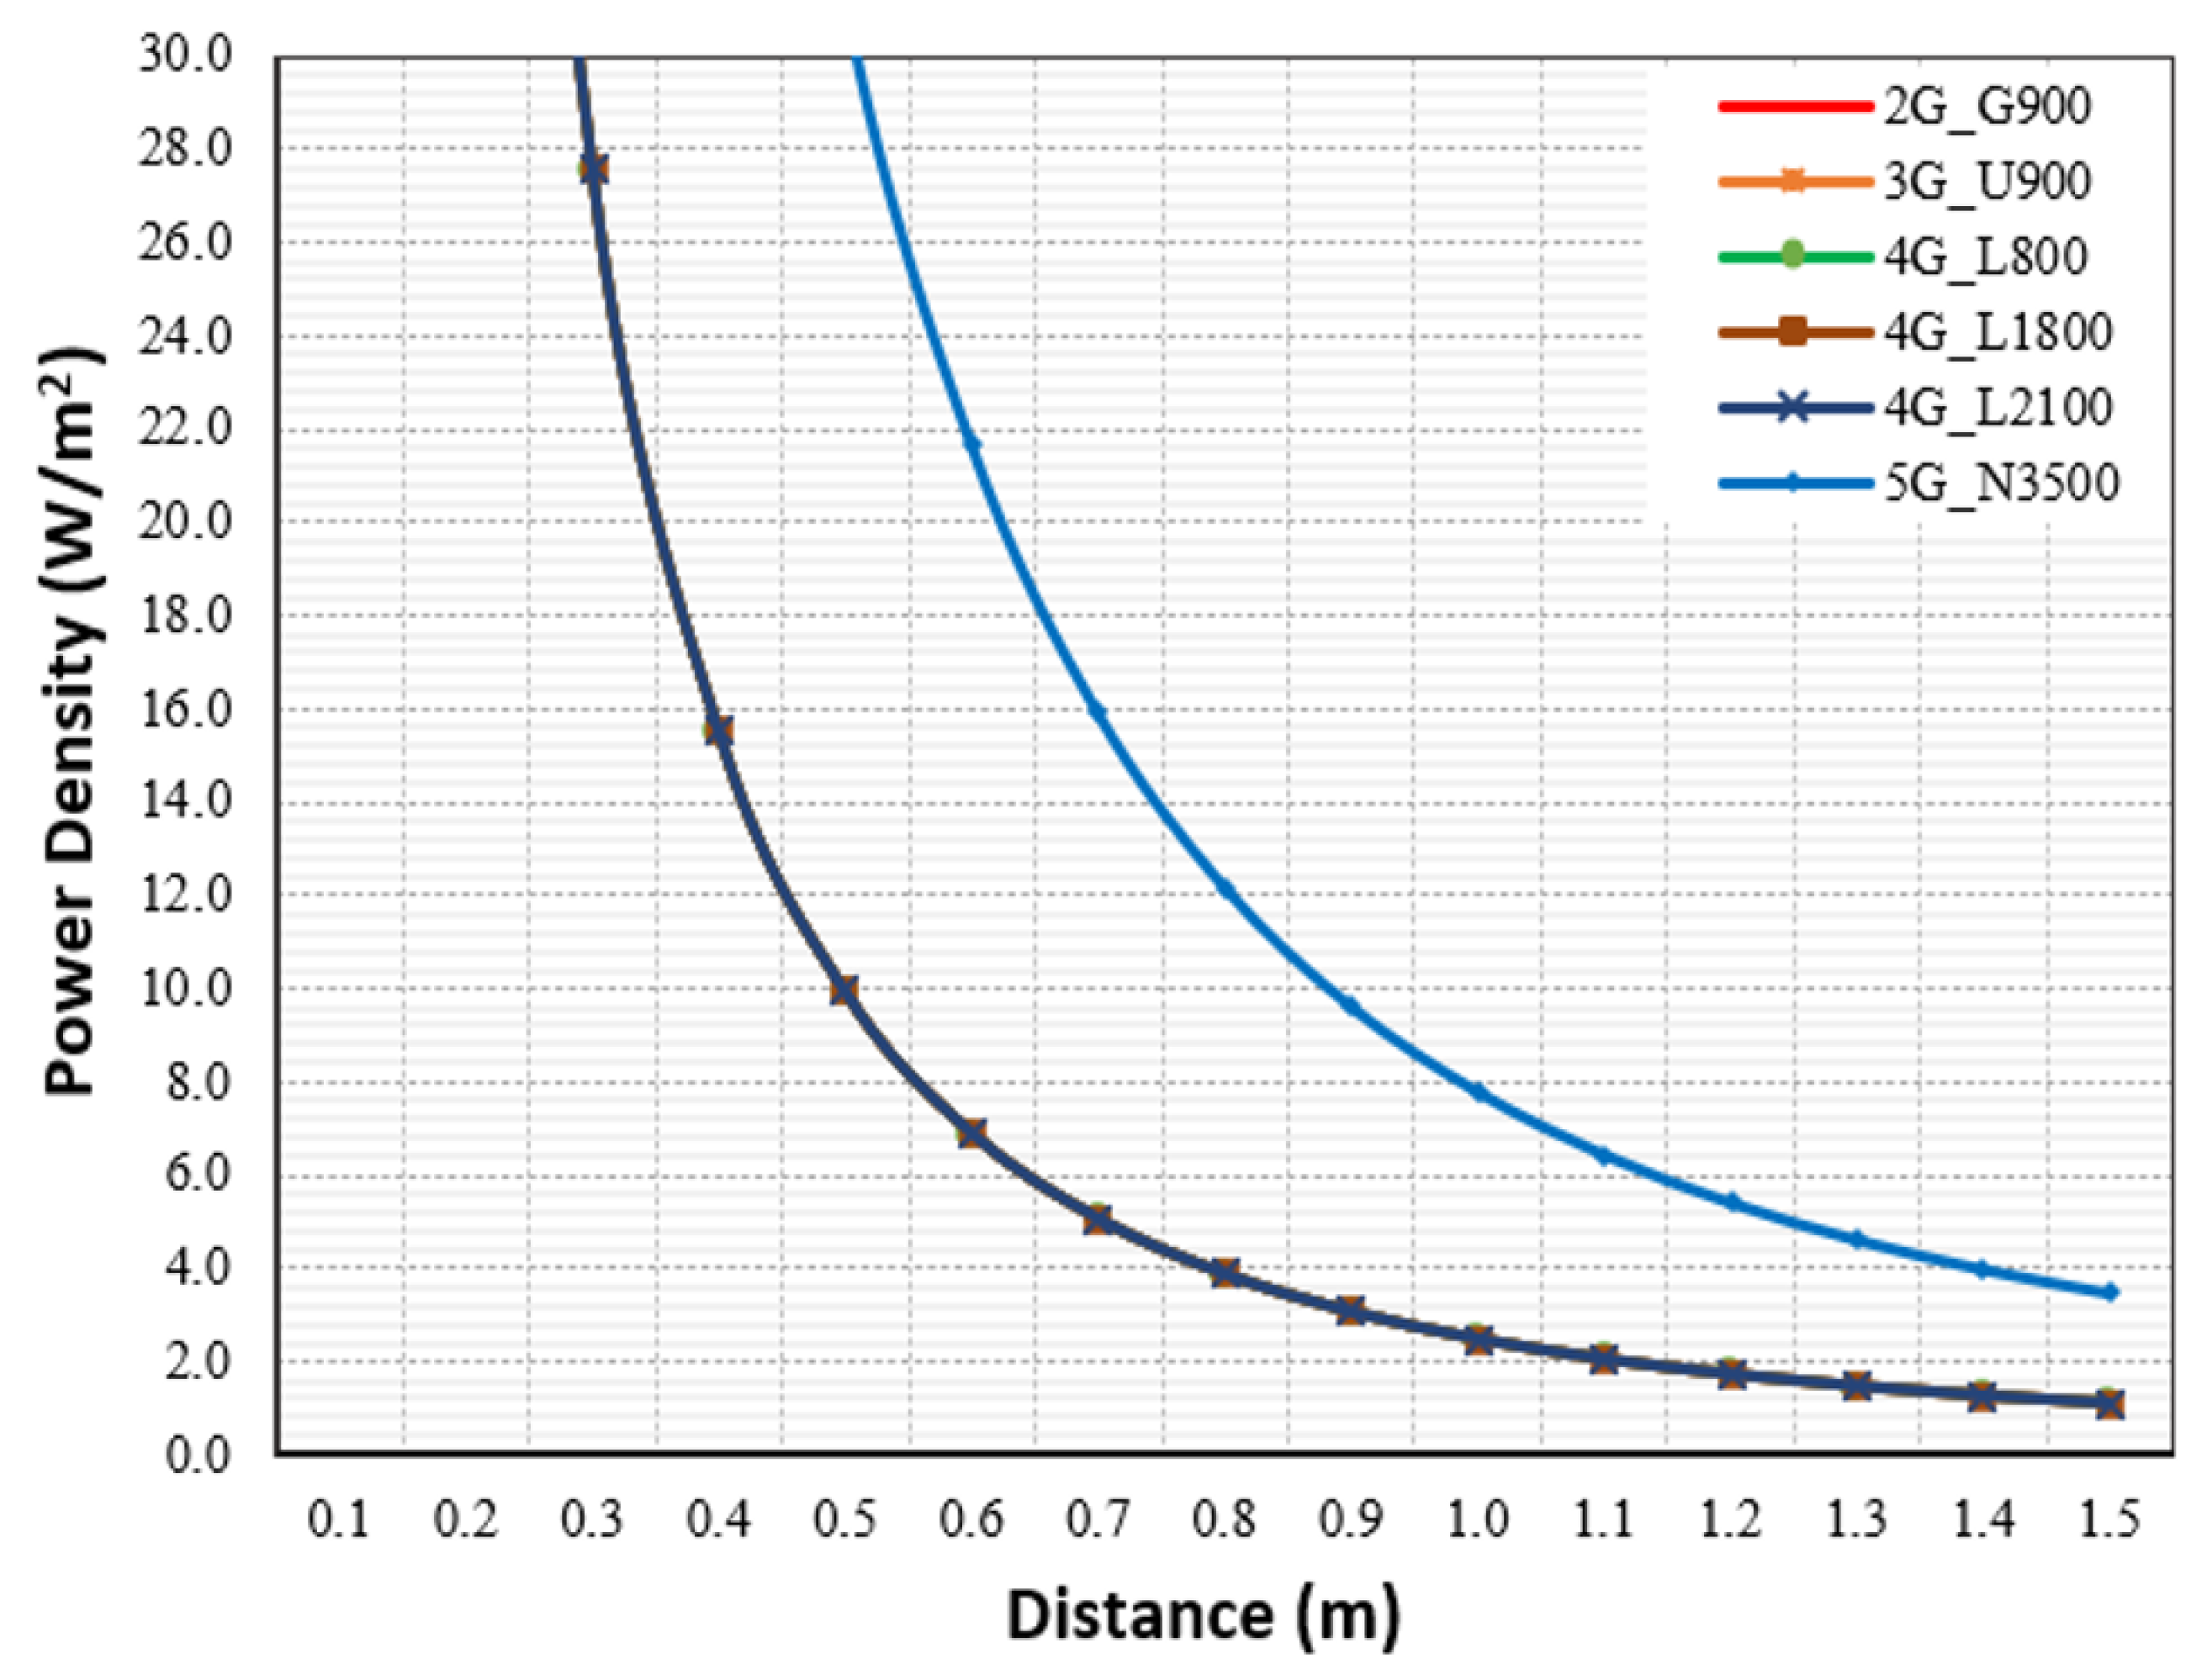
4.2. Shared Indoor IBS Site

| Site Setting | 2G G900 | 3G U900 | 4G L800 | 4G L1800 | 4G L2100 | 5G N3600 |
|---|---|---|---|---|---|---|
| Freq. Band (MHz) | 900 | 900 | 800 | 1800 | 2100 | 3500 |
| Freq. BW (MHz) | 5 | 5 | 10 | 20 | 20 | 100 |
| Total Tx | 2 | 1 | 2 | 2 | 2 | 4 |
| Total Rx | 2 | 1 | 2 | 2 | 2 | 4 |
| Power Tx | 1.3 W | 1.3 W | 1.3 W | 1.3 W | 1.3 W | 2 W |
| System Load | 95% | 95% | 95% | 95% | 95% | 95% |
| Ant. Gain | 8 dBi | 8 dBi | 8 dBi | 10 dBi | 10 dBi | 11.1 dBi |
5. Conclusions
Author Contributions
Funding
Institutional Review Board Statement
Informed Consent Statement
Data Availability Statement
Conflicts of Interest
References
- Bajpai, A.; Balodi, A. Role of 6G Networks: Use Cases and Research Directions. In Proceedings of the 2020 IEEE Bangalore Humanitarian Technology Conference (B-HTC), Vijiyapur, India, 8–10 October 2020; pp. 1–5. [Google Scholar] [CrossRef]
- Chowdhury, M.Z.; Shahjalal, M.; Ahmed, S.; Jang, Y.M. 6G Wireless Communication Systems: Applications, Requirements, Technologies, Challenges, and Research Directions. IEEE Open J. Commun. Soc. 2020, 1, 957–975. [Google Scholar] [CrossRef]
- Koh, W.J.; Moochhala, S.M. Non-ionizing EMF hazard in the 21st century. In Proceedings of the 2018 IEEE International Symposium on Electromagnetic Compatibility and 2018 IEEE Asia-Pacific Symposium on Electromagnetic Compatibility (EMC/APEMC), Suntec City, Singapore, 14–18 May 2018; pp. 518–522. [Google Scholar] [CrossRef]
- Sharma, A.B.; Lamba, O.S.; Sharma, A.; Sanadhya, M. Investigation to Measure Risk Free Exposure from Mobile Base Station Antennas in Residential Area. In Proceedings of the 2018 2nd International Conference on Micro-Electronics and Telecommunication Engineering (ICMETE), Ghaziabad, India, 20–21 September 2018; pp. 64–70. [Google Scholar] [CrossRef]
- Chiaraviglio, L.; Lodovisi, C.; Franci, D.; Grillo, E.; Pavoncello, S.; Aureli, T.; Blefari-Melazzi, N.; Alouini, M.-S. How Much Exposure from 5G Towers is Radiated over Children, Teenagers, Schools and Hospitals? IEEE Open J. Commun. Soc. 2022, 3, 1592–1614. [Google Scholar] [CrossRef]
- ICNIRP. Guidelines for limiting exposure to electromagnetic fields (100 kHz to 300 GHz). Health Phys. 2020, 118, 483–524. [Google Scholar] [CrossRef] [PubMed]
- ICNIRP. Guidelines for limiting exposure to time-varying electric, magnetic, and electromagnetic fields (up to 300 GHz). Health Phys. 1998, 74, 494–522. [Google Scholar]
- FCC USA, F.O.B. Evaluating Compliance with FCC Guidelines for Human Exposure to Radiofrequency Electromagnetic Fields, 1997; OET Bulletin 65; FCC OET: Washington, DC, USA, 1997.
- El-Beaino, W.; El-Hajj, A.M.; Dawy, Z. On Radio network planning for next-generation 5G networks: A case study. In Proceedings of the 2015 International Conference on Communications, Signal Processing, and their Applications (ICCSPA’15), Sharjah, United Arab Emirates, 17–19 February 2015; pp. 1–6. [Google Scholar] [CrossRef]
- Namdar, M.; Basgumus, A.; Guney, A. Performance analysis of the TOA cooperative localization estimation algorithm for 5G cellular networks. In Proceedings of the 2018 26th Signal Processing and Communications Applications Conference (SIU), Izmir, Turkey, 2–5 May 2018; pp. 1–4. [Google Scholar] [CrossRef]
- Blackman, C.; Forge, S. 5G deployment—State of Play in Europe, USA and Asia; Technical Report PE 631.060; Policy Department for Economic, Scientific and Quality of Life Policies Europian Parliament: Brussels, Belgium, 2019. [Google Scholar]
- Chiaraviglio, L.; Elzanaty, A.; Alouini, M.-S. Alouini, Health Risks Associated with 5G Exposure: A View from the Communications Engineering Perspective. IEEE Open J. Commun. Soc. 2021, 2, 2131–2179. [Google Scholar] [CrossRef]
- Markovic, V. 5G EMF Exposure: Overview of Recent Research and Safety Standard Updates. In Proceedings of the 2021 15th International Conference on Advanced Technologies, Systems and Services in Telecommunications (TELSIKS), Nis, Serbia, 20–22 October 2021; pp. 359–365. [Google Scholar] [CrossRef]
- Celaya-Echarri, M.; Azpilicueta, L.; Karpowicz, J.; Ramos, V.; Lopez-Iturri, P.; Falcone, F. From 2G to 5G Spatial Modeling of Personal RF-EMF Exposure Within Urban Public Trams. IEEE Access 2020, 8, 100930–100947. [Google Scholar] [CrossRef]
- Frisanco, T.; Tafertshofer, P.; Lurin, P.; Ang, R. Infrastructure Sharing and Shared Operations for Mobile Network Operators: From a Deployment and Operations View. In Proceedings of the 2008 IEEE International Conference on Communications, Salvador, Brazil, 7–11 April 2008; pp. 2193–2200. [Google Scholar] [CrossRef]
- GSMA. Mobile Infrastructure Sharing. June 2019. Available online: https://www.gsma.com/futurenetworks/wiki/infrastructure-sharing-an-overview/ (accessed on 1 October 2022).
- Kim, E.-S.; Sung, M.; Lee, J.H.; Lee, J.K.; Cho, S.-H.; Kim, J. Coverage Extension of Indoor 5G Network Using RoF-Based Distributed Antenna System. IEEE Access 2020, 8, 194992–194999. [Google Scholar] [CrossRef]
- Nokia. Network Sharing: Delivering Mobile Broadband More Efficiently and at Lower Cost, Nokia Network Sharing White Paper. Available online: https://www.nokia.com/networks/solutions/network-sharing/#overview (accessed on 1 October 2022).
- Elbasheir, M.S.; Saeed, R.A.; Ibrahim, A.A.Z.; Edam, S.; Hashim, F.; Fadul, S.M.E. A Review of EMF Radiation for 5G Mobile Communication Systems. In Proceedings of the 2021 IEEE Asia-Pacific Conference on Applied Electromagnetics (APACE), Penang, Malaysia, 20–22 December 2021; pp. 1–6. [Google Scholar] [CrossRef]
- Elbasheir, M.S.; Saeed, R.A.; Edam, S. 5G Base Station Deployment Review for RF Radiation. In Proceedings of the 2021 International Symposium on Networks, Computers, and Communications (ISNCC), Dubai, United Arab Emirates, 31 October–2 November 2021; pp. 1–5. [Google Scholar] [CrossRef]
- GSMA. Public Policy. 2019. Available online: https://www.gsma.com/publicpolicy/emf-and-health/emf-policy (accessed on 1 October 2022).
- IEC 62232:2017; Determination of RF Field Strength and SAR in the Vicinity of Radio Communication Base Stations for the Purpose of Evaluating Human Exposure. IEC Standard: Geneva, Switzerland, 2017.
- Thors, B.; Strydom, M.L.; Hansson, B.; Meyer, F.J.C.; Kärkkäinen, K.; Zollman, P.; Ilvonen, S.; Törnevik, C. On the Estimation of SAR and Compliance Distance Related to RF Exposure from Mobile Communication Base Station Antennas. IEEE Trans. Electromagn. Compat. 2008, 50, 837–848. [Google Scholar] [CrossRef]
- Kopacz, T.; Heberling, D. Impact of the Elevation Scanning Angle on the Vertical Compliance Distance of 5G Massive MIMO Antennas. In Proceedings of the 2019 13th European Conference on Antennas and Propagation (EuCAP), Krakow, Poland, 31 March–5 April 2019; pp. 1–5. [Google Scholar]
- Jain, A.; Tupe-Waghmare, P. Radiation measurements at repeated intervals for various locations of SIU campus and calculation of compliance distance from cell tower. In Proceedings of the 2016 International Conference on Automatic Control and Dynamic Optimization Techniques (ICACDOT), Pune, India, 9–10 September 2016; pp. 804–808. [Google Scholar] [CrossRef]
- Liu, S.; Onishi, T.; Taki, M.; Watanabe, S. Radio Frequency Electromagnetic Field Exposure Compliance Assessments of Smart Surfaces: Two Approximate Approaches. IEEE Trans. Electromagn. Compat. 2022, 64, 963–974. [Google Scholar] [CrossRef]
- Degirmenci, E.; Thors, B.; Tornevik, C. Assessment of Compliance With RF EMF Exposure Limits: Approximate Methods for Radio Base Station Products Utilizing Array Antennas With Beam-Forming Capabilities. IEEE Trans. Electromagn. Compat. 2016, 58, 1110–1117. [Google Scholar] [CrossRef]
- Velghe, M.; Aerts, S.; Martens, L.; Joseph, W.; Thielens, A. Protocol for personal RF-EMF exposure measurement studies in 5th generation telecommunication networks. Environ. Health 2021, 20, 36. [Google Scholar] [CrossRef] [PubMed]
- Velghe, M.; Shikhantsov, S.; Tanghe, E.; Martens, L.; Joseph, W.; Thielens, A. Exposure to RF-EMF hotspots induced by maximum ratio field combining in 5th generation networks. In BioEM 2020, Joint Annual Meeting of the Bioelectromagnetics Society and the European BioElectromagnetics Association, Abstract Collection; BioEM: Oxford, UK, 2020; pp. 380–384. [Google Scholar]
- Werner, R.; Knipe, P.; Iskra, S. A Comparison Between Measured and Computed Assessments of the RF Exposure Compliance Boundary of an In-Situ Radio Base Station Massive MIMO Antenna. IEEE Access 2019, 7, 170682–170689. [Google Scholar] [CrossRef]
- Pinchera, D.; Migliore, M.; Schettino, F. Compliance Boundaries of 5G Massive MIMO Radio Base Stations: A Statistical Approach. IEEE Access 2020, 8, 182787–182800. [Google Scholar] [CrossRef]
- Thors, B.; Colombi, D.; Ying, Z.; Bolin, T.; Tornevik, C. Exposure to RF EMF From Array Antennas in 5G Mobile Communication Equipment. IEEE Access 2016, 4, 7469–7478. [Google Scholar] [CrossRef]
- Aerts, S.; Wiart, J.; Martens, L.; Joseph, W. Assessment of long-term spatio-temporal radiofrequency electromagnetic field exposure. Environ. Res. 2018, 161, 136–143. [Google Scholar] [CrossRef] [PubMed]
- Aerts, S.; Deprez, K.; Colombi, D.; Bossche, M.V.D.; Verloock, L.; Martens, L.; Törnevik, C.; Joseph, W. In situ assessment of 5G NR massive MIMO base station exposure in a commercial network in Bern, Switzerland. Appl. Sci. 2021, 11, 3592. [Google Scholar] [CrossRef]
- Aerts, S.; Verloock, L.; Bossche, M.V.D.; Colombi, D.; Martens, L.; Tornevik, C.; Joseph, W. In-situ Measurement Methodology for the Assessment of 5G NR Massive MIMO Base Station Exposure at Sub-6 GHz Frequencies. IEEE Access 2019, 7, 184658–184667. [Google Scholar] [CrossRef]
- Mahbub, M.; Barua, B. Optimal Positioning of Macro Base Station: An Approach to Ensure Optimal Coverage of Small Cell in HetNet. In Proceedings of the 2021 IEEE International Conference on Electronics, Computing and Communication Technologies (CONNECT), Bangalore, India, 9–11 July 2021; pp. 1–4. [Google Scholar] [CrossRef]
- Elbasheir, M.S.; Saeed, R.A.; Edam, S. Measurement and Simulation-Based Exposure Assessment at a Far-Field for a Multi-technology Cellular Site up to 5G NR. IEEE Access 2022, 10, 56888–56900. [Google Scholar] [CrossRef]
- JianFeng, K.; Zhuyan, Z.; Hao, G.; Vejlgaard, B.; Guangyi, L. Vejlgaard and Liu Guangyi, TD-LTE network indoor performance with Micro and Femto deployment in a realistic metropolitan scenario. In Proceedings of the 2013 IEEE Wireless Communications and Networking Conference (WCNC), Shanghai, China, 7–10 April 2013; pp. 3948–3952. [Google Scholar] [CrossRef]
- Cichon, D.; Becker, T.C.; Döttling, M. Ray optical prediction of outdoor and indoor coverage in urban macro- and micro-cells. In Proceedings of the Proceeding of Vehicular Technology Conference-VTC, Atlanta, GA, USA, 28 April 1996–1 May 1996; Volume 1, pp. 41–45. [Google Scholar] [CrossRef]
- Atawia, R.; Ashour, M.; El Shabrawy, T.; Hammad, H. Optimized transmitted antenna power indoor planning using distributed antenna systems. In Proceedings of the 2013 9th International Wireless Communications and Mobile Computing Conference (IWCMC), Sardinia, Italy, 1–5 July 2013; pp. 993–1000. [Google Scholar] [CrossRef]


| Exposure Limit | Freq. Range | E-Field (V/m) | H-Field (A/m) | PD (W/m2) |
|---|---|---|---|---|
| ICNIRP-OW | 0.1–30 MHz | NA | ||
| 300–400 MHz | 61 | 0.16 | 10 | |
| 400–200 MHz | ||||
| 2–300 GHz | NA | NA | 50 | |
| ICNIRP-GP | 0.1–30 MHz | NA | ||
| 300–400 MHz | 27.7 | 0.073 | 2 | |
| 400–200 MHz | ||||
| 2–300 GHz | NA | NA | 10 | |
| FCC-OW | 0.3–0.3 MHz | 614.0 | 1.630 | 100.0 |
| 3.0–30 MHz | 1842/f | 4.89/f | 900/ | |
| 30–300 MHz | 61.40 | 0.163 | 1.00 | |
| 0.3–1.5 GHZ | - | - | f/300 | |
| 1.5–100 GHz | - | - | 5.00 | |
| FCC-GP | 0.3–1.34 MHz | 614.0 | 1.630 | 100 |
| 1.34–30 MHz | 824/f | 2.19/f | 180/ | |
| 30–300 MHz | 27.50 | 0.0730 | 0.20 | |
| 0.3–1.5 GHz | - | - | f/1500 | |
| 1.5–100 GHz | - | - | 1.00 |
| Site Setting | 2G G900 | 3G U900 | 4G L800 | 4G L1800 | 4G L2100 | 5G N3500 |
|---|---|---|---|---|---|---|
| Freq. Band (MHz) | 900 | 900 | 800 | 1800 | 2100 | 3500 |
| Freq. BW (MHz) | 5 | 5 | 10 | 20 | 20 | 100 |
| Total Tx | 2 | 1 | 2 | 2 | 4 | 64 |
| Total Rx | 2 | 1 | 2 | 2 | 4 | 64 |
| Power Tx | 40 W | 40 W | 80 W | 80 W | 80 W | 160 W |
| System Load | 95% | 95% | 95% | 95% | 95% | 95% |
| Ant. Gain | 17 dBi | 17 dBi | 16.7 dBi | 16.6 dBi | 17 dBi | 24.8 dBi |
| Limits | Compliance Distance (m) | ||||||
|---|---|---|---|---|---|---|---|
| 1MNO | 2xMNO | % | 3xMNO | % | 4xMNO | % | |
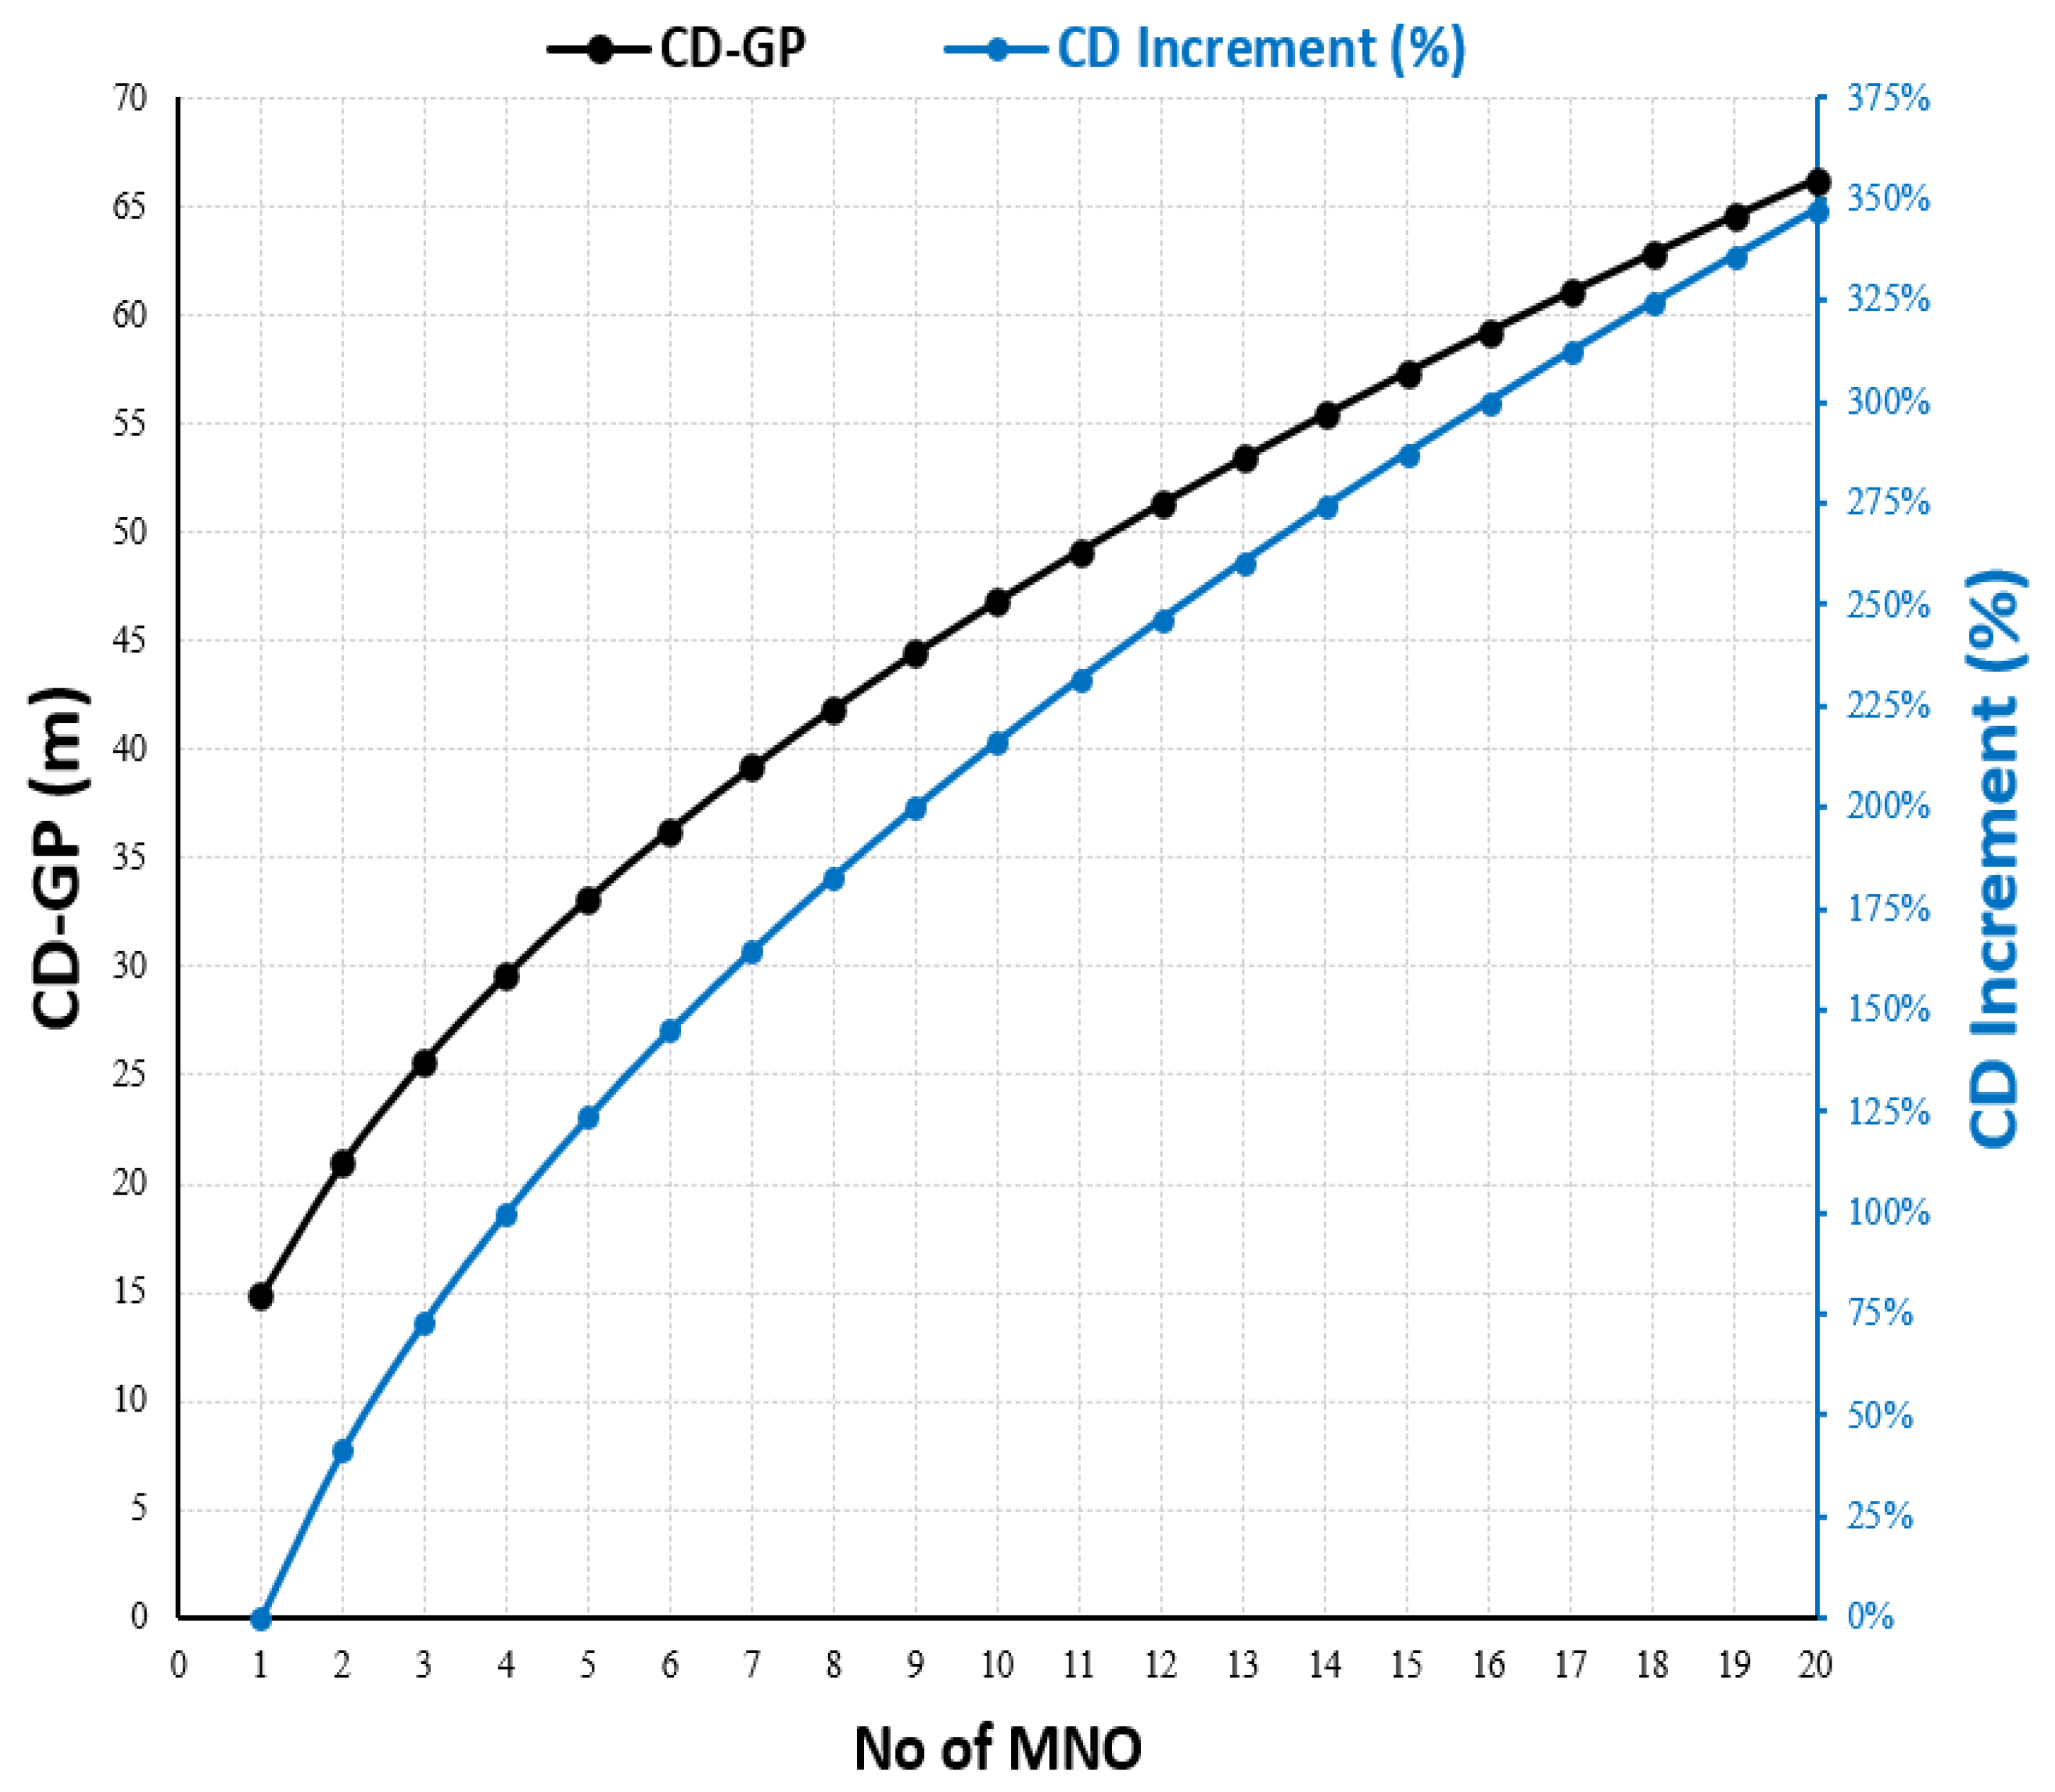
| INCIRP | 14.8 | 20.9 | +41% | 25.6 | +73% | 29.6 | +100% |
| FCC | 13.8 | 19.6 | +41% | 24.0 | +73% | 27.7 | +100% |
| INCIRP | 6.6 | 9.4 | +41% | 11.5 | +73% | 13.2 | +100% |
| FCC | 6.2 | 8.8 | +41% | 10.7 | +73% | 12.4 | +100% |
| INCIRP | 6.5 | 9.2 | +41% | 11.3 | +73% | 13.0 | +100% |
| FCC | 5.9 | 8.3 | +41% | 10.2 | +73% | 11.8 | +100% |
| INCIRP | 2.9 | 4.1 | +41% | 5.0 | +73% | 5.8 | +100% |
| FCC | 2.6 | 3.7 | 41% | 4.6 | 73% | 5.3 | 100% |
| Limits | Compliance Distance (m) | ||||||
|---|---|---|---|---|---|---|---|
| 1MNO | 2xMNO | % | 3xMNO | % | 4xMNO | % | |
| INCIRP | 0.9 | 1.2 | +41% | 1.5 | +73% | 1.7 | +100% |
| FCC | 0.8 | 1.1 | +41% | 1.4 | +73% | 1.6 | +100% |
| INCIRP | 0.4 | 0.6 | +41% | 0.7 | +73% | 0.8 | +100% |
| FCC | 0.4 | 0.5 | +41% | 0.6 | +73% | 0.7 | +100% |
| INCIRP | 0.4 | 0.6 | +41% | 0.7 | +73% | 0.8 | +100% |
| FCC | 0.4 | 0.5 | +41% | 0.6 | +73% | 0.7 | +100% |
| INCIRP | 0.2 | 0.3 | +41% | 0.3 | +73% | 0.4 | +100% |
| FCC | 0.2 | 0.2 | +41% | 0.3 | +73% | 0.3 | +100% |
Disclaimer/Publisher’s Note: The statements, opinions and data contained in all publications are solely those of the individual author(s) and contributor(s) and not of MDPI and/or the editor(s). MDPI and/or the editor(s) disclaim responsibility for any injury to people or property resulting from any ideas, methods, instructions or products referred to in the content. |
© 2023 by the authors. Licensee MDPI, Basel, Switzerland. This article is an open access article distributed under the terms and conditions of the Creative Commons Attribution (CC BY) license (https://creativecommons.org/licenses/by/4.0/).
Share and Cite
Elbasheir, M.S.; Saeed, R.A.; Edam, S. Multi-Technology Multi-Operator Site Sharing: Compliance Distance Analysis for EMF Exposure. Sensors 2023, 23, 1588. https://doi.org/10.3390/s23031588
Elbasheir MS, Saeed RA, Edam S. Multi-Technology Multi-Operator Site Sharing: Compliance Distance Analysis for EMF Exposure. Sensors. 2023; 23(3):1588. https://doi.org/10.3390/s23031588
Chicago/Turabian StyleElbasheir, Mohammed S., Rashid A. Saeed, and Salaheldin Edam. 2023. "Multi-Technology Multi-Operator Site Sharing: Compliance Distance Analysis for EMF Exposure" Sensors 23, no. 3: 1588. https://doi.org/10.3390/s23031588