Article

Opera 2015 Project: Accurate Measurement Equipment for Earthquake Electromagnetic Emissions and Radio Seismic Indicator

1
Independent Researcher, Str. Luisetti 12, 10040 Cumiana, Italy
2
Independent Researcher, 10053 Bussoleno, Italy
3
Broadcasting Network Supervision, World Family of Radio Maria, 10100 Turin, Italy
4
Department of Electrical, Electronic and Telecommunications Engineering, and Naval Architecture, University of Genova, 16145 Genova, Italy
*
Author to whom correspondence should be addressed.
Sensors 2023, 23(5), 2379; https://doi.org/10.3390/s23052379
Submission received: 5 January 2023 / Revised: 13 February 2023 / Accepted: 14 February 2023 / Published: 21 February 2023
(This article belongs to the Collection Seismology and Earthquake Engineering)

Abstract

:
Electromagnetic emissions from earthquakes are known as precursors and are of considerable importance for the purpose of early alarms. The propagation of low-frequency waves is favored, and the range between tens of mHz to tens of Hz has been heavily investigated in the last thirty years. This work describes the self-financed Opera 2015 project that initially consisted of six monitoring stations over Italy, equipped with electric and magnetic field sensors, among others. Insight of the designed antennas and low-noise electronic amplifiers provides both characterization of performance (similar to the best commercial products) and the elements to replicate the design for our own independent studies. Measured signals through data acquisition systems were then processed for spectral analysis and are available on the Opera 2015 website. Data provided by other world-known research institutes have also been considered for comparison. The work provides examples of processing methods and results representation, identifying many exogenous noise contributions of natural or human-made origin. The study of the results occurred for some years and led us to think that reliable precursors are confined to a short area around the earthquake due to the significant attenuation and the effect of overlapping noise sources. To this aim, a magnitude-distance indicator was developed to classify the detectability of the EQ events observed during 2015 and compared this with some other known earthquake events documented in the scientific literature.

1. Introduction

An earthquake (EQ) can be a source of electromagnetic waves, in particular at low frequency, with a favorable propagation through the crust to the surface, where ground-based stations are located. Attenuation, in fact, becomes significant as soon as the frequency reaches values of 100 Hz. Emissions are associated directly with the EQ or may precede it, sometimes by several weeks. These electromagnetic field emissions may be exploited as precursors (often named “radio precursors” or “radio seismic precursors”), able to anticipate seismic events. There are different opinions on the detectability of such precursors, with some authors asserting a worldwide detectability, at least for the most intense EQs, such as those with a Richter magnitude above 6 or so [1,2,3].
Trivially, if radio seismic precursors exist, they will be easily received near the EQ and if the EQ has high intensity. Since the possibility of propagation of a signal in the ground increases with the wavelength, it is most likely that if radio waves are generated at depth, then only those waves with the lowest frequencies will be able to emerge at the surface. Low frequencies imply long wavelengths and long Fresnel distances [4] so in most cases, the monitoring station will be in the reactive region.
A range of precursors have been reported and discussed as early as in the 1990s [5], in particular after the significant EQ event of Loma Prieta [6]: both electric and magnetic field changes in the lithosphere were identified, although the quality and quantity of measurements were limited until approximately the turn of the millennium; Uyeda et al. [7], for example, reported evidence of seismo-electromagnetic phenomena below the extremely low-frequency (ELF) range (3–30 Hz), corroborated by many other studies in the following years, as listed in [5]. The discussion on the reproducibility and effectiveness of such findings and on the identification of a set of reliable indicators of the electromagnetic type is still ongoing, possibly extending the range of electromagnetic phenomena to the total electron content (TEC) [8,9,10] or plasma anomalies [5], although there is the concomitant influence of radon ionization [11], as well pointed out in [8], and some previous studies concluded on the lack of statistically significant traces with the state-of-the-art measurements at that time [12,13,14].
The Opera 2015 project [15], a self-financed project, carried out systematic ELF monitoring during 2015 from six ground stations in Italy with the objective of collecting a wide range of electromagnetic (e.m.) signals and to post-process them by looking for precursors. Although the collective effort of data gathering was concentrated in 2015, the activity has continued in successive years. The collected data turned out to be useful for some recent scientific work thanks to their completeness [16].
Reported e.m. emissions are concentrated mainly at frequencies bracketing the Schumann resonance, SR (nominally at 7.83 Hz), located within the ELF interval, and then going down to some tens of mHz (as analyzed in [7]). Due to significant e.m. pollution caused by natural and human activity, sensitive instruments and sophisticated processing techniques are used: directional and sensitive magnetic solenoids, large electric field wire antennas, low-noise stable electronic circuits for buffering and amplification and a wide range of signal processing methods (e.g., spectral and fractal analysis, principal component analysis and direction finding).
In particular, magnetic field emissions can be measured with a significant directivity by means of induction coils (solenoids) [17,18,19]: a two-axes arrangement with orthogonal coils is able to detect the direction of arrival; the larger the solenoid (in terms of area and number of turns) and the larger the captured signal, although winding resistance and inductance increase (and thus the internal impedance). A length/diameter ratio larger than 10 favors directivity and is commonly used for search coils.
E.m. pollution can both affect the quality of recorded signals and provide false positive e.m. anomalies associated with precursors. The ELF band is characterized by a myriad of natural signals, such as geomagnetic pulsations, the mentioned Schumann resonances, solar storms and electrostatic discharges (in particular, around thunderstorms). We can add to these signals other disturbances of human origin, such as industrial processes employing large current intensity and following work cycles of seconds and fractions of a second, as well as electrified railways. We obtain thus a picture of a band populated by a large number of signals, differing from each other not only in terms of frequency and amplitude but also duration, intermittency and general, statistical behavior. A great effort is thus necessary to first remove all e.m. disturbance, often making signal acquisition at particular parts of the day impossible.
This paper describes, in Section 2, the Opera 2015 project and the instrumentation used at the various stations, going into some relevant details of the designed sensors and electronics; one of the main purposes of this paper is, in fact, enabling the reader to replicate (and improve) the instrumentation, increasing the number of existing stations and the chance of capturing significant e.m. phenomena to enlarge the dataset of available signals. Section 3 lists the most relevant EQ events that were recorded and have been used since then for analysis and comparison, exemplified in Section 4, which provides details of the spectral components and combined behavior of sensors’ signals. Section 5 then discusses the experience regarding the detectability of precursors for EQ events and presents the expression of an indicator that takes into account magnitude and distance to decide on the detectability of e.m. precursors.

2. Opera Project Description and Instrumentation

The measurement campaign collected data from 14 sensors positioned in 6 different locations of high seismic activity. The monitoring stations were continuously active for a total of more than 110,000 recording hours during the project. A total of 15,532 EQs detected during 2015 by the Italian Institute of Geophysics and Volcanology were evaluated, so an average of 40 earthquakes per day. Six monitoring stations were active with various combinations of measurement instruments, as reported in Table 1 and graphically described in Figure 1.
Earth’s magnetic field parameters at the stations are then reported in Table 2: the dipole and quasi-dipole information [20] has been calculated using the model proposed by Emmert et al. [21] and available in [22]; the seven magnetic field parameters (declination, D, inclination, I, North oriented intensity, X, Eastern oriented intensity, Y, horizontal intensity, H, vertical intensity, Z, and total intensity, F, as main field components and secular variation, expressed as variation per year) have been calculated using the IGRF model [23,24]. For these calculations, the reference date was taken as 30 June 2015, so intermediate over the time span of project data.
Two of the former monitoring stations have recently ceased their activity (Rifugio Pontese, PNT, and Torino VLF, TUR), leaving Cumiana station in the Piemonte region, but two new stations have been added in two otherwise uncovered parts of Italy: Sos Enattos (SOS) in Sardinia, to host the Einstein Telescope for the study of gravitational waves, and Cascina, Pisa (VRG), at the Virgo center, the European Gravitational Observatory.
The instrumentation, succinctly listed in Table 1, is better described and characterized in the following.

2.1. Induction Coil

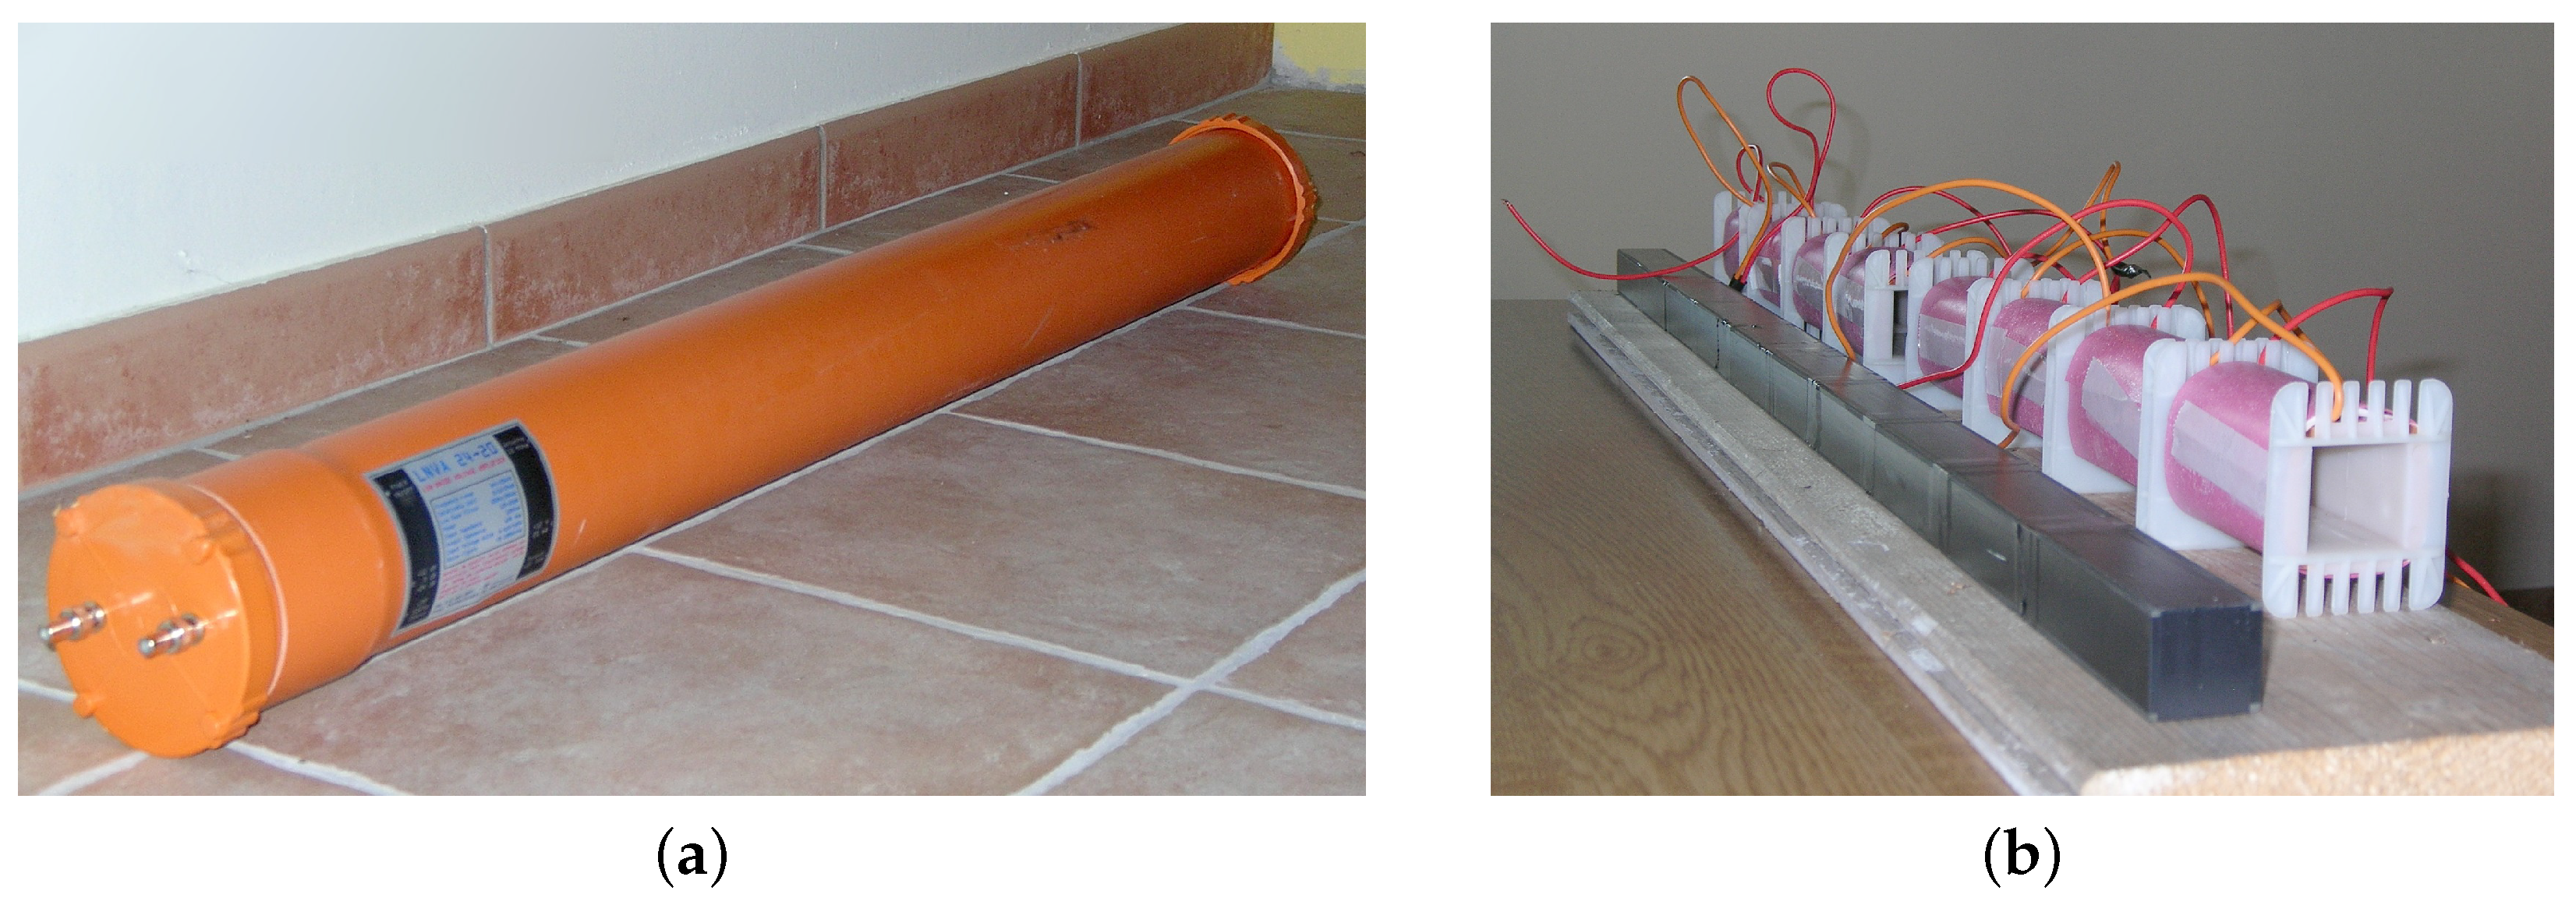
The magnetic field sensor is an induction coil (solenoid), identified as ICS101 and developed as part of the OpenLab project (documented in the Opera 2015 website [15]). Contrary to other air coil arrangements [25] for the purpose of environmental measurements with a large angle and low directivity, the coil is not only significantly long but uses a high-permeability core rather than air. The coil is built around a composite core made of aligned high-permeability ferrite cores, commercially available for power converter applications. The material is Ferroxcube 3C90, and 10 ferrite bars (30 × 28 × 93 mm) were mounted next to each other for a total length of 93 cm. The ferrite core is longer than the overall winding, and two end sections are made of ferrite elements only, with the central eight providing the solenoid sections; the reason is to limit the end effects and better shape the magnetic field lines. The winding was divided into eight sections to lower the self-resonance: it consists of 96,000 turns of enameled copper wire for a total of 2.5 kg of copper and a length of more than 13 km of wire. The ferrite core and coils and the final assembly are shown in Figure 2.
Like all H-field antennas, this induction coil was externally shielded to attenuate E-field pick-up, using a tiny metallic grid arranged so as to break electrical continuity, avoiding a short-circuited turn impairing the solenoid operation. In [25], where the coil has a much smaller size, this was instead achieved by applying an insulated gapped copper strip on top of the circular winding, providing a dielectric layer to reduce stray capacitance terms toward the added shield.
The signal from the induction coil is conditioned by a custom-made large-gain amplifier, whose schematic is visible in Figure 3.
The coil amplifier is floating and has a symmetric structure, with the coil shield terminated on its signal ground. The coil current, rather than the coil voltage, is read on a virtual ground at the OA terminals by means of a transconductance amplifier circuit; this linearizes the frequency response avoiding the derivative effect. The derivative was instead exploited in [25] to increase the coil sensitivity and then stopped by using a low-pass filter at a conveniently large frequency.
The parallel circuit between the 220 pF capacitor and 3.3 M Ω resistor captures the coil-self resonance at about 200 Hz, reducing the gain of the stage for increasing frequency above it.
The output stage provides a variable gain selectable between 1 and 100 in 20 dB steps.
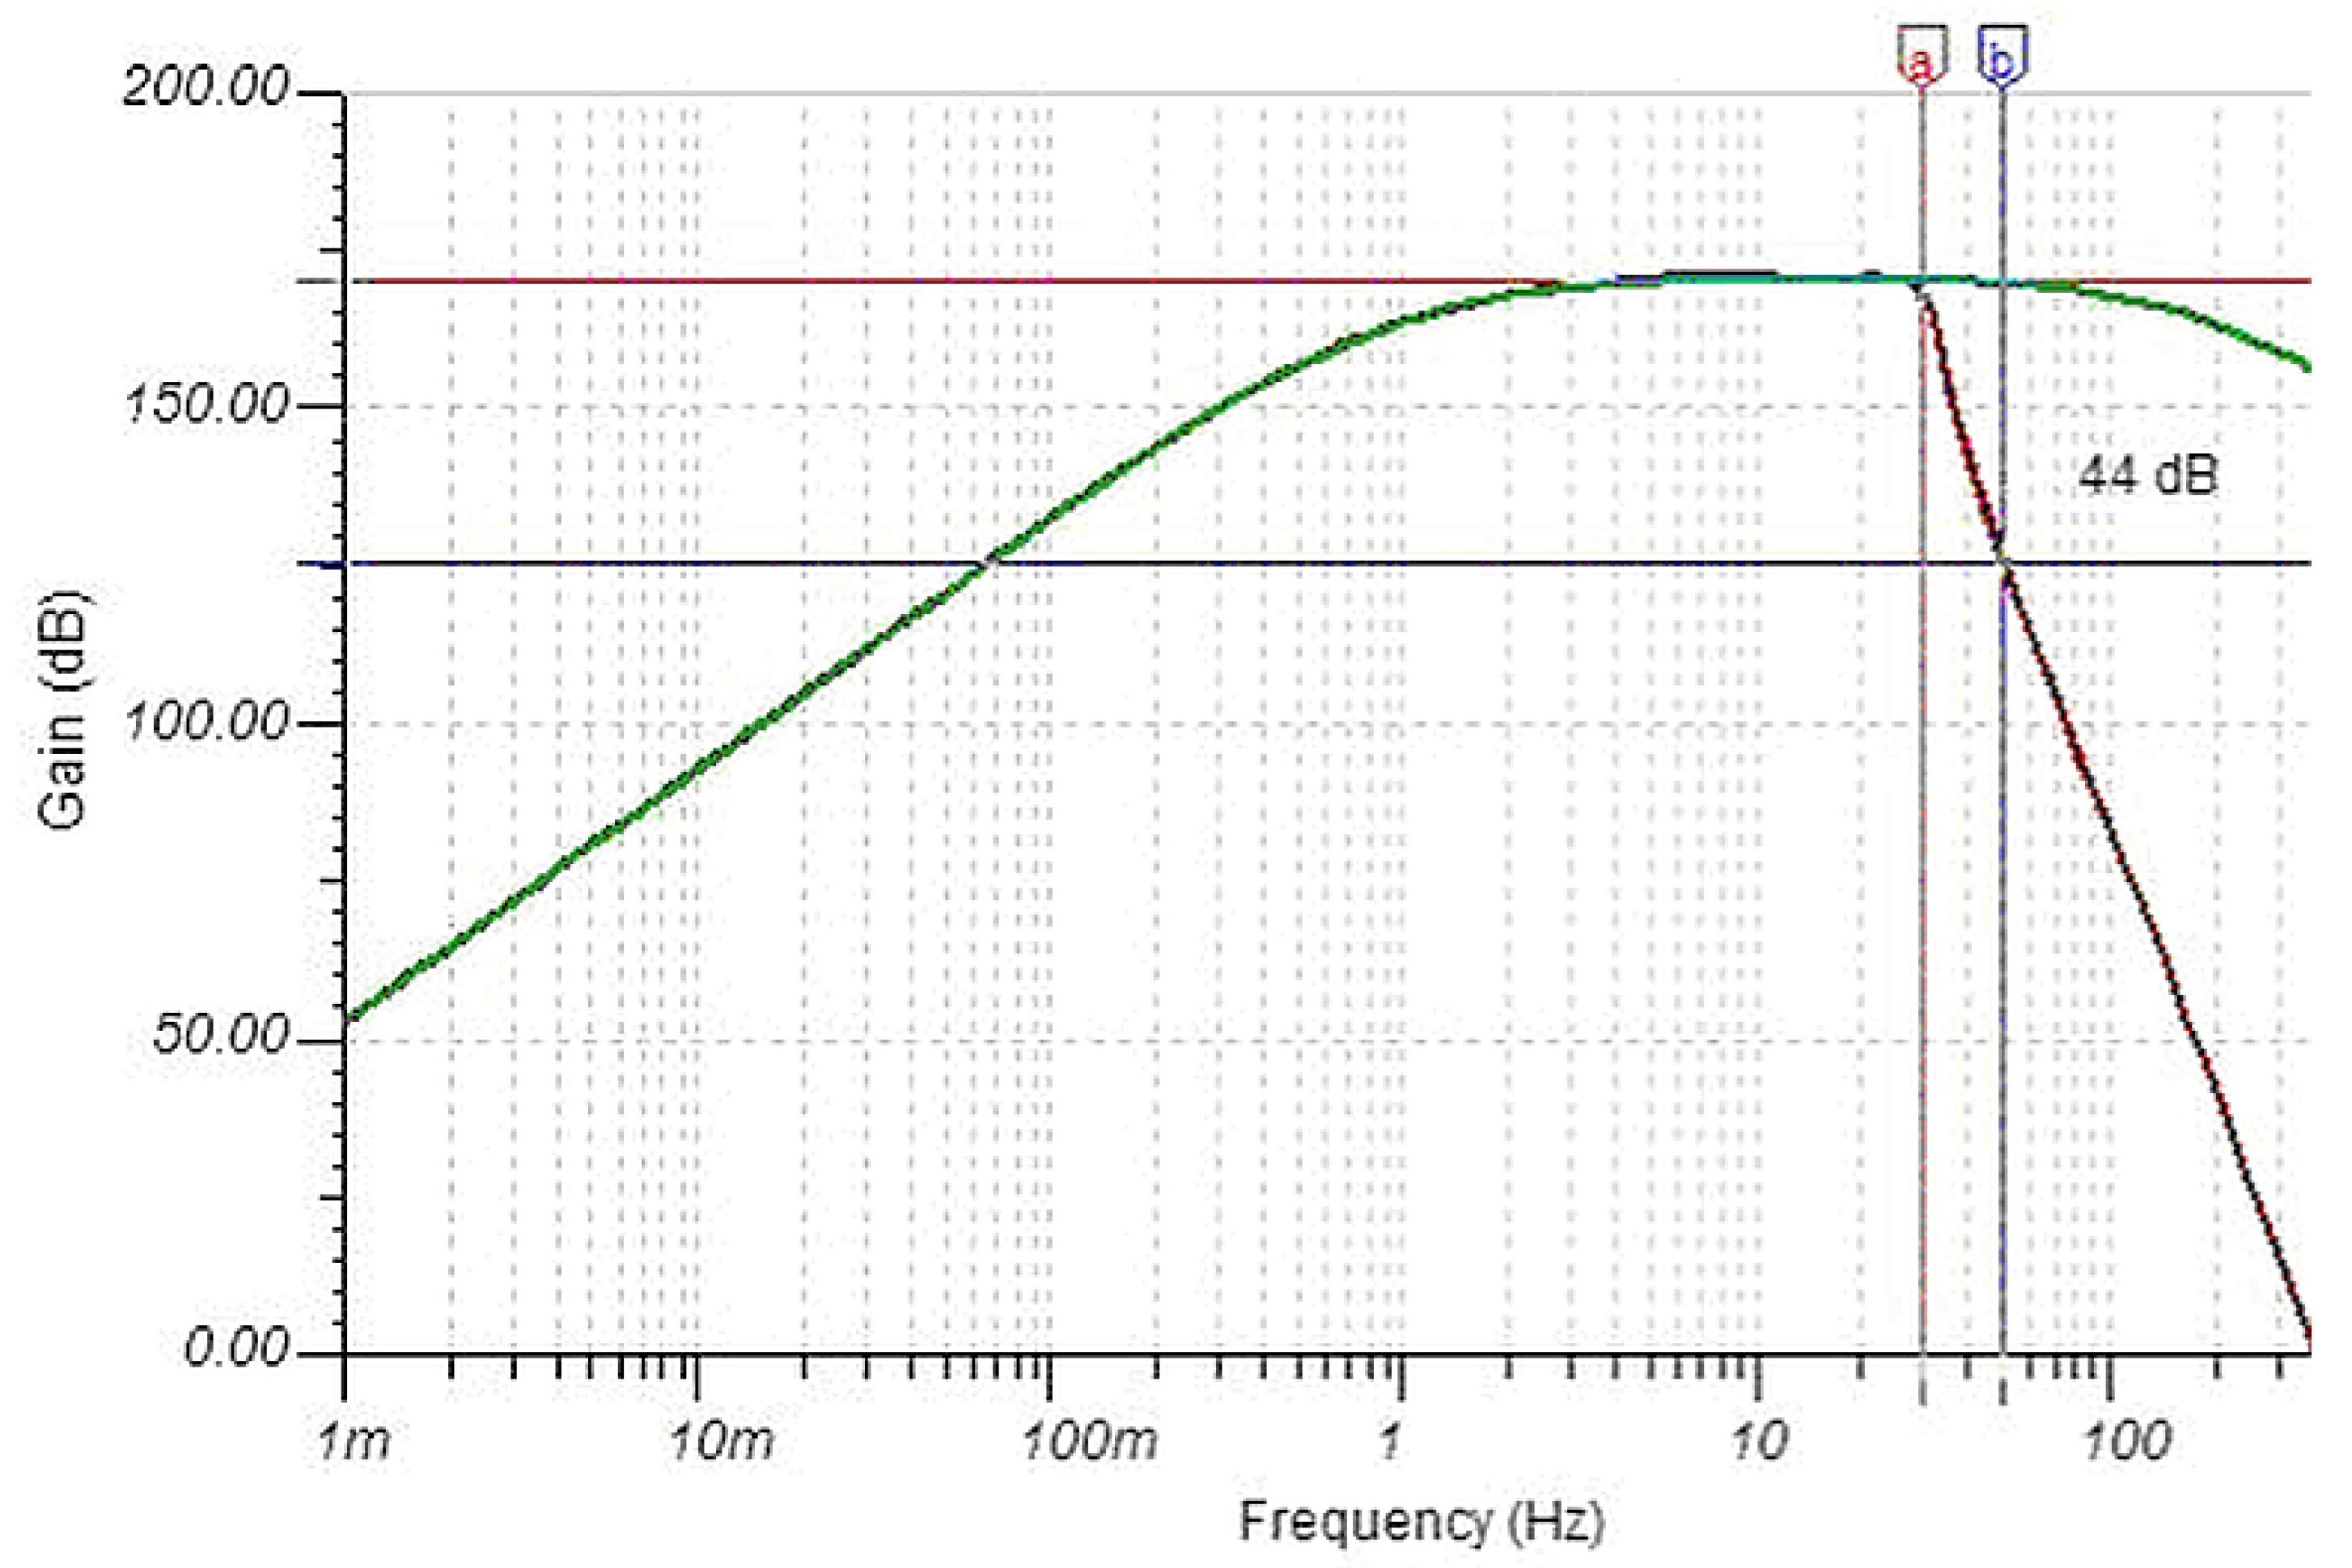
As shown in Figure 4, the performance is comparable to the best commercial products with an important option:
  • a Chebychev 30 Hz 6-pole low-pass filter (LPF) (visible as three cascaded cells between “Filter in” and “Filter out” in Figure 3) implemented in a Sallen–Key architecture; it ensures 44 dB of attenuation at the 50 Hz disturbing frequency with a well-usable bandwidth around and above the Schumann resonance.
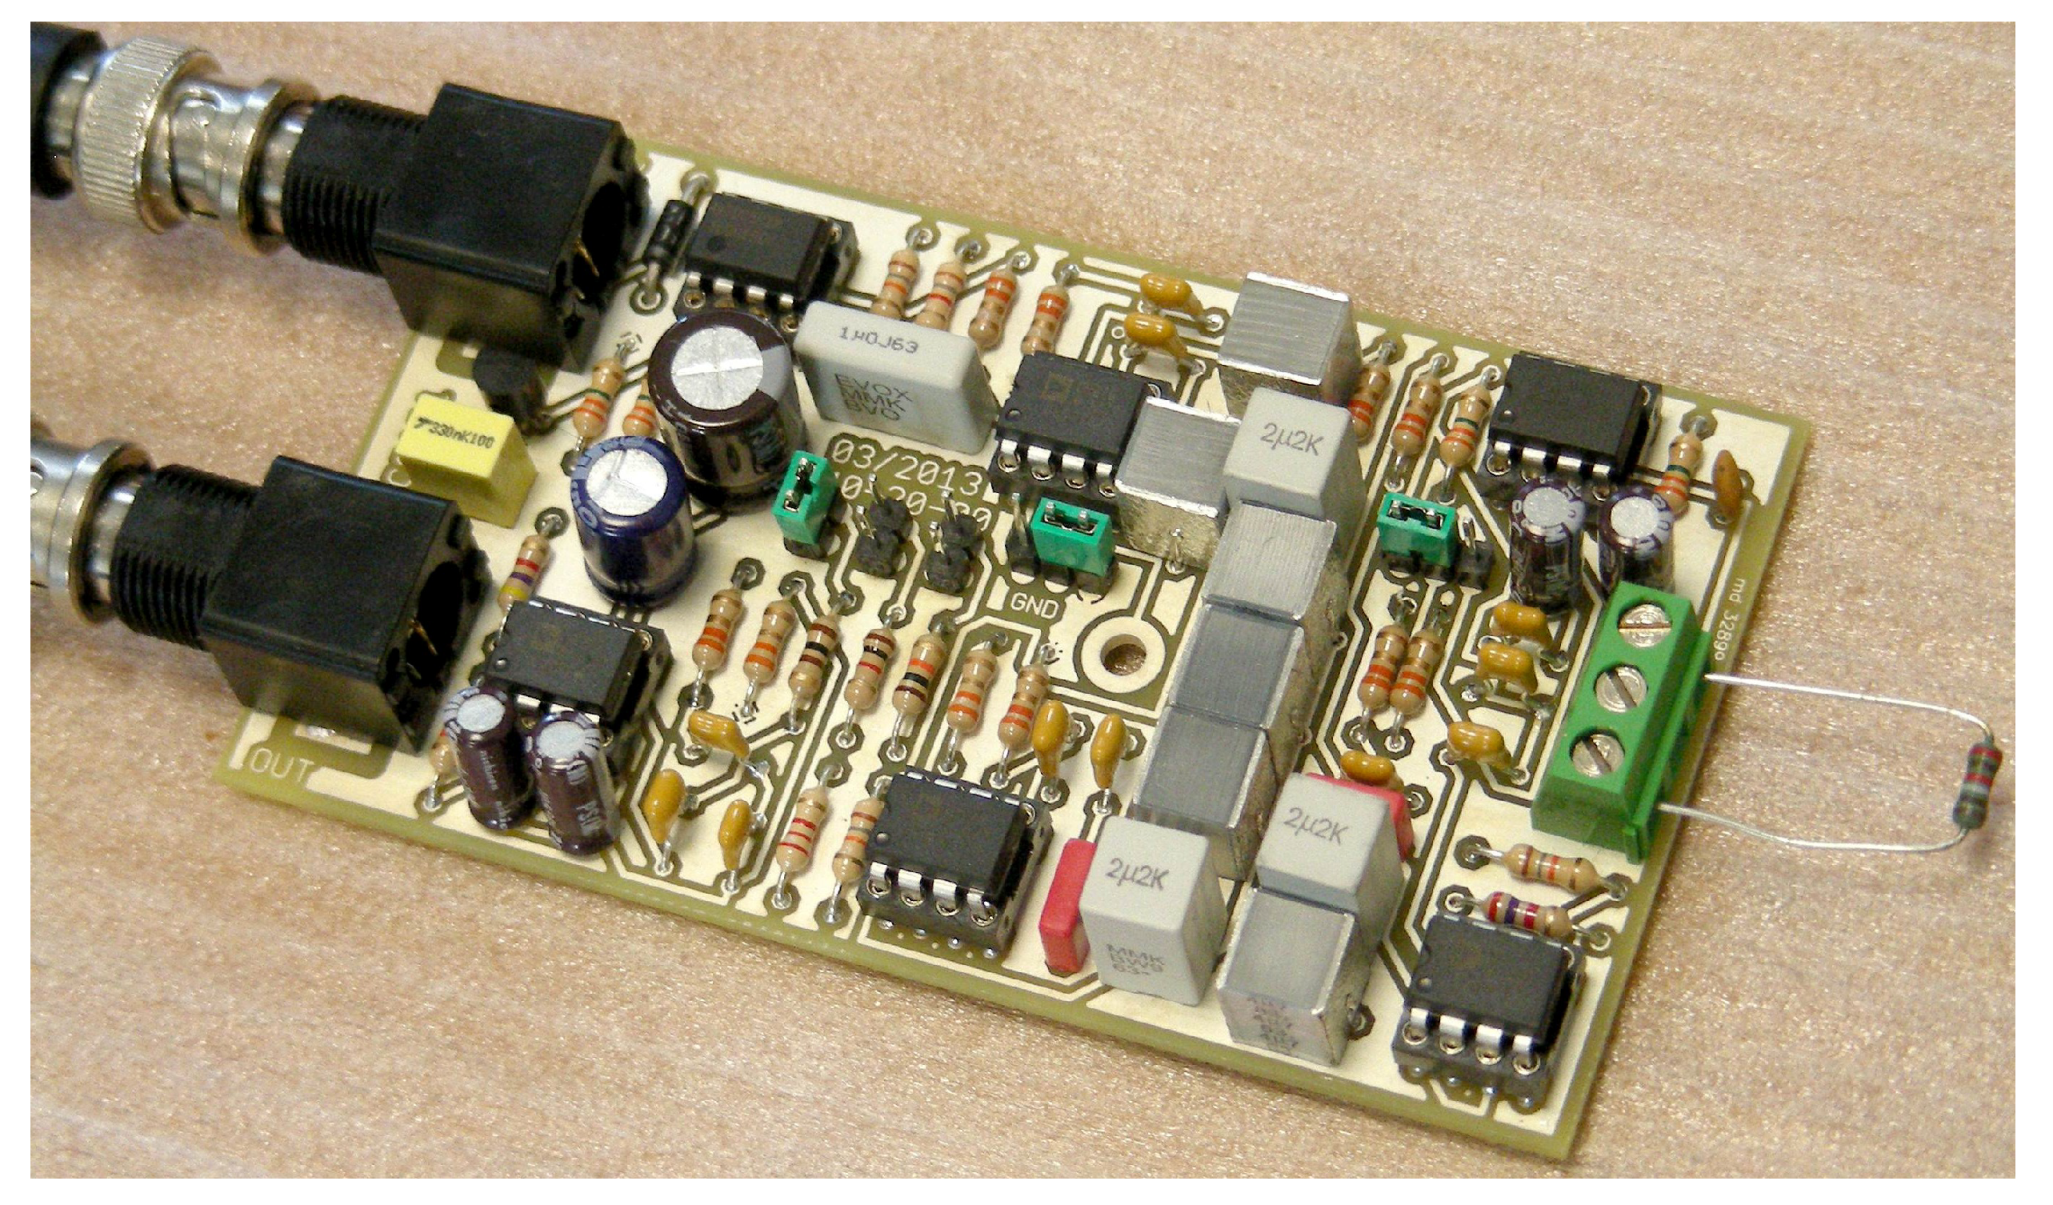
The filter uses feedback capacitors of quite a large value ( 6.8   μ F and 22 μ F ) due to the low cut-off frequency achieved, which cannot be of the electrolytic type and are to be built with parallel connection of the largest available samples of the non-polarized type, e.g., polyester capacitors. Polyester capacitors have very linear behavior and are quite stable with respect to temperature changes. They are visible as gray blocks on the printed circuit board of Figure 5.
The characteristics of the induction coil system used as an H-field sensor are summarized in Table 3.
The reported equivalent input noise does not depend on the gain since the noise sources are all located at the input stage:
  • the input voltage noise e n of the input Operational Amplifier (OA) itself; the selected OA was a TL071 [26] or TL081 [27] due to a matter of availability, so e n = 18   n V / Hz at 1 kHz and e n = 0.4   μ V overall over the 10 Hz to 10 kHz frequency interval;
  • the input current noise i n is quite low, being a CMOS architecture (the reason for the selection), which well matches the moderately large source impedance represented by the coil reactance and resistance (about 100 k Ω for the former, given by the 1650 H inductance at 10 Hz, and 11,220 Ω for the latter); this amounts to only 1 nV/ Hz , which is negligible;
  • the thermal noise of the winding resistance, e R , n , for the said 11,220 Ω corresponds to 13.8 nV/ Hz .
The overall noise is the rms composition of the two noise voltage sources e n and e R , n :
e t o t , n = e n 2 + e R , n 2 = 22.7 n V / Hz
It is observed that the equivalent input magnetic noise (calculable from the equivalent noise voltage e n and the coil antenna factor A F as 0.1 pT/ Hz in the range 0.1–10 Hz) is better than high-performance SQUID sensors [28]. Its performance in terms of antenna factor (also called simply “gain” or “sensitivity”) are almost identical to the THEMIS search coil magnetometer [29]. The LEMI 120 coil [18] (recently used for investigations of EQs in India [30]) exhibits a similar performance down to about 0.1 Hz and can thus be considered equivalent. On the contrary, the reported performance is much better than all the compared compact high-resolution magnetometers in [31], except for the atomic magnetometer.
The expression “ferrite core” followed by “voltage gain” and “impedance increase” [32] indicates what the effect of inserting the ferrite core into the coil is: the output voltage increases (higher sensitivity), but at the same time, the coil inductance (and thus the internal impedance) increases. The latter must be duly considered when designing the input stage impedance not to deteriorate the improved sensitivity with the coil internal voltage drop.

2.2. Electric Field Sensor

The electric field (E-field) sensor is built around a large Marconi wire antenna using a 10-m-high T-shaped aerial with a 15 m capacitive cap (increasing the total antenna capacitance and thus reducing its input impedance), as shown in Figure 6. A spherical electrode (as commonly used for high-voltage testing) has been proposed sometimes, but it is more affected by local effects (such as wind and animals moving nearby), and the weight and lift are more critical (especially in the case of strong wind) and the overall gain is lower. The received Schumann resonance signal of the Marconi antenna is strong and stable, and the bandwidth extends down to a few tenths of Hz.
A LNVA-20-24 voltage pre-amplifier, built around an Analog Devices AD 820 [33] OA and featuring a large 10 M Ω input impedance, is directly connected at the base of the antenna. The schematic is shown in Figure 7, and its realization, including the watertight metallic housing, is shown in Figure 8.
As the input signal is exposed to outdoor e.m. threats (in particular high-frequency radio pollution and overvoltages), the input line is protected against the former by a VK200 RF ferrite and by two diodes (obtained using two short-circuited BC237 transistors), clamping the potential between the two power rails of 0 V and 12 V through the 100 k Ω resistor.
Its output impedance was optimized for connection to a sound card by inserting a 620 Ω resistor and low-pass filtering the output while removing, at the same time, any DC offset by a series-connected 220 μ F capacitor.
The bandwidth was defined by the combination of the 10 M Ω and 22 nF input resistor and capacitor (giving about 0.7 Hz of high-pass corner frequency) and the parallel of 100 k Ω and 15 nF in the feedback network above the OA (giving about 100 Hz of low-pass corner frequency). The latter is an option without which the bandwidth extends up to about 15 kHz.
The main characteristics of the LNVA-20-24 amplifier are summarized in Table 4.
It is observed that the selected AD820 [33] has such a low input noise current, i n ( 18 fApp between 0.1 Hz and 10 Hz, and 0.8 fA/ Hz at 1 kHz), it makes the voltage drop noise on the input resistor lower than the OA input noise voltage e n , as shown below. The only relevant contributing term is then the thermal noise of the input terminating 10 M Ω resistor.
The reported equivalent input noise does not depend on the gain since the noise sources are all located at the input stage:
  • the OA input voltage noise e n = 25   n V / Hz at 10 Hz, e n = 100   n V / Hz at 1 Hz, and e n = 2   μ V p p overall over the 0.1 to 10 Hz frequency interval;
  • the input current noise, i n , is quite low for a CMOS architecture (the reason for the selection): i n = 18   f A p p overall over the 0.1 Hz to 10 Hz; this well withstands the large input and source impedance represented by the antenna reactance and the 10 M Ω resistor, resulting in about 0.18   μ Vpp/ Hz , remaining negligible with respect to the noise voltage e n , even including the increasing antenna reactance at lower frequencies;
  • the thermal noise of the 10 M Ω input resistor corresponding to 0.41   μ V/ Hz representing the largest noise contribution.
The overall noise is thus contributed almost entirely by the input resistor, except possibly at the lowest frequencies, around 0.1 Hz or so, where a slight increase could be expected.

2.3. Geophone

Many monitoring stations of the Opera 2015 project were also equipped with a vertical geophone, connected to a special low-noise pre-amplifier, also suitable to drive a sound card. The device is not a substitute for the seismograph but allows discriminating when ground vibrations can induce microphonic effects on the induction coil. False positives, in fact, can originate from vibrations next to the monitoring station (e.g., traffic on a road nearby, rolling noise from transportation systems or heavy construction activity), causing a microphonic effect on coils moving in the otherwise static Earth’s magnetic field.
In addition, the available geophone signal allows the identification of the arrival of seismic vibrations at the station, aligning with any microphonic effect in the H-field and possibly E-field sensors. Signals occurring between the occurrence of the EQ and its arrival at the station are caused by the piezoelectric effect and, in general, electro-seismic effects, at the originating seismic fracture or along the path (traveling faster than the acoustic waves).
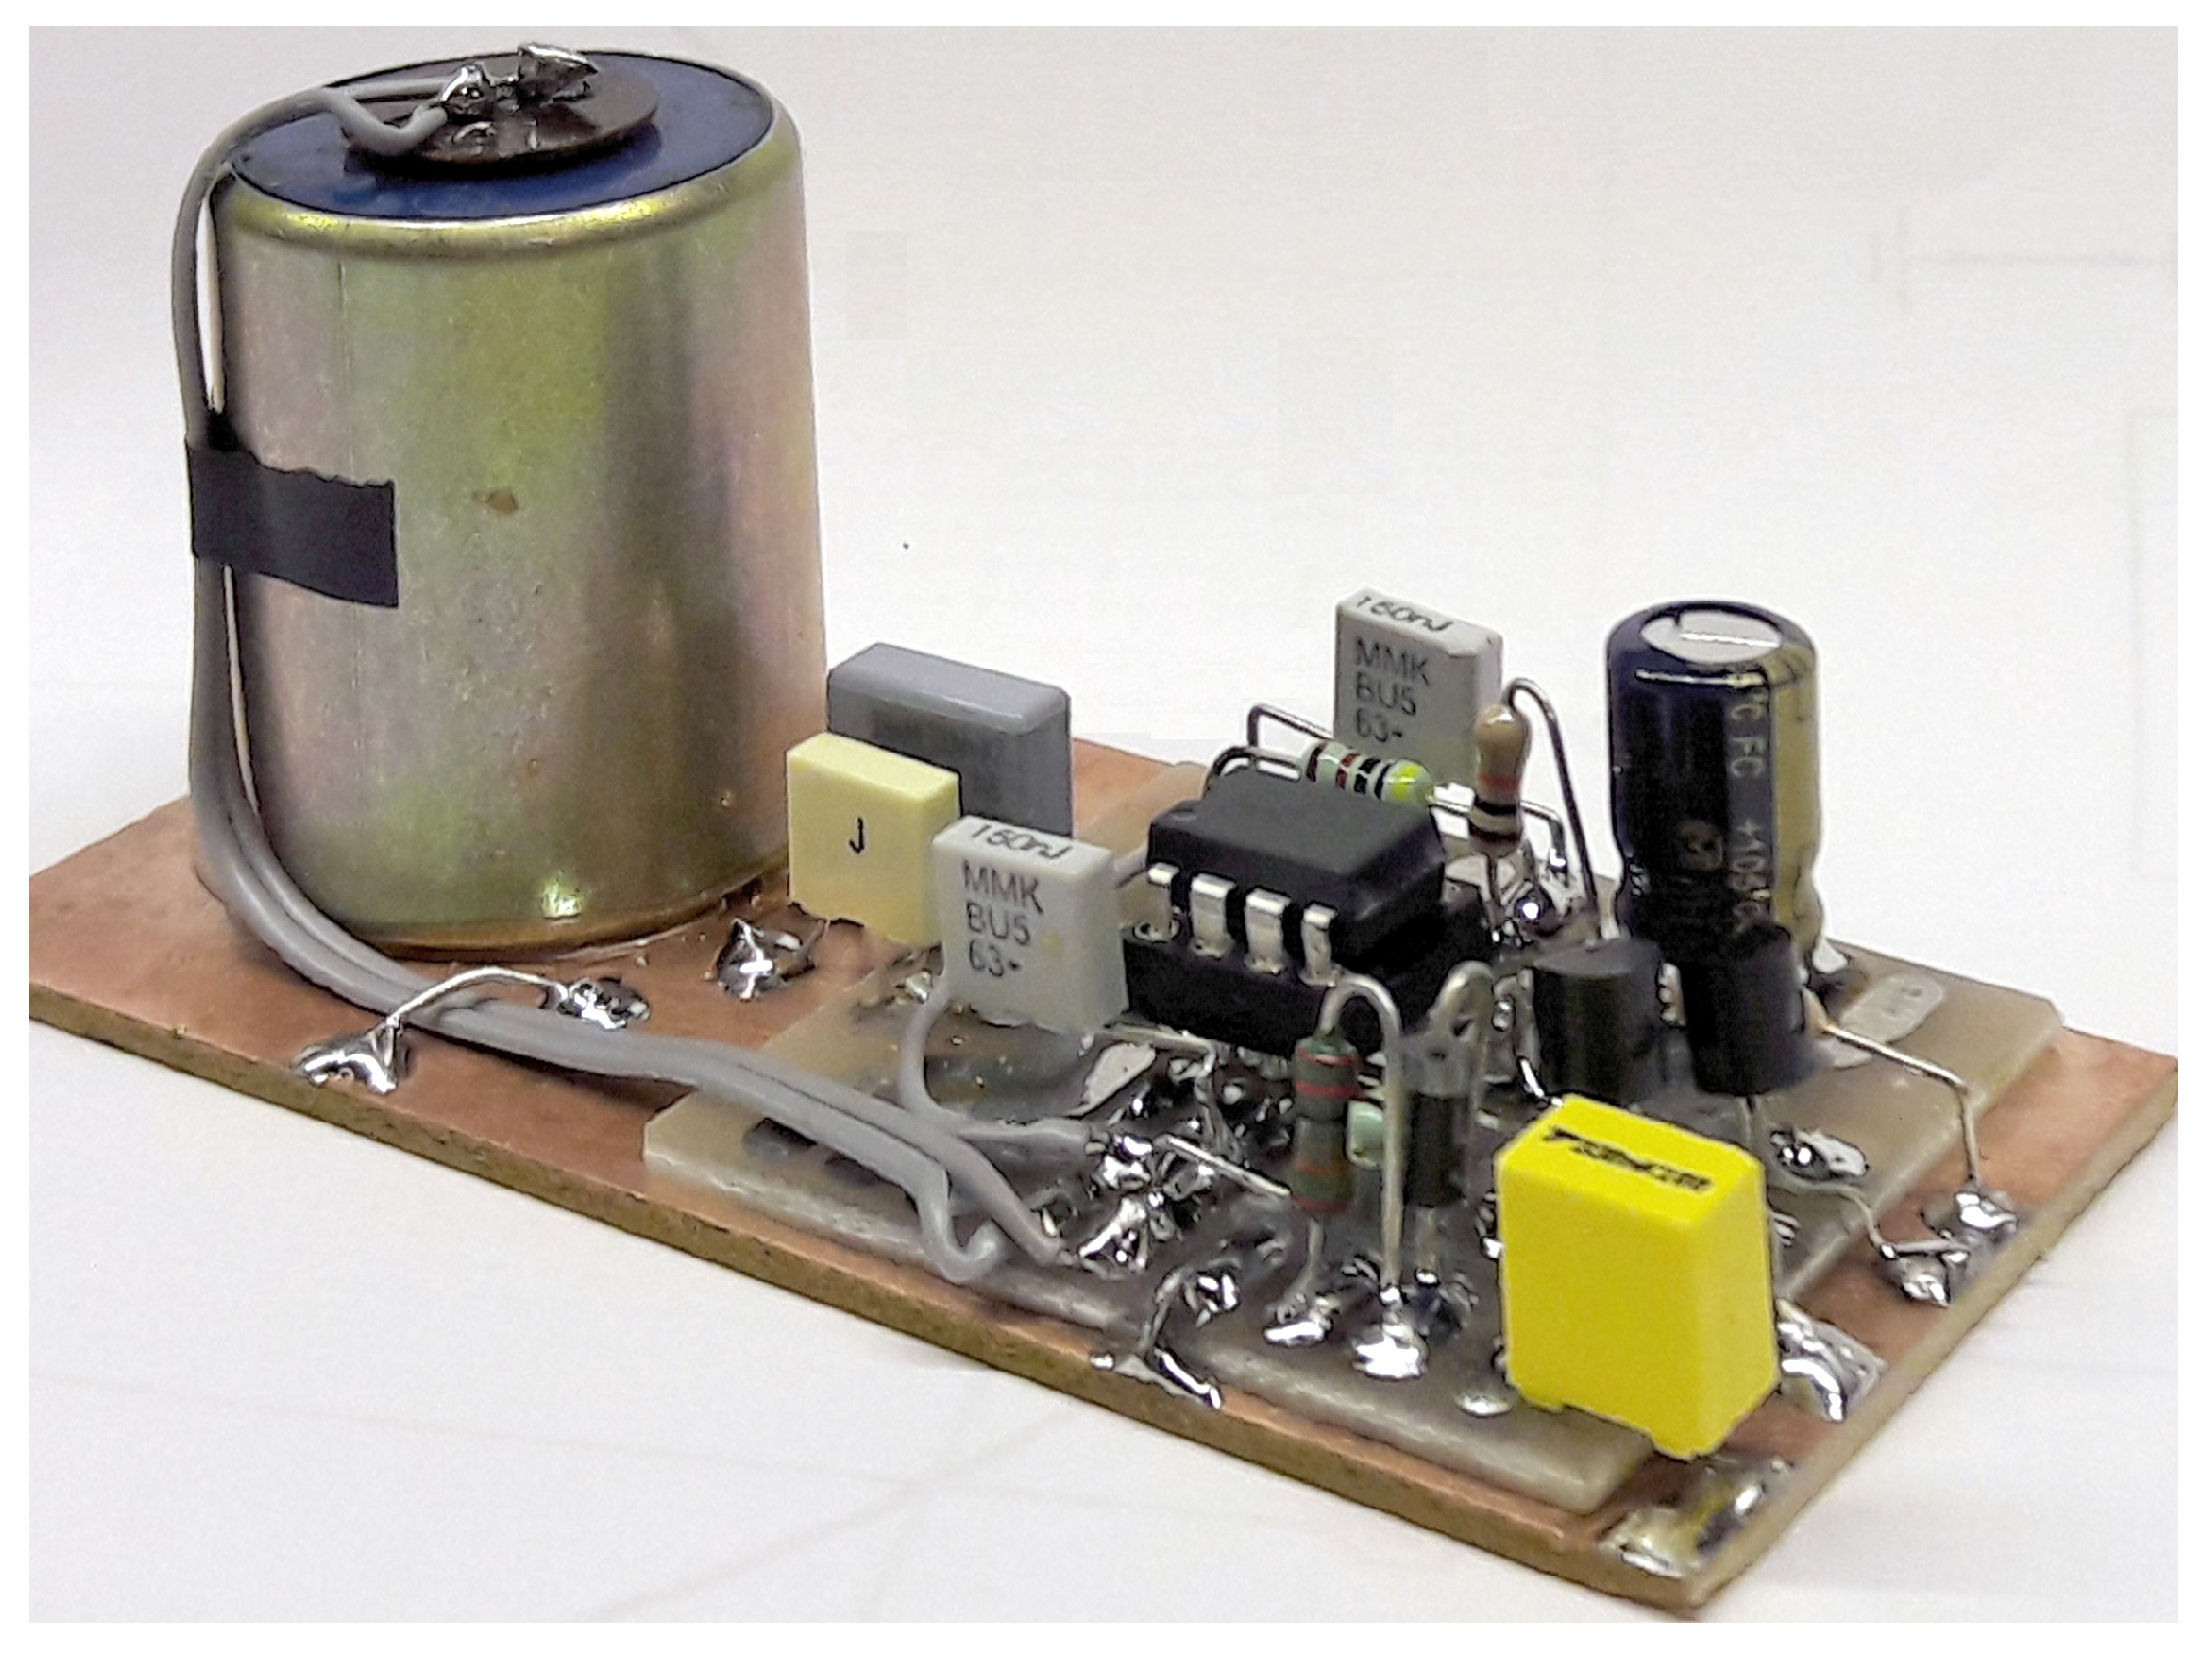
The geophone coil resistance is 375 Ω , and the circuit is electrically floating. The signal is measured with a floating OA circuit built around an OP 27 [34], which is shown in Figure 9. The combined frequency response of the geophone (high-pass behavior) and pre-amplifier (band-pass between 0.15 and 12 Hz is also shown in Figure 9). The geophone vertical element (shown mounted on a PCB in Figure 10) is a SM-4/UB8 manufactured by I/O Sensor [35], with a sensitivity of 28.8 V/(m/s). The damping factor of each unit is calibrated and brought with a tuning shunt resistor to a value of 0.6 to 0.7 (slightly resonating below the critically damped threshold value of 0.707).
The amplifier (whose schematic is shown in Figure 9) implements a transconductance architecture through the two 27 k Ω resistors. The added 330 nF capacitors give a cut-off frequency of 17.9 Hz, providing a pole in addition to that of the natural frequency response of the geophone and drastically reducing the total noise and interference from the usual 50 Hz disturbance.

2.4. Data Acquisition System

Audio cards were used for data acquisition and computer interface in order to keep down costs while keeping high quality, not only in terms of vertical resolution but of noise rejection. Almost all sound cards indicate a working frequency interval of 20 Hz to 20 kHz, but, in reality, many of these products have a workable interval extended down to a few Hz with tolerable gain reduction. Products such as the Creative SB0270 and the Creative SB1095 were used successfully for the recording of geomagnetic pulsations down to about 0.1 Hz. Attenuation could be simply caused by DC-blocking input capacitors, which can be easily replaced with larger ones, providing an immediate frequency extension. These cards provide high-quality recording with 24-bit resolution and 96 kHz sampling.
Presently there are portable oscilloscopes and data acquisition systems available at almost the same price as a sound card, and the previously discussed measuring systems with their amplifiers can all fit well, with some care for the vertical range (that is, not all such acquisition systems have the sensitivity of former sound cards and their input ranges tend to be located on the high side). The provided selectable gain can still well accommodate dynamic ranges in the hundreds of mV and Volts.

2.5. Software

The software used for analysis and display is based on a public domain program called SpectrumLab [36]. Many features of this program are well suited for the processing of the acquired signals: calculation and display of spectrograms (by Short Time Fourier Transform, STFT) in various forms, the direction of arrival (applied to the signals from the orthogonal induction coils), visual comparison of different signals with informative graphical presentation and controlling the recording through the audio cards. SpectrumLab, besides analyzing the data in real time providing the spectra for the website, allows a time-stamped archive of spectrograms and original audio files. The program is particularly useful for processing real-time data without losing displayed information, even when changing parameters on the fly.
Of course, data can be imported into any mathematical or signal processing environment, such as Matlab, where routines can be implemented. The selection of smart classification criteria and metrics (that support the rejection of extraneous signals enhancing the components supposedly originating at the EQ) will be the next step of the research, exploiting the large Opera2015 dataset.
SpectrumLab was extensively used during 2015 and in the subsequent years to process and inspect acquired data, looking for the repetition of patterns, preferring a visual critical comparison rather than applying blind, although mathematically more accurate, similarity criteria. One of the reasons was the possibility of increasing our knowledge of the external sources of, e.g., human-made noise, improving the evaluation of the false precursors. Collected data, as well as the output of our spectrum analysis, have been recently used for comparison in relation to the Tonga event that occurred on 15 January 2022 [16].

3. Dataset of Recorded Events

A significant set of data was recorded during 2015 and is still available at www.vlf.it [15]. EQ events of relevant intensity all occurred in different parts of the world with a significant distance from the monitoring stations, but some events of moderate magnitude between 3 and 4 occurred at various locations in Italy, which happened to be close to at least one of the monitoring stations, as is the case for Sicily. Out of the anticipated 15,532 confirmed EQ events monitored during 2015, a selection of the most relevant ones in terms of detectability is provided in Table 5. The following criteria are those of a sufficiently large intensity paired with a reduced distance (most of the EQs are from Italy and the Mediterranean sea) and the absence of confounding co-signals that could impair the identification of precursors. In addition, the listed events are available from multiple stations so that they can be selected based on different criteria, such as always the highest signal from the nearest station or selecting the station with the lowest natural and human-made noise (e.g., based on statistics of previous months).
To the aim of verifying detectability and testing the radio seismic indicator of Section 5, positive findings of EQ precursors were taken from the literature for some significant events of the last 25 years, as shown in Table 6.
The events listed in the two tables span between 3.2 and 9.0 in magnitude and between a few km up to about 14,000 km between the epicenter and station. The tables report the location and the date with UTC time together with the bibliographic reference for the events taken from the literature.

4. Signals and Post-Processing

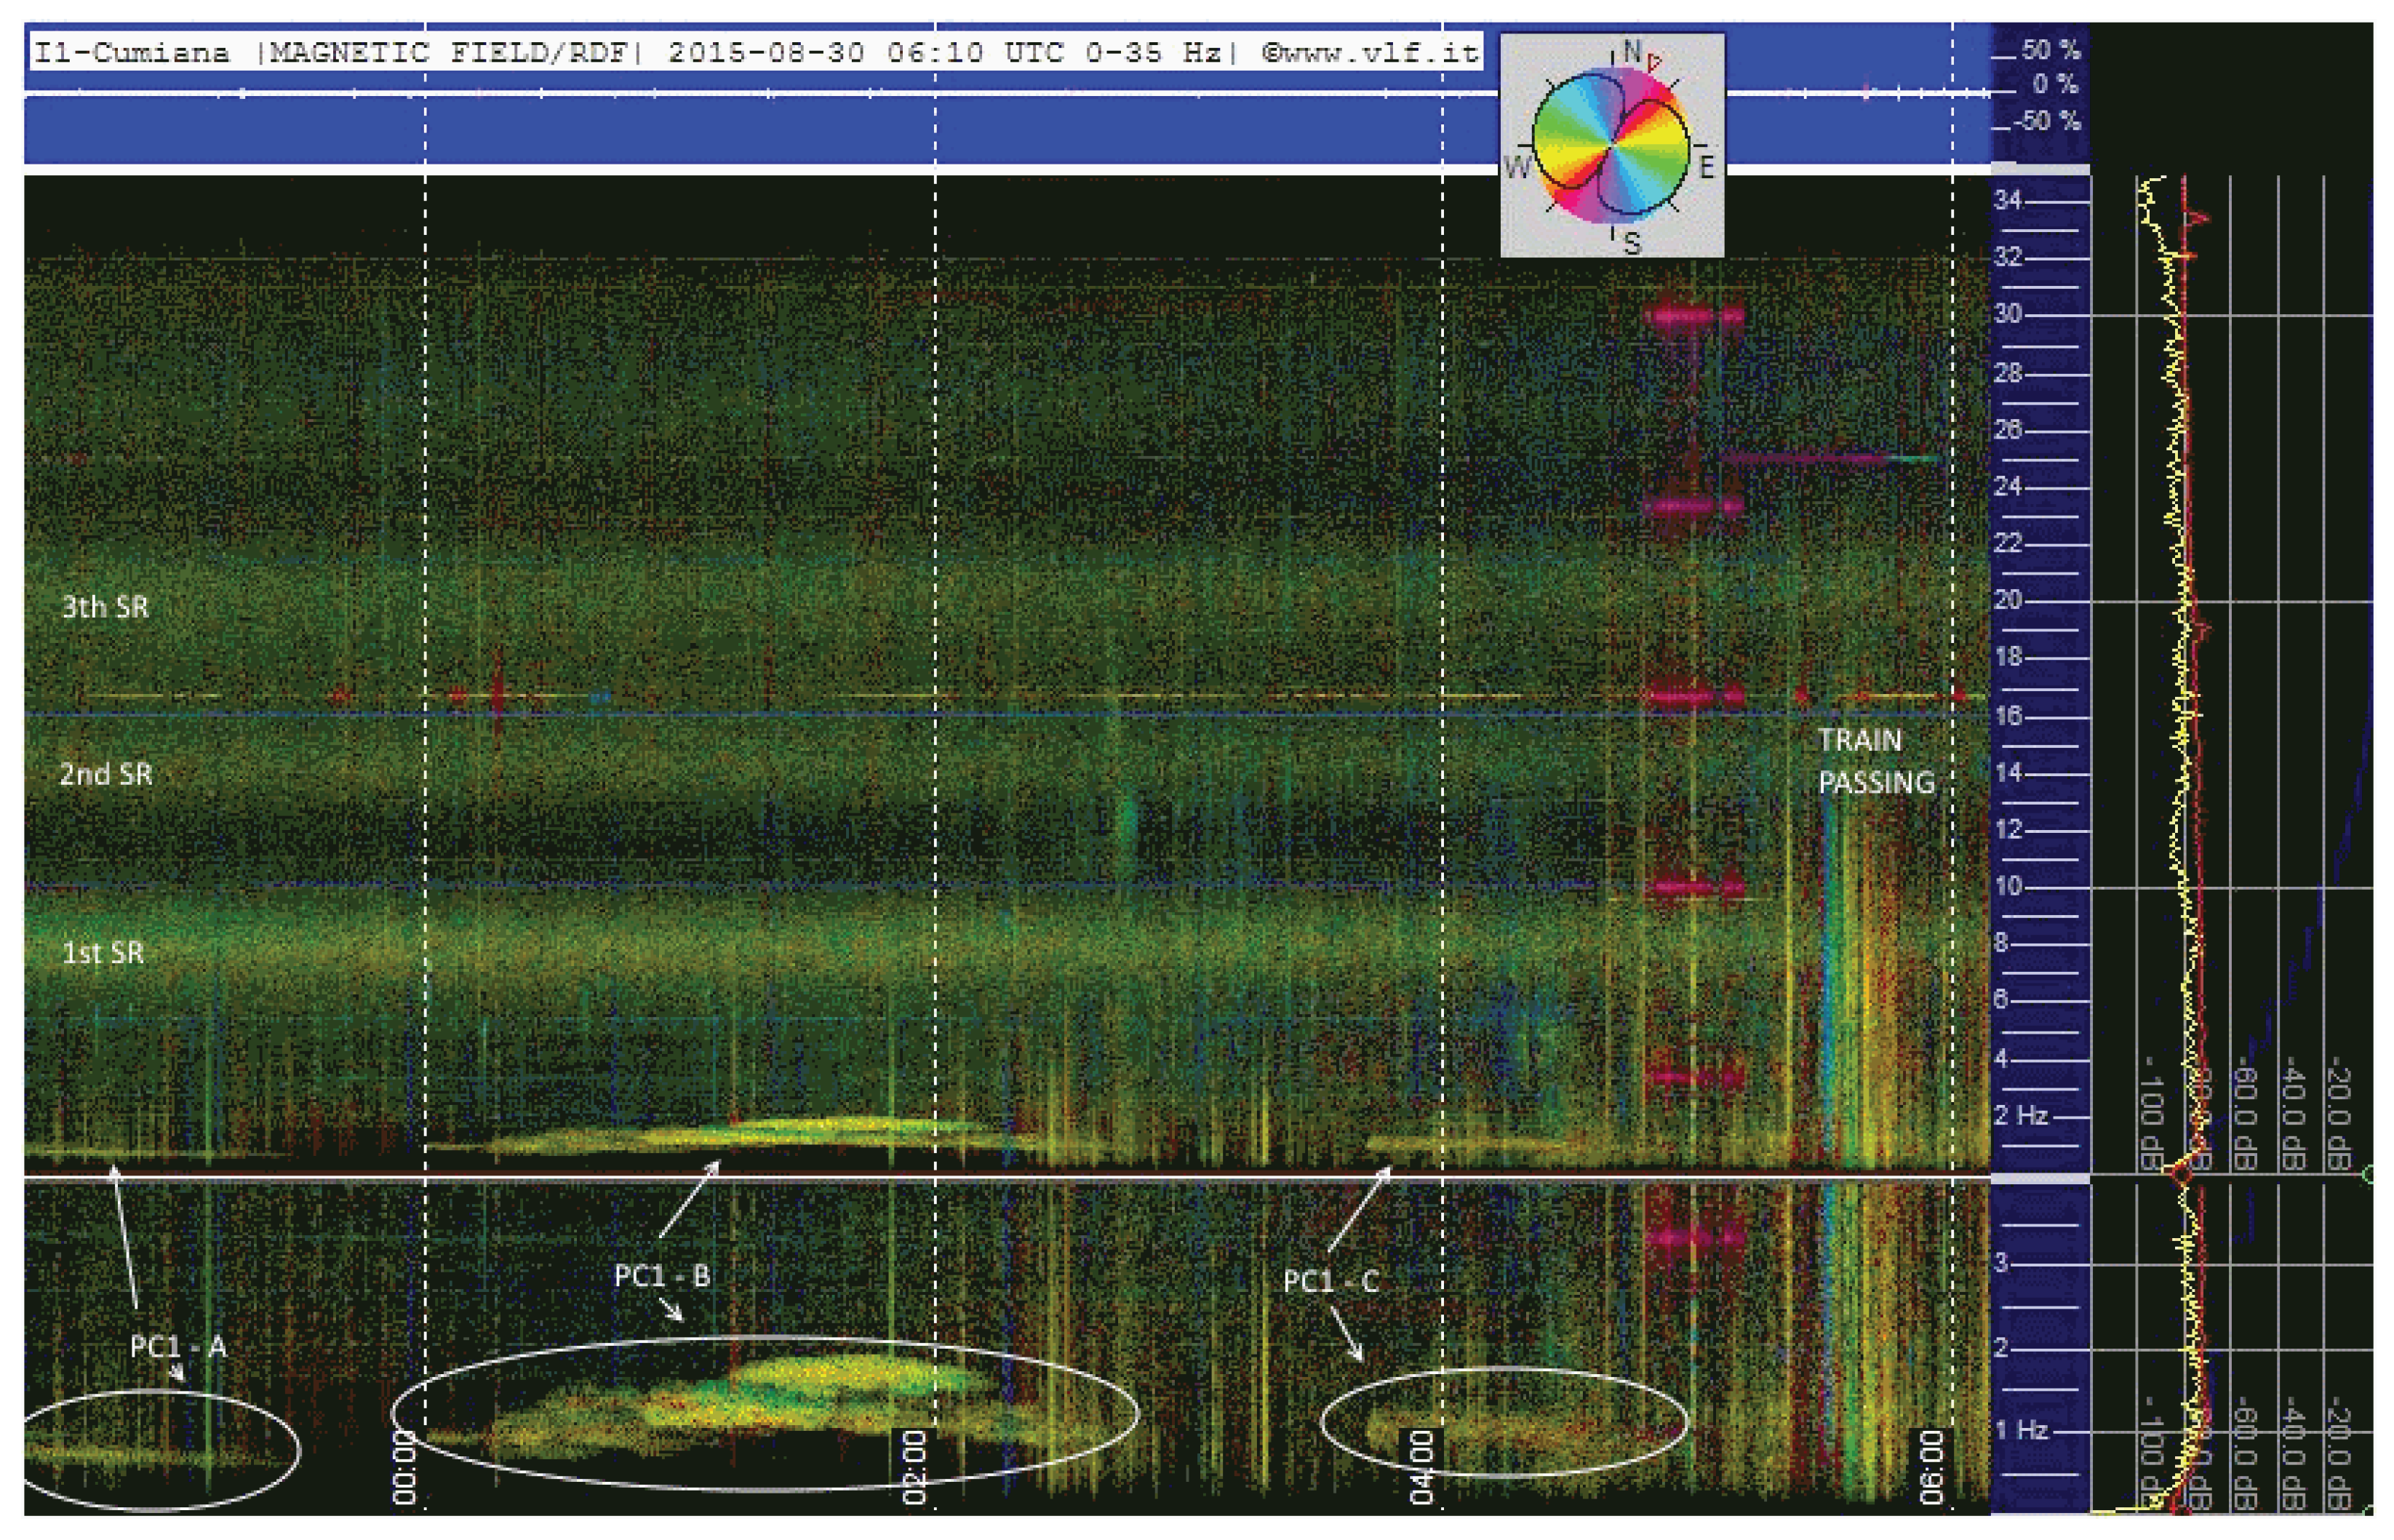
In this section, examples of STFT-based data processing and visual interpretation are provided for the signals captured from the discussed electric and magnetic sensors and geophone. Figure 11 shows an example of the direction-finding techniques exploiting the two orthogonal coils and giving a color-coded direction of arrival.
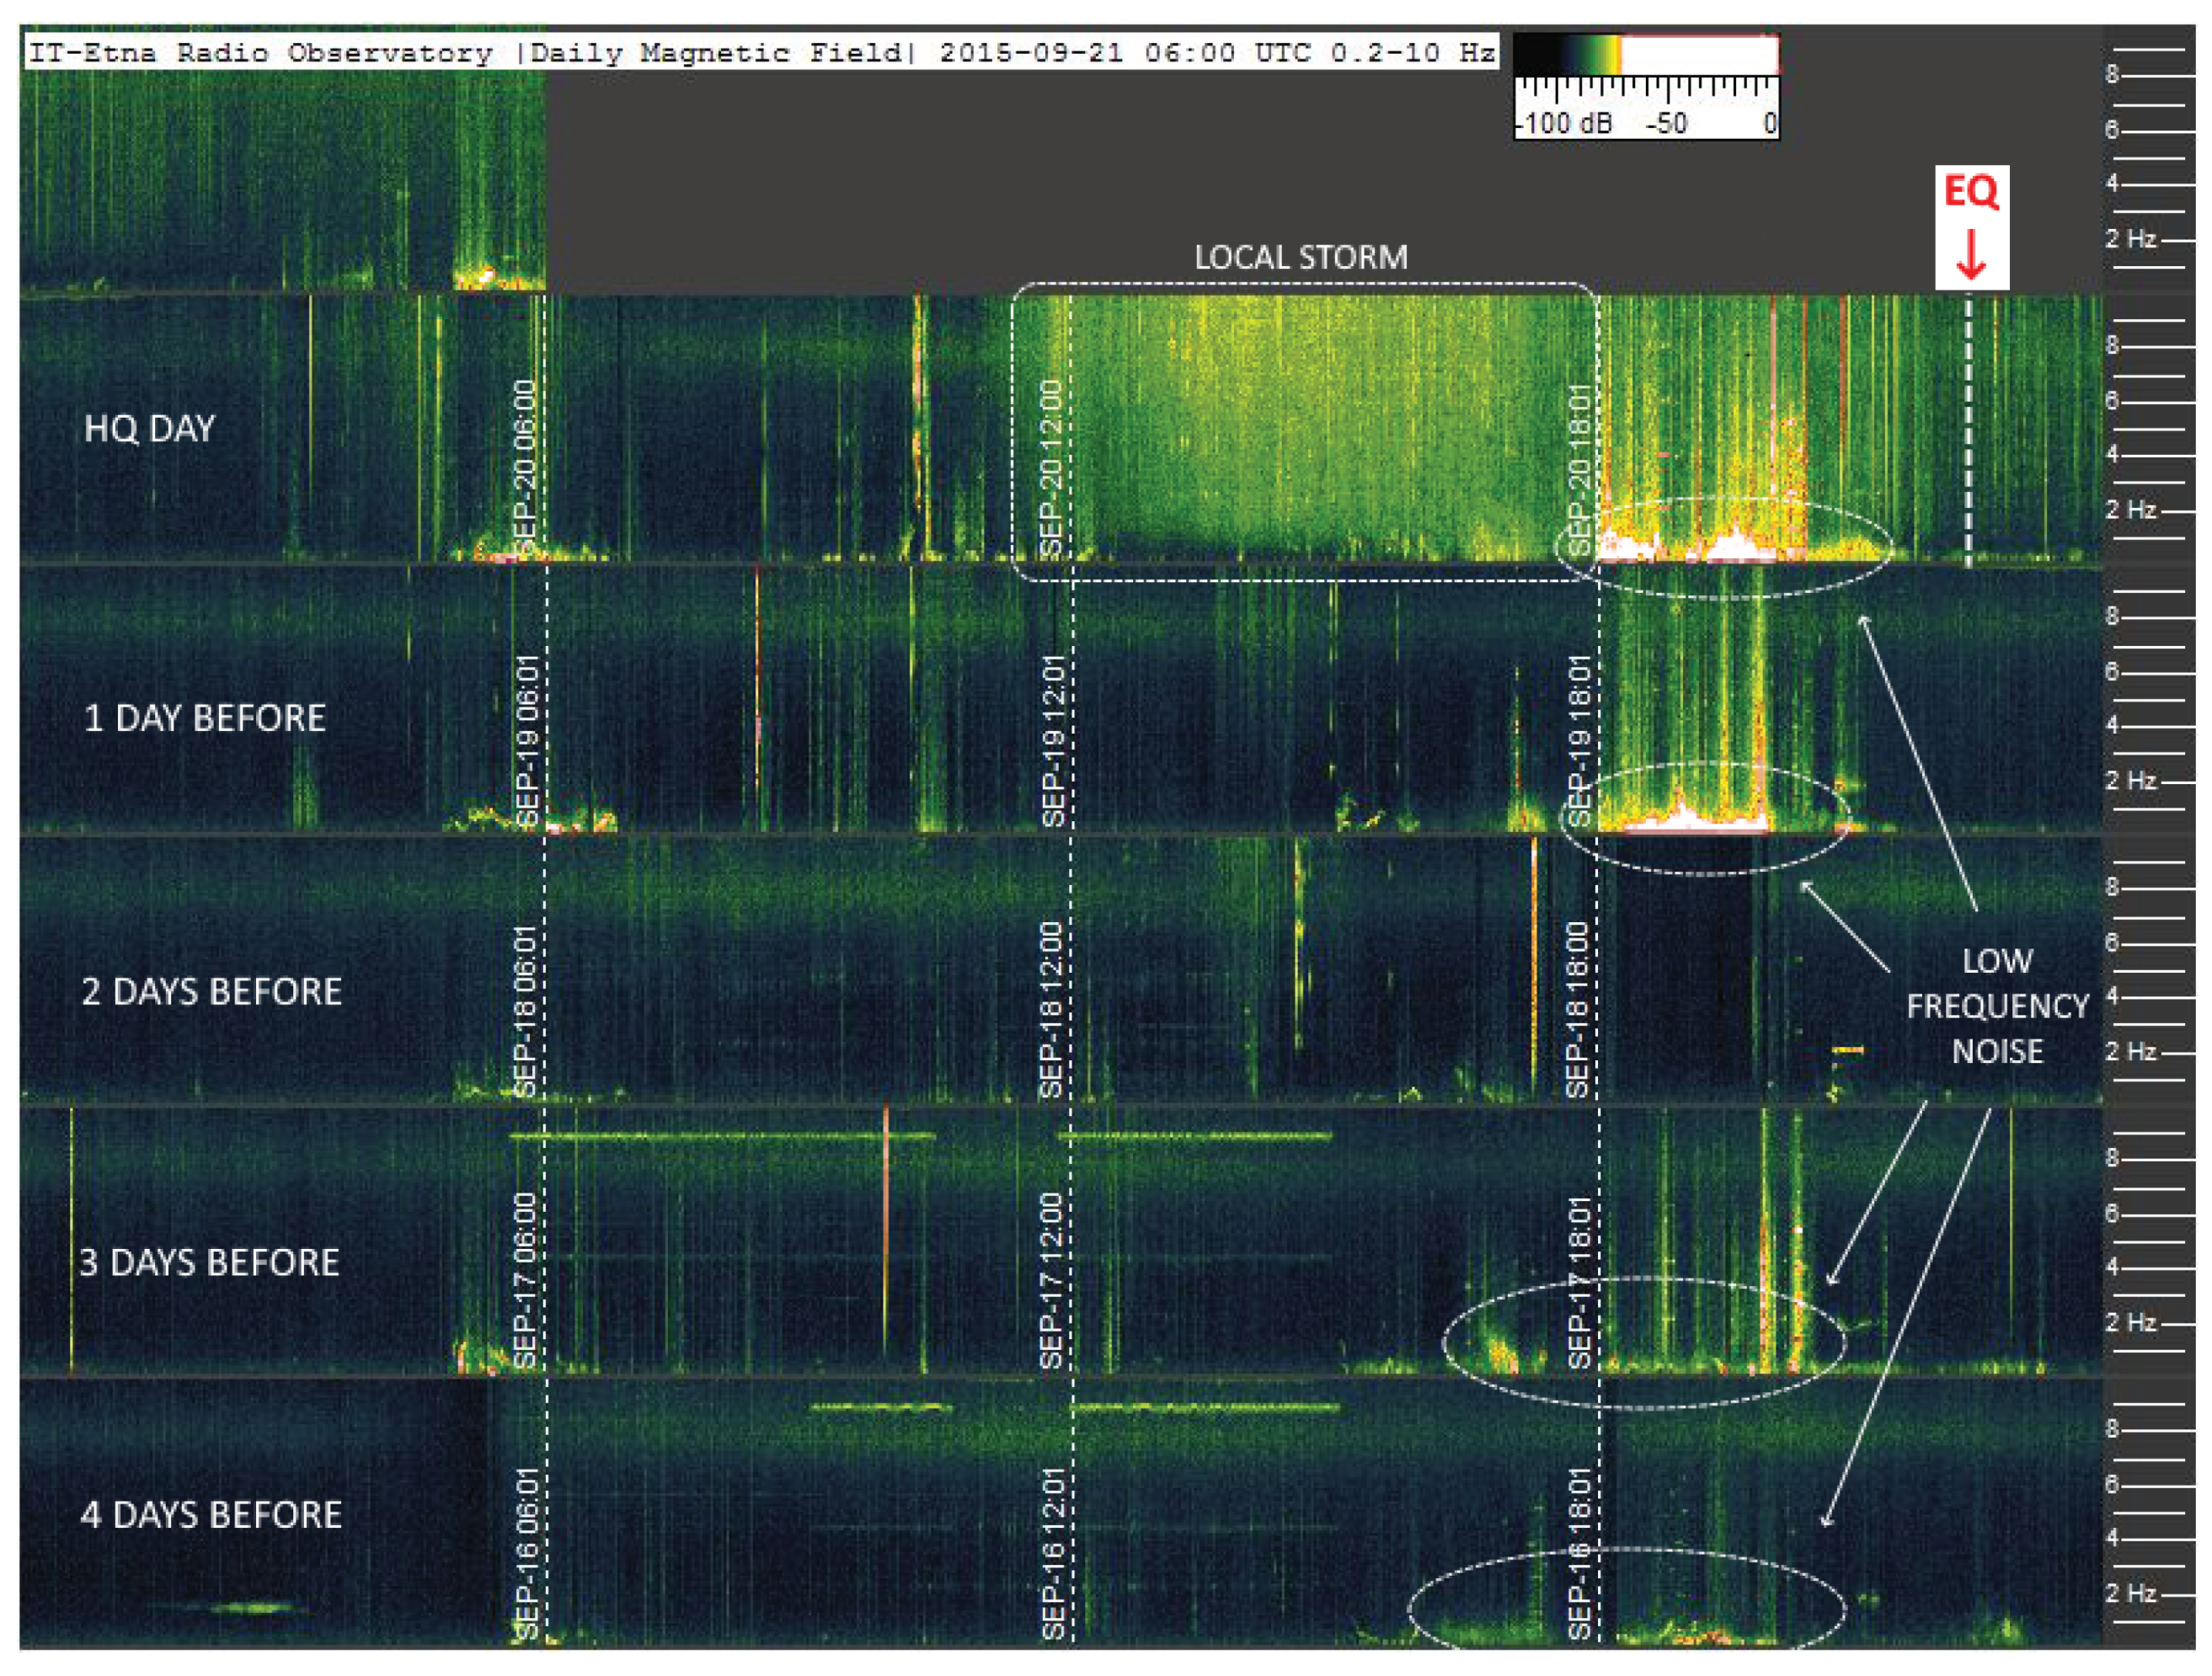
In Figure 12, there is a clear example of an EQ event (event 034 in Table 5) preceded by a widespread increase in background noise in the previous 10 hours and an even stronger increase in the last 3 hours, returning to normal levels after the EQ. A cross-comparison with the data provided by Blitzortung [49], however, indicates a concomitant lightning activity, confirmed by comparison with observations of the previous days: this casts some doubts on the presence of detectable precursors in such and similar cases.
In a year of monitoring we could capture two Etna eruptions with recording devices located just a few km from the volcano’s vents; see events 004 and 044 in Table 5. The eruption was observed from its inception, with the geophone informing us constantly of the lava flow rising to the surface, recording vibrations as a weak continuous EQ lasting tens of hours. However, even in these two cases, the absence of very low-frequency signals before and during the eruption was clear. No abnormal signals nor variation in Schumann resonances were observed. The trace of the eruption vibration is very clear on the geophone spectrogram, while in the induction coil spectrogram, nothing appears in addition to the Schumann Resonances and easily recognizable anthropogenic noise.
In general, a deep and extensive analysis was carried out daily with cross comparisons between stations, looking for the periodic recurrence of suspicious patterns and the repetition of these patterns in other EQs. A lot of false local signals have been identified and excluded, including the effects of wind, storms, etc., besides human-made noise. In other words, although at first glance there are many acquisitions showing the presence of possible EQ precursors, after verification, these signals are found to be non-repetitive and not systematically matched with seismic events.
The verification methods were kept simple, using mainly basic Fourier spectrum analysis of the recorded electromagnetic waves and comparing them to external sources of information, such as Blitzortung for thunderstorms and the lighting activity, and other observatories to access similar recordings at different distances and with different instrumentation (such as the Kiruna Atmospheric and Geophysical Observatory [50] or the Sodankylä Geophysical Observatory [51]). A significant deal of work was carried out analyzing the same location and the occurrence of similar spectral patterns in quite different periods of time, thus showing repetition and not uniqueness related only to the occurrence of EQ events.
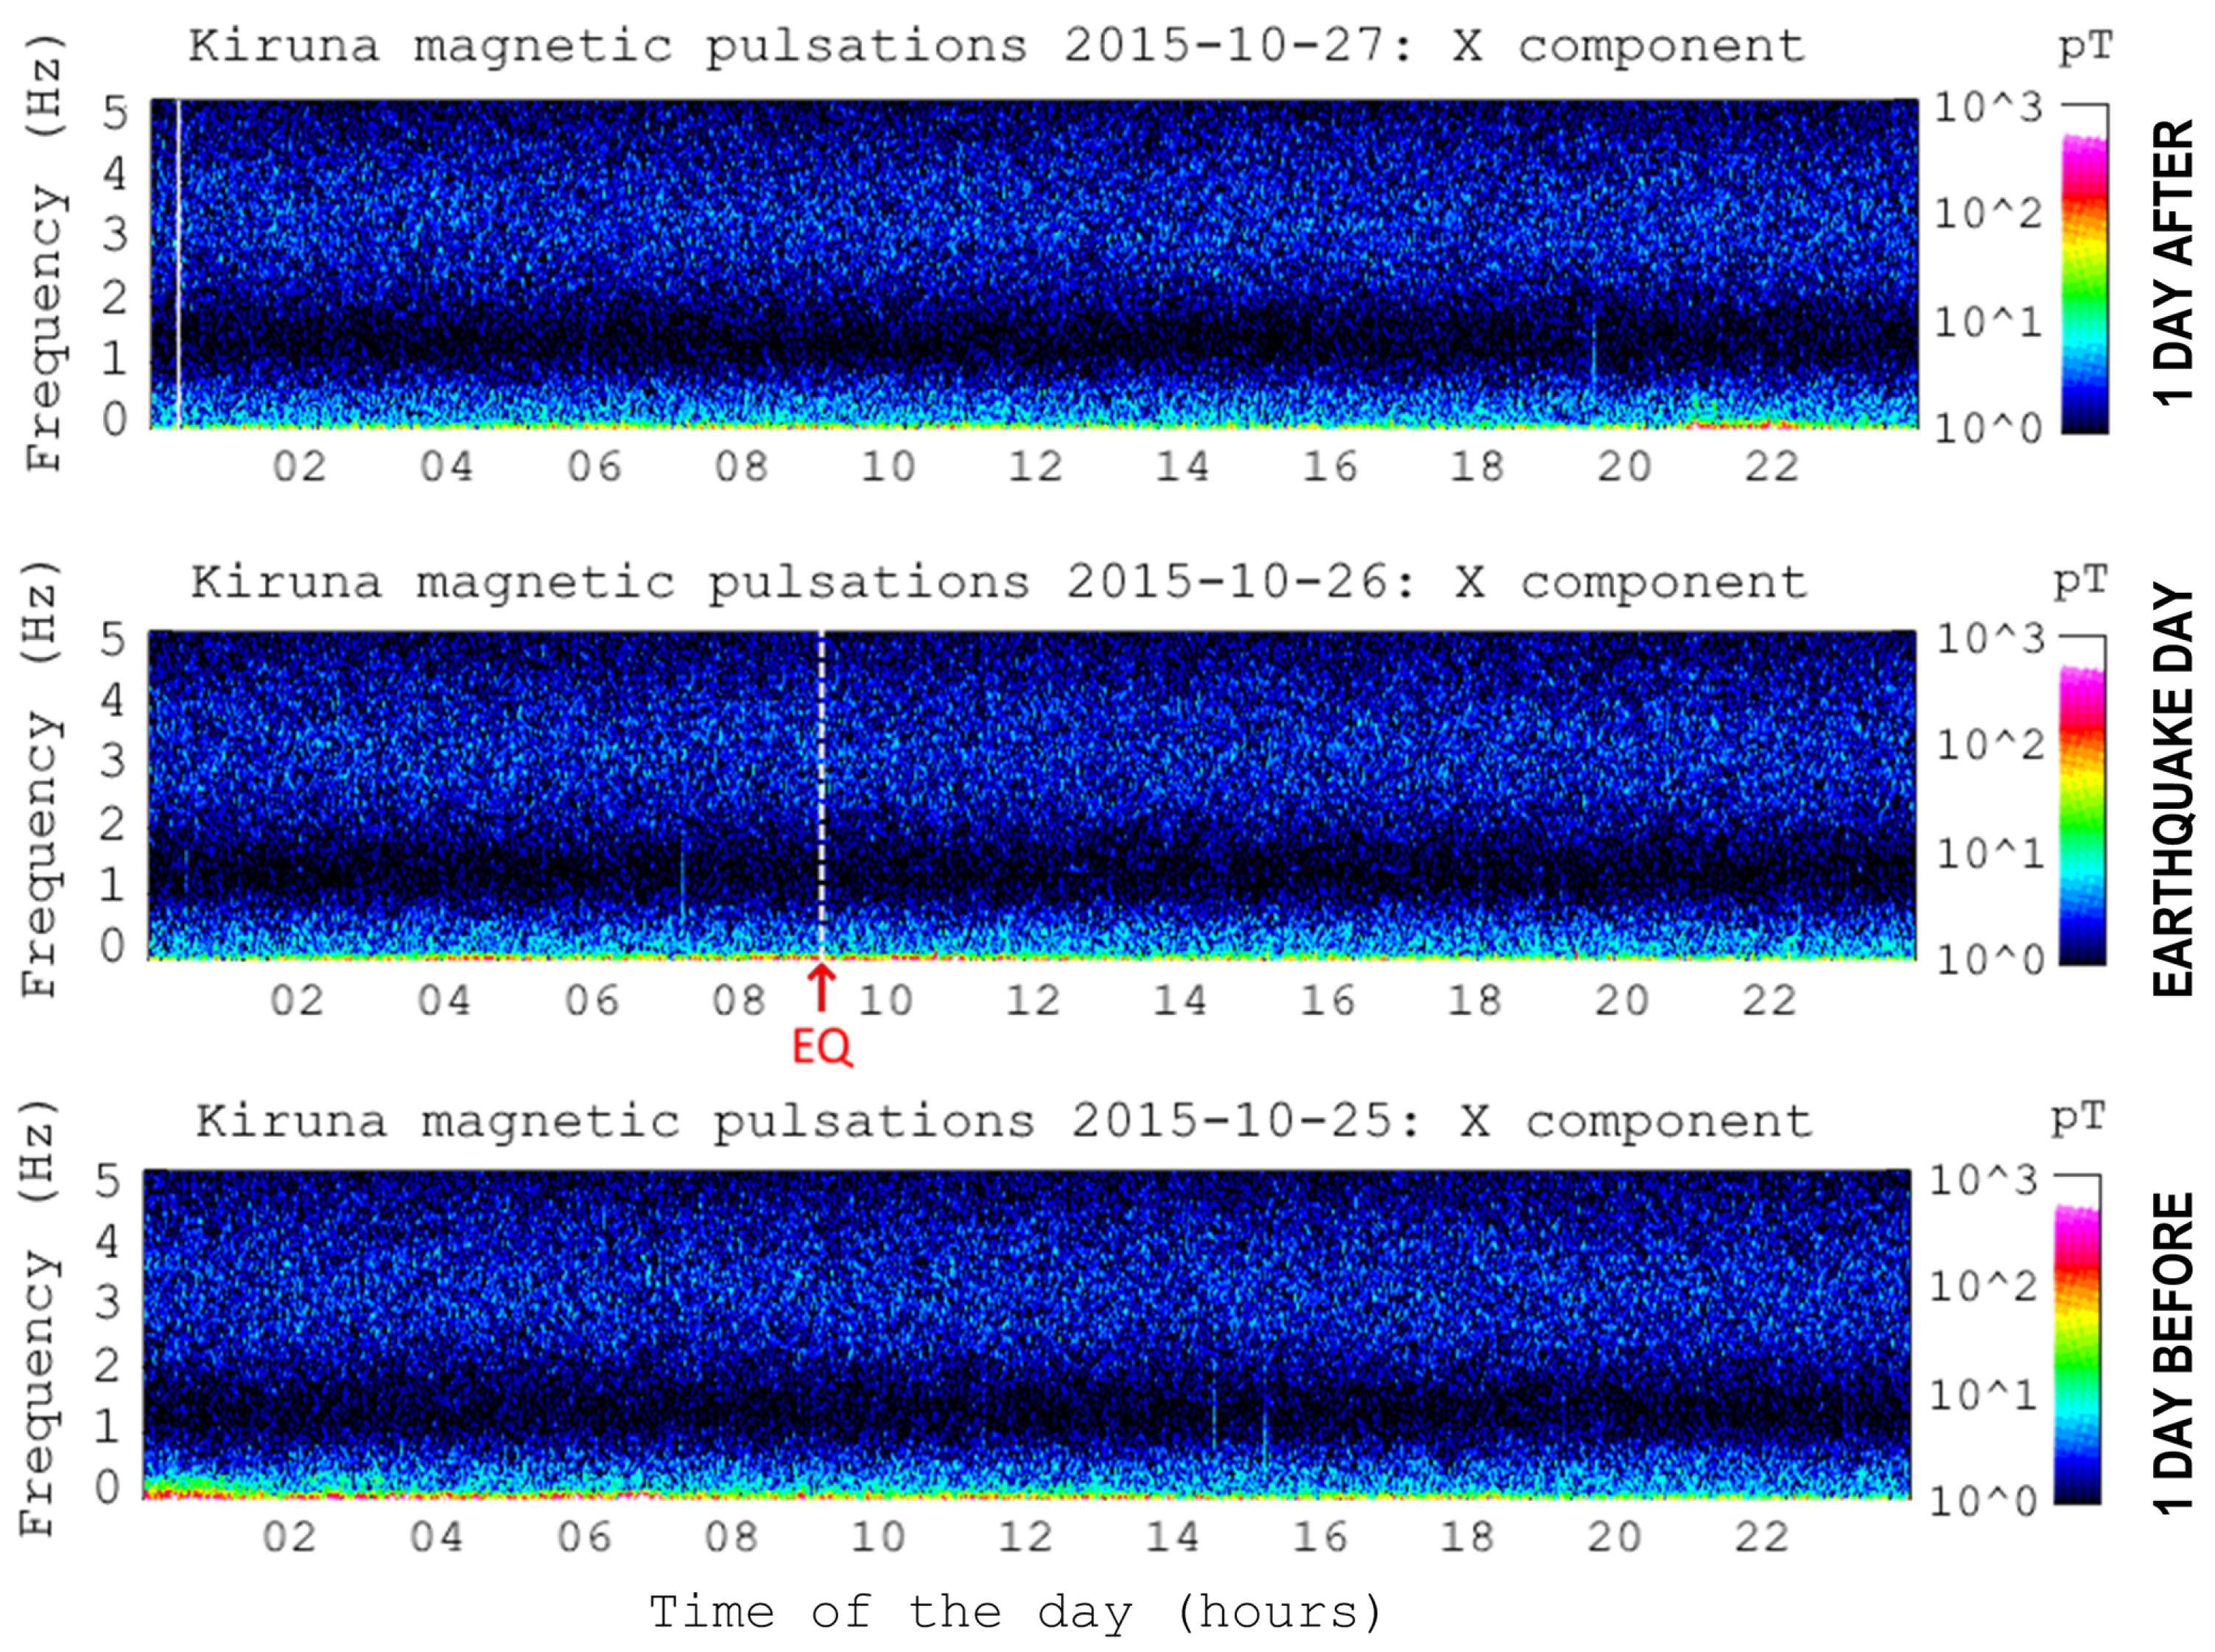
A visual confirmation that global detectability has not been achieved so far is given in Figure 13, where event no. 036 from Table 5 (26 October 2015) is shown for what was recorded at the Kiruna Geophysical Institute (Sweden). The EQ event marked in red is preceded by one day of quiet spectrum, which does not show the electromagnetic activity of several nT reported in [52]. It is, nevertheless, recognized that there are periods of intense geomagnetic activity that could mask the absence of precursors on a global scale, as it is for another period of 2015 around mid-September, also impacting event no. 031 of Table 5.

5. Radio Seismic Indicator

The source of emissions at the EQ has often been modeled as a vertical electric dipole [53] for which equations of field propagation can be laid down. In particular, for the transverse magnetic mode, a nearly quadratic law with distance can be determined. The thorough solution of the Helmholtz potential equations with boundary conditions gives place to a set of equations for the non-null components, namely (in spherical coordinates) the electric field along coordinates r and θ ( E r and E θ ), and, as anticipated, the magnetic field along ϕ ( H ϕ ). Li and Pan [54] proposed accurate formulations, specifically valid for the low-frequency interval of EQ emissions in the reactive region. However, depending on frequency and distance, radiative and reactive terms at the receiver position may mix to a different extent. Such terms are characterized by a linear, and quadratic exponent with respect to distance; a third-order term is often accompanying the first magnetic field reactive region. An exact intermediate exponent value of 1.5 for D was selected as a compromise, providing a proportionality of 30 dB of intensity change for each 20 dB in distance.
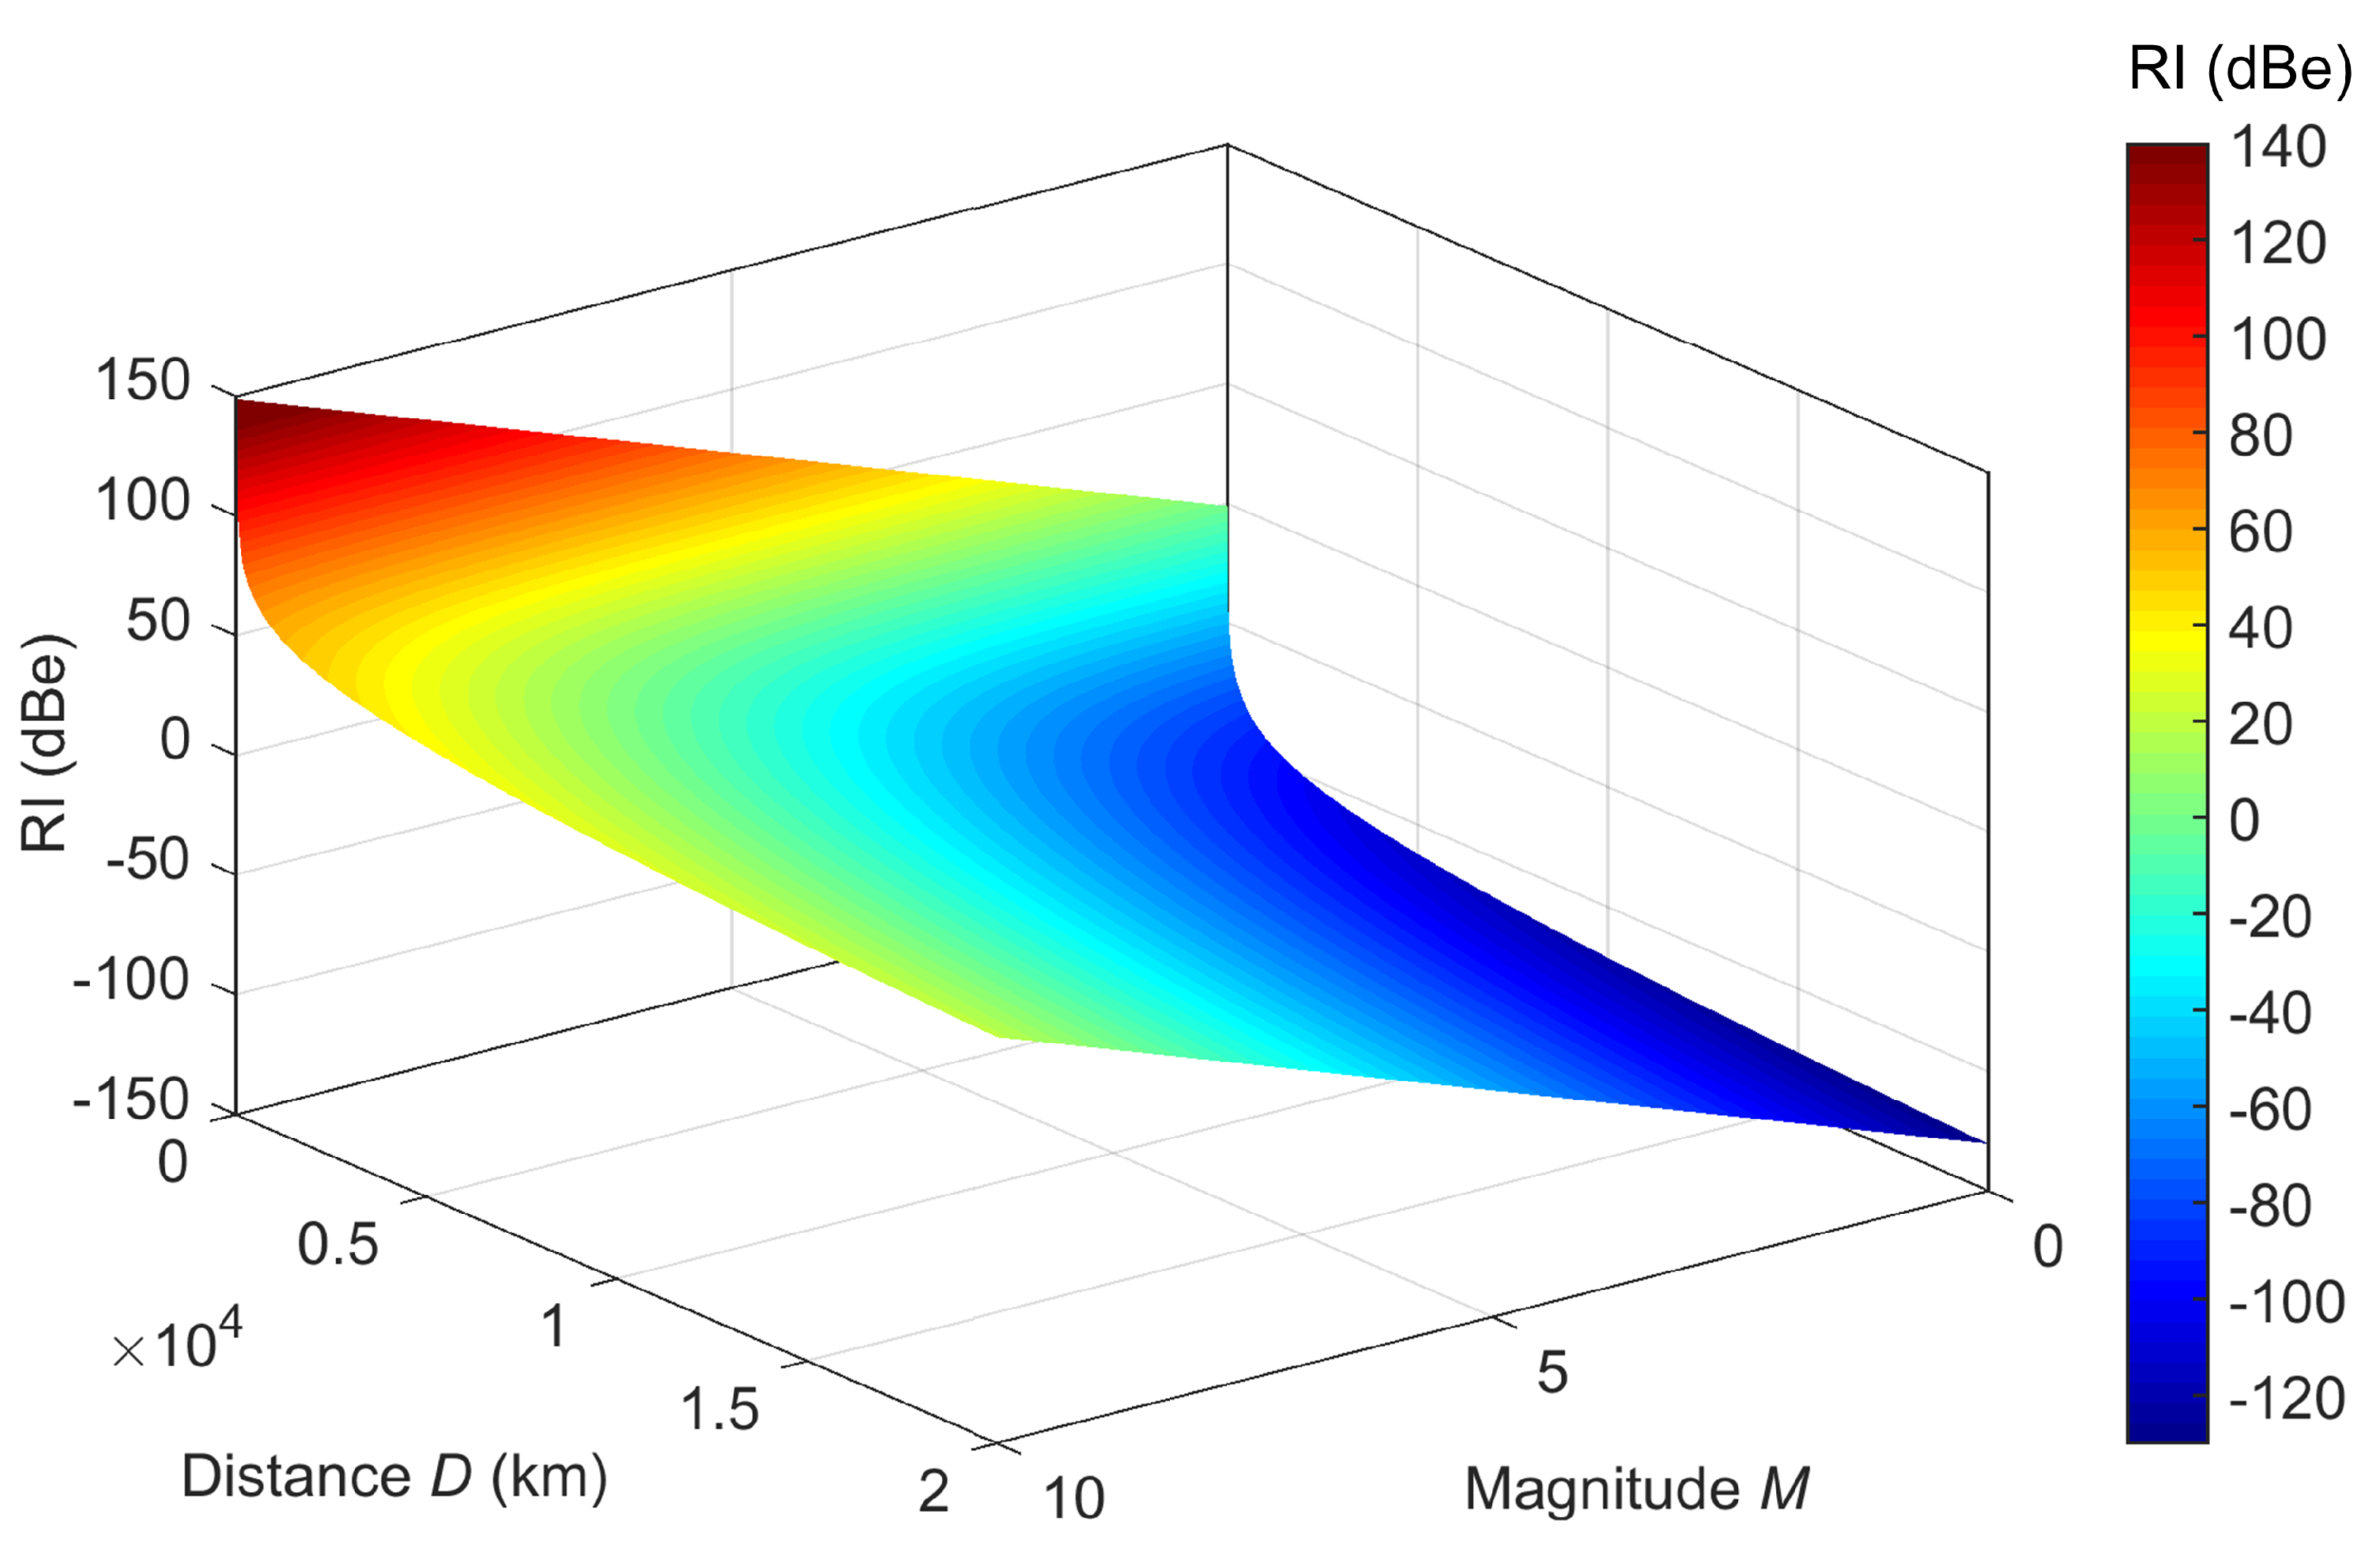
The intensity of the source, then, is considered equal to the square root of the EQ power (the EQ energy measured by the magnitude using an empirical approximation of 10 1.5 M , assumed concentrated in the short time interval when the maximum EQ intensity takes place). Putting together such a measure of EQ power with the assumed propagation law for the H ϕ component, the following R I (radio seismic indicator) expression was derived.
R I = 20 log 10 10 1.5 M D 1.5
where M is the EQ magnitude (in Richter scale units) and D is the distance (in km) on the Earth’s surface between the EQ event and the observer.
Considering the epicenter in the place of the hypocenter, thus neglecting the depth at which the EQ event occurred, is an acceptable approximation, considering that in most cases the depth is (much) less than the horizontal distance (for example, only EQ event no. 005 in Table 5 violates this assumption and is characterized, in any case, by a sufficiently large RI value). It may be said as well, that this approach considers only the surface distance has been commonly used to derive the other indicators available in the literature, such as Molchanov et al. [55] and Hattori et al. [39].
RI is conventionally expressed in dBe, with “e” standing for “earthquake”: we set R I = 0   dBe for an EQ with magnitude M = 4 and with an epicenter located D = 100   k m distance from the observer. R I is plotted in Figure 14.
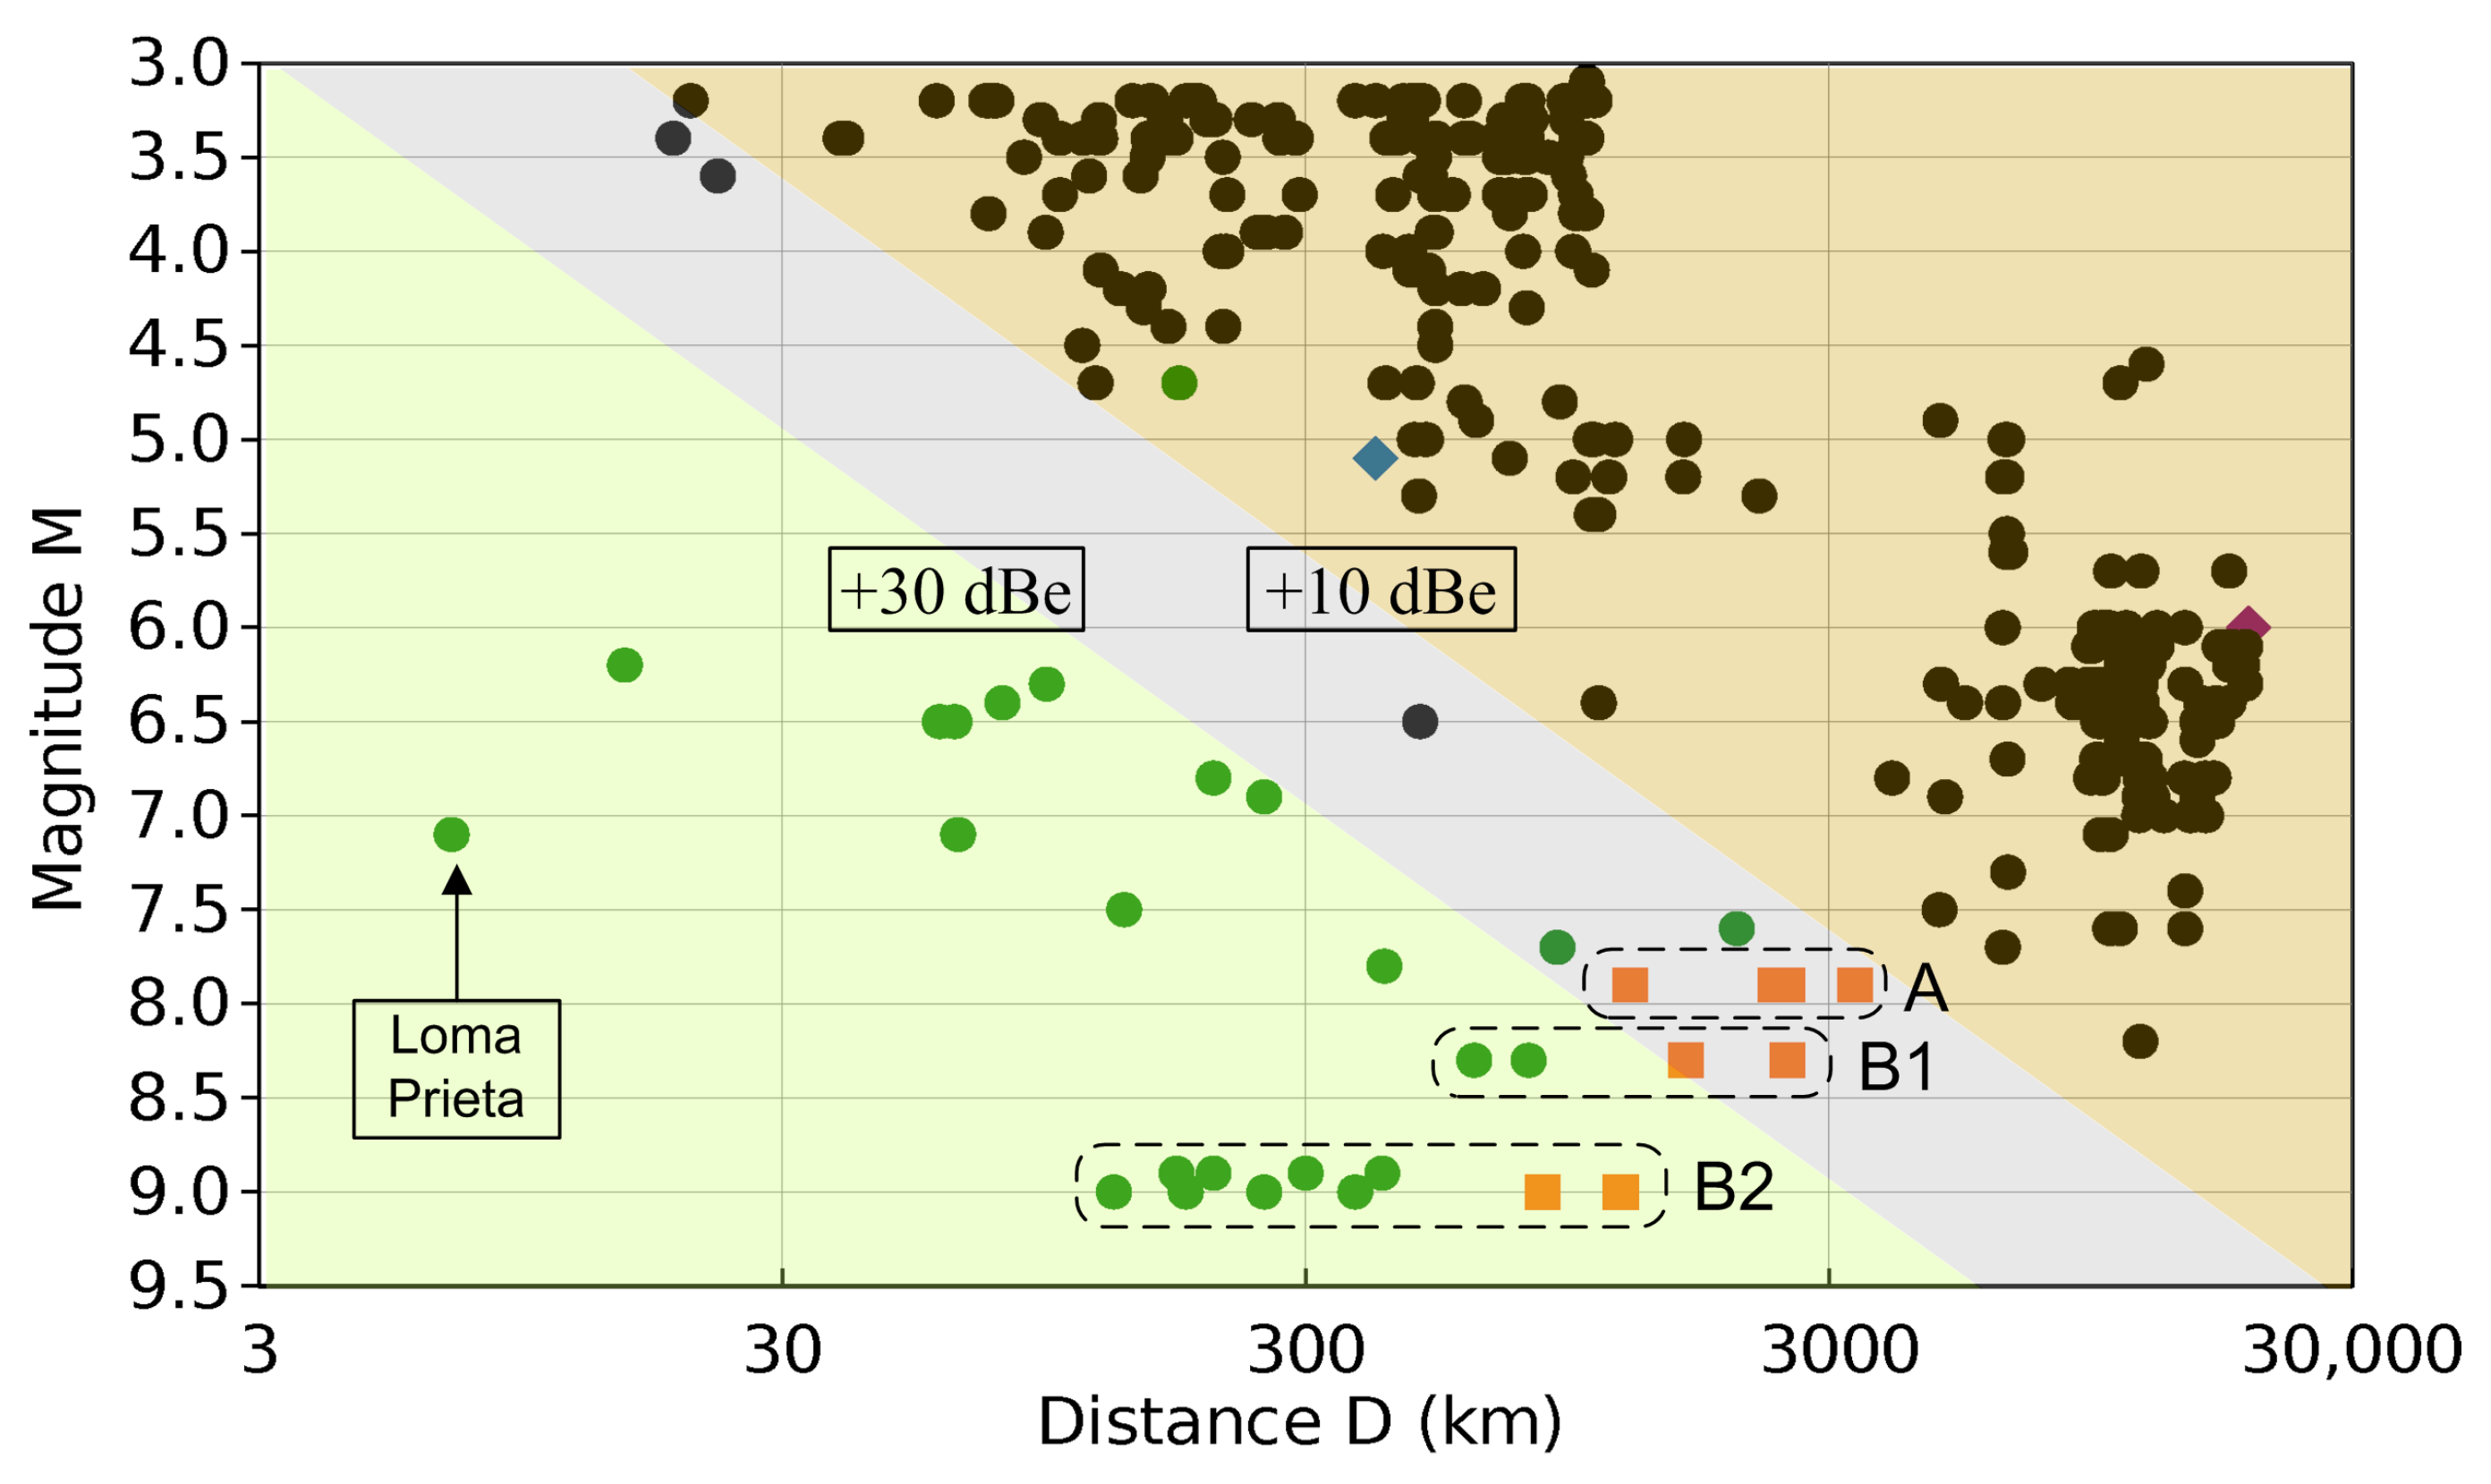
Figure 15 reports 316 EQ events, 280 of which are from the Opera Etna Volcano station and the other 36 are from scientific papers (already listed in Table 6). It is clear that positive results are almost exclusively located in the green area for R I + 30   dBe . The gray area, with RI between + 30 and + 10 dBe, contains mixed results, where the advantages of a specific post-processing method can make the difference. The light brown area with R I + 10   dBe is characterized almost completely by negative radio seismic detection.
There is one event reported as positive, but based on the total electron count criterion and not on electromagnetic precursors [44], marked as a light blue diamond. There is also one positive event falling into the light brown area of R I 10   dBe .
Some intense EQ events are then reported as both positive and negative (so with and without precursors) and are marked by “A”, “B1” and “B2” in Figure 15: “A” refers to dubious detections, where a near station cannot detect precursors, and is reported instead by another station farther away; “B1” and “B2” show the same EQ event for stations at different distances, with the last ones (in orange) falling in or toward the grey area, justifying the lack of an identified precursor.
One paper [52] then stands out for reporting a positive identification with one of the largest distances between the EQ and station, located deep in the negative identification area, which casts doubts on the correctness of the results (it is marked in purple, located at the right end).
Despite the fact that southern Italy is an active seismic zone, examining Figure 15, no Opera 2015 recorded event falls into the minimum distance/intensity range to be in a condition for receiving precursors, and, in fact, we could not identify any significant e.m. activity that unequivocally can be put in relation with the EQs recorded by the Istituto di Vulcanologia. Conversely, the main EQ event, to which most of the articles on radio seismic precursors refer, is the Loma Prieta EQ in 1990: the calculated RI exceeds +80 dBe, and the monitoring station was positioned 7 km away from the epicentre on an estimated 40-km long fault line, and exactly above the break line.
In conclusion, although the six Opera 2015 stations were equipped with highly sensitive devices and placed in strategic locations, we have not detected any signals corresponding to local EQs. Those minimum conditions for RI never happened, although in a few cases, we see that events are positioned at the margin of the grey zone.

6. Conclusions

This work has described the set of instruments designed and built for the Opera 2015 project in Italy, where six monitoring stations were deployed, interconnecting the data acquisition systems to form an integrated dataset of results [15]. Two other stations at the EGO-Virgo experiment and the Sos Enattos site were then deployed in successive years.
The acquired data were subjected to spectral analysis, including direction finding, complementing the analysis with an as comprehensive as possible evaluation of extraneous sources in order to remove false positive events. The considered methods were the verification of thunderstorm and lightning activity [49] to exclude a large portion of intense perturbations of the lower frequency interval, followed by the analysis of the repetitiveness across different days in the same or similar time of the day, accumulating visual statistics of natural and human-made noise (that need long observation times as there is no pre-determined behavior or reference statistic).
Performances of designed and built instruments are aligned with the state-of-the-art published in the scientific literature or commercially available, as discussed in Section 2. The design schematics that were discussed in Section 2 allow readers to realize similar instruments, achieving a significant level of performance in terms of sensitivity, usability and cost.
From a general viewpoint, the results of the activity on the acquired data can be summarized as follows:
  • a radio-seismic indicator (such as the RI defined in this work and used in the Opera 2015 project) is useful to establish the possibility of receiving and recognizing the precursors, assigning a weight to each event, as studying all the earthquakes on a global scale is useless;
  • the minimum condition necessary for the detection of a precursor, using our method, comes with an RI value of at least 30 dBe;
  • for these reasons, radio seismic precursors cannot be detected on a global scale, even for medium-intensity earthquakes with a magnitude of up to 6;
  • a monitoring station located in an urban area has almost no chance of detecting radio precursors due to the abundance of human-made noise sources, which are also quite variable;
  • it is unlikely, in light of these considerations, that the general prediction of earthquakes could be imminent unless monitoring stations happen to be very close to the affected area.
The network of monitoring stations set up for Opera 2015 is still active with four main active stations and has provided useful recordings for other studies related to recent earthquakes (Tonga on the 15 January 2022). Forthcoming activity is the intensification of such collaborations and the automation of access to the database of raw data, which is so far manual.

Author Contributions

Conceptualization, R.R., L.F. and C.R.; Methodology, L.F.; Validation, A.M.; Investigation, R.R., L.F., C.R. and A.M.; Data curation, R.R.; Writing—original draft, R.R., L.F. and C.R.; Writing—review & editing, R.R. and A.M. All authors have read and agreed to the published version of the manuscript.

Funding

This research received no external funding.

Institutional Review Board Statement

Not applicable.

Informed Consent Statement

Not applicable.

Data Availability Statement

Not applicable.

Acknowledgments

The authors would like to thank the following people managing the other monitoring stations or providing information on earthquakes and other seismic events: Roberto Borri and Luca Seoli, CSP, Turin, Italy (Pontese Monitoring Station); Jader Monari, Massimo Silvestri, Luca Cabassi, INAF (IRA Monitoring station); Rosario Catania and Alessandro Longo (ERO—Etna Radio Observatory); Federico Scremin (Romagna monitoring station); Fabrizio Francione, Turin, Italy (Turin monitoring station); Istituto Italiano di Vulcanologia.

Conflicts of Interest

The authors declare no conflict of interest.

References

  1. Fraser-Smith, A.; Bannister, P. Reception of ELF signals at antipodal distances. Radio Sci. 1998, 33, 83–88. [Google Scholar] [CrossRef] [Green Version]
  2. Schekotov, A.; Fedorov, E.; Molchanov, O.; Hayakawa, M. Low frequency electromagnetic precursors as a prospect for earthquake prediction. In Earthquake Prediction Studies: Seismo Electromagnetics; Hayakawa, M., Ed.; Terrapub: Tokyo, Japan, 2013; pp. 81–99. [Google Scholar]
  3. Shrivastava, A. Are pre-seismic ULF electromagnetic emissions considered as a reliable diagnostics for earthquake prediction? Curr. Sci. 2014, 107, 596–600. [Google Scholar]
  4. Zhao, S.; Shen, X.; Liao, L.; Zhima, Z.; Zhou, C.; Wang, Z.; Cui, J.; Lu, H. Investigation of Precursors in VLF Subionospheric Signals Related to Strong Earthquakes (M > 7) in Western China and Possible Explanations. Remote Sens. 2020, 12, 3563. [Google Scholar] [CrossRef]
  5. Chen, H.; Han, P.; Hattori, K. Recent Advances and Challenges in the Seismo-Electromagnetic Study: A Brief Review. Remote Sens. 2022, 14, 5893. [Google Scholar] [CrossRef]
  6. Fraser-Smith, A.; Bernardi, A.; McGill, P.; Ladd, M.; Helliwell, R.; Villard, O., Jr. Low-frequency magnetic field measurements near the epicenter of the Ms 7.1 Loma Prieta earthquake. Geophys. Res. Lett. 1990, 17, 1465–1468. [Google Scholar] [CrossRef]
  7. Uyeda, S.; Hayakawa, M.; Nagao, T.; Molchanov, O.; Hattori, K.; Orihara, Y.; Gotoh, K.; Akinaga, Y.; Tanaka, H. Electric and magnetic phenomena observed before the volcano-seismic activity in 2000 in the Izu Island Region, Japan. Proc. Natl. Acad. Sci. USA 2002, 99, 7352–7355. [Google Scholar] [CrossRef] [PubMed] [Green Version]
  8. Dong, Y.; Gao, C.; Long, F.; Yan, Y. Suspected Seismo-Ionospheric Anomalies before Three Major Earthquakes Detected by GIMs and GPS TEC of Permanent Stations. Remote Sens. 2021, 14, 20. [Google Scholar] [CrossRef]
  9. Su, Y.C.; Sha, J. A Study of Possible Correlations between Seismo-Ionospheric Anomalies of GNSS Total Electron Content and Earthquake Energy. Remote Sens. 2022, 14, 1155. [Google Scholar] [CrossRef]
  10. Asaly, S.; Gottlieb, L.A.; Inbar, N.; Reuveni, Y. Using Support Vector Machine (SVM) with GPS Ionospheric TEC Estimations to Potentially Predict Earthquake Events. Remote Sens. 2022, 14, 2822. [Google Scholar] [CrossRef]
  11. Pulinets, S.A.; Ouzounov, D.; Ciraolo, L.; Singh, R.; Cervone, G.; Leyva, A.; Dunajecka, M.; Karelin, A.V.; Boyarchuk, K.A.; Kotsarenko, A. Thermal, atmospheric and ionospheric anomalies around the time of the Colima M7.8 earthquake of 21 January 2003. Ann. Geophys. 2006, 24, 835–849. [Google Scholar] [CrossRef] [Green Version]
  12. Dautermann, T.; Calais, E.; Haase, J.; Garrison, J. Investigation of ionospheric electron content variations before earthquakes in southern California, 2003–2004. J. Geophys. Res. 2007, 112. [Google Scholar] [CrossRef]
  13. Zhu, F.; Su, F.; Lin, J. Statistical Analysis of TEC Anomalies Prior to M6.0+ Earthquakes During 2003–2014. Pure Appl. Geophys. 2018, 175, 3441–3450. [Google Scholar] [CrossRef]
  14. Oikonomou, C.; Haralambous, H.; Pulinets, S.; Khadka, A.; Paudel, S.R.; Barta, V.; Muslim, B.; Kourtidis, K.; Karagioras, A.; İnyurt, S. Investigation of Pre-Earthquake Ionospheric and Atmospheric Disturbances for Three Large Earthquakes in Mexico. Geosciences 2020, 11, 16. [Google Scholar] [CrossRef]
  15. Romero, R. Osservatorio Permanente Emissioni Radiosismiche (Radio-Seismic Emission Permanent Observatory). 2015. Available online: http://www.vlf.it/opera_2015/opera_2015.html (accessed on 15 February 2023).
  16. Nickolaenko, A.P.; Schekotov, A.Y.; Hayakawa, M.; Romero, R.; Izutsu, J. Electromagnetic manifestations of Tonga eruption in Schumann resonance band. J. Atmos. Sol.-Terr. Phys. 2022, 237, 105897. [Google Scholar] [CrossRef]
  17. Karakelian, D.; Klemperer, S.L.; Fraser-Smith, A.C.; Beroza, G.C. A Transportable System for Monitoring Ultralow Frequency Electromagnetic Signals Associated with Earthquakes. Seismol. Res. Lett. 2000, 71, 423–436. [Google Scholar] [CrossRef]
  18. Lviv Center of Institute for Space Research—State Space Agency of Ukraine. Induction Magnetometer for Geophysical Applications LEMI-120. Available online: https://www.isr.lviv.ua/LEMI-120-eng.pdf (accessed on 2 January 2023).
  19. Tumanski, S. Induction coil sensors—A review. Meas. Sci. Technol. 2007, 18, R31–R46. [Google Scholar] [CrossRef]
  20. Laundal, K.M.; Richmond, A.D. Magnetic Coordinate Systems. Space Sci. Rev. 2016, 206, 27–59. [Google Scholar] [CrossRef] [Green Version]
  21. Emmert, J.T.; Richmond, A.D.; Drob, D.P. A computationally compact representation of Magnetic-Apex and Quasi-Dipole coordinates with smooth base vectors. J. Geophys. Res. Space Phys. 2010, 115. [Google Scholar] [CrossRef] [Green Version]
  22. British Geological Survey. Geomagnetic Coordinate Calculator. Available online: http://www.geomag.bgs.ac.uk/data_service/models_compass/coord_calc.html (accessed on 2 January 2023).
  23. British Geological Survey. International Geomagnetic Reference Field (IGRF). Available online: http://www.geomag.bgs.ac.uk/research/modelling/IGRF.html (accessed on 2 January 2023).
  24. Alken, P.; Thébault, E.; Beggan, C.D.; Amit, H.; Aubert, J.; Baerenzung, J.; Bondar, T.N.; Brown, W.J.; Califf, S.; Chambodut, A.; et al. International Geomagnetic Reference Field: The thirteenth generation. Earth Planets Space 2021, 73. [Google Scholar] [CrossRef]
  25. Mariscotti, A. A Magnetic Field Probe With MHz Bandwidth and 7-Decade Dynamic Range. IEEE Trans. Instrum. Meas. 2009, 58, 2643–2652. [Google Scholar] [CrossRef]
  26. Texas Instrument. TL07xx Low-Noise FET-Input Operational Amplifiers; Texas Instrument: Dallas, TX, USA, 2021. [Google Scholar]
  27. Texas Instrument. TL08xx FET-Input Operational Amplifiers; Texas Instrument: Dallas, TX, USA, 2021. [Google Scholar]
  28. Hao, H.; Wang, H.; Chen, L.; Wu, J.; Qiu, L.; Rong, L. Initial Results from SQUID Sensor: Analysis and Modeling for the ELF/VLF Atmospheric Noise. Sensors 2017, 17, 371. [Google Scholar] [CrossRef] [Green Version]
  29. Angelopoulos, V. The THEMIS Mission. Space Sci. Rev. 2008, 141, 5–34. [Google Scholar] [CrossRef]
  30. Sharma, S.; Swati; Singh, R.P.; Pundhir, D.; Singh, B. Lithospheric Electromagnetic Emissions Associated with Some Major Earthquakes Occurred in Indian Subcontinent. Geomagn. Aeron. 2021, 61, 619–631. [Google Scholar] [CrossRef]
  31. Kittmann, A.; Durdaut, P.; Zabel, S.; Reermann, J.; Schmalz, J.; Spetzler, B.; Meyners, D.; Sun, N.X.; McCord, J.; Gerken, M.; et al. Wide Band Low Noise Love Wave Magnetic Field Sensor System. Sci. Rep. 2018, 8, 278. [Google Scholar] [CrossRef] [PubMed] [Green Version]
  32. Ripka, P. Magnetic Sensors and Magnetometers; Artech House: London, UK, 2001. [Google Scholar]
  33. Analog Devices. AD820: Single Supply, Rail to Rail Low Power FET-Input Op Amp; Analog Devices: Wilmington, MA, USA, 2002. [Google Scholar]
  34. Analog Devices. OP27: Low Noise Precision Operational Amplifier; Analog Devices: Wilmington, MA, USA, 2015. [Google Scholar]
  35. Input/Output Inc. SM-4 Geophone Element; Input/Output Inc.: Stafford, TX, USA, 2006. [Google Scholar]
  36. DL4YHF. Amateur Radio Software: Audio Spectrum Analyzer (Spectrum Lab). Available online: https://www.qsl.net/dl4yhf/spectra1.html (accessed on 2 January 2023).
  37. Kushwah, V.; Singh, V.; Singh, B. Ultra Low Frequency (ULF) amplitude anomalies associated with the recent Pakistan earthquake of 8 October, 2005. J. Indian Geophys. Union 2007, 11, 197–207. [Google Scholar]
  38. Akinaga, Y.; Hattori, K.; Hayakawa, M.; Yumoto, K. ULF emissions associated with earthquakes in Kyushu. Intern. Symp. Antennas Propag. 2000, 99, 36–46. [Google Scholar] [CrossRef]
  39. Hattori, K. ULF geomagnetic field measurements in Japan and some recent results associated with Iwateken Nairiku Hokubu earthquake in 1998. Phys. Chem. Earth 2004, 29, 481–494. [Google Scholar] [CrossRef]
  40. Hayakawa, M.; Ohta, K.; Nickolaenko, A.; Ando, Y. Anomalous effect in Schumann resonance phenomena observed in Japan, possibly associated with the Chi-Chi earthquake in Taiwan. Ann. Geophys. 2005, 23, 1335–1346. [Google Scholar] [CrossRef] [Green Version]
  41. Schekotov, A.; Hayakawa, M. Ultra-Low-Frequency Magnetic Field Depression for Three Huge Oceanic Earthquakes in Japan and in the Kurile Islands. In Proceedings of the IEICE International Symposium on Electromagnetic Compatibility, Tokyo, Japan, 12–16 May 2014. [Google Scholar] [CrossRef]
  42. Ahadi, S.; Puspito, N.; Ibrahim, G.; Saroso, S.; Yumoto, K.; Muzli, M. Anomalous ULF Emissions and Their Possible Association with the Strong Earthquakes in Sumatra, Indonesia, during 2007–2012. J. Math. Fundam. Sci. 2015, 47, 84–103. [Google Scholar] [CrossRef]
  43. Hayakawa, M.; Ohta, K.; Sorokin, V.; Yaschenko, A.; Izutsu, J.; Hobara, Y.; Nickolaenko, A. Interpretation in terms of gyrotropic waves of Schumann-resonance-like line emissions observed at Nakatsugawa in possible association with nearby Japanese earthquakes. J. Atmos. Sol.-Terr. Phys. 2010, 72, 1292–1298. [Google Scholar] [CrossRef]
  44. Chauhan, V.; Singh, O.; Kushwaha, V.; Singha, V.; Singh, B. Ultra-low-frequency (ULF) and total electron content (TEC) anomalies observed at Agra and their association with regional earthquakes. J. Geodyn. 2009, 48, 68–74. [Google Scholar] [CrossRef]
  45. Chauhan, V.; Singh, O.; Pandey, U.; Singh, B.; Arrora, B.; Rawat, G.; Pathan, B.; Sinha, A.; Sharma, A.; Patil, A. A search for precursors of earthquakes from multi-station ULF observations and TEC measurements in India. Indian J. Radio Space Phys. 2012, 41, 543–556. [Google Scholar]
  46. Febriani, F.; Han, P.; Yoshino, C.; Hattori, K.; Nurdiyanto, B.; Effendi, N.; Maulana, I.; Gaffar, E. Ultra low frequency (ULF) electromagnetic anomalies associated with large earthquakes in Java Island, Indonesia by using wavelet transform and detrended fluctuation analysis. Nat. Hazards Earth Syst. Sci. 2014, 14, 789–798. [Google Scholar] [CrossRef] [Green Version]
  47. Kopytenko, Y.; Ismaguilov, V.; Hattori, K.; Hayakawa, M. Anomaly disturbances of the magnetic fields before the strong earthquake in Japan on March 11, 2011. Ann. Geophys. 2012, 55. [Google Scholar] [CrossRef]
  48. Kanata, B.; Zubaidah, T.; Ramadhani, C.; Irmawati, B. Changes of the geomagnetic signals linked to Tohoku earthquake on March 11th 2011. Int. J. Technol. 2014, 5, 251–258. [Google Scholar] [CrossRef]
  49. Blitzortung.com Contributors. Network for Lightning and Thunderstorm in Real Time. Available online: https://www.blitzortung.org (accessed on 2 January 2023).
  50. Institutet för rymdfysik. Kiruna Atmospheric and Geophysical Observatory. Available online: https://www2.irf.se/maggraphs/puls.php (accessed on 2 January 2023).
  51. University of Oulu. Sodankylä Geophysical Observatory. Available online: https://www.sgo.fi/Data/Pulsation/pulArchive.php (accessed on 2 January 2023).
  52. Straser, V. Intervals of pulsation of diminishing periods and radio anomalies found before the occurrence of M6+ earthquakes. New Concepts Glob. Tectonics Newsl. 2012, 65, 35–46. [Google Scholar]
  53. Hattori, K.; Serita, A.; Yoshino, C.; Hayakawa, M.; Isezaki, N. Singular spectral analysis and principal component analysis for signal discrimination of ULF geomagnetic data associated with 2000 Izu Island Earthquake Swarm. Phys. Chem. Earth 2006, 31, 281–291. [Google Scholar] [CrossRef]
  54. Li, K.; Pan, W. Propagation of SLF/ELF Electromagnetic Waves; Springer Science: Berlin/Heidelberg, Germany, 2013. [Google Scholar]
  55. Molchanov, O.; Schekotov, A.; Solovieva, M.; Fedorov, E.; Gladyshev, V.; Gordeev, E.; Chebrov, V.; Saltykov, D.; Sinitsin, V.; Hattori, K.; et al. Near-seismic effects in ULF fields and seismo-acoustic emission: Statistics and explanation. Nat. Hazards Earth Syst. Sci. 2005, 5, 1–10. [Google Scholar] [CrossRef] [Green Version]
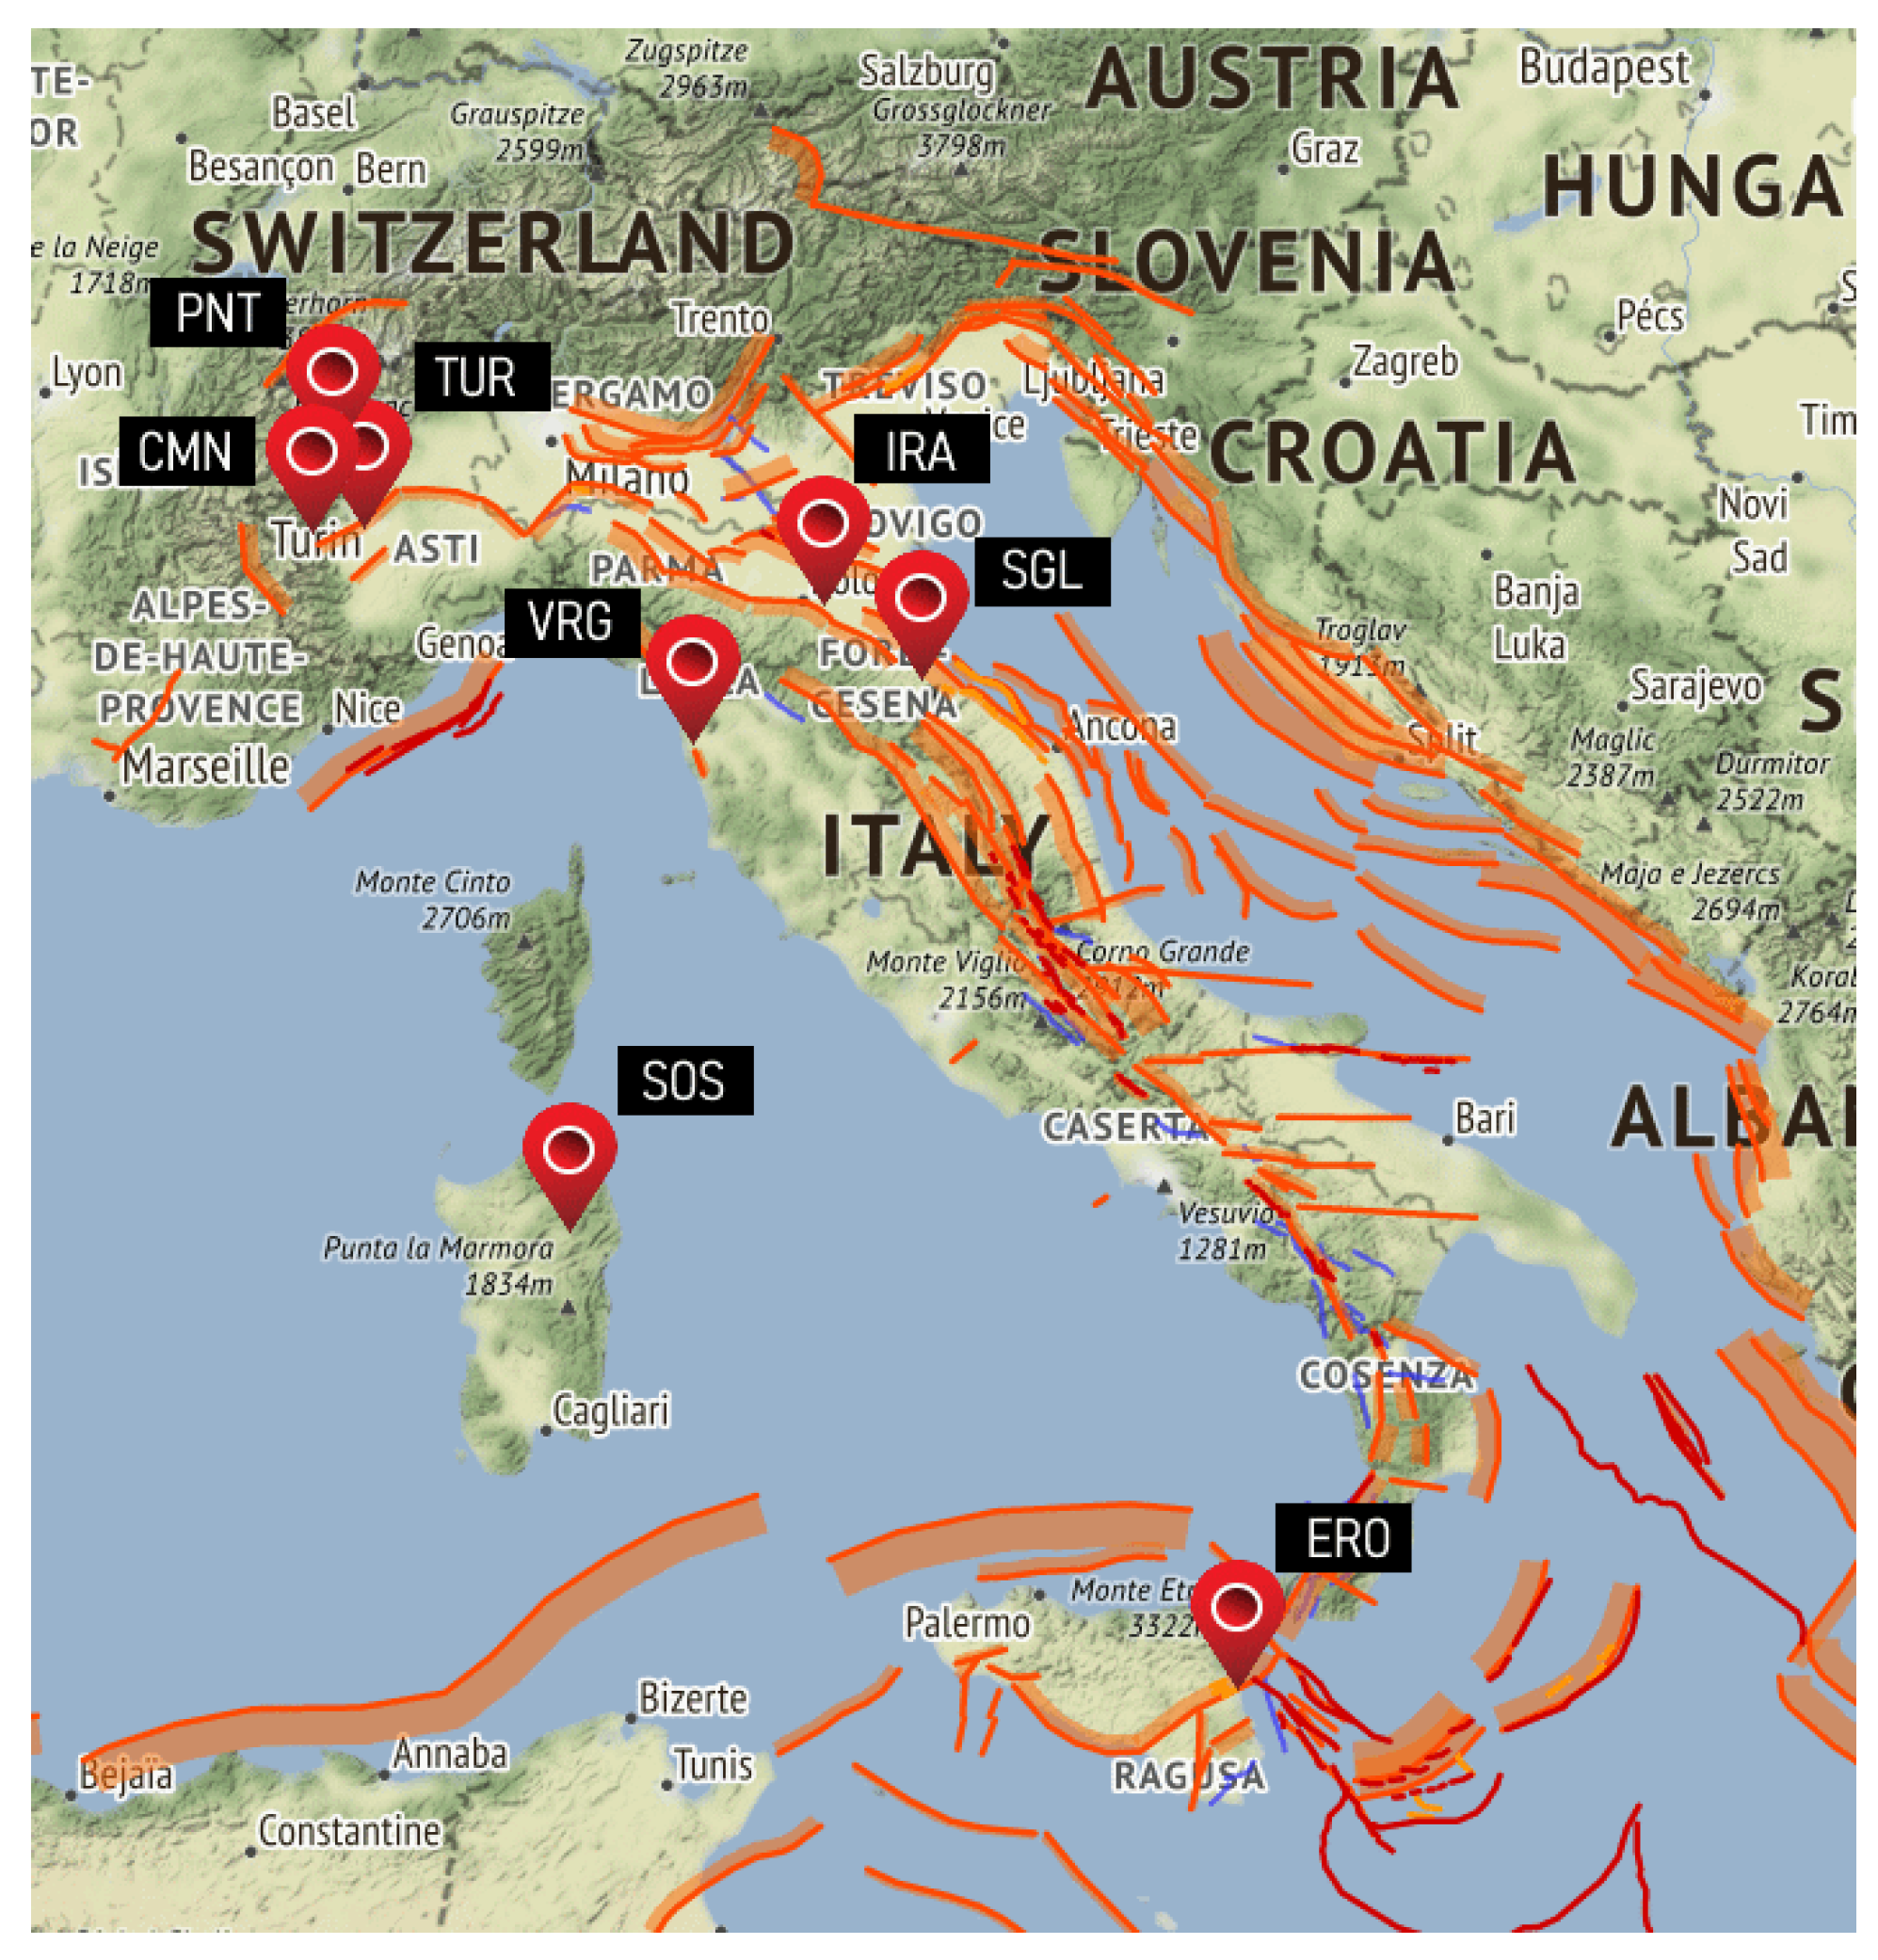
Figure 1. Location of monitoring stations over Italy: the six Opera 2015 stations are identified as CMN, PNT, TUR, IRA, SGL and ERO; the other two stations were added later, and they are SOS (for Sos Enattos in Sardinia) and VRG (for the EGO installation at Cascina near Pisa, in cooperation with the Virgo project).
Sensors 23 02379 g001
Figure 2. H-field solenoid with ferrite core: (a) final assembly; (b) construction detail with coil sections and ferrite rod.
Sensors 23 02379 g002
Figure 3. Schematic of the ICS101 large-gain amplifier for the induction coil, including the Chebychev low-pass filter (LPF).
Sensors 23 02379 g003
Figure 4. Frequency response of the induction coil sensor: without (green curve) and with (dark red curve) the 36 Hz LPF: letters “a” and “b” indicate the corner frequency and the 50 Hz point of the curve.
Sensors 23 02379 g004
Figure 5. Picture of the ICS101 induction coil amplifier.
Sensors 23 02379 g005
Figure 6. Picture of the Marconi wire antenna for E-field measurements (dimensions and construction details provided in the text).
Sensors 23 02379 g006
Figure 7. Schematic of the high-input impedance amplifier of the Marconi wire antenna.
Sensors 23 02379 g007
Figure 8. Picture of the LNVA 20–24 amplifier for the Marconi wire antenna.
Sensors 23 02379 g008
Figure 9. Schematic of the geophone amplifier.
Sensors 23 02379 g009
Figure 10. Picture of the geophone (left side) with an amplifier. Shielding and ground plane distribution were achieved using a copper board on which a second printed circuit board was located and electrically bonded where needed.
Sensors 23 02379 g010
Figure 11. Spectrograms from two orthogonal induction coils; signals processed with the direction-finding technique (spectrum color indicating the direction of arrival).
Sensors 23 02379 g011
Figure 12. Rolling spectrograms of the four days preceding event no. 034 (Table 5).
Sensors 23 02379 g012
Figure 13. Rolling spectrograms for the interval ± 1 day around event no. 036 (Courtesy of the Kiruna Atmospheric and Geophysical Observatory [50]).
Sensors 23 02379 g013
Figure 14. Graphical representation of R I vs. distance, D, and magnitude, M.
Sensors 23 02379 g014
Figure 15. Magnitude–distance plot of collected EQ events: Opera 2015 (Table 5, black), positively identified EQs from the literature (Table 6, green), dubious positive EQ events (blue), dubious negative EQ events (orange) and [52] (purple). The light green and light brown areas correspond to R I 30   dBe (positive precursor) and R I 10   dBe (negative precursor) with a gray area in between.
Sensors 23 02379 g015
Table 1. Opera 2015 monitoring stations.
StationLatitudeLongitudeHeight (m)Measurement Equipment
IK1QFK, Cumiana (TO), Italy (CMN)44.9563877.419848278Two orthogonal induction coils, Marconi antenna, geophone, GPS
CSP VLF, Rifugio Pontese (TO), Italy (PNT)45.4958997.3688512182Multi-turn aerial loop, diff. E-field receiver
Etna Radio Obs. Nicolosi (CT), Etna Park, Sicily, Italy (ERO)37.63117715.022294835Induction Coil, Geophone
Romagna Obs., Fiumicino (FC) Sogliano al Rubicone (FC), Italy (SGL)43.93889812.226351543Induction Coil, Geophone
Northern Cross Radiotelescope, Medicina (BO), Italy (IRA)44.52435911.6449787Induction coil, static electric field receiver
TORINO VLF Monitoring Station, Turin, Italy (TUR)45.0662787.723683246Marconi antenna, diff. E-field receiver, flux-gate sensor
Table 2. Earth’s magnetic field parameters of monitoring stations: latitude and longitude of the dipole and quasi-dipole models; declination, D, inclination, I, North oriented intensity, X, Eastern oriented intensity, Y, horizontal intensity, H, vertical intensity, Z, and total intensity, F, as main field components and secular variation (expressed per year) reported in parentheses.
StationDip.
Lat.
Long.
Dip.
Quasi-Dip.
Lat.
Quasi-Dip.
Long.
D
°East
I
°Down
X
(nT)
Y
(nT)
H
(nT)
Z
(nT Down)
F
(nT)
CMN45.8289.7639.5383.091.787
(0.148)
60.923
(0.01)
22,856
(12.1)
713
(59.5)
22,867
(14.0)
41,124
(41.3)
47,054
(42.9)
PNT46.3689.9040.1783.121.768
(0.15)
61.451
(0.01)
22,538
(11.6)
696
(59.4)
22,549
(13.4)
41,446
(41.5)
47,183
(42.8)
ERO37.4195.0331.0389.132.995
(0.118)
53.267
(0.017)
26,891
(14.1)
1407
(56.2)
26,928
(17.0)
36,083
(45.5)
45,023
(46.7)
SGL44.0394.1438.3687.152.829
(0.138)
60.243
(0.015)
23,317
(9.4)
1152
(56.7)
23,345
(12.2)
40,834
(46.9)
47,037
(46.8)
IRA44.6993.7639.0486.712.731
(0.14)
60.793
(0.015)
23,005
(9.2)
1097
(57.0)
23,031
(11.9)
41,197
(46.5)
47,197
(46.4)
TUR45.8890.1039.6683.371.859
(0.148)
61.054
(0.01)
22,788
(11.8)
740
(59.3)
22,800
(13.7)
41,224
(41.8)
47,109
(43.2)
SOS41.0990.3534.1684.352.170
(0.132)
56.194
(0.013)
25,373
(15.3)
961
(58.7)
25,391
(17.5)
37,920
(40.8)
45,635
(43.7)
VRG44.0292.3637.9785.602.466
(0.14)
59.798
(0.013)
23,535
(11.1)
1013
(57.8)
23,557
(13.5)
40,471
(44.6)
46,828
(45.4)
Table 3. Characteristics of the induction coil system using the ICS101 amplifier.
Parameter/CharacteristicValue
Inductance (without and with ferrite core)23 H, 1650 H
Resistance11,220  Ω
Lower cut-off frequency 1.3 Hz
Self resonating frequency200 Hz
Parasitic capacitance (calculated from resonance)385 pF
Input equivalent noise 22.7 nV/ Hz
Antenna factor A F at center band ( 10 Hz) 0.22 mV/nT at gain = 0 dB
Ferrite core voltage gain144
Ferrite core impedance increase71
Table 4. Characteristics of the LNVA 20–24 amplifier.
Parameter/CharacteristicValue
Frequency range 0.7 Hz–15 kHz
Gain (selectable)0 dB, 12 dB, 24 dB
Low-pass filter (selectable)100 Hz, 15 kHz
Input impedance10 M Ω
Output impedance620  Ω
Equivalent input noise0.4  μ V/ H z
Table 5. Selected EQ events of Opera 2015.
IDDateUTCLocationMDist. (km)Depth (km)RI (dBe)
00110 Jan. 201523:50:02Sicilia sea, Italy3.924320−13.1
00223 Jan. 201506:51:20Pistoia, Italy4.379310−22.5
00328 Jan. 201515:54:37Creete, Greece5.297420−11.7
00431 Jan. 201506:30:00Etna eruption, Italy
0056 Feb. 201508:52:25Lipari island, Italy4.71192568.2
00613 Feb. 201518:59:16Northern Mid-Atlantic6.8396217-5.9
00717 Feb. 201519:42:53Firenze, Italy3.97898−34.4
0084 Mar. 201500:00:04Florence, Italy3.77399−30.6
00927 Mar. 201523:34:54Creete, Greece5.4105674−9.7
01029 Mar. 201510:48:46Calabria, Italy3.611610.7−7.9
01129 Mar. 201523:48:30Papua New Guinea7.614,3722010.7
0121 Apr. 201504:58:11Forlì, Italy3.278021−38.8
01311 Apr. 201505:33:13Alpi Cozie, Italy3.2103510−42.4
01416 Apr. 201518:07:43Creete, Greece6.41090194.9
01520 Apr. 201501:07:42Etna, Italy3.6232.713.4
01624 Apr. 201515:02:54Forlì, Italy4.078122−26.8
01725 Apr. 201506:11:26Nepal7.76446101.22
01812 May 201507:05:20Nepal7.3659210.2−5.1
01924 May 201506:00:33Aspromonte, Italy3.99662−0.9
02029 May 201513:07:57Adriatic sea, Italy4.259615−20.3
02130 May 201511:23:02Bonin Islands7.610,795675.4−7.0
0229 Jun. 201501:09:03Greece5.173610−9.5
0239 Jun. 201521:49:49Creete, Greece5.4108734.2−10.1
02422 Jul. 201512:57:43Bologna, Italy3.780422−31.7
0252 Aug. 201506:58:06Cosenza, Italy4.0206240−9.4
0263 Aug. 201507:27:48Cosenza, Italy4.021226−9.8
02724 Aug. 201503:43:54Forlì-Cesena, Italy3.57819−34.3
02829 Aug. 201518:47:03Slovenia-Italy4.09737−29.6
02910 Sep. 201507:32:08Turin, Italy3.1103411−43.9
03013 Sep. 201501:04:34Florence, Italy3.87379−29.0
03116 Sep. 201522:54:33Near coast of Chile8.211,80890.8
03218 Sep. 201519:24:52Pesaro-Urbino, Italy3.570510−33.0
03319 Sep. 201507:12:47Pesaro-Urbino, Italy3.77047−29.9
03420 Sep. 201522:27:58Siracusa, Italy3.874230.9
03520 Oct. 201510:35:50Modena, Italy3.58727−35.7
03626 Oct. 201509:09:32Hindu Kush, Afghanistan7.548781931.9
0371 Nov. 201507:52:03Slovenia-Croatia4.891810−16.9
0386 Nov. 201504:03:04France-Italy3.8103111−33.4
03917 Nov. 201507:10:08Greece6.54961016.6
04017 Nov. 201508:33:46Greece5.349434−1.3
04118 Nov. 201512:15:39Greece5.050910−6.2
04220 Nov. 201505:12:24Greece5.048510−5.6
04324 Nov. 201522:50:54Peru-Brazil7.610,334624−6.4
0448 Dec. 201509:28:31Catania, Italy ( 1 ) 3.419212.9
04520 Dec. 201509:46:03Sicilian Coast, Italy4.21505−2.3
(1) Etna eruption occurred at the same time.
Table 6. Overview of EQ events collected from the literature.
IDDateUTCLocationMDist. (km) RI (dBe)Ref.
E017 Dec. 198811:41Spitak, Armenia6.914039.1[37]
E0217 Oct. 19894:15Mt. Loma Prieta, California7.15255.0[6]
E0317 Oct. 19894:15Mt. Loma Prieta, California7.1781.1[6]
E048 Aug. 19938:34Guam, Japan8.06552.1[37]
E0517 Feb. 19965:59Biak, Indonesia8.28065.9[3]
E0626 Mar. 19978:31Kyushu, Kagoshima region, Japan6.56443.3[38]
E0713 May 19975:38Kyushu, Kagoshima region, Japan6.36440.3[38]
E083 Sep. 19987:58Iwate-ken Nairiku-Hokubu, Japan6.11556.2[39]
E0921 Sep. 199917:47Chi-chi, Taiwan7.6200015.0[40]
E1023 Oct. 20048:56Chuetsu, Niigata, Japan6.825030.1[40]
E118 Oct. 2005ndMuzaffarabad, Kashmir, Pakistan7.790826.8[37]
E1215 Nov. 2006ndKuril Island, Japan8.3252011.2[41]
E1315 Nov. 2006ndKuril Island, Japan8.375019.1[41]
E1415 Nov. 2006ndKuril Island, Japan8.3154014.4[41]
E1513 Jan. 2007ndKuril Island, Japan8.185033.6[41]
E1613 Jan. 2007ndKuril Island, Japan8.1163025.1[41]
E1713 Jan. 2007ndKuril Island, Japan8.1260919.0[41]
E186 Mar. 2007ndSingkarak, Sumatra6.47939.1[42]
E1925 Mar. 20070:41Noto-Hantou peninsula, Japan6.920034.5[43]
E204 Oct. 2007ndIndia/Pakistan/Nepal area4.6628−14.9[44]
E2125 Nov. 2007ndIndia/Pakistan/Nepal area4.71723.4[44]
E2212 May 20086:28Wenchuan, China7.9125125.6[45]
E2312 May 20086:28Wenchuan, China7.9237617.2[45]
E2412 May 20086:28Wenchuan, China7.9249616.6[45]
E2512 May 20086:28Wenchuan, China7.9336812.7[45]
E266 Apr. 20093:32L’Aquila, Italy6.363010.5[3]
E2716 Aug. 2009ndMentawai, Sumatra6.720831.0[42]
E289 Sep. 2009ndTasikmalaya, Indonesia7.513548.6[46]
E2930 Sep. 2009ndPadang, Sumatra7.611438.8[42]
E3025 Oct. 2010ndMentawai, Sumatra7.842438.2[42]
E3111 Mar. 20115:46Tohoku, Japan8.917066.6[47]
E3211 Mar. 20115:46Tohoku, Japan8.920064.5[47]
E3311 Mar. 20115:46Tohoku, Japan8.930059.2[47]
E3411 Mar. 20115:46Tohoku, Japan8.942054.8[47]
E3511 Mar. 20115:46Tohoku, Japan9.030160.6[48]
E3611 Mar. 20115:46Tohoku, Japan9.064250.8[48]
E3711 Mar. 20115:46Tohoku, Japan9.0129541.6[48]
Disclaimer/Publisher’s Note: The statements, opinions and data contained in all publications are solely those of the individual author(s) and contributor(s) and not of MDPI and/or the editor(s). MDPI and/or the editor(s) disclaim responsibility for any injury to people or property resulting from any ideas, methods, instructions or products referred to in the content.