

Pressure-Relieving Effect of Different Insole Top Covers in People with Diabetes at High Risk of Foot Ulceration

 , ,
, ,
Abstract
1. Introduction
2. Methods
2.1. Study Design
2.2. Participants
2.3. Insole Top Cover Conditions
2.4. Measurements
2.5. Data Analysis
2.6. Statistical Analysis
3. Results
4. Discussion
Strengths and Limitations
5. Conclusions
Supplementary Materials
Author Contributions
Funding
Institutional Review Board Statement
Informed Consent Statement
Data Availability Statement
Conflicts of Interest
References
- Armstrong, D.G.; Tan, T.W.; Boulton, A.J.M.; Bus, S.A. Diabetic foot ulcers: A review. JAMA 2023, 330, 62–75. [Google Scholar] [CrossRef]
- Bus, S.A.; Waaijman, R.; Arts, M.; de Haart, H.; Busch-Westbroek, T.; Van, B.J.; Nollet, F. Effect of custom-made footwear on foot ulcer recurrence in diabetes: A multicenter randomized controlled trial. Diabetes Care 2013, 36, 4109–4116. [Google Scholar] [CrossRef]
- Bus, S.A.; Sacco, I.C.N.; Monteiro-Soares, M.; Raspovic, A.; Paton, J.; Rasmussen, A.; Lavery, L.A.; van Netten, J.J. Guidelines on the prevention of foot ulcers in persons with diabetes (IWGDF 2023 update). Diabetes Metab. Res. Rev. 2024, 40, e3651. [Google Scholar] [CrossRef]
- Arts, M.L.; de Haart, M.; Waaijman, R.; Dahmen, R.; Berendsen, H.; Nollet, F.; Bus, S.A. Data-driven directions for effective footwear provision for the high-risk diabetic foot. Diabet. Med. 2015, 32, 790–797. [Google Scholar] [CrossRef]
- Chapman, J.D.; Preece, S.; Braunstein, B.; Höhne, A.; Nester, C.J.; Brueggemann, P.; Hutchins, S. Effect of rocker shoe design features on forefoot plantar pressures in people with and without diabetes. Clin. Biomech. 2013, 28, 679–685. [Google Scholar] [CrossRef]
- Guldemond, N.A.; Leffers, P.; Schaper, N.C.; Sanders, A.P.; Nieman, F.; Willems, P.; Walenkamp, G.H. The effects of insole configurations on forefoot plantar pressure and walking convenience in diabetic patients with neuropathic feet. Clin. Biomech. 2007, 22, 81–87. [Google Scholar] [CrossRef]
- Mueller, M.J.; Lott, D.J.; Hastings, M.K.; Commean, P.K.; Smith, K.E.; Pilgram, T.K. Efficacy and mechanism of orthotic devices to unload metatarsal heads in people with diabetes and a history of plantar ulcers. Phys. Ther. 2006, 86, 833–842. [Google Scholar] [CrossRef]
- Owings, T.M.; Woerner, J.L.; Frampton, J.D.; Cavanagh, P.R.; Botek, G. Custom therapeutic insoles based on both foot shape and plantar pressure measurement provide enhanced pressure relief. Diabetes Care 2008, 31, 839–844. [Google Scholar] [CrossRef]
- van Schie, C.; Ulbrecht, J.S.; Becker, M.B.; Cavanagh, P.R. Design criteria for rigid rocker shoes. Foot Ankle Int. 2000, 21, 833–844, Erratum in Foot Ankle Int. 2001, 22, 184–185. [Google Scholar] [CrossRef]
- Zwaferink, J.B.J.; Custers, W.; Paardekooper, I.; Berendsen, H.A.; Bus, S.A. Effect of a carbon reinforcement for maximizing shoe outsole bending stiffness on plantar pressure and walking comfort in people with diabetes at high risk of foot ulceration. Gait Posture 2021, 86, 341–345. [Google Scholar] [CrossRef]
- Bus, S.A.; Ulbrecht, J.S.; Cavanagh, P.R. Pressure relief and load redistribution by custom-made insoles in diabetic patients with neuropathy and foot deformity. Clin. Biomech. 2004, 19, 629–638. [Google Scholar] [CrossRef] [PubMed]
- Bus, S.A.; Zwaferink, J.B.; Dahmen, R.; Busch-Westbroek, T. State of the art design protocol for custom made footwear for people with diabetes and peripheral neuropathy. Diabetes Metab. Res. Rev. 2020, 36 (Suppl. S1), e3237. [Google Scholar] [CrossRef]
- Collings, R.; Freeman, J.; Latour, J.M.; Paton, J. Footwear and insole design features for offloading the diabetic at risk foot-A systematic review and meta-analyses. Endocrinol. Diabetes Metab. 2021, 4, e00132. [Google Scholar] [CrossRef]
- Brodsky, J.W.; Pollo, F.E.; Cheleuitte, D.; Baum, B.S. Physical properties, durability, and energy-dissipation function of dual-density orthotic materials used in insoles for diabetic patients. Foot Ankle Int. 2007, 28, 880–889. [Google Scholar] [CrossRef] [PubMed]
- Paton, J.; Jones, R.B.; Stenhouse, E.; Bruce, G. The physical characteristics of materials used in the manufacture of orthoses for patients with diabetes. Foot Ankle Int. 2007, 28, 1057–1063. [Google Scholar] [CrossRef]
- Nilsen, F.; Molund, M.; Lium, E.A.; Hvaal, K.H. Material Selection for Diabetic Custom Insoles: A Systematic Review of Insole Materials and Their Properties. J. Prosthet. Orthot. 2021, 34, e131–e143. [Google Scholar] [CrossRef]
- Gerrard, J.M.; Bonanno, D.R.; Whittaker, G.A.; Landorf, K.B. Effect of different orthotic materials on plantar pressures: A systematic review. J. Foot Ankle Res. 2020, 13, 35. [Google Scholar] [CrossRef] [PubMed]
- Schaper, N.C.; van Netten, J.J.; Apelqvist, J.; Bus, S.A.; Fitridge, R.; Game, F.; Monteiro-Soares, M.; Senneville, E.; Board, I.E. Practical guidelines on the prevention and management of diabetes-related foot disease (IWGDF 2023 update). Diabetes Metab. Res. Rev. 2024, 40, e3657. [Google Scholar] [CrossRef]
- Bus, S.A.; de Lange, A. A comparison of the 1-step, 2-step, and 3-step protocols for obtaining barefoot plantar pressure data in the diabetic neuropathic foot. Clin. Biomech. 2005, 20, 892–899. [Google Scholar] [CrossRef]
- Arts, M.L.; Bus, S.A. Twelve steps per foot are recommended for valid and reliable in-shoe plantar pressure data in neuropathic diabetic patients wearing custom made footwear. Clin. Biomech. 2011, 26, 880–884. [Google Scholar] [CrossRef]
- Waaijman, R.; Bus, S.A. The interdependency of peak pressure and pressure-time integral in pressure studies on diabetic footwear: No need to report both parameters. Gait Posture 2012, 35, 1–5. [Google Scholar] [CrossRef]
- Nouman, M.; Dissaneewate, T.; Leelasamran, W.; Chatpun, S. The insole materials influence the plantar pressure distributions in diabetic foot with neuropathy during different walking activities. Gait Posture 2019, 74, 154–161. [Google Scholar] [CrossRef]
- Healy, A.; Dunning, D.N.; Chockalingam, N. Effect of insole material on lower limb kinematics and plantar pressures during treadmill walking. Prosthet. Orthot. Int. 2012, 36, 53–62. [Google Scholar] [CrossRef]
- Rogers, K.; Otter, S.; Birch, I. The effect of PORON® and Plastazote® insoles on forefoot plantar pressures. Br. J. Podiatry 2006, 9, 111–114. [Google Scholar]
- Tong, J.W.; Ng, E.Y. Preliminary investigation on the reduction of plantar loading pressure with different insole materials (SRP–Slow Recovery Poron®, P–Poron®, PPF–Poron®+Plastazote, firm and PPS–Poron®+Plastazote, soft). Foot 2010, 20, 1–6. [Google Scholar] [CrossRef]
- Waaijman, R.; Keukenkamp, R.; de Haart, M.; Polomski, W.P.; Nollet, F.; Bus, S.A. Adherence to wearing prescription custom-made footwear in patients with diabetes at high risk for plantar foot ulceration. Diabetes Care 2013, 36, 1613–1618. [Google Scholar] [CrossRef] [PubMed]
- Yavuz, M.; Ersen, A.; Hartos, J.; Schwarz, B.; Garrett, A.G.; Lavery, L.A.; Wukich, D.K.; Adams, L.S. Plantar Shear Stress in Individuals With a History of Diabetic Foot Ulcer: An Emerging Predictive Marker for Foot Ulceration. Diabetes Care 2017, 40, e14–e15. [Google Scholar] [CrossRef] [PubMed]

| Top Cover | Material Brand Name | Thickness | Properties | Image | Shore A | Density (g/cm3) | |
|---|---|---|---|---|---|---|---|
| A | Top | Plastazote® 1 | 3 mm | Closed-cell polyethylene | 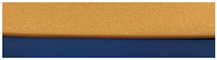 | 18 | 0.05 |
| Bottom | PPT® 2 | 3 mm | Open-cell polyurethane |  | 20 | 0.38 | |
| B | Top | P-cell® 3 | 3 mm | Closed-cell ethyl vinyl acetate |  | 20 | 0.07 |
| Bottom | PPT® 2 | 3 mm | Open-cell polyurethane |  | 20 | 0.38 | |
| C | Top | Nora Aero sorb W® 4 | 3 mm | Closed-cell |  | soft | 0.16 |
| Bottom | Nora Astro form 8® 4 | 3 mm | Open-cell |  | 8 | 0.21 | |
| D | PPT® 2 | 6 mm | Open-cell polyurethane |  | 12 | 0.35 | |
| E | PPT® 2 | 3 mm | Open-cell polyurethane |  | 20 | 0.38 | |
| F | Nora Lunatec Motion® 4 | 6 mm | Closed-cell | 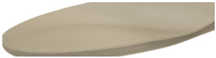 | 12 | 0.13 | |
| G | Top | Poron® 5 | 3 mm | Open-cell polyurethane | 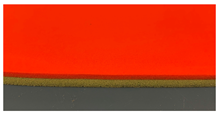 | 17 | 0.24 |
| Bottom | Vepur Polyurethane (PU)® 5 | 4 mm | Open-cell polyurethane | - | - | ||
| H | Top | DiaPod® 6 | 4 mm | Closed-cell | 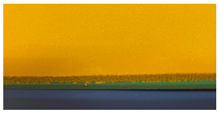 | 25 | 0.15 |
| Bottom | Vibram® Vipod® 6 | 2 mm | Closed-cell | 20 | 0.24 |
| Participants | n = 20 |
|---|---|
| Characteristics | |
| Age (years) | 71 ± 7 |
| Sex (female/male) | 15% (3)/85% (17) |
| Diabetes type (1/2) | 15% (3)/85% (17) |
| Diabetes duration (years) | 20 ± 15 |
| BMI (kg/m2) | 31 ± 6 |
| Loss of protective sensation | 100% (20) |
| Walking speed (m/s) | 1.0 ± 0.2 |
| Foot ulcer history | n = 18 |
| Ulcer history | 90% (18) |
| 45% (9) |
| Time since healing of last ulcer (months) * | 15 ± 17 |
| Foot (most recent ulcer) | |
| 39% (7) |
| 61% (11) |
| Ulcer location (most recent ulcer) | |
| Plantar | |
| 33% (6) |
| 28% (5) |
| 17% (3) |
| 0 |
| 5% (1) |
| Dorsal | 17% (3) |
| Feet | n = 40 |
| ROI ** | |
| 45% (18) |
| 18% (7) |
| 28% (11) |
| 5% (2) |
| 5% (2) |
| Barefoot PPP (kPa) at ROI during walking | |
| 981 (239) |
| 944 (285) |
| Foot deformities *** | |
| 13% (5) |
| 8% (3) |
| 78% (31) |
| 3% (1) |
| Amputations | |
| 97% (39) |
| 3% (1) |
| Insole | Name (Bottom/Top) | ROI | Hallux | MTH1 | MTH23 | MTH45 | Medial Midfoot | |
|---|---|---|---|---|---|---|---|---|
| A | PPT/Plastazote, 6 mm | Mean | 173.5 | 153.3 | 143.2 | 149.3 | 111.0 | 107.4 |
| SD | (55.9) | (68.9) | (40.6) | (32.8) | (31.8) | (37.8) | ||
| B | PPT/P-cell, 6 mm | Mean | 168.3 | 149.7 | 137.7 | 148.0 | 114.9 | 107.1 |
| SD | (52.0) | (67.1) | (36.1) | (31.9) | (34.8) | (35.8) | ||
| C | Astro form/Aero sorb, 6 mm | Mean | 166.6 | 148.3 | 138.6 | 149.1 | 110.8 | 104.5 |
| SD | (55.5) | (70.1) | (35.9) | (30.3) | (31.7) | (43.4) | ||
| D | PPT, 6 mm | Mean | 171.4 | 155.7 | 142.9 | 149.0 | 112.8 | 104.4 |
| SD | (57.5) | (72.0) | (36.4) | (31.0) | (31.5) | (37.6) | ||
| E | PPT, 3 mm | Mean | 185.9 a | 160.3 | 153.4 c | 164.8 d | 116.2 | 112.5 g |
| SD | (65.4) | (81.7) | (40.9) | (38.3) | (37.2) | (42.9) | ||
| F | Lunatec, 6 mm | Mean | 168.6 | 152.3 | 142.0 | 149.2 | 111.4 | 105.6 |
| SD | (66.0) | (69.1) | (39.4) | (34.7) | (31.4) | (43.1) | ||
| G | Vepur/Poron, 7 mm | Mean | 175.7 b | 157.0 | 144.4 | 157.7 e | 116.6 | 105.0 |
| SD | (58.0) | (72.7) | (36.5) | (38.2) | (38.8) | (41.4) | ||
| H | Vipod/DiaPod, 6 mm | Mean | 174.8 | 160.5 | 148.1 | 152.6 | 119.0 f | 113.9 h |
| SD | (51.5) | (69.0) | (35.0) | (27.0) | (28.6) | (36.8) | ||
| F P Effect size | 6.278 <0.001 0.147 | 3.445 0.007 0.081 | 4.977 0.002 0.113 | 15.324 <0.001 0.282 | 3.426 0.024 0.081 | 7.865 <0.001 0.168 |
| Insole | Name | Shoe Fit | Walking Comfort | |
|---|---|---|---|---|
| A | PPT/Plastazote, 6 mm | Mean | 8.1 | 8.0 |
| SD | (1.2) | (1.1) | ||
| B | PPT/P-cell, 6 mm | Mean | 8.1 | 8.2 |
| SD | (1.4) | (1.3) | ||
| C | Astro form/Aero sorb, 6 mm | Mean | 8.1 | 8.3 |
| SD | (1.3) | (1.4) | ||
| D | PPT, 6 mm | Mean | 8.0 | 8.3 |
| SD | (1.6) | (1.2) | ||
| E | PPT, 3 mm | Mean | 8.4 | 8.4 |
| SD | (1.0) | (0.8) | ||
| F | Lunatec, 6 mm | Mean | 8.3 | 8.3 |
| SD | (1.3) | (1.0) | ||
| G | Vepur/Poron, 7 mm | Mean | 7.8 | 8.0 |
| SD | (1.5) | (1.5) | ||
| H | Vipod/DiaPod, 6 mm | Mean | 8.3 | 8.3 |
| SD | (1.4) | (1.2) |
| Insole | Name | N | ROI | Hallux | MTH1 | MTH23 | MTH45 | Medial Midfoot | |
|---|---|---|---|---|---|---|---|---|---|
| A | PPT/Plastazote, 6 mm | 10 | Mean | 2.7 | 1.6 | −3.8 | 13.2 | −1.8 | −0.2 |
| SD | 12.0 | 19.0 | 15.7 | 25.2 | 12.4 | 8.3 | |||
| B | PPT/P-cell, 6 mm | 9 | Mean | 47.8 | 40.5 | −2.6 | 28.2 | 14.3 | 3.2 |
| SD | 68.7 | 69.7 | 38.8 | 50.5 | 44.5 | 30.9 | |||
| C | Astro form/Aero sorb, 6 mm | 9 | Mean | 12.7 | 15.3 * | −2.0 | 1.8 | 4.8 | 7.3 |
| SD | 18.9 | 17.8 | 31.2 | 15.9 | 27.4 | 8.9 | |||
| D | PPT, 6 mm | 7 | Mean | −2.7 | −37.6 * | −4.9 | 7.2 | 0.8 | −11.4 * |
| SD | 44.5 | 33.8 | 40.9 | 38.6 | 14.3 | 29.3 | |||
| E | PPT, 3 mm | 10 | Mean | −1.9 | 13.8 | −9.6 | 0.2 | −7.5 | −4.8 |
| SD | 29.8 | 27.4 | 21.8 | 24.8 | 15.0 | 15.4 | |||
| F | Lunatec, 6 mm | 10 | Mean | −0.7 | −10.8 | −5.1 | 9.5 | 4.6 | −5.9 |
| SD | 20.1 | 25.3 | 18.3 | 19.6 | 21.2 | 15.9 | |||
| G | Vepur/Poron, 7 mm | 9 | Mean | 20.4 | 19.6 | −12.6 | −30.0 * | −17.1 | −4.6 |
| SD | 50.4 | 54.3 | 33.2 | 37.4 | 24.3 | 13.5 | |||
| H | Vipod/DiaPod, 6 mm | 8 | Mean | 2.5 | −11.7 | −9.8 | −10.6 | −9.7 | −4.4 * |
| SD | 23.1 | 22.8 | 24.7 | 19.0 | 12.8 | 23.1 |
Disclaimer/Publisher’s Note: The statements, opinions and data contained in all publications are solely those of the individual author(s) and contributor(s) and not of MDPI and/or the editor(s). MDPI and/or the editor(s) disclaim responsibility for any injury to people or property resulting from any ideas, methods, instructions or products referred to in the content. |
© 2024 by the authors. Licensee MDPI, Basel, Switzerland. This article is an open access article distributed under the terms and conditions of the Creative Commons Attribution (CC BY) license (https://creativecommons.org/licenses/by/4.0/).
Share and Cite
Bus, S.A.; Busch-Westbroek, T.E.; Pulles, J.; van Dun, T.; Szabo, G.; Lacorte, D.H.; Luckson, D.; van Netten, J.J. Pressure-Relieving Effect of Different Insole Top Covers in People with Diabetes at High Risk of Foot Ulceration. Sensors 2024, 24, 5549. https://doi.org/10.3390/s24175549
Bus SA, Busch-Westbroek TE, Pulles J, van Dun T, Szabo G, Lacorte DH, Luckson D, van Netten JJ. Pressure-Relieving Effect of Different Insole Top Covers in People with Diabetes at High Risk of Foot Ulceration. Sensors. 2024; 24(17):5549. https://doi.org/10.3390/s24175549
Chicago/Turabian StyleBus, Sicco A., Tessa E. Busch-Westbroek, Jan Pulles, Tim van Dun, Ghizella Szabo, Dario H. Lacorte, Dannick Luckson, and Jaap J. van Netten. 2024. "Pressure-Relieving Effect of Different Insole Top Covers in People with Diabetes at High Risk of Foot Ulceration" Sensors 24, no. 17: 5549. https://doi.org/10.3390/s24175549
APA StyleBus, S. A., Busch-Westbroek, T. E., Pulles, J., van Dun, T., Szabo, G., Lacorte, D. H., Luckson, D., & van Netten, J. J. (2024). Pressure-Relieving Effect of Different Insole Top Covers in People with Diabetes at High Risk of Foot Ulceration. Sensors, 24(17), 5549. https://doi.org/10.3390/s24175549