


Machine Learning Based Abnormal Gait Classification with IMU Considering Joint Impairment
 ,
,
Abstract
1. Introduction
2. Materials and Methods
2.1. Participant Recruitment
2.2. Experimental Instrumentation and Procedure
2.3. Data Preprocessing
2.3.1. Gait Event Detection
2.3.2. Gait Parameter Extraction
2.4. Feature Selection and Classification
2.4.1. Feature Selection
2.4.2. Classification
2.4.3. Post-Analysis
3. Results
4. Discussion
5. Conclusions
Author Contributions
Funding
Institutional Review Board Statement
Informed Consent Statement
Data Availability Statement
Conflicts of Interest
References
- Lim, M.R.; Huang, R.C.; Wu, A.; Girardi, F.P.; Cammisa, F.P. Evaluation of the elderly patient with an abnormal gait. JAAOS-J. Am. Acad. Orthop. Surg. 2007, 15, 107–117. [Google Scholar] [CrossRef]
- Balaban, B.; Tok, F. Gait disturbances in patients with stroke. PM&R 2014, 6, 635–642. [Google Scholar]
- Morris, M.E.; Huxham, F.; McGinley, J.; Dodd, K.; Iansek, R. The biomechanics and motor control of gait in Parkinson disease. Clin. Biomech. 2001, 16, 459–470. [Google Scholar] [CrossRef]
- Morgan, P.; McGinley, J. Gait function and decline in adults with cerebral palsy: A systematic review. Disabil. Rehabil. 2014, 36, 1–9. [Google Scholar] [CrossRef]
- Jahn, K.; Zwergal, A.; Schniepp, R. Gait disturbances in old age: Classification, diagnosis, and treatment from a neurological perspective. Dtsch. Ärzteblatt Int. 2010, 107, 306. [Google Scholar]
- Shichman, I.; Roof, M.; Askew, N.; Nherera, L.; Rozell, J.C.; Seyler, T.M.; Schwarzkopf, R. Projections and epidemiology of primary hip and knee arthroplasty in medicare patients to 2040–2060. JBJS Open Access 2023, 8, e22. [Google Scholar] [CrossRef]
- Cicirelli, G.; Impedovo, D.; Dentamaro, V.; Marani, R.; Pirlo, G.; D’Orazio, T.R. Human gait analysis in neurodegenerative diseases: A review. IEEE J. Biomed. Health Inform. 2021, 26, 229–242. [Google Scholar] [CrossRef] [PubMed]
- Menolotto, M.; Komaris, D.S.; Tedesco, S.; O’Flynn, B.; Walsh, M. Motion capture technology in industrial applications: A systematic review. Sensors 2020, 20, 5687. [Google Scholar] [CrossRef] [PubMed]
- Parati, M.; Ambrosini, E.; De Maria, B.; Gallotta, M.; Dalla Vecchia, L.A.; Ferriero, G.; Ferrante, S. The reliability of gait parameters captured via instrumented walkways: A systematic review and meta-analysis. Eur. J. Phys. Rehabil. Med. 2022, 58, 363. [Google Scholar] [CrossRef]
- Webster, K.E.; Wittwer, J.E.; Feller, J.A. Validity of the GAITRite® walkway system for the measurement of averaged and individual step parameters of gait. Gait Posture 2005, 22, 317–321. [Google Scholar] [CrossRef]
- Stokic, D.S.; Horn, T.S.; Ramshur, J.M.; Chow, J.W. Agreement between temporospatial gait parameters of an electronic walkway and a motion capture system in healthy and chronic stroke populations. Am. J. Phys. Med. Rehabil. 2009, 88, 437–444. [Google Scholar] [CrossRef] [PubMed]
- Ross, S.A.; Rice, C.; Von Behren, K.; Meyer, A.; Alexander, R.; Murfin, S. Reliability of sagittal plane hip, knee, and ankle joint angles from a single frame of video data using the GAITRite camera system. Physiother. Theory Pract. 2015, 31, 53–60. [Google Scholar] [CrossRef]
- Hutabarat, Y.; Owaki, D.; Hayashibe, M. Recent advances in quantitative gait analysis using wearable sensors: A review. IEEE Sens. J. 2021, 21, 26470–26487. [Google Scholar] [CrossRef]
- Prasanth, H.; Caban, M.; Keller, U.; Courtine, G.; Ijspeert, A.; Vallery, H.; Von Zitzewitz, J. Wearable sensor-based real-time gait detection: A systematic review. Sensors 2021, 21, 2727. [Google Scholar] [CrossRef]
- Wang, L.; Sun, Y.; Li, Q.; Liu, T.; Yi, J. IMU-based gait normalcy index calculation for clinical evaluation of impaired gait. IEEE J. Biomed. Health Inform. 2020, 25, 3–12. [Google Scholar] [CrossRef]
- Wang, F.C.; Chen, S.F.; Lin, C.H.; Shih, C.J.; Lin, A.C.; Yuan, W.; Kuo, T.Y. Detection and classification of stroke gaits by deep neural networks employing inertial measurement units. Sensors 2021, 21, 1864. [Google Scholar] [CrossRef] [PubMed]
- Sung, J.; Han, S.; Park, H.; Cho, H.M.; Hwang, S.; Park, J.W.; Youn, I. Prediction of lower extremity multi-joint angles during overground walking by using a single IMU with a low frequency based on an LSTM recurrent neural network. Sensors 2021, 22, 53. [Google Scholar] [CrossRef] [PubMed]
- Caramia, C.; Torricelli, D.; Schmid, M.; Munoz-Gonzalez, A.; Gonzalez-Vargas, J.; Grandas, F.; Pons, J.L. IMU-Based Classification of Parkinson’s Disease from Gait: A Sensitivity Analysis on Sensor Location and Feature Selection. IEEE J. Biomed. Health Inform. 2018, 22, 1765–1774. [Google Scholar] [CrossRef]
- Hsu, W.C.; Sugiarto, T.; Lin, Y.J.; Yang, F.C.; Lin, Z.Y.; Sun, C.T.; Hsu, C.L.; Chou, K.N. Multiple-Wearable-Sensor-Based Gait Classification and Analysis in Patients with Neurological Disorders. Sensors 2018, 18, 3397. [Google Scholar] [CrossRef]
- Siebers, H.L.; Eschweiler, J.; Pinz, J.; Tingart, M.; Rath, B. The effect of a knee brace in dynamic motion—An instrumented gait analysis. PLoS ONE 2020, 15, e0238722. [Google Scholar] [CrossRef]
- Figueiredo, J.; Santos, C.P.; Moreno, J.C. Automatic recognition of gait patterns in human motor disorders using machine learning: A review. Med. Eng. Phys. 2018, 53, 1–12. [Google Scholar] [CrossRef] [PubMed]
- Alaqtash, M.; Sarkodie-Gyan, T.; Yu, H.; Fuentes, O.; Brower, R.; Abdelgawad, A. Automatic classification of pathological gait patterns using ground reaction forces and machine learning algorithms. In Proceedings of the 2011 Annual International Conference of the IEEE Engineering in Medicine and Biology Society, Boston, MA, USA, 30 August–3 September 2011; pp. 453–457. [Google Scholar]
- Pogorelc, B.; Bosnić, Z.; Gams, M. Automatic recognition of gait-related health problems in the elderly using machine learning. Multimed. Tools Appl. 2012, 58, 333–354. [Google Scholar] [CrossRef]
- Begg, R.K.; Palaniswami, M.; Owen, B. Support vector machines for automated gait classification. IEEE Trans. Biomed. Eng. 2005, 52, 828–838. [Google Scholar] [CrossRef] [PubMed]
- Daliri, M.R. Automatic diagnosis of neuro-degenerative diseases using gait dynamics. Measurement 2012, 45, 1729–1734. [Google Scholar] [CrossRef]

| Participant | Age (Years) | Height (cm) | Weight (kg) |
|---|---|---|---|
| 1 | 30 | 176 | 93 |
| 2 | 59 | 168 | 72 |
| 3 | 33 | 188 | 82 |
| 4 | 43 | 177 | 65 |
| 5 | 35 | 178 | 73 |
| 6 | 53 | 165 | 65 |
| 7 | 46 | 176 | 65 |
| 8 | 27 | 174 | 95 |
| 9 | 28 | 181 | 100 |
| 10 | 40 | 173 | 80 |
| System | Categories | Parameters |
|---|---|---|
| IMU-based | Angular | shank sagittal angle (deg), thigh sagittal angle (deg), knee sagittal angle (deg) |
| Spatio-temporal | cycle time (s), swing time (s), stance time (s), swing phase, stance phase, cadence (steps/min) | |
| Symmetry | SSR 1, SSR 2, TSR | |
| Walkway | Spatio-temporal | step length (cm), stride length (cm), base of support (cm), step time (s), stride time (s), swing time (s), stance time (s), single support time (s), double support time (s), stride velocity (cm/s), swing phase, stance phase |
| Symmetry | TSR |
| System | Types | Classifier | Optimal Number of Features | Accuracy | Precision | Recall | F1 Score |
|---|---|---|---|---|---|---|---|
| IMU-based | normal -abnormal | SVM | 1 | 0.88 | 0.90 | 0.88 | 0.88 |
| RF | 12 | 0.99 | 0.99 | 0.99 | 0.99 | ||
| XGB | 5 | 0.96 | 0.97 | 0.96 | 0.96 | ||
| normal -knee | SVM | 1 | 1.00 | 1.00 | 1.00 | 1.00 | |
| RF | 1 | 1.00 | 1.00 | 1.00 | 1.00 | ||
| XGB | 1 | 0.99 | 1.00 | 0.99 | 0.99 | ||
| normal -ankle | SVM | 1 | 0.87 | 0.90 | 0.87 | 0.87 | |
| RF | 2 | 0.97 | 0.98 | 0.97 | 0.97 | ||
| XGB | 7 | 0.93 | 0.94 | 0.93 | 0.93 | ||
| knee -ankle | SVM | 5 | 0.97 | 0.97 | 0.97 | 0.97 | |
| RF | 18 | 0.98 | 0.98 | 0.98 | 0.98 | ||
| XGB | 3 | 0.98 | 0.98 | 0.98 | 0.98 | ||
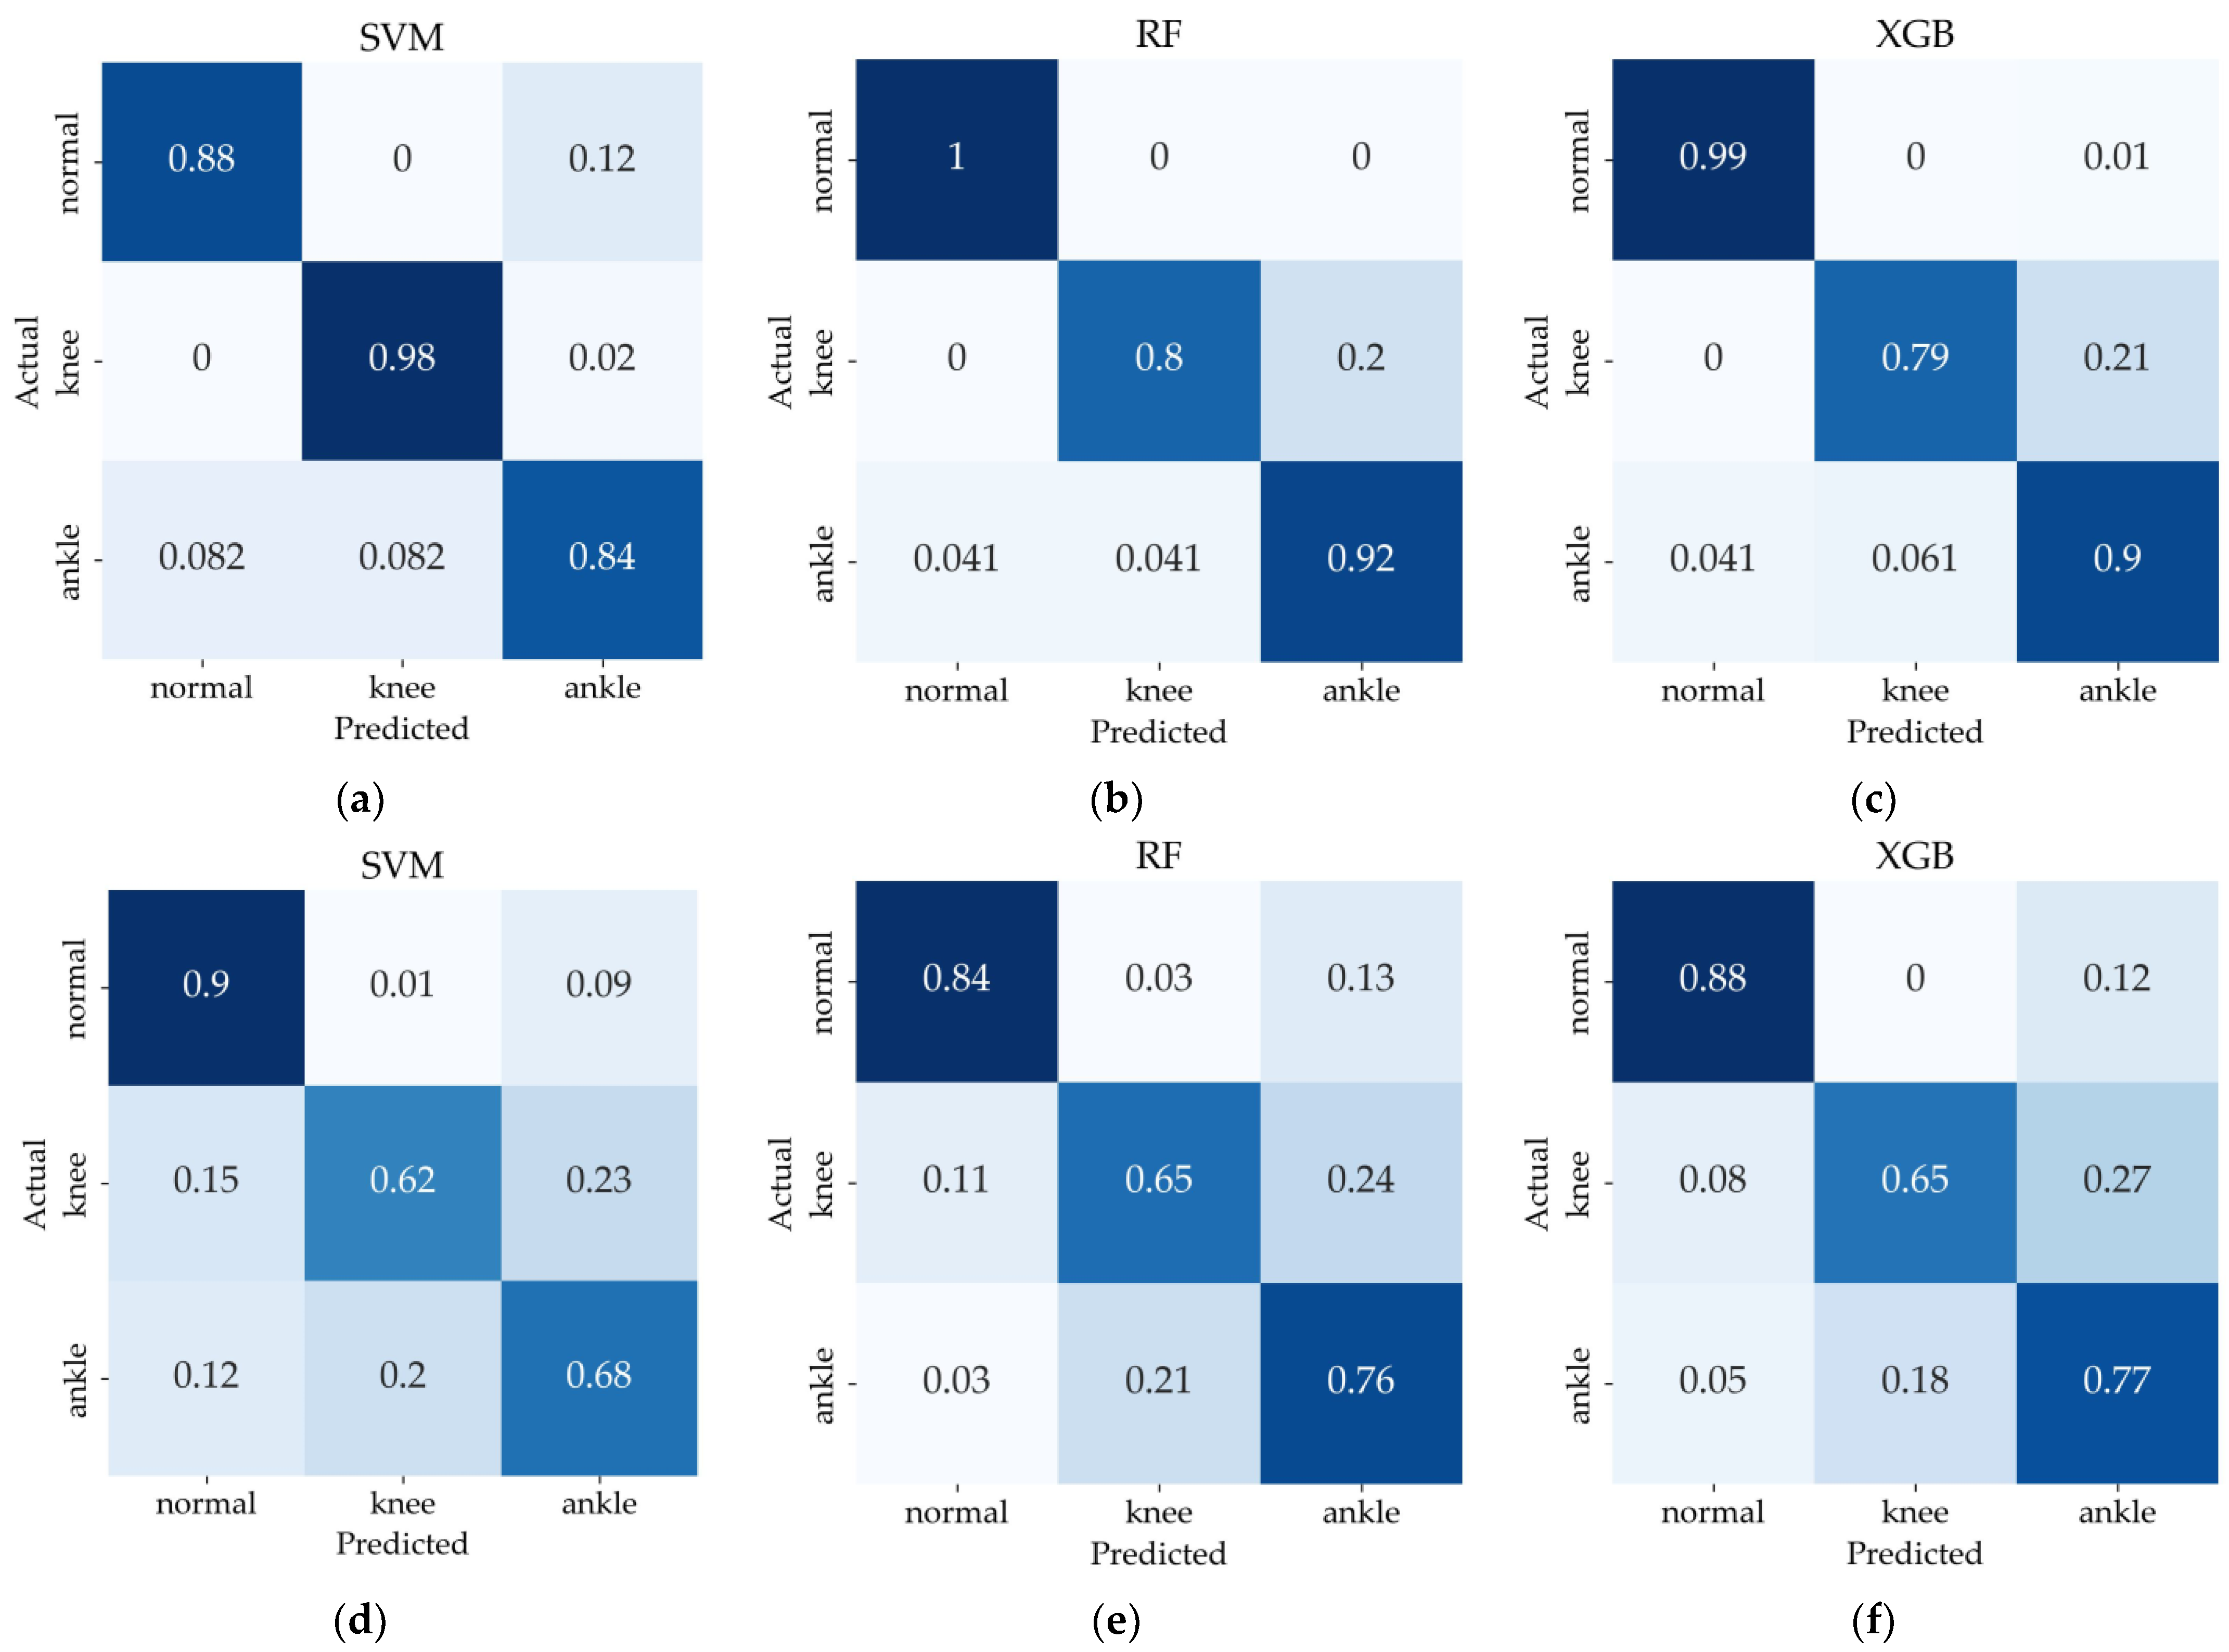
| normal -knee -ankle | SVM | 6 | 0.90 | 0.90 | 0.90 | 0.90 | |
| RF | 11 | 0.91 | 0.91 | 0.91 | 0.91 | ||
| XGB | 5 | 0.89 | 0.90 | 0.89 | 0.89 | ||
| Walkway | normal -abnormal | SVM | 1 | 0.90 | 0.92 | 0.90 | 0.91 |
| RF | 15 | 0.90 | 0.90 | 0.90 | 0.90 | ||
| XGB | 12 | 0.90 | 0.90 | 0.90 | 0.90 | ||
| normal -knee | SVM | 1 | 0.92 | 0.93 | 0.92 | 0.92 | |
| RF | 3 | 0.94 | 0.94 | 0.94 | 0.93 | ||
| XGB | 2 | 0.93 | 0.93 | 0.93 | 0.93 | ||
| normal -ankle | SVM | 12 | 0.91 | 0.91 | 0.91 | 0.91 | |
| RF | 4 | 0.91 | 0.91 | 0.91 | 0.90 | ||
| XGB | 4 | 0.90 | 0.90 | 0.90 | 0.90 | ||
| knee -ankle | SVM | 9 | 0.76 | 0.76 | 0.76 | 0.76 | |
| RF | 19 | 0.75 | 0.75 | 0.75 | 0.74 | ||
| XGB | 10 | 0.75 | 0.75 | 0.75 | 0.75 | ||
| normal -knee -ankle | SVM | 9 | 0.73 | 0.73 | 0.73 | 0.73 | |
| RF | 10 | 0.75 | 0.75 | 0.75 | 0.75 | ||
| XGB | 21 | 0.77 | 0.77 | 0.77 | 0.77 |
| Types | IMU-Based System Features | Walkway System Features |
|---|---|---|
| normal-abnormal | TSR | TSR |
| normal-knee | Knee sagittal angle (R) | TSR |
| normal-ankle | Swing time (R) | |
| knee-ankle | Shank sagittal angle (R) | Stance time (L), stance time (R), swing phase (L), swing phase (R), double support time (L), double support time (R) |
| normal-knee-ankle | Knee sagittal angle (R) | TSR, swing phase (R), double support time (R) |
| System | Classifier | Fold | Accuracy | Precision | Recall | F1 Score |
|---|---|---|---|---|---|---|
| IMU-based | RF | 1 | 0.93 | 0.94 | 0.93 | 0.94 |
| 2 | 0.97 | 0.97 | 0.97 | 0.97 | ||
| 3 | 0.83 | 0.88 | 0.83 | 0.86 | ||
| 4 | 0.95 | 0.96 | 0.95 | 0.95 | ||
| 5 | 0.85 | 0.90 | 0.85 | 0.87 | ||
| Walkway | XGB | 1 | 0.85 | 0.88 | 0.85 | 0.86 |
| 2 | 0.80 | 0.80 | 0.80 | 0.80 | ||
| 3 | 0.68 | 0.81 | 0.68 | 0.74 | ||
| 4 | 0.75 | 0.81 | 0.75 | 0.78 | ||
| 5 | 0.75 | 0.75 | 0.75 | 0.75 |
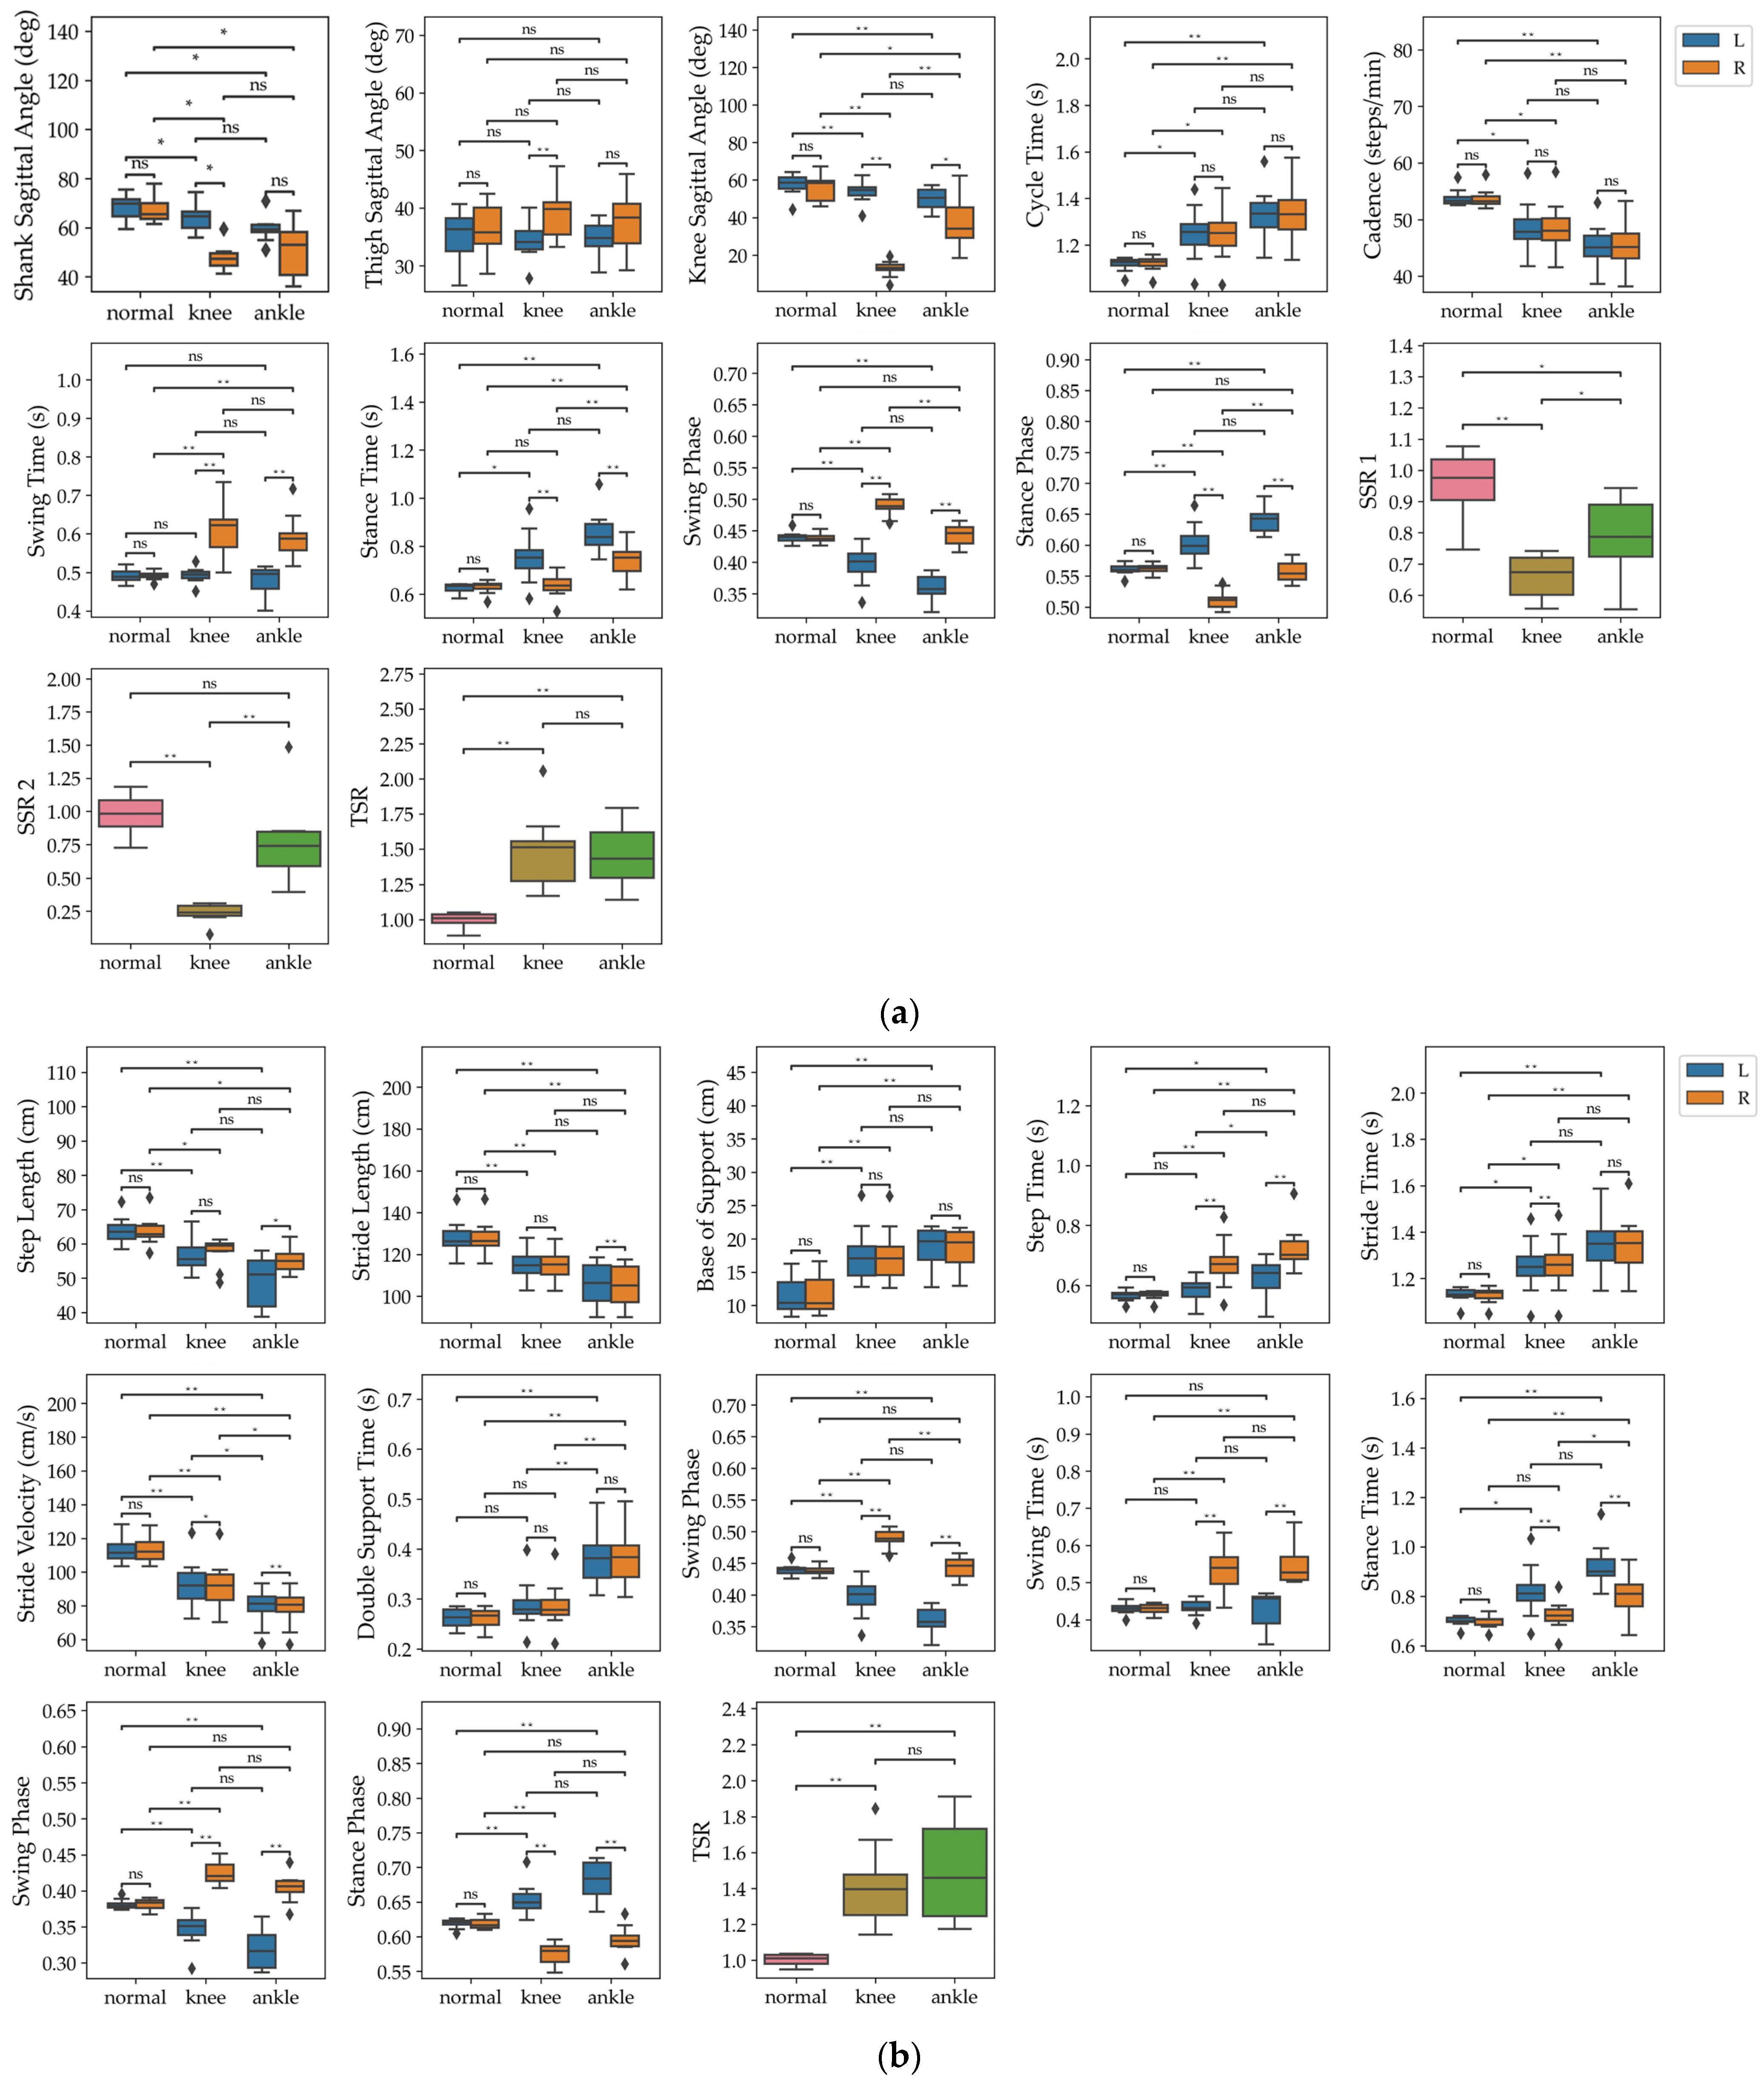
| System | Feature | Side | Normal | Knee | Ankle | Friedman | |
|---|---|---|---|---|---|---|---|
| Statistic | p-Value | ||||||
| IMU-based | Shank sagittal angle (deg) | L | 68.51 ± 5.06 | 63.98 ± 5.36 | 59.51 ± 5.58 | 16.8 | 0.0002 |
| R | 66.99 ± 5.0 | 47.66 ± 5.33 | 51.14 ± 12.3 | 12.6 | 0.0018 | ||
| Thigh sagittal angle (deg) | L | 35.27 ± 4.31 | 34.24 ± 3.25 | 34.3 ± 3.9 | 0.2 | 0.9048 | |
| R | 36.26 ± 4.72 | 38.96 ± 4.22 | 37.18 ± 5.7 | 2.4 | 0.3012 | ||
| Knee sagittal angle (deg) | L | 57.57 ± 5.87 | 53.74 ± 5.95 | 49.77 ± 6.6 | 16.8 | 0.0002 | |
| R | 55.63 ± 6.97 | 12.81 ± 4.88 | 36.68 ± 14.58 | 18.2 | 0.0001 | ||
| Cycle time (s) | L | 1.12 ± 0.04 | 1.25 ± 0.12 | 1.33 ± 0.12 | 11.4 | 0.0033 | |
| R | 1.12 ± 0.05 | 1.25 ± 0.12 | 1.33 ± 0.13 | 12.8 | 0.0017 | ||
| Cadence (steps/min) | L | 53.83 ± 2.13 | 48.53 ± 4.61 | 45.4 ± 4.33 | 11.4 | 0.0033 | |
| R | 53.71 ± 2.35 | 48.57 ± 4.67 | 45.41 ± 4.45 | 12.8 | 0.0017 | ||
| Swing time (s) | L | 0.49 ± 0.03 | 0.49 ± 0.03 | 0.48 ± 0.04 | 0.6 | 0.7408 | |
| R | 0.49 ± 0.02 | 0.61 ± 0.07 | 0.59 ± 0.06 | 15.2 | 0.0005 | ||
| Stance time (s) | L | 0.63 ± 0.03 | 0.76 ± 0.11 | 0.86 ± 0.1 | 14.6 | 0.0007 | |
| R | 0.63 ± 0.04 | 0.64 ± 0.06 | 0.74 ± 0.08 | 15.0 | 0.0006 | ||
| Swing phase | L | 0.44 ± 0.02 | 0.4 ± 0.03 | 0.36 ± 0.03 | 16.8 | 0.0002 | |
| R | 0.44 ± 0.01 | 0.49 ± 0.03 | 0.44 ± 0.03 | 15.8 | 0.0004 | ||
| Stance phase | L | 0.56 ± 0.02 | 0.6 ± 0.03 | 0.64 ± 0.03 | 16.8 | 0.0002 | |
| R | 0.56 ± 0.01 | 0.51 ± 0.03 | 0.56 ± 0.03 | 15.8 | 0.0004 | ||
| SSR 1 | 0.96 ± 0.1 | 0.66 ± 0.07 | 0.79 ± 0.14 | 14.6 | 0.0007 | ||
| SSR 2 | 0.98 ± 0.15 | 0.24 ± 0.08 | 0.75 ± 0.34 | 18.2 | 0.0001 | ||
| TSR | 1.0 ± 0.08 | 1.49 ± 0.29 | 1.45 ± 0.28 | 15.2 | 0.0005 | ||
| Walkway | Step length (cm) | L | 63.89 ± 4.26 | 56.56 ± 5.16 | 49.28 ± 8.49 | 18.2 | 0.0001 |
| R | 63.67 ± 4.55 | 57.63 ± 4.72 | 55.48 ± 5.65 | 9.8 | 0.0074 | ||
| Stride length (cm) | L | 128.04 ± 8.89 | 114.89 ± 8.48 | 105.4 ± 12.37 | 16.8 | 0.0002 | |
| R | 128.05 ± 8.72 | 114.3 ± 8.54 | 104.7 ± 12.27 | 16.8 | 0.0002 | ||
| Base of support (cm) | L | 11.59 ± 3.14 | 17.59 ± 4.28 | 18.83 ± 3.32 | 15.2 | 0.0005 | |
| R | 11.63 ± 3.11 | 17.44 ± 4.43 | 18.68 ± 3.23 | 15.2 | 0.0005 | ||
| Step time (s) | L | 0.57 ± 0.03 | 0.59 ± 0.04 | 0.63 ± 0.07 | 9.8 | 0.0074 | |
| R | 0.57 ± 0.03 | 0.67 ± 0.08 | 0.72 ± 0.08 | 16.8 | 0.0002 | ||
| Stride time (s) | L | 1.13 ± 0.05 | 1.25 ± 0.12 | 1.35 ± 0.13 | 12.8 | 0.0017 | |
| R | 1.13 ± 0.05 | 1.26 ± 0.12 | 1.35 ± 0.13 | 12.8 | 0.0017 | ||
| Stride velocity (cm/s) | L | 113.75 ± 9.98 | 92.89 ± 14.27 | 79.11 ± 13.07 | 16.8 | 0.0002 | |
| R | 113.95 ± 10.01 | 92.09 ± 14.4 | 78.56 ± 13.12 | 16.8 | 0.0002 | ||
| Double support time (s) | L | 0.26 ± 0.02 | 0.29 ± 0.05 | 0.38 ± 0.06 | 16.8 | 0.0002 | |
| R | 0.26 ± 0.03 | 0.29 ± 0.05 | 0.38 ± 0.06 | 16.8 | 0.0002 | ||
| Single support time (s) | L | 0.43 ± 0.02 | 0.54 ± 0.07 | 0.54 ± 0.06 | 15.2 | 0.0005 | |
| R | 0.43 ± 0.02 | 0.43 ± 0.03 | 0.43 ± 0.05 | 0.6 | 0.7408 | ||
| Swing time (s) | L | 0.43 ± 0.02 | 0.43 ± 0.03 | 0.43 ± 0.05 | 0.6 | 0.7408 | |
| R | 0.43 ± 0.02 | 0.54 ± 0.07 | 0.54 ± 0.06 | 15.2 | 0.0005 | ||
| Stance time (s) | L | 0.7 ± 0.04 | 0.82 ± 0.11 | 0.92 ± 0.1 | 12.8 | 0.0017 | |
| R | 0.7 ± 0.04 | 0.72 ± 0.06 | 0.8 ± 0.09 | 13.4 | 0.0012 | ||
| Swing phase | L | 0.38 ± 0.01 | 0.35 ± 0.03 | 0.32 ± 0.03 | 16.8 | 0.0002 | |
| R | 0.38 ± 0.01 | 0.42 ± 0.02 | 0.4 ± 0.03 | 11.4 | 0.0033 | ||
| Stance phase | L | 0.62 ± 0.01 | 0.65 ± 0.03 | 0.68 ± 0.03 | 16.8 | 0.0002 | |
| R | 0.62 ± 0.01 | 0.58 ± 0.02 | 0.6 ± 0.03 | 11.4 | 0.0033 | ||
| TSR | 1.0 ± 0.06 | 1.41 ± 0.23 | 1.5 ± 0.33 | 15.8 | 0.0004 | ||
Disclaimer/Publisher’s Note: The statements, opinions and data contained in all publications are solely those of the individual author(s) and contributor(s) and not of MDPI and/or the editor(s). MDPI and/or the editor(s) disclaim responsibility for any injury to people or property resulting from any ideas, methods, instructions or products referred to in the content. |
© 2024 by the authors. Licensee MDPI, Basel, Switzerland. This article is an open access article distributed under the terms and conditions of the Creative Commons Attribution (CC BY) license (https://creativecommons.org/licenses/by/4.0/).
Share and Cite
Hwang, S.; Kim, J.; Yang, S.; Moon, H.-J.; Cho, K.-H.; Youn, I.; Sung, J.-K.; Han, S. Machine Learning Based Abnormal Gait Classification with IMU Considering Joint Impairment. Sensors 2024, 24, 5571. https://doi.org/10.3390/s24175571
Hwang S, Kim J, Yang S, Moon H-J, Cho K-H, Youn I, Sung J-K, Han S. Machine Learning Based Abnormal Gait Classification with IMU Considering Joint Impairment. Sensors. 2024; 24(17):5571. https://doi.org/10.3390/s24175571
Chicago/Turabian StyleHwang, Soree, Jongman Kim, Sumin Yang, Hyuk-June Moon, Kyung-Hee Cho, Inchan Youn, Joon-Kyung Sung, and Sungmin Han. 2024. "Machine Learning Based Abnormal Gait Classification with IMU Considering Joint Impairment" Sensors 24, no. 17: 5571. https://doi.org/10.3390/s24175571
APA StyleHwang, S., Kim, J., Yang, S., Moon, H.-J., Cho, K.-H., Youn, I., Sung, J.-K., & Han, S. (2024). Machine Learning Based Abnormal Gait Classification with IMU Considering Joint Impairment. Sensors, 24(17), 5571. https://doi.org/10.3390/s24175571