
WD-1D-VGG19-FEA: An Efficient Wood Defect Elastic Modulus Predictive Model


Abstract
1. Introduction
2. Materials and Methods
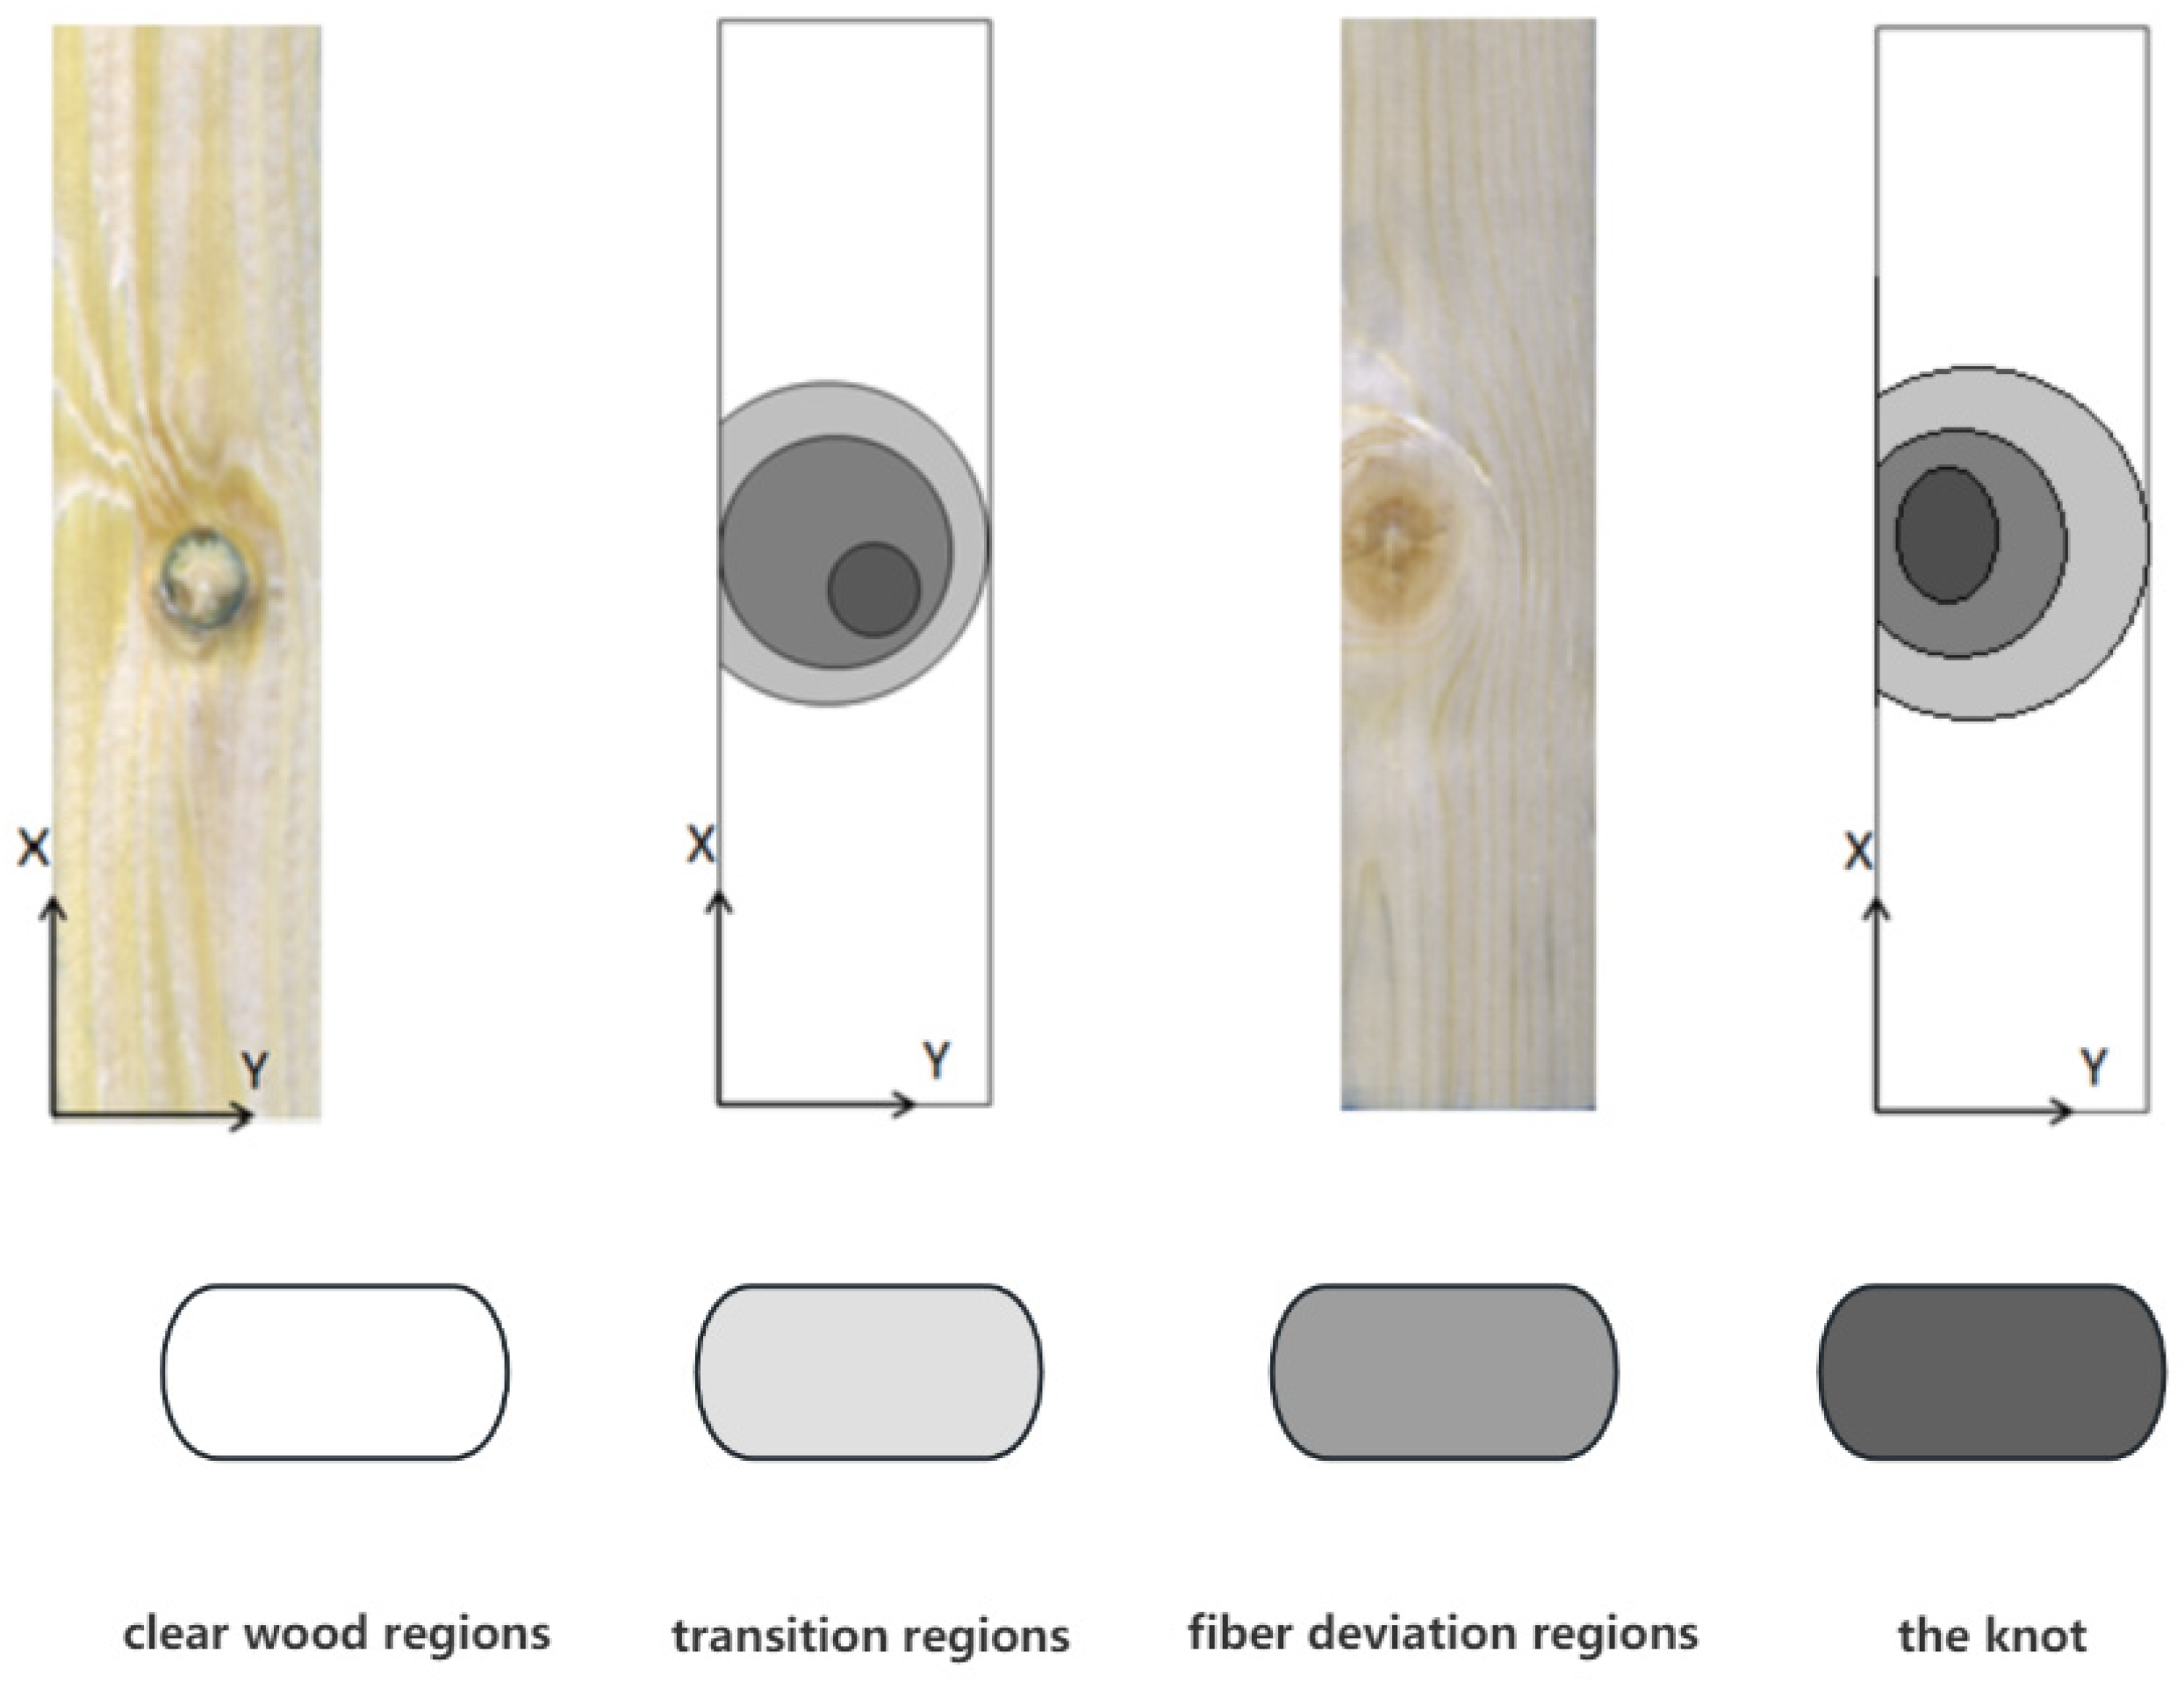
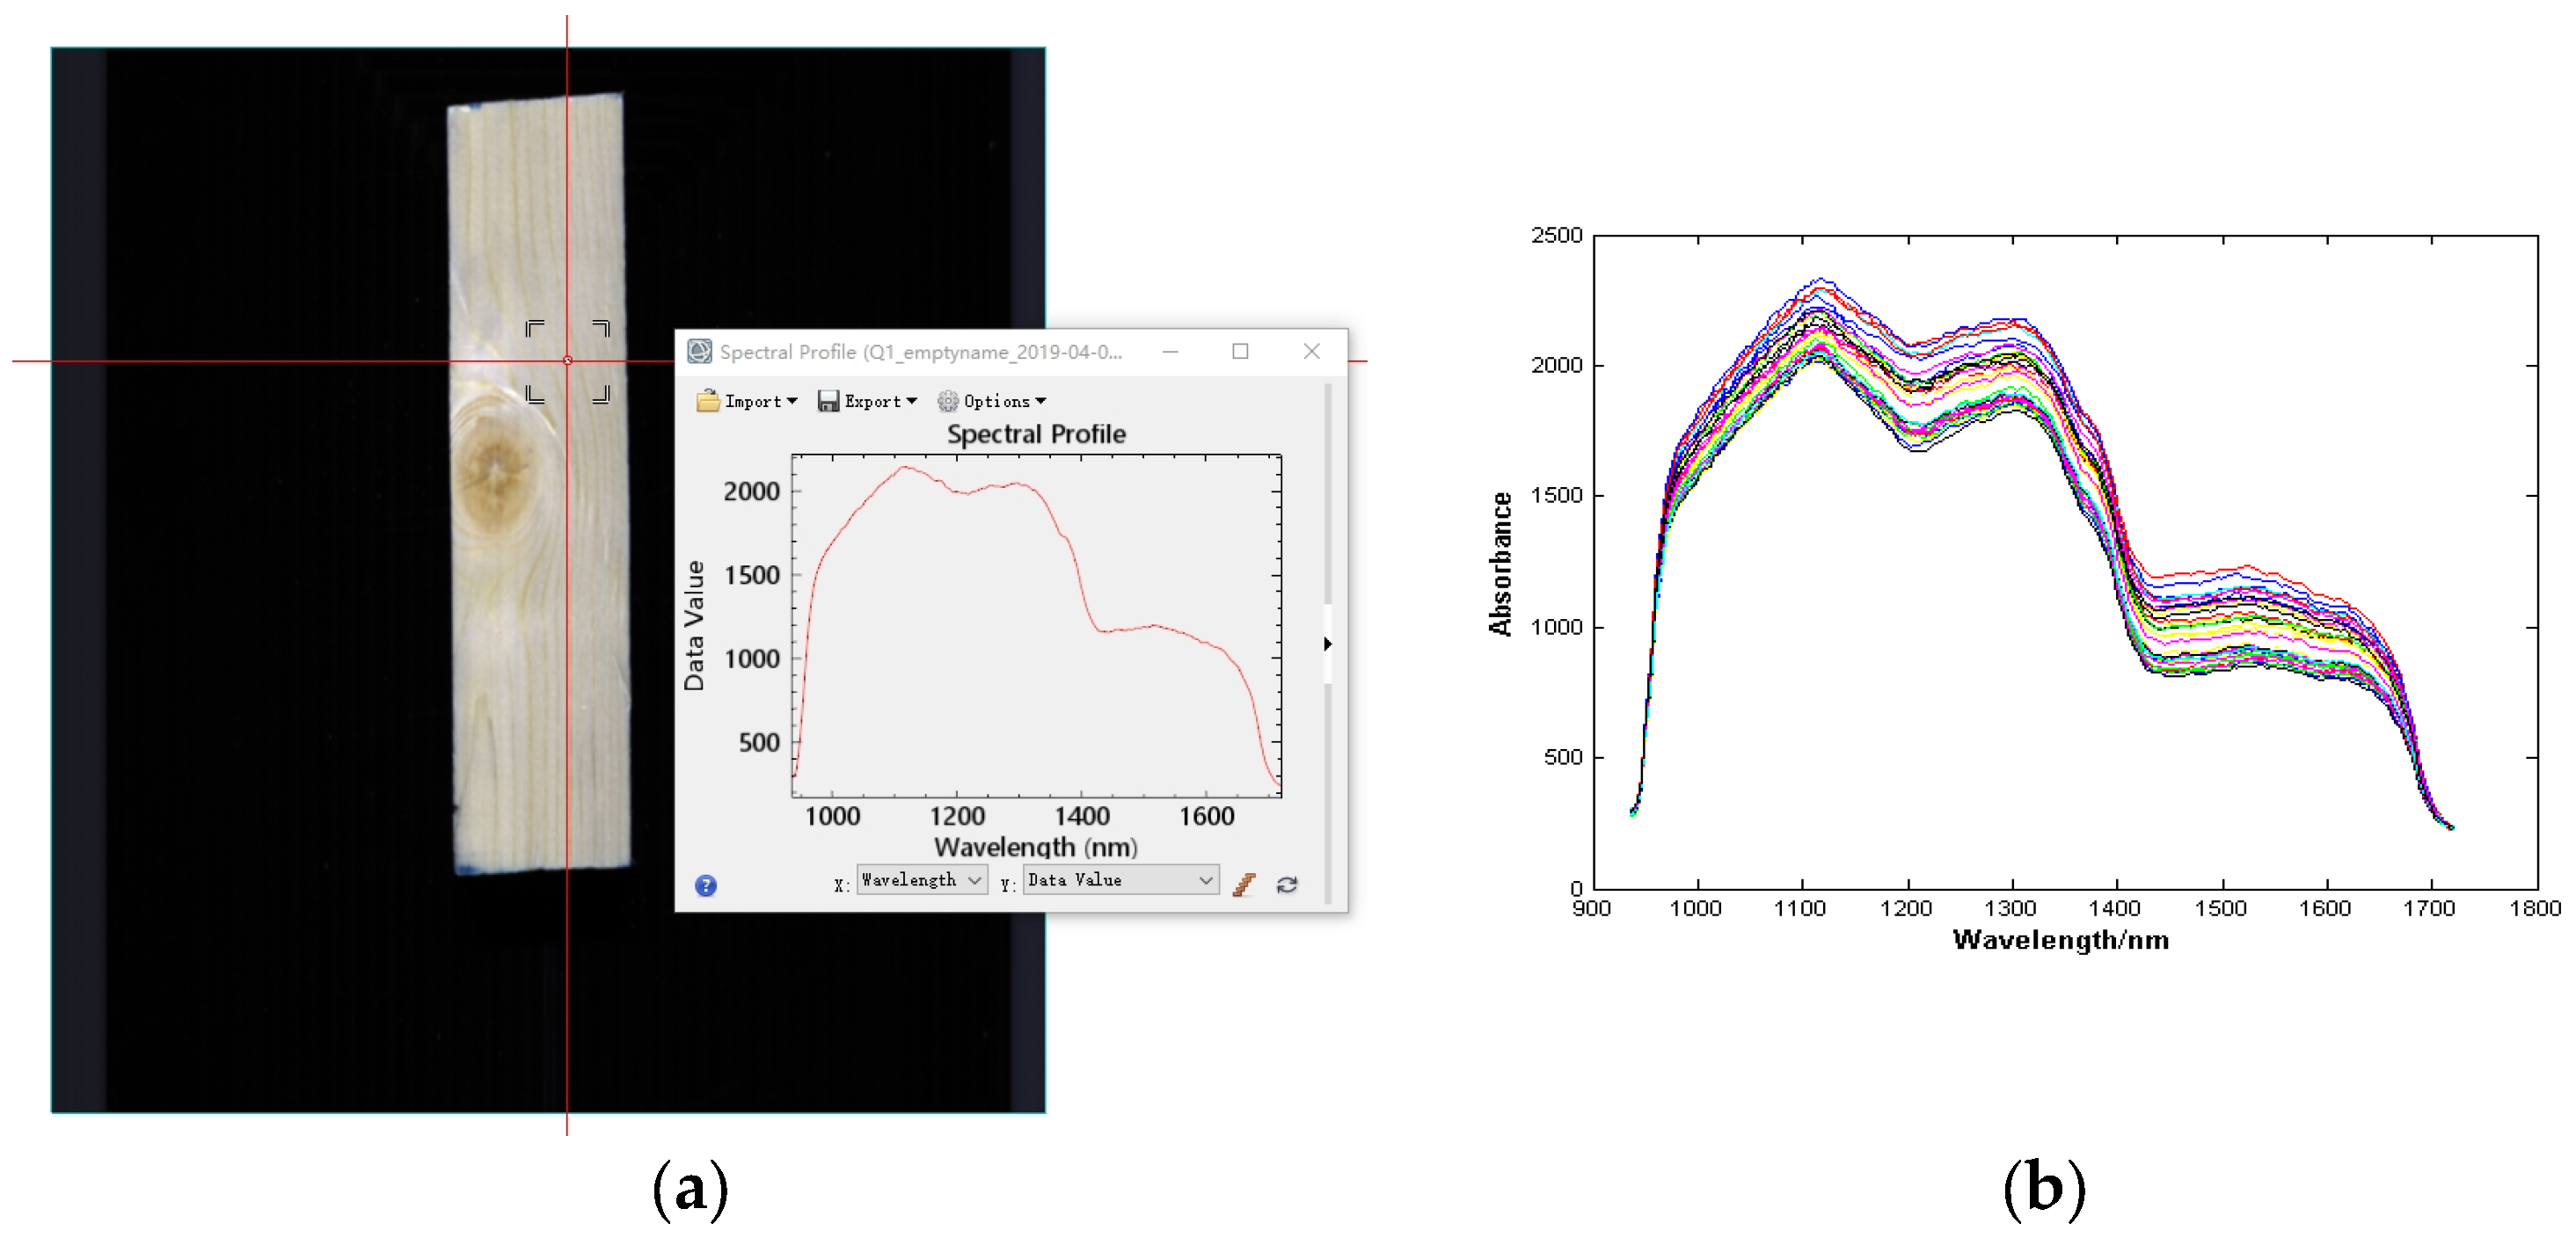
2.1. Near-Infrared Spectroscopy Data Acquisition
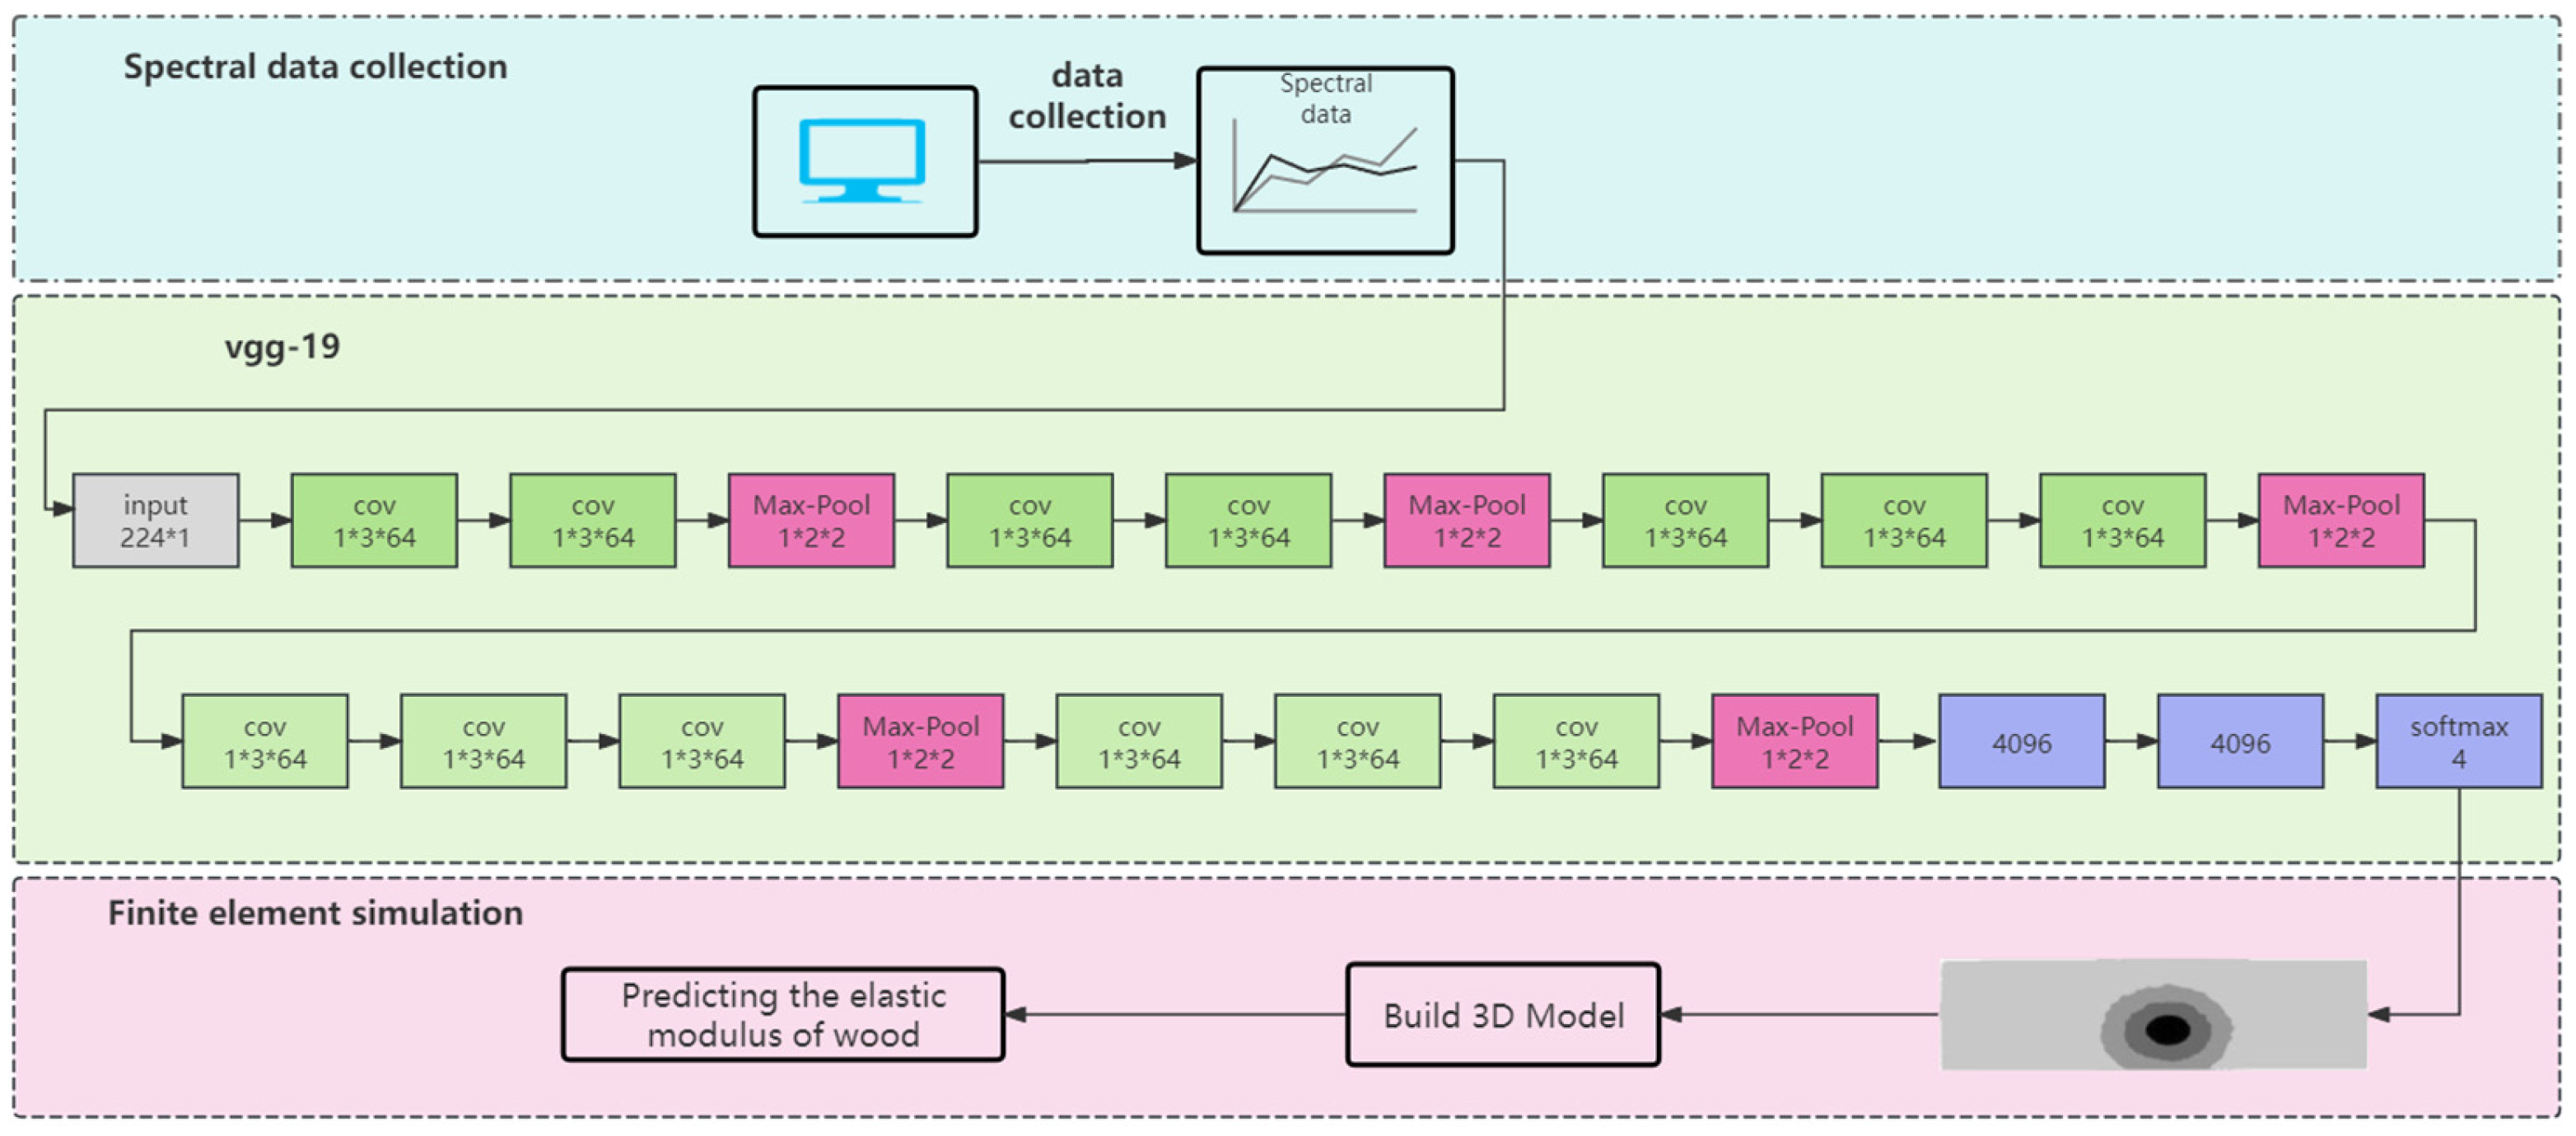
2.2. D-VGG19 and 3D Finite Element Modeling
- Input layer:
- 2.
- Convolutional layer:
- 3.
- Pool layer
- 4.
- Fully connected layer
- 5.
- Output layer:
3. Experiments and Analysis
4. Results and Discussion
4.1. Nonlinear Sheet Shape Inversion
4.2. Establishment of Finite Element Analysis Model and Prediction of Elastic Modulus of Larch Lumber
5. Conclusions
Author Contributions
Funding
Data Availability Statement
Acknowledgments
Conflicts of Interest
References
- Pramreiter, M.; Nenning, T.; Malzl, L.; Konnerth, J. A plea for the efficient use of wood in construction. Nat. Rev. Mater. 2023, 8, 217–218. [Google Scholar] [CrossRef]
- Peng, L.; Searchinger, T.D.; Zionts, J.; Waite, R. The carbon costs of global wood harvests. Nature 2023, 620, 110–115. [Google Scholar] [CrossRef] [PubMed]
- Chutturi, M.; Gillela, S.; Yadav, S.M.; Wibowo, E.S.; Sihag, K.; Rangppa, S.M.; Bhuyar, P.; Siengchin, S.; Antov, P.; Kristak, L.; et al. A comprehensive review of the synthesis strategies, properties, and applications of transparent wood as a renewable and sustainable resource. Sci. Total Environ. 2023, 864, 161067. [Google Scholar] [CrossRef] [PubMed]
- Zhang, M.; Wang, D.; Li, T.; Jiang, J.; Bai, H.; Wang, S.; Wang, Y.; Dong, W. Multifunctional flame-retardant, thermal insulation, and antimicrobial wood-based composites. Biomacromolecules 2023, 24, 957–966. [Google Scholar] [CrossRef] [PubMed]
- Alqrinawi, H.; Ahmed, B.; Wu, Q.; Lin, H.; Kameshwar, S.; Shayan, M. Effect of partial delignification and densification on chemical, morphological, and mechanical properties of wood: Structural property evolution. Ind. Crops Prod. 2024, 213, 118430. [Google Scholar] [CrossRef]
- Amaral, E.A.; Baliza, L.F.; dos Santos, L.M.; Shashiki, A.T.; Trugilho, P.F.; Hein, P.R.G. Hydromechanical behavior of wood during drying studied by NIR spectroscopy and image analysis. Holzforschung 2023, 77, 618–628. [Google Scholar] [CrossRef]
- Fujimoto, T. Detecting the changes of wood properties with respect to elapsed years since wood formation by the eigenvalue distribution of near infrared spectral matrices. J. Wood Sci. 2023, 69, 3. [Google Scholar] [CrossRef]
- Isik, F.; Mora, C.R.; Schimleck, L.R. Genetic variation in Pinus taeda wood properties predicted using non-destructive techniques. Ann. For. Sci. 2011, 68, 283–293. [Google Scholar] [CrossRef]
- Olsson, A.; Oscarsson, J.; Serrano, E.; Källsner, B.; Johansson, M.; Enquist, B. Prediction of timber bending strength and in-member cross-sectional stiffness variation on the basis of local wood fibre orientation. Eur. J. Wood Wood Prod. 2013, 71, 319–333. [Google Scholar] [CrossRef]
- Daval, V.; Pot, G.; Belkacemi, M.; Meriaudeau, F.; Collet, R. Automatic measurement of wood fiber orientation and knot detection using an optical system based on heating conduction. Opt. Express 2015, 23, 33529–33539. [Google Scholar] [CrossRef]
- Belkacemi, M.; Massich, J.; Lemaitre, G.; Stolz, C.; Daval, V.; Pot, G.; Aubreton, O.; Collet, R.; Meriaudeau, F. Wood fiber orientation assessment based on punctual laser beam excitation: A preliminary study. In Proceedings of the 2016 International Conference on Quantitative InfraRed Thermography, Gdansk, Poland, 6–10 July 2016. [Google Scholar]
- Janiak, T.; Homon, S.; Karavan, V.; Gomon, P.; Gomon, S.S.; Kulakovskyi, L.; Famulyak, Y. Mechanical properties of solid deciduous species wood at different moisture content. AIP Conf. Proc. 2023, 2949, 020009. [Google Scholar]
- Yang, S.; Lee, H.; Choi, G.; Kang, S. Mechanical properties of hybrid cross-laminated timber with wood-based materials. Ind. Crops Prod. 2023, 206, 117629. [Google Scholar] [CrossRef]
- Gayda, S.; Kiyko, O. Study of physical and mechanical properties of post-consumer wood of different age. Drewno. Pr. Nauk. Doniesienia Komun. 2023, 66, 00010. [Google Scholar] [CrossRef]
- Huse, S.A.; Gunaga, R.P.; Sinha, S.K.; Behera, L.K. Genetic Variation in Wood Mechanical Properties Among Eucalyptus Clones. Indian J. Ecol. 2024, 51, 272–276. [Google Scholar]
- Shiri, F.M.; Perumal, T.; Mustapha, N.; Mohamed, R. A comprehensive overview and comparative analysis on deep learning models: CNN, RNN, LSTM, GRU. arXiv 2023, arXiv:2305.17473. [Google Scholar]
- Nugraha, G.S.; Darmawan, M.I.; Dwiyansaputra, R. Comparison of CNN’s Architecture GoogleNet, AlexNet, VGG-16, Lenet-5, Resnet-50 in Arabic Handwriting Pattern Recognition. Kinet. Game Technol. Inf. Syst. Comput. Netw. Comput. Electron. Control. 2023, 8. [Google Scholar] [CrossRef]
- Wan, Z.; Yang, H.; Gao, M.; Xu, J.; Mu, H.; Qi, D.; Han, S. NIR-VGGNet19: A Novel Deep Convolutional Neural Network for Pinus NIR Spectra Classification. IEEE Access 2023, 11, 62721–62732. [Google Scholar] [CrossRef]
- Xu, X.; Fu, C.; Gao, Y.; Kang, Y.; Zhang, W. Research on the Identification Method of Maize Seed Origin Using NIR Spectroscopy and GAF-VGGNet. Agriculture 2024, 14, 466. [Google Scholar] [CrossRef]
- Işık, Ş.; Özkan, K.; Demirez, D.Z.; Seke, E. Consensus rule for wheat cultivar classification on VL, VNIR and SWIR imaging. IET Image Process. 2022, 16, 2834–2844. [Google Scholar] [CrossRef]
- Sharma, A.K.; Nandal, A.; Zhou, L.; Dhaka, A.; Wu, T. Brain tumor classification using modified VGG model-based transfer learning approach. In New Trends in Intelligent Software Methodologies, Tools and Techniques; IOS Press: Amsterdam, The Netherlands, 2021; pp. 538–550. [Google Scholar]
- Can, C.; Kaya, Y.; Kılıç, F. A deep convolutional neural network model for hand gesture recognition in 2D near-infrared images. Biomed. Phys. Eng. Express 2021, 7, 055005. [Google Scholar] [CrossRef]
- Shukla, A.; Upadhyay, A.; Sharma, M.; Chinnusamy, V.; Kumar, S. High-resolution nir prediction from rgb images: Application to plant phenotyping. In Proceedings of the 2022 IEEE International Conference on Image Processing (ICIP), Bordeaux, France, 16–19 October 2022; IEEE: New York, NY, USA, 2022; pp. 4058–4062. [Google Scholar]
- Gopinath, L.; Ruhan Bevi, A. A Dimensionality Reduction Method for the Fusion of NIR and Visible Image. In International Conference on Image Processing and Capsule Networks; Springer Nature: Singapore, 2023; pp. 629–645. [Google Scholar]
- Hong, Y.; Lyu, Y.; Li, S.; Cao, G.; Shi, B. Reflection removal with NIR and RGB image feature fusion. IEEE Trans. Multimed. 2022, 25, 7101–7112. [Google Scholar] [CrossRef]
- Dong, Z.; Wang, J.; Sun, P.; Ran, W.; Li, Y. Mango variety classification based on convolutional neural network with attention mechanism and near-infrared spectroscopy. J. Food Meas. Charact. 2024, 18, 2237–2247. [Google Scholar] [CrossRef]
- Sharma, S.; Sirisomboon, P.; Sumesh, K.C.; Terdwongworakul, A.; Phetpan, K.; Kshetri, T.B.; Sangwanangkul, P. Near-infrared hyperspectral imaging combined with machine learning for physicochemical-based quality evaluation of durian pulp. Postharvest Biol. Technol. 2023, 200, 112334. [Google Scholar] [CrossRef]
- Mohapatra, D.; Das, N.; Mohanty, K.K. Deep neural network-based fruit identification and grading system for precision agriculture. Proc. Indian Natl. Sci. Acad. 2022, 88, 228–239. [Google Scholar] [CrossRef]
- Hassan, S.M.; Jasinski, M.; Leonowicz, Z.; Jasinska, E.; Maji, A.K. Plant disease identification using shallow convolutional neural network. Agronomy 2021, 11, 2388. [Google Scholar] [CrossRef]
- Pouyet, E.; Miteva, T.; Rohani, N.; de Viguerie, L. Artificial Intelligence for Pigment Classification Task in the Short-Wave Infrared Range. Sensors 2021, 21, 6150. [Google Scholar] [CrossRef]
- Chen, L.; Xiong, H.; Sang, X.; Yuan, C.; Li, X.; Kong, Q. An innovative deep neural network–based approach for internal cavity detection of timber columns using percussion sound. Struct. Health Monit. 2022, 21, 1251–1265. [Google Scholar] [CrossRef]
- Chen, J.; Li, J.Q.; Li, T.; Liu, H.G.; Wang, Y.Z. Rapid identification of the storage duration and species of sliced boletes using near-infrared spectroscopy. J. Food Sci. 2022, 87, 2908–2919. [Google Scholar] [CrossRef]
- Jiang, D.; Qi, G.; Hu, G.; Mazur, N.; Zhu, Z.; Wang, D. A residual neural network based method for the classification of tobacco cultivation regions using near-infrared spectroscopy sensors. Infrared Phys. Technol. 2020, 111, 103494. [Google Scholar] [CrossRef]
- Nath, D.; Ankit; Neog, D.R.; Gautam, S.S. Application of machine learning and deep learning in finite element analysis: A comprehensive review. Arch. Comput. Methods Eng. 2024, 31, 2945–2984. [Google Scholar] [CrossRef]
- Zhang, Z. Application of finite element analysis in structural analysis and computer simulation. Appl. Math. Nonlinear Sci. 2024, 9, 9. [Google Scholar] [CrossRef]
- Hu, M.; Briggert, A.; Olsson, A.; Johansson, M.; Oscarsson, J.; Säll, H. Growth layer and fibre orientation around knots in Norway spruce: A laboratory investigation. Wood Sci. Technol. 2017, 52, 7–27. [Google Scholar] [CrossRef]
- Hackspiel, C.; de Borst, K.; Lukacevic, M. A numerical simulation tool for wood grading: Model validation and parameter studies. Wood Sci. Technol. 2014, 48, 651–669. [Google Scholar] [CrossRef]
- Kiraly, T.; Karácsonyi, Z.; Polgár, R. Modeling the earlywood and latewood growth rings of Norway spruce timber beams for finite element calculation. Wood Res. 2023, 68, 28–43. [Google Scholar] [CrossRef]
- Sobczak-Piąstka, J.; Pavluk, A.; Gomon, S.S.; Gomon, P.; Homon, S.; Lynnyk, I. Changing the position of the neutral line of beams made of glued wood in conditions of oblique bending. AIP Conf. Proc. 2023, 2928, 080007. [Google Scholar]
- Liu, S.; Wang, S.; Hu, C.; Kong, D.; Yuan, Y. Series fusion of scatter correction techniques coupled with deep convolution neural network as a promising approach for NIR modeling. Spectrochim. Acta Part A Mol. Biomol. Spectrosc. 2023, 291, 122371. [Google Scholar] [CrossRef]


| Number of Roll Base Layers | Number of Convolution Kernels | Convolution Kernel Size | Stride | Fill | |
|---|---|---|---|---|---|
| blook1 | 2 | 64 | 1 × 3 | 1 | 1 |
| blook2 | 2 | 128 | 1 × 3 | 1 | 1 |
| blook3 | 2 | 256 | 1 × 3 | 1 | 1 |
| blook4 | 2 | 512 | 1 × 3 | 1 | 1 |
| blook5 | 2 | 512 | 1 × 3 | 1 | 1 |
| Number of Iterations | Accurate Classification Quantity | Training Set Accuracy/% |
|---|---|---|
| 300 | 495 | 65.8 |
| 500 | 578 | 76.9 |
| 800 | 658 | 87.5 |
| 1000 | 707 | 94.2 |
| 2000 | 701 | 93.2 |
| Method | DNN/% | Resnet50/% | VGG16/% | VGG19/% |
|---|---|---|---|---|
| Correct quantity | 149 | 153 | 153 | 156 |
| Average accuracy | 90.9 | 93.3 | 93.3 | 95.1 |
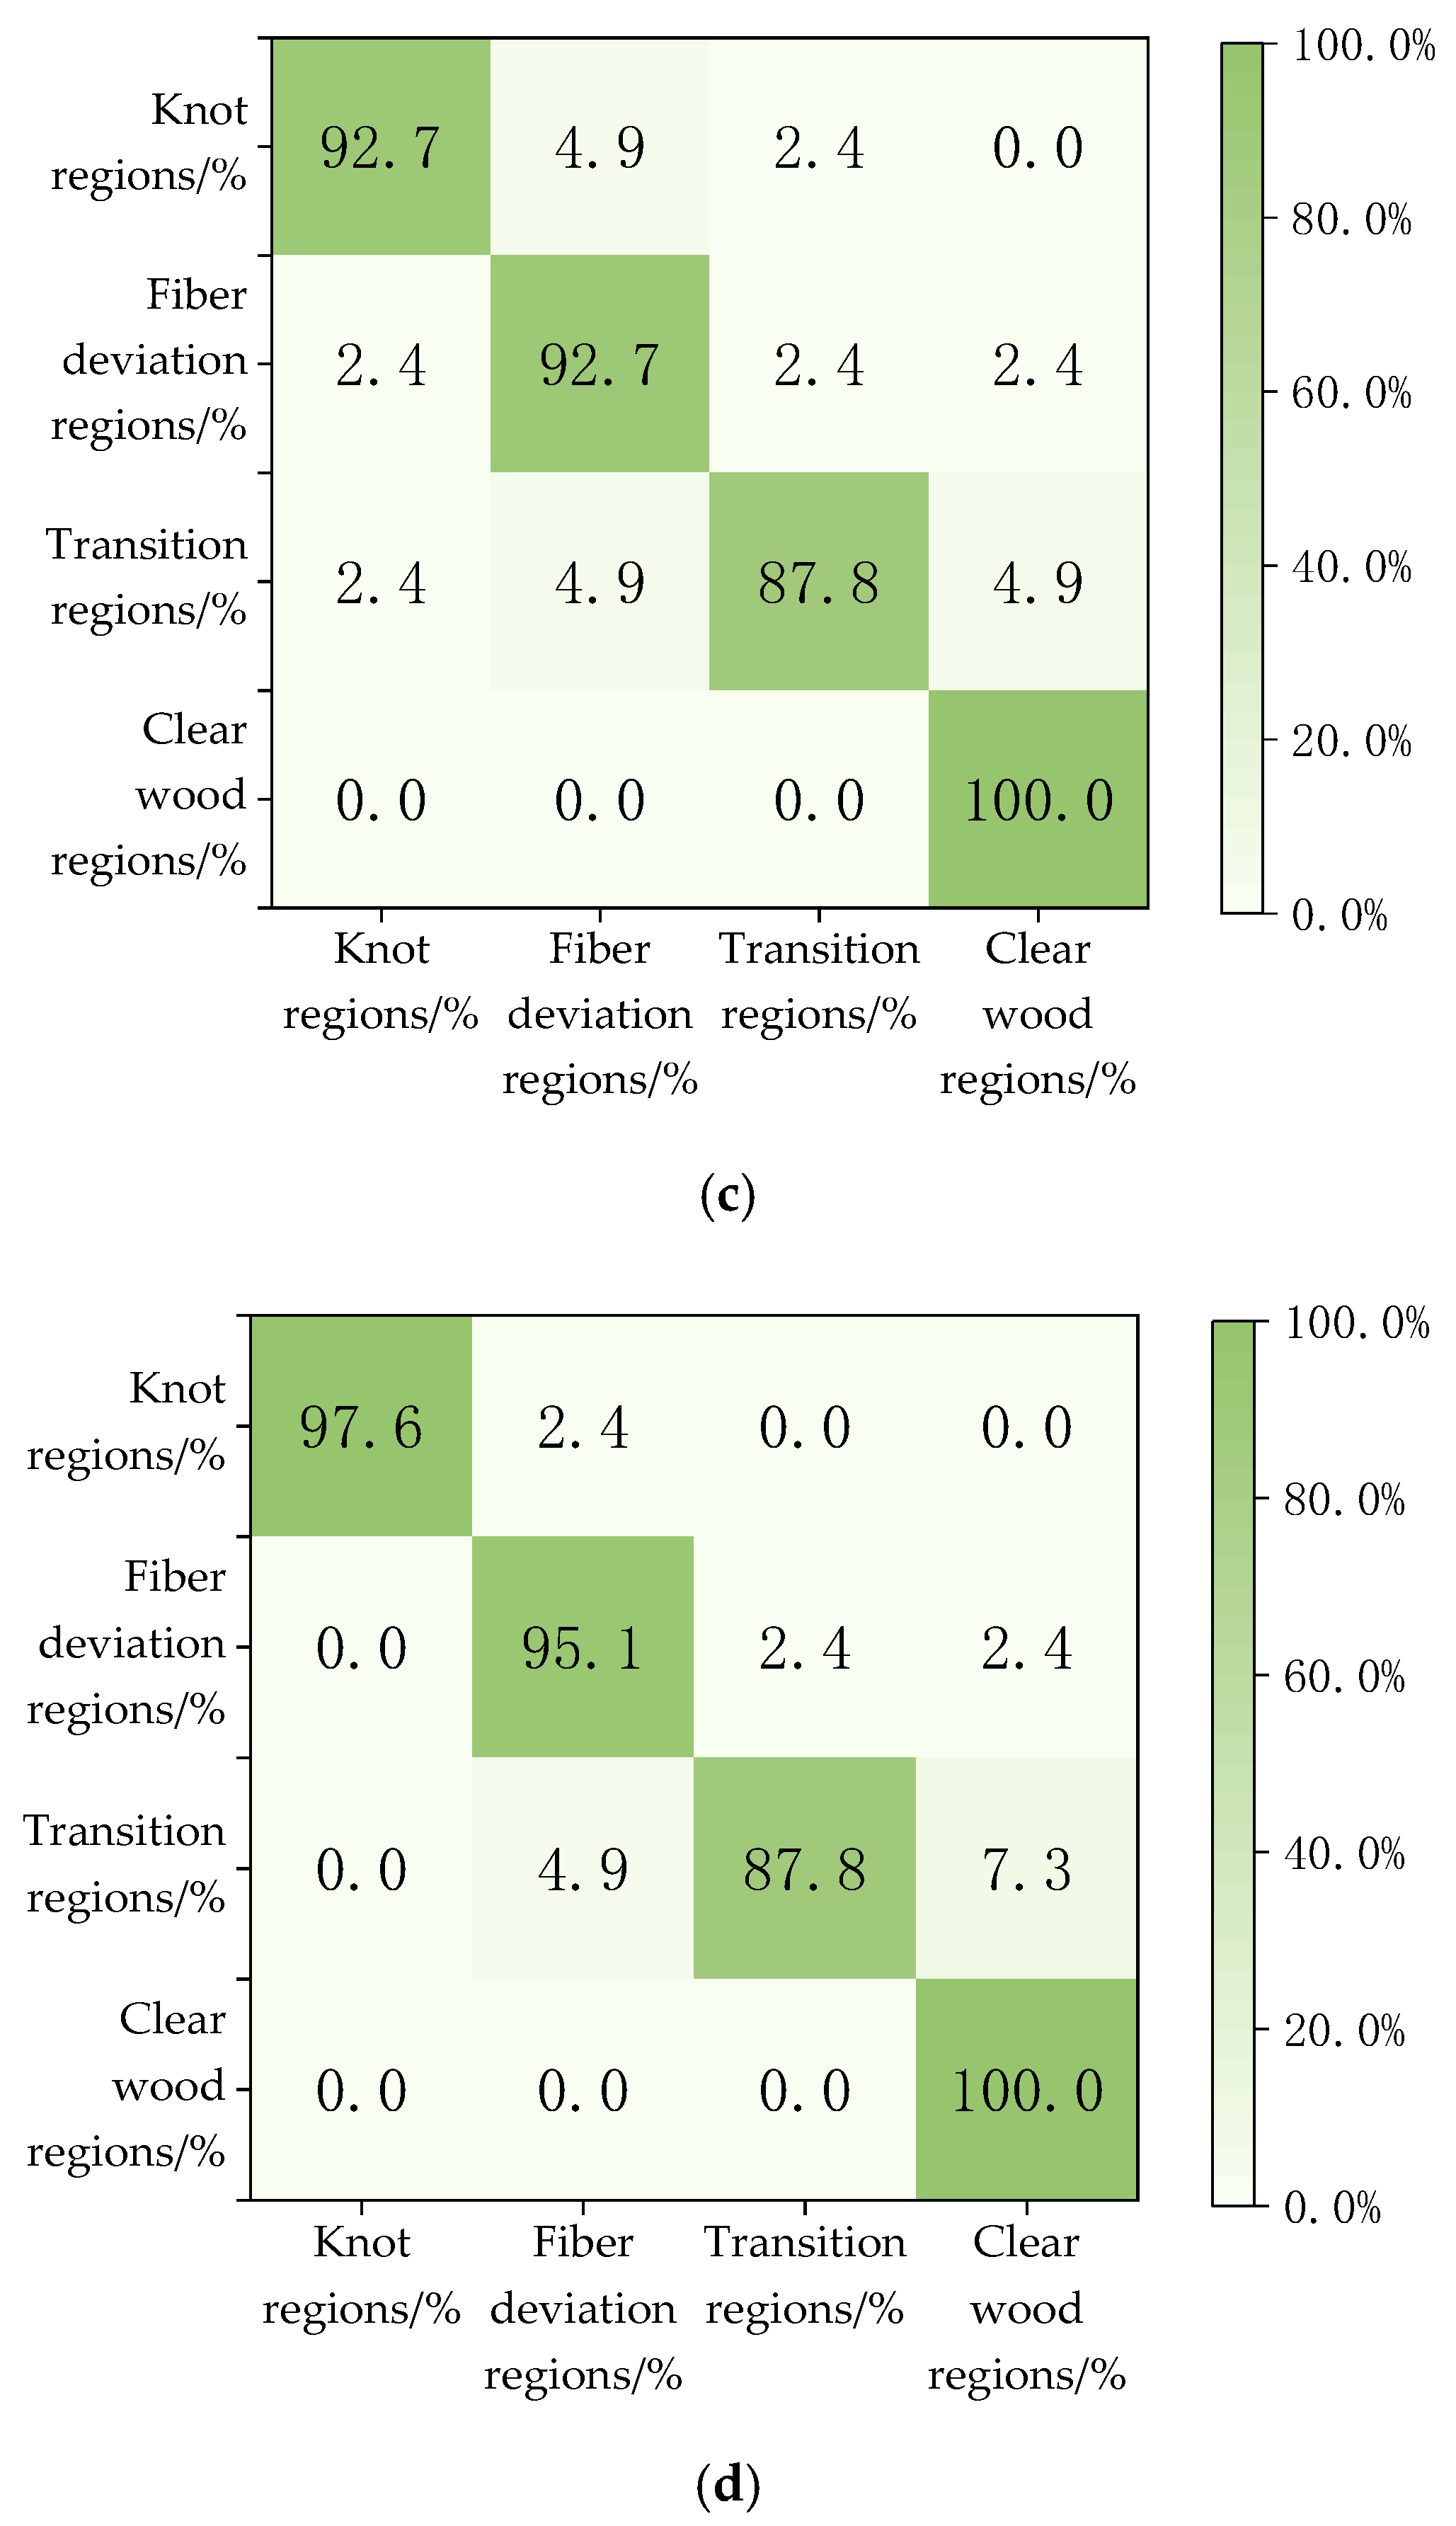
| Knot Regions/% | Fiber Deviation Regions/% | Transition Regions/% | Clear Wood Regions/% | Average Accuracy/% | |
|---|---|---|---|---|---|
| Test set classification accuracy/% | 95.1 | 92.7 | 90.2 | 100 | 94.5 |
| Verification set classification accuracy/% | 97.6 | 95.1 | 87.8 | 100 | 95.1 |
| No of the Plate | Raw Data (MPa) | VGG19-FEA (MPa) | VGG16-FEA (MPa) | Resnet50-FEA (MPa) | Dnn-FEA (MPa) | Linear Model (MPa) |
|---|---|---|---|---|---|---|
| 1 | 10,280.8 | 10,070.1 | 9661.8 | 11,278.2 | 9781.5 | 10,720.9 |
| 2 | 12,605.0 | 12,947.9 | 11,668.3 | 12,371.5 | 11,756.3 | 13,070.2 |
| 3 | 14,740.8 | 15,376.5 | 13,576.2 | 13,980.7 | 15,809.2 | 15,582.0 |
| 4 | 11,384.7 | 11,067.7 | 12,149.5 | 10,542.6 | 12,819.3 | 11,921.6 |
| 5 | 15,777.1 | 17,317.2 | 16,664.9 | 14,528.1 | 16,364.5 | 17,273.6 |
| 6 | 15,210.0 | 16,343.3 | 14,431.3 | 13,982.7 | 13,605.3 | 16,987.2 |
| 7 | 14,913.5 | 15,416.8 | 15,557.9 | 15,954.1 | 16,058.9 | 16,465.2 |
| 8 | 11,939.8 | 11,713.5 | 12,697.2 | 12,471.1 | 12,420.1 | 12,322.0 |
| 9 | 12,601.4 | 12,009.9 | 11,659.6 | 13,710.1 | 12,297.3 | 13,384.2 |
| 10 | 14,207.0 | 14,273.3 | 13,310.7 | 14,2980. | 13,191.7 | 15,481.8 |
| 11 | 12,444.00 | 12,046.1 | 13,031.6 | 11,825.2 | 13,258.9 | 12,791.9 |
| 12 | 13,873.5 | 13,549.9 | 14,771.9 | 14,775.5 | 12,920.0 | 15,569.2 |
| 13 | 9443.2 | 9628.1 | 9907.1 | 9097.9 | 8756.3 | 10,117.6 |
| 14 | 14,699.8 | 15,260.8 | 14,033.5 | 15,627.2 | 15,156.6 | 15,962.7 |
| 15 | 11,188.1 | 11,347.1 | 11,765.7 | 12,319.2 | 10,671.9 | 11,651.8 |
| 16 | 14,692.6 | 13,714.9 | 15,733.1 | 13,578.1 | 15,083.7 | 15,799.5 |
| 17 | 15,951.6 | 16,092.7 | 15,204.9 | 16,725.8 | 17,831.1 | 17,947.1 |
| 18 | 10,822.5 | 10,406.7 | 11,556.2 | 11,821.3 | 9782.2 | 11,244.2 |
| 19 | 10,669.1 | 10,493.7 | 11,448.1 | 10,532.1 | 11,942.8 | 12,003.6 |
| Evaluation Indicators | VGG19-FEA | VGG16-FEA | Resnet50-FEA | Dnn-FEA | Linear Model |
|---|---|---|---|---|---|
| MSE | 598.2 | 801.5 | 868.1 | 991.2 | 1124 |
| R2 | 0.91 | 0.83 | 0.81 | 0.75 | 0.67 |
Disclaimer/Publisher’s Note: The statements, opinions and data contained in all publications are solely those of the individual author(s) and contributor(s) and not of MDPI and/or the editor(s). MDPI and/or the editor(s) disclaim responsibility for any injury to people or property resulting from any ideas, methods, instructions or products referred to in the content. |
© 2024 by the authors. Licensee MDPI, Basel, Switzerland. This article is an open access article distributed under the terms and conditions of the Creative Commons Attribution (CC BY) license (https://creativecommons.org/licenses/by/4.0/).
Share and Cite
Pan, S.; Chang, Z. WD-1D-VGG19-FEA: An Efficient Wood Defect Elastic Modulus Predictive Model. Sensors 2024, 24, 5572. https://doi.org/10.3390/s24175572
Pan S, Chang Z. WD-1D-VGG19-FEA: An Efficient Wood Defect Elastic Modulus Predictive Model. Sensors. 2024; 24(17):5572. https://doi.org/10.3390/s24175572
Chicago/Turabian StylePan, Shen, and Zhanyuan Chang. 2024. "WD-1D-VGG19-FEA: An Efficient Wood Defect Elastic Modulus Predictive Model" Sensors 24, no. 17: 5572. https://doi.org/10.3390/s24175572
APA StylePan, S., & Chang, Z. (2024). WD-1D-VGG19-FEA: An Efficient Wood Defect Elastic Modulus Predictive Model. Sensors, 24(17), 5572. https://doi.org/10.3390/s24175572