1. Introduction
Hydrogen has attracted much attention as a clean, sustainable, and abundant energy source. However, hydrogen is a flammable gas and becomes explosive when its concentration exceeds 4% (in terms of volume) in air (the lower explosive limit, LEL). Therefore, the use of hydrogen, including its production, storage, and transportation, involves the risk of explosion. For this reason, sensors for monitoring hydrogen concentration, or detecting hydrogen leaks, are indispensable, and various types of hydrogen sensors have been actively developed [
1].
Among hydrogen sensors, optical approaches including fiber optics have promising advantages, such as the ability to operate in explosive environments due to electrical isolation and immunity from electromagnetic interference [
2,
3]. Surface plasmon resonance (SPR) sensors, which are a type of optical hydrogen sensor, have been studied for a significant period of time [
4]. SPR sensors are associated with the excitation of propagating surface plasmons, along a metal–dielectric interface, using an optical beam [
5]. As the occurrence conditions of SPR strongly depend on the refractive index of the dielectric and the complex refractive index of the metal, SPR has been used for refractive index sensing in various fields, including gas detection [
6,
7]. There have been a large number of reports concerning the application of SPR sensors to hydrogen gas detection. The SPR sensors are mainly classified into three types, based on couplers, to excite propagating surface plasmons [
7], prism couplers, optical waveguide couplers, and grating couplers. An SPR sensor with a glass prism (Kretschmann–Raether configuration), upon which, a palladium (Pd) layer is deposited, was for the first time proposed for the detection of hydrogen gas by Chadwick and Gal [
8]. Then, a prism coupler type SPR sensor (Otto configuration) was reported, within which, a glass prism was constructed with an intermediate layer of silica and a sensing layer of Pd on top [
9]. As SPR hydrogen sensors with a waveguide coupler, a channel waveguide [
10], and an optical fiber [
11] were proposed, within which, a thin Pd film was coated on a portion of the core, from which, the cladding was then removed. Furthermore, various types of optical fiber hydrogen sensors [
3], such as multimode fibers [
11,
12], fiber gratings [
13], and tapered fibers [
14], have been actively developed, owing to their potential for remote and multiplex sensing [
15]. A metal diffraction grating, coated with a thin Pd film on its surface, has been proposed as a hydrogen SPR sensor [
16]. SPR hydrogen sensors are based on a technology that integrates refractive index sensing with hydrogen sensitive materials such as Pd [
3]. Hydrogen sensitive materials that sensitively, selectively, and quickly convert the absorption or adsorption of hydrogen into a change in their own refractive index have been extensively studied as transducers in the following SPR hydrogen sensors [
3,
17]: Pd alloys [
18,
19], multilayers including a Pd layer [
12,
20], Pd composite films [
21], Pd nanofilms on photonic crystal [
22], etc. Furthermore, an accurate and simple technique for detecting the change in optical properties, caused by the exposure of a hydrogen sensitive material to hydrogen gas, could be essential for the practical application of SPR hydrogen sensors. This requires the development of a measurement technique to accurately detect minute changes in the (complex) refractive index of a hydrogen sensitive material with a straightforward optical configuration, based on SPR sensing [
16].
Here, we discuss an efficient technique that allowed us to detect small changes in the complex refractive index of a Pd thin-film upon exposure to hydrogen gas by using SPR in a metal gating. Given that we examined a hydrogen gas detector, we considered an aluminum diffraction grating, coated with a Pd thin-film on its surface. The Pd thin-film layer serves two purposes [
10]: it provides a coupler to excite surface plasmons and a transducer to convert hydrogen exposure into a change in its own complex refractive index. Thus, SPR occurring in the Pd thin-film coated aluminum grating includes the information of a small change in the complex refractive index of the Pd thin-film layer due to hydrogen gas exposure. To accurately and efficiently detect the complex refractive index change in the Pd thin film layer, we applied an SPR sensing technique that uses a polarization property of (specularly) light reflected from a metal grating [
23]. Regarding this sensing technique, a metal grating is arranged in a conical mounting, where the plane of incidence is not perpendicular to its grooves [
24,
25]; then, the normalized Stokes parameter,
, of the reflected light (which means that the intensity difference between the right- and left-circularly polarized components) is measured. When a metal grating in a conical mounting is illuminated with TM (
p)-polarized light whose electric field is parallel to the plane of incidence,
rapidly changes with the angle of incidence around the resonance angle
, at which point, SPR occurs. The rapid change in
results in the following interesting features of refractive index sensing:
is determined as the zero-crossing point on the
curve (incident angle dependence of
), and a small change in the refractive index of a sample is detected by measuring
under the fixed angle of incidence, which is
. The effectiveness of the SPR sensing technique, using the rapid change in
has been demonstrated by experiments comprising the following: detection of the refractive index difference among gaseous samples, including H
2, O
2, N
2, and CO
2 [
23], and ethanol concentration measurements of ethanol–water solutions [
26]. In these experiments, the variations in a real refractive index were detected using an aluminum grating in a conical mounting.
In this study, we deposited an approximately 50 nm thick Pd thin-film on the surface of a commercially available aluminum grating, with a groove density of 2400 lines/mm. Then, we investigated the polarization property of the reflected light from the Pd thin-film coated aluminum grating in a conical mounting when TM-polarized light, with a wavelength of 672 nm, illuminated it. As a result, we revealed a rapid change in with a steep slope of around , which is associated with the sharp SPR occurring in the Pd thin-film layer. Notably, the steep slope where the rapid change in occurs makes a small change in the complex refractive index of the Pd thin-film layer significantly vary in the vicinity of . Therefore, measuring the variation in allowed us to detect hydrogen gas near the LEL. We experimentally showed that the SPR sensing technique, measuring the variation in , sensitively and stably, detected a gas mixture of hydrogen with a 4% (by volume) concentration in nitrogen, and provided a good response to the change in hydrogen concentration, with 1 to 4% of nitrogen.
3. Experimental Results and Discussion
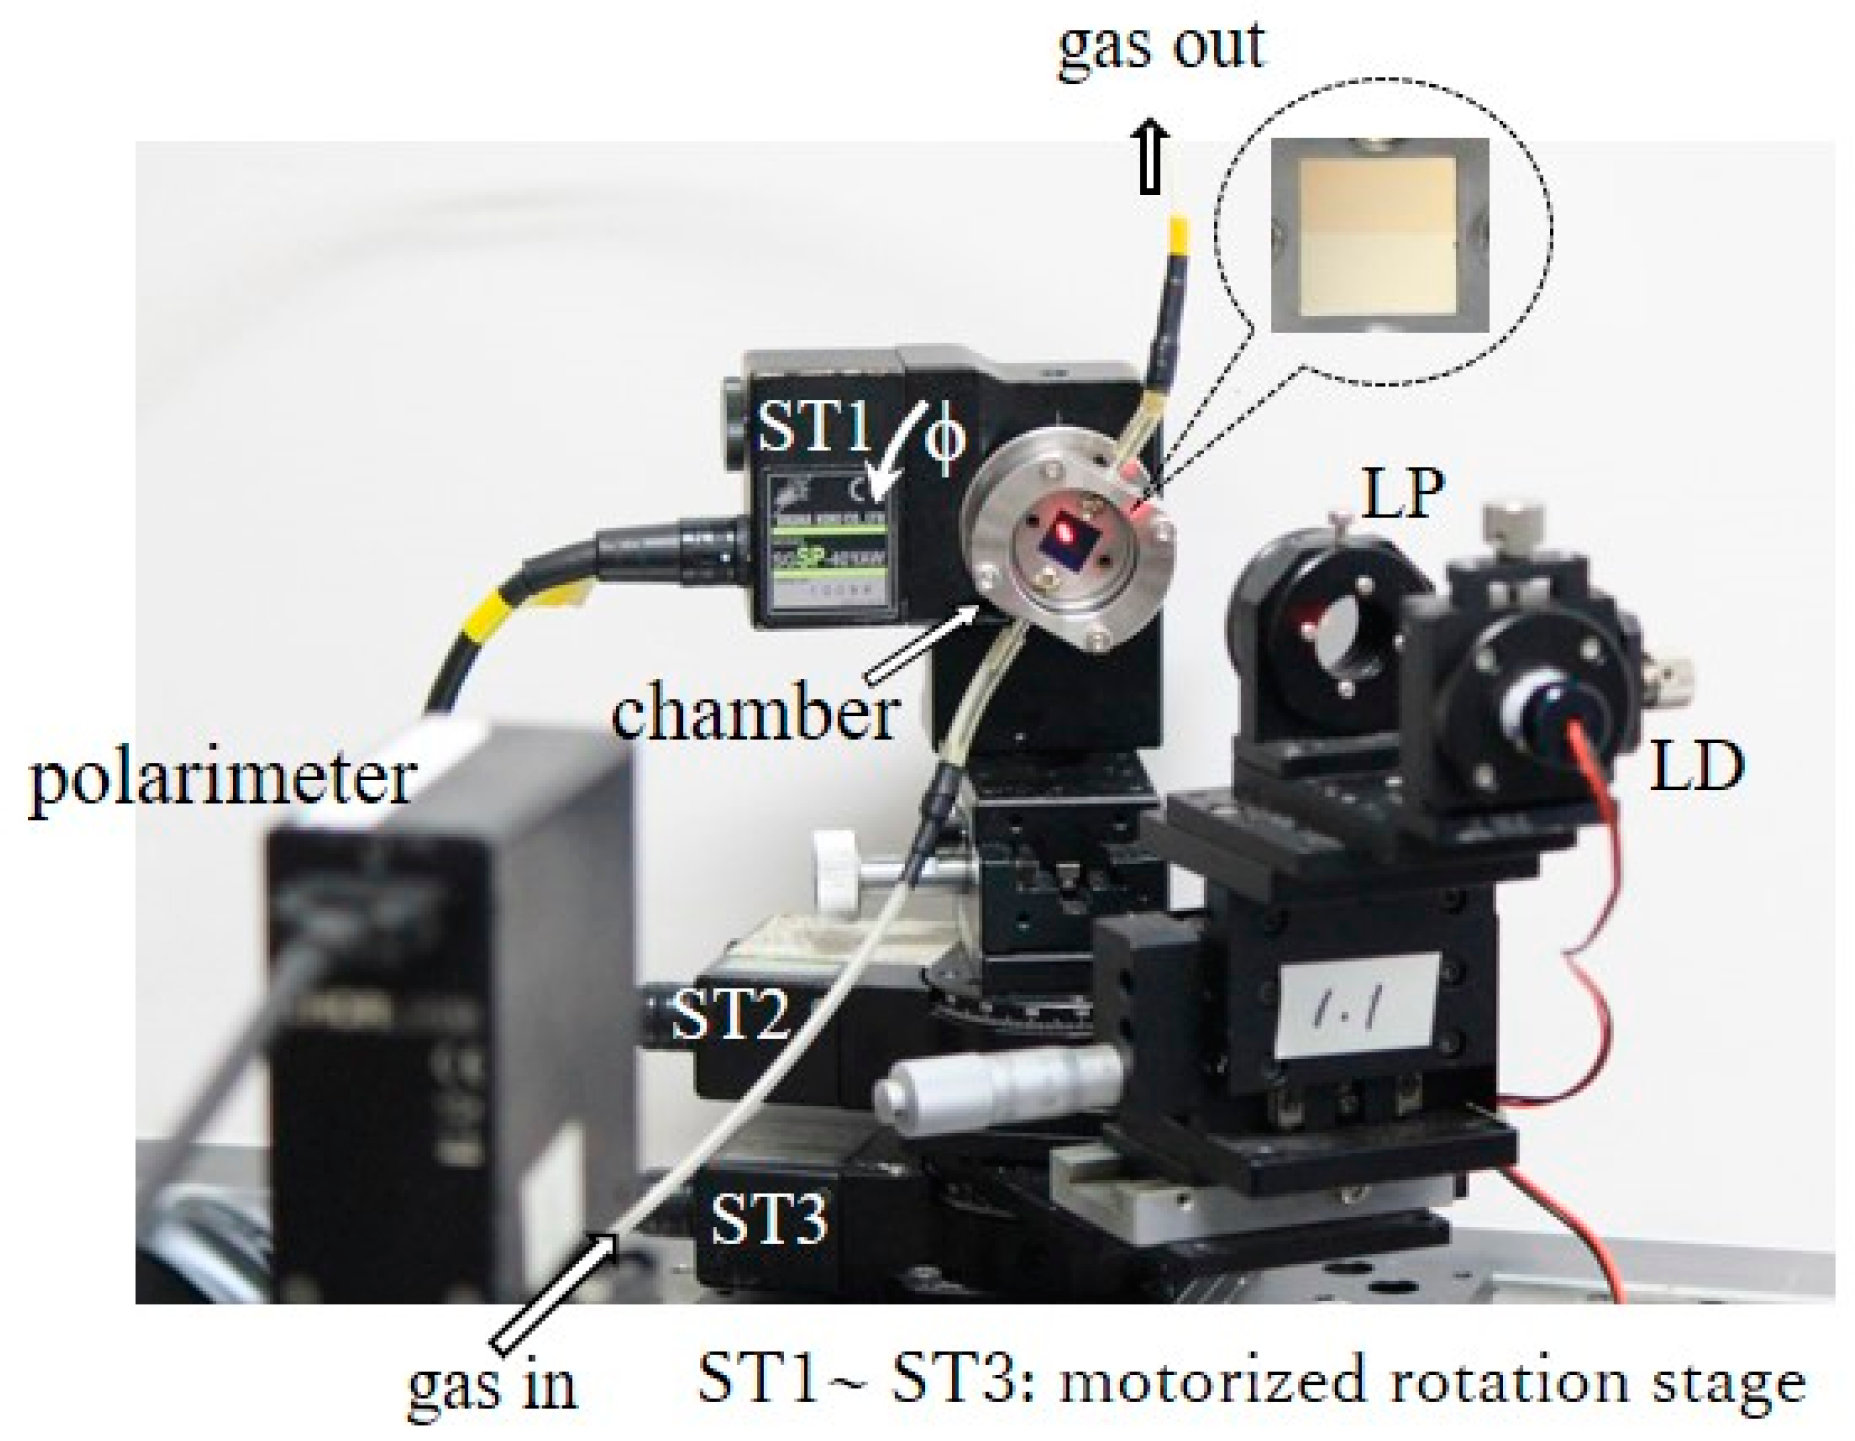
We report the experimental results obtained with the experimental setup stated above. The experimental results show that the polarization property of the reflected light associated with SPR in the Pd-deposited portion of the aluminum grating could be available when detecting hydrogen gas of a concentration near the LEL. The experiment was performed in a laboratory, at room temperature, and under atmospheric pressure conditions.
3.1. Polarization Property of SPR in Pd-Deposited Portion
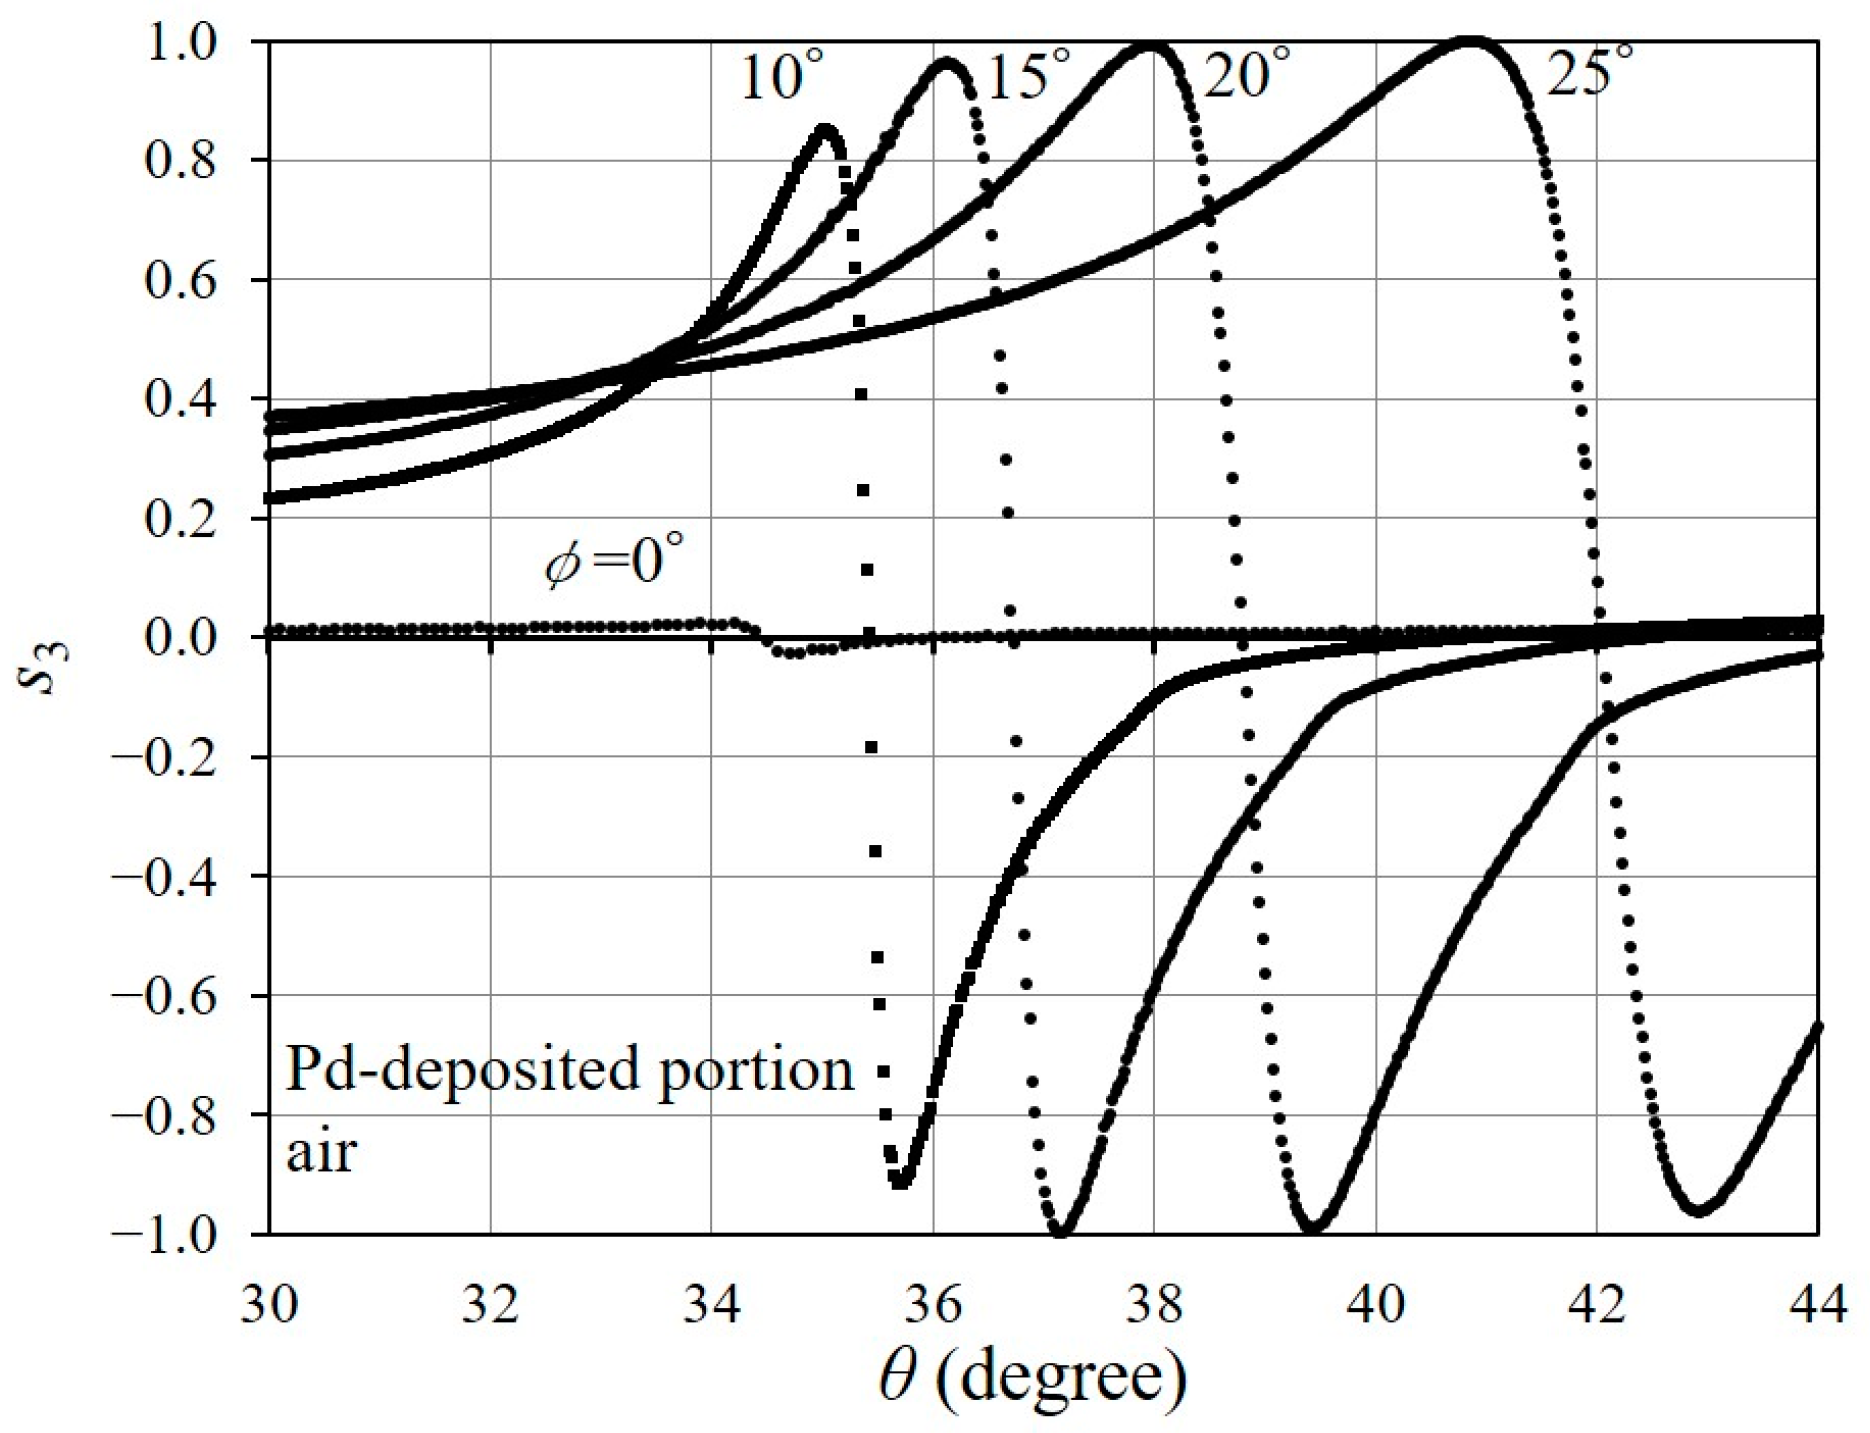
We investigated the polarization property of the reflected light associated with SPR occurring in the bare Al portion and in the Pd-deposited portion when a gas sample comprised air.
Figure 5a,b show the
and
of the reflected light from the bare Al portion and the Pd-deposited portion of the aluminum grating, with the azimuthal angle set to
when
varied between
and
. The cut-off for the −1st-order diffracted mode is denoted by
in
Figure 5, and the zeroth-order diffracted mode only propagates and the other diffracted modes are evanescent in the range of
to less than
. The
and
curves of the reflected light from the bare Al portion show the occurrence of SPR at
which is the zero-crossing point of
. The
curve shows the partial absorption of the incidental light as a dip in the vicinity of
and
rapidly fluctuates between a positive maximum value and a negative minimum value via zero at
. The rapid change in
as well as the absorption dip of
is caused by the occurrence of SPR [
23]. The SPR of
in the bare Al portion is associated with the coupling of the TM component in the −1st-order evanescent mode with the surface plasmon wave propagating along the surface of the aluminum grating [
33]. Next, we describe SPR occurring in the Pd-deposited portion. The
and
curves of the reflected light from the Pd-deposited portion show the occurrence of SPR at
as the rapid change in
and the absorption dip of
. Note that
fluctuates more rapidly from
to
via
at
and the rapid change in
has a steeper slope around
. SPR in the Pd-deposited portion is caused by the coupling of the TM component of the −1st-order diffracted evanescent mode with the surface plasmon wave, which is supported by the Pd thin-film layer. Therefore, the occurrence of SPR in the Pd-deposited portion depends on the complex refractive index of the Pd thin-film layer, as expected from Equation (4).
The rapid change in with the steep slope observed in the Pd-deposited portion, has useful features for detecting a small change in the complex refractive index of the Pd thin-film layer. First, is determined as the zero-crossing point on the curve. The zero-crossing point detection of can be accurately and easily implemented, regardless of the sharpness of SPR, such as when the absorption dip in a reflectance curve is small or broad and shallow. Next, the steep slope of the rapid change in in the vicinity of causes a large variation in in response to a small change in the complex refractive index of the Pd thin-film layer. Therefore, a small change in the refractive index of a sensing sample can be detected by measuring under a fixed angle of incidence at . The measurement of , which is the intensity difference between the right- and left-circularly polarized components, may be implemented with a simple measuring device, as the reflected light is a monochromatic light with a high degree of polarization.
Here, we describe the occurrence process of the rapid change in
through the behavior of the TE- and TM-components of the reflected light when SPR occurs in the Pd-deposited portion. This will facilitate a clear understanding of the effectiveness of the SPR sensing technique using the rapid change in
with the steep slope.
Figure 6 shows the
and
curves which correspond to SPR in
Figure 5b. With SPR, regarding the bare Al portion,
varies from
to
via
at
at the same time,
increases in the vicinity of
. Both the phase shift of
[
34] and the increase in
[
25] result in a rapid change in
at around
[
23]. With SPR in the Pd-deposited portion,
very rapidly fluctuates from
to
at
. In addition,
sharply increases in the vicinity of
due to the elimination of
, which is caused by the almost total absorption of the TM component of the incidental light by SPR. Thus, the steep slope of the rapid change in
in the Pd-deposited portion, is caused by the rapid phase shift of
and a sharp increase in
; these are largely affected by a change in the occurrence conditions of SPR in the Pd-deposited portion layer.
The azimuthal angle in a conical mounting
has an effect on the behavior of the rapid change in
.
Figure 7 shows the
curves of the reflected light from the Pd-deposited portion for
and
, in addition to that for
, as shown in
Figure 5b. We set the azimuthal angle
as
at which point, the
curve becomes zero, except for a slight variation in the vicinity of the resonance angle. Then, we chose the
that gave the steeper slope for the rapid change in
and which, at the same time, caused
to vary over a wider range. The slope of the
curve in the vicinity of the resonance angle is related to the sharpness of SPR [
23], which affects the sensitivity of the refractive index measurement. In
Figure 7, the rapid change in
for
produces a steep slope around the resonance angle, and the
fluctuates across a whole range from
to
. Therefore, we used
as the azimuthal angle in the following experiments.
3.2. Hydrogen Gas Detection Using Rapid Change in
We applied a rapid change in with the steep slope, which was observed in the Pd deposited portion of the aluminum grating in the conical mounting, at , to the detection of hydrogen gas. Sample gases comprised mixtures of hydrogen and nitrogen, and they are denoted by the concentrations of hydrogen in nitrogen were = 1, 2, 3, or 4% (in accordance with volume). Each sample gas was injected into the chamber with a flow rate of 2 L/min, through a tube, from a gas cylinder regulator. The volume of the chamber was approximately 2 mL. The experiment was performed at a temperature of 15.6 °C, the humidity was 40%, and the atmospheric pressure was 1009.3 hPa.
3.2.1. Effect of Hydrogen Gas Exposure on Rapid Change in
We examine the polarization property of the reflected light associated with SPR when the Pd-deposited portion, or the bare Al portion, is exposed to
.
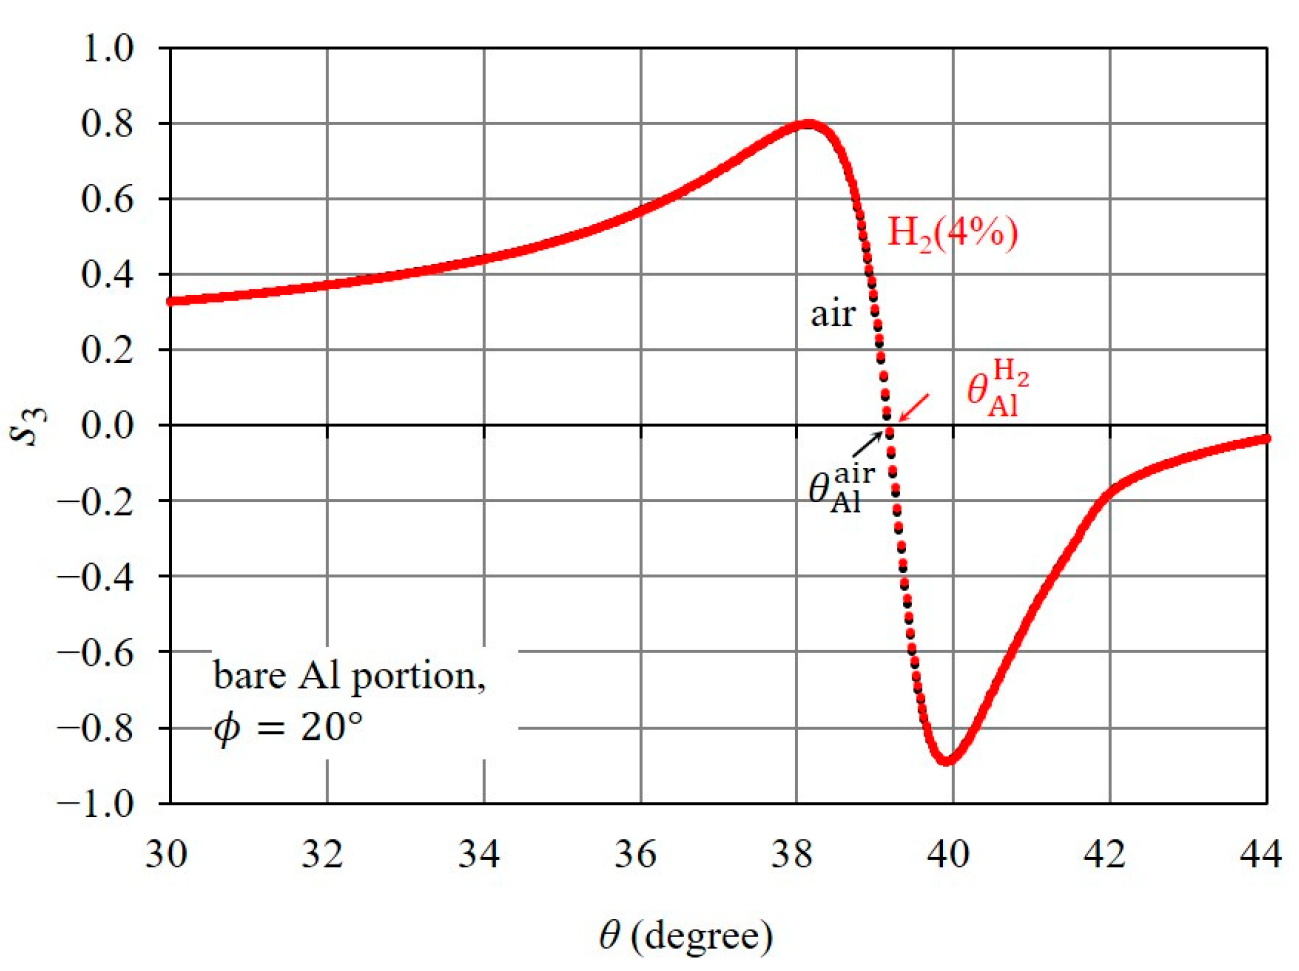
Figure 8 shows the
curves for air and
in the bare Al portion. The
curve for
is almost identical to that for air, with a very slight difference around their resonance angles. Therefore, it was difficult to detect hydrogen gas with a concentration near the LEL (for instance,
) using the rapid change in
in the bare Al portion. Next, we describe the effect of the exposure of the Pd thin-film layer to
on the polarization property associated with SPR.
Figure 9a shows the shift in the
curve near the resonance angle due to
exposure, and
Figure 9b clearly illustrates the difference between the rapid change in
for
and air. The difference between the rapid change in
, which was caused by the change in the complex refractive index of the Pd thin-film layer upon exposure to
, is explained with the resonance properties of
and
which are associated with SPR. As shown in
Figure 9c,d,
for
fluctuates from
to
via
, whereas
for air fluctuates from
to
via
, and the peak value of
for
is larger than that for air. Thus, the exposure of the Pd thin-film layer to
has a significant effect on the
phase shift of
and the increase in
, resulting in the significant shift in the rapid change in
.
Here, we describe an efficient technique to detect hydrogen gas using the rapid change in
, as observed in the Pd-deposited portion. With SPR sensing, the resonance angle is typically measured to detect a change in the refractive index of a sample. However, as estimated in
Figure 9b, the variation in
is small for a change in hydrogen gas concentration near the LEL. This required a precise angle measurement to detect a variation in
. An alternative technique for measuring such a small variation in
has been proposed [
23], which utilizes the approximate linearity of the rapid change in
around
. If a gas sample changes from air to
under the angle of incidence fixed at
,
then fluctuates from 0 to
, as illustrated by the arrow in
Figure 9b. Therefore, we can detect hydrogen gas with concentrations within the range of 0 to
in nitrogen by measuring
at
.
3.2.2. Variation in Due to Hydrogen Gas Exposure
Using the SPR sensing technique measuring as stated above, we carried out experiments to detect gas mixtures containing 1 to 4% hydrogen in nitrogen. We first determined the resonance angle from the curve for air, and then fixed the angle of incidence at . The state where the chamber is filled with air, and is fixed at is referred to as the initial state.
Figure 10 shows the time response of
when the injection of
into the chamber started at
s (point A on the figure) in the initial state and stopped at t = 83 s (point B). In
Figure 10, the response value reaches
, which is close to
(see
Figure 9b), and the response time is
s. We used the response time,
which was defined as the time necessary for the response to vary from the initial state to 90% of the total change [
14]. After the shutdown of B, the
remaining in the chamber dissipated into the atmosphere, and
returned to its initial state (air) in
s. If the
in the chamber is removed more quickly,
returns to the initial state more quickly.
Figure 11 shows that
returned to its initial state in
s from the shutdown (point C on the figure), when
was exhausted with a pump.
Figure 12 shows the time response of
when the injection and dissipation of
was repeated four times in succession.
was injected into the chamber at A
1 to A
4 (shown in the figure) and
in the chamber dissipated into the atmosphere after the shutdown of B
1 to B
4. The time response of
indicates good repeatability for the successive exposure of the Pd-deposited portion to
.
We examined the response of
to four hydrogen gases, with different concentrations in nitrogen,
.
Figure 13 shows the time responses of
when each
was injected into the chamber at point A in the initial state, and the inset plots the value of
at
s, as a time response, as a function of
. The response value fluctuates significantly, reaching up to nearly 2%, but it fluctuates slowly above that level. This behavior, caused by the response to hydrogen gas concentration, which has been reported in the literature [
9,
11,
14,
35,
36], is explained by the crystallographic phases of the palladium–hydrogen system in references [
11,
35]. Moreover, the time taken for
to stabilize increases as
decreases [
11].
3.2.3. Discussion
As stated above, the SPR sensing technique, using the rapid change in in the Pd-deposited portion, provides a sensitive and stable response to the exposure of the Pd thin-film layer to gas mixtures containing hydrogen, at concentrations from 1 to 4%, in nitrogen. This demonstrates that the SPR sensing technique enables the detection of a small change in the complex refractive index of the Pd thin-film layer, which is caused by exposure to hydrogen gas. Therefore, the SPR sensing technique can be used to investigate the optical properties of a Pd thin-film layer exposed to hydrogen gas, with a concentration near the LEL.
However, there are some issues regarding the application of the SPR sensing technique, using the rapid change in
to hydrogen sensors. The reduction in the recovery time, observed in
Figure 11, is necessary for its application to hydrogen SPR sensors, in addition to improving the response time delay with a reduction in hydrogen gas concentration. Alloying Pd with gold [
19], or creating multilayered structures such as Au/SiO
2/Pd [
12], may be effective in improving reaction and recovery times. Moreover, we observed a reduction in the response value of
and a delay in response time regarding the experiments that were conducted after the Pd-deposited portion was repeatedly exposed to hydrogen gas. This suggests the degradation of the hydrogen detection performance of the Pd thin-film layer due to the mechanical damage of Pd upon exposure to hydrogen. Pd is susceptible to cracking, blistering, and delamination upon repeated exposure to hydrogen [
17,
37], and countermeasures to prevent mechanical damage (e.g., alloying of Pd with nickel [
18] and gold [
19] and capping of Pd with a gold layer [
36]) have been reported. The SPR sensing technique, using the rapid change in
may be available for hydrogen sensitive materials other than a Pd thin-film, such as Pd alloy/composite films [
18,
19,
21] and multilayer films, including a Pd thin-film [
12,
36], which improve the performance of hydrogen gas detection.


