

SensAA—Design and Verification of a Cloud-Based Wearable Biomechanical Data Acquisition System

Abstract
:
1. Introduction
2. Materials and Methods
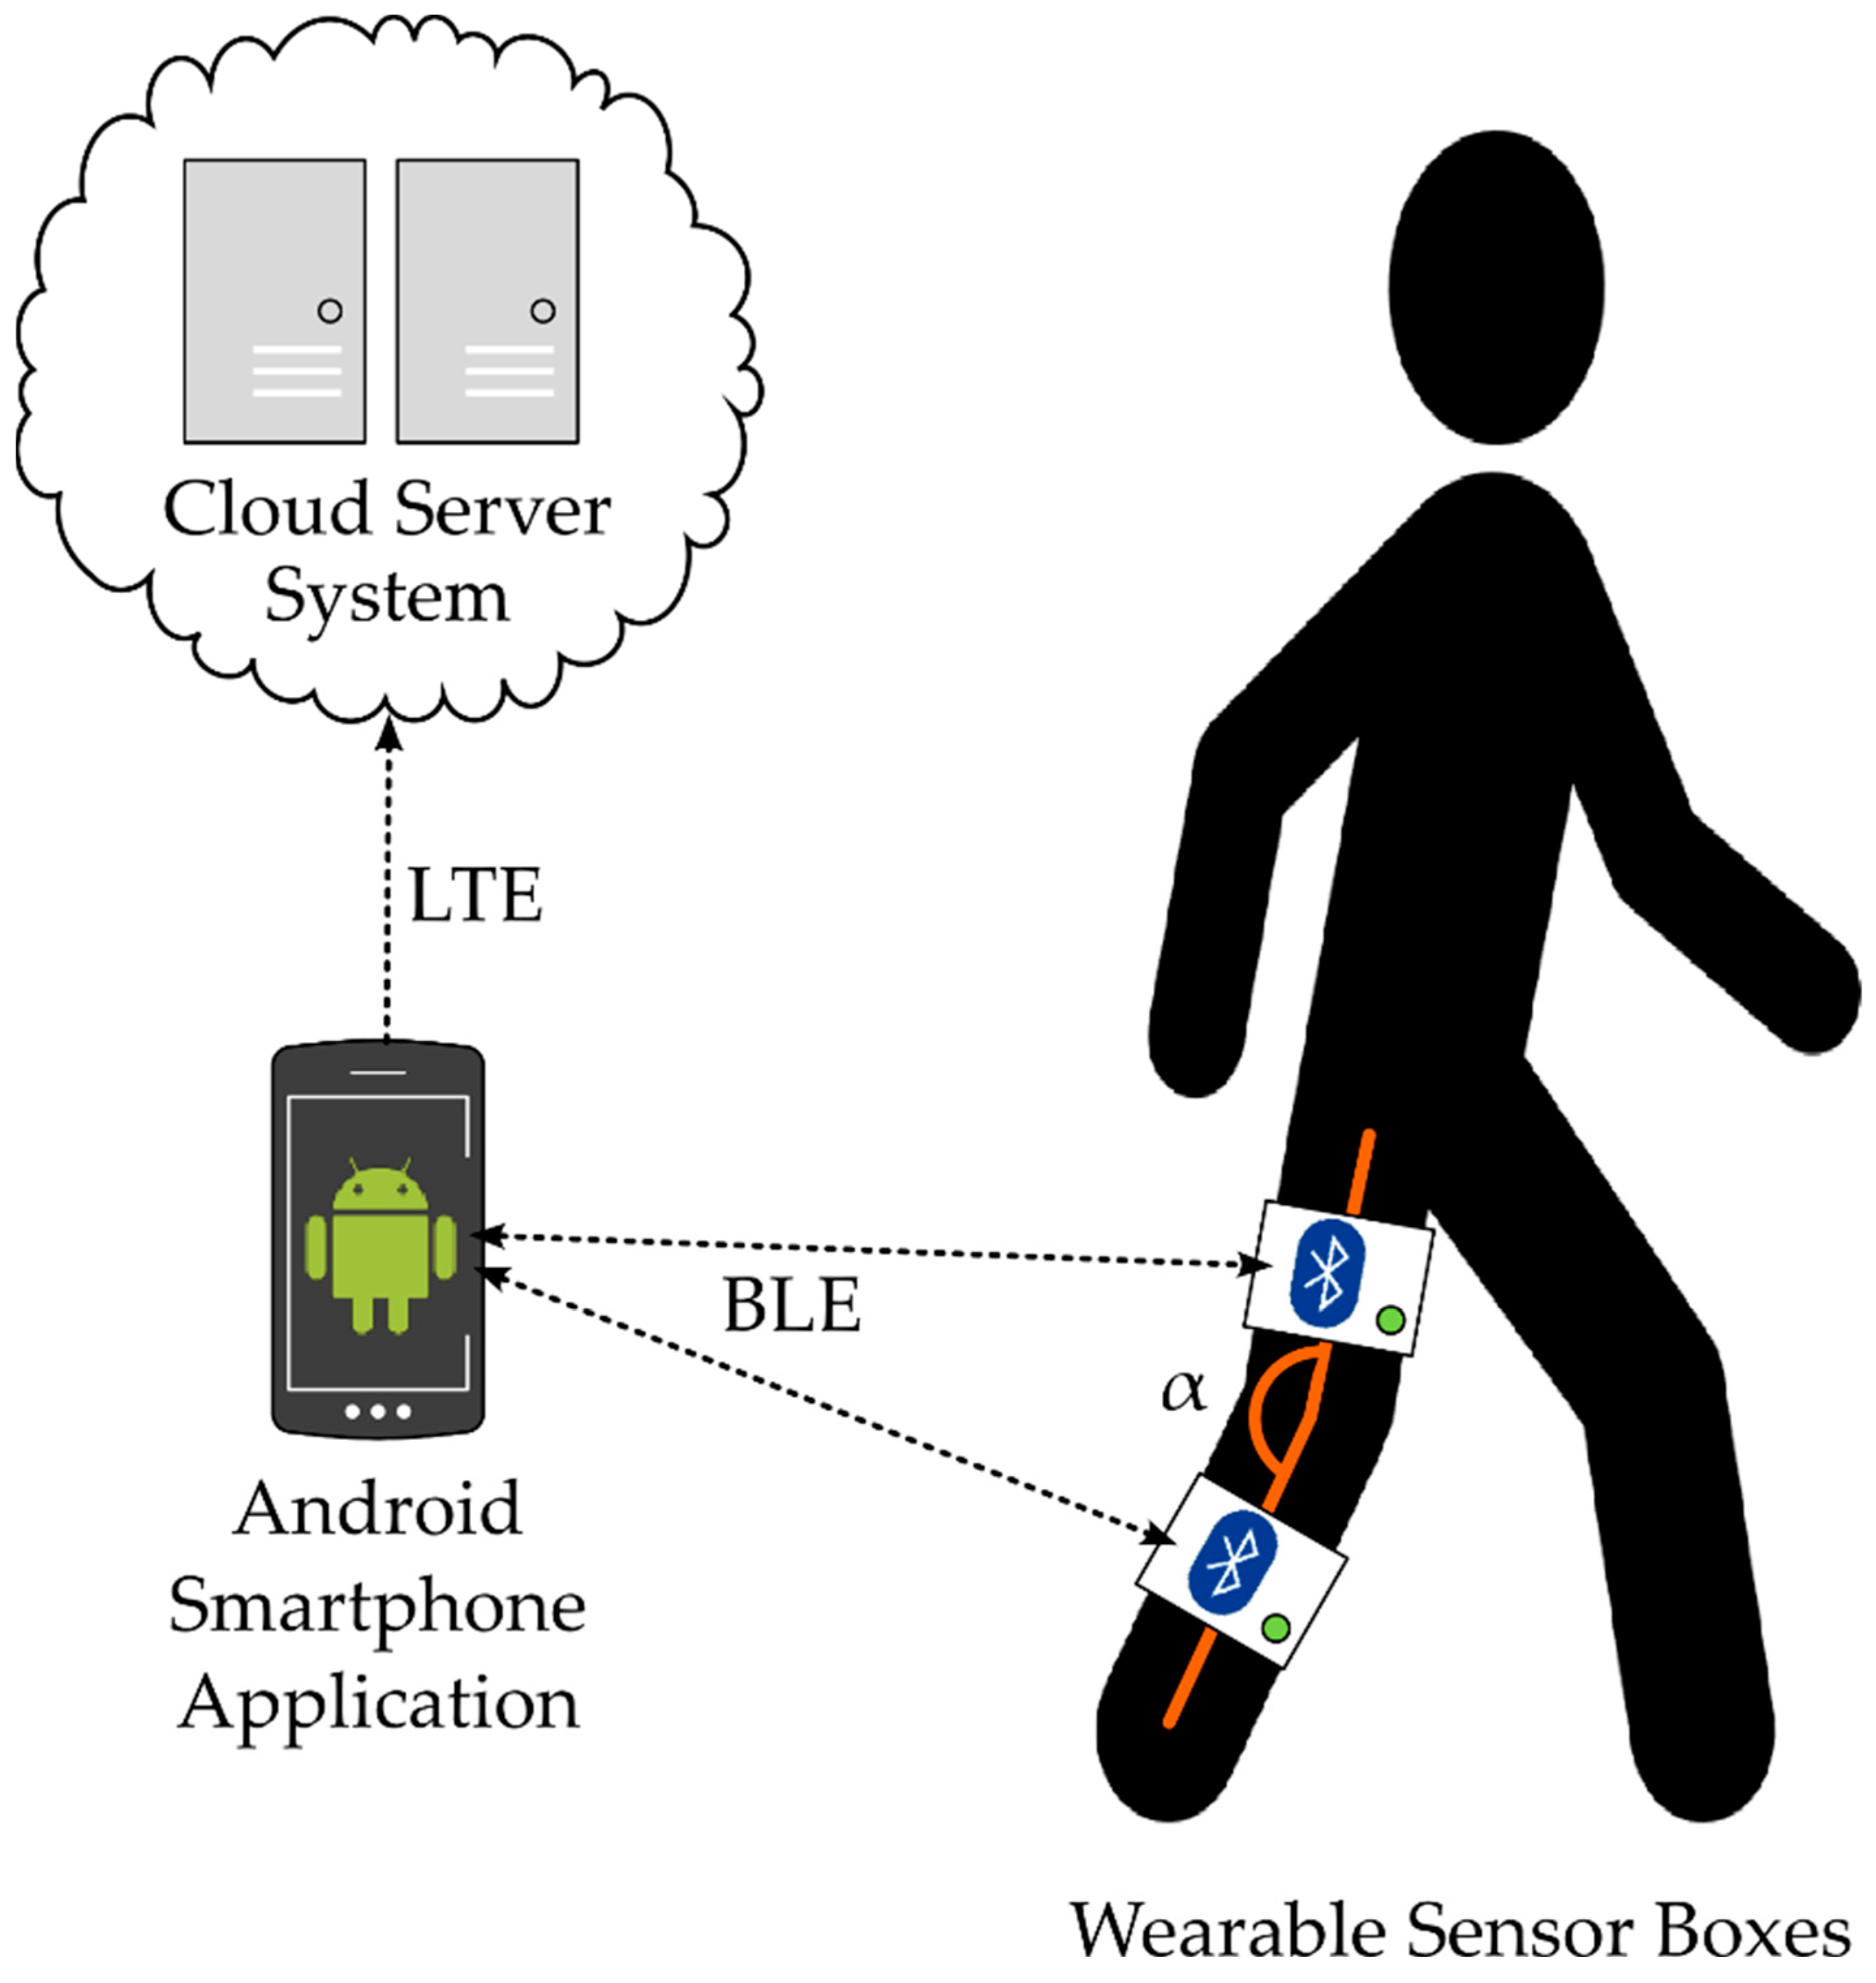
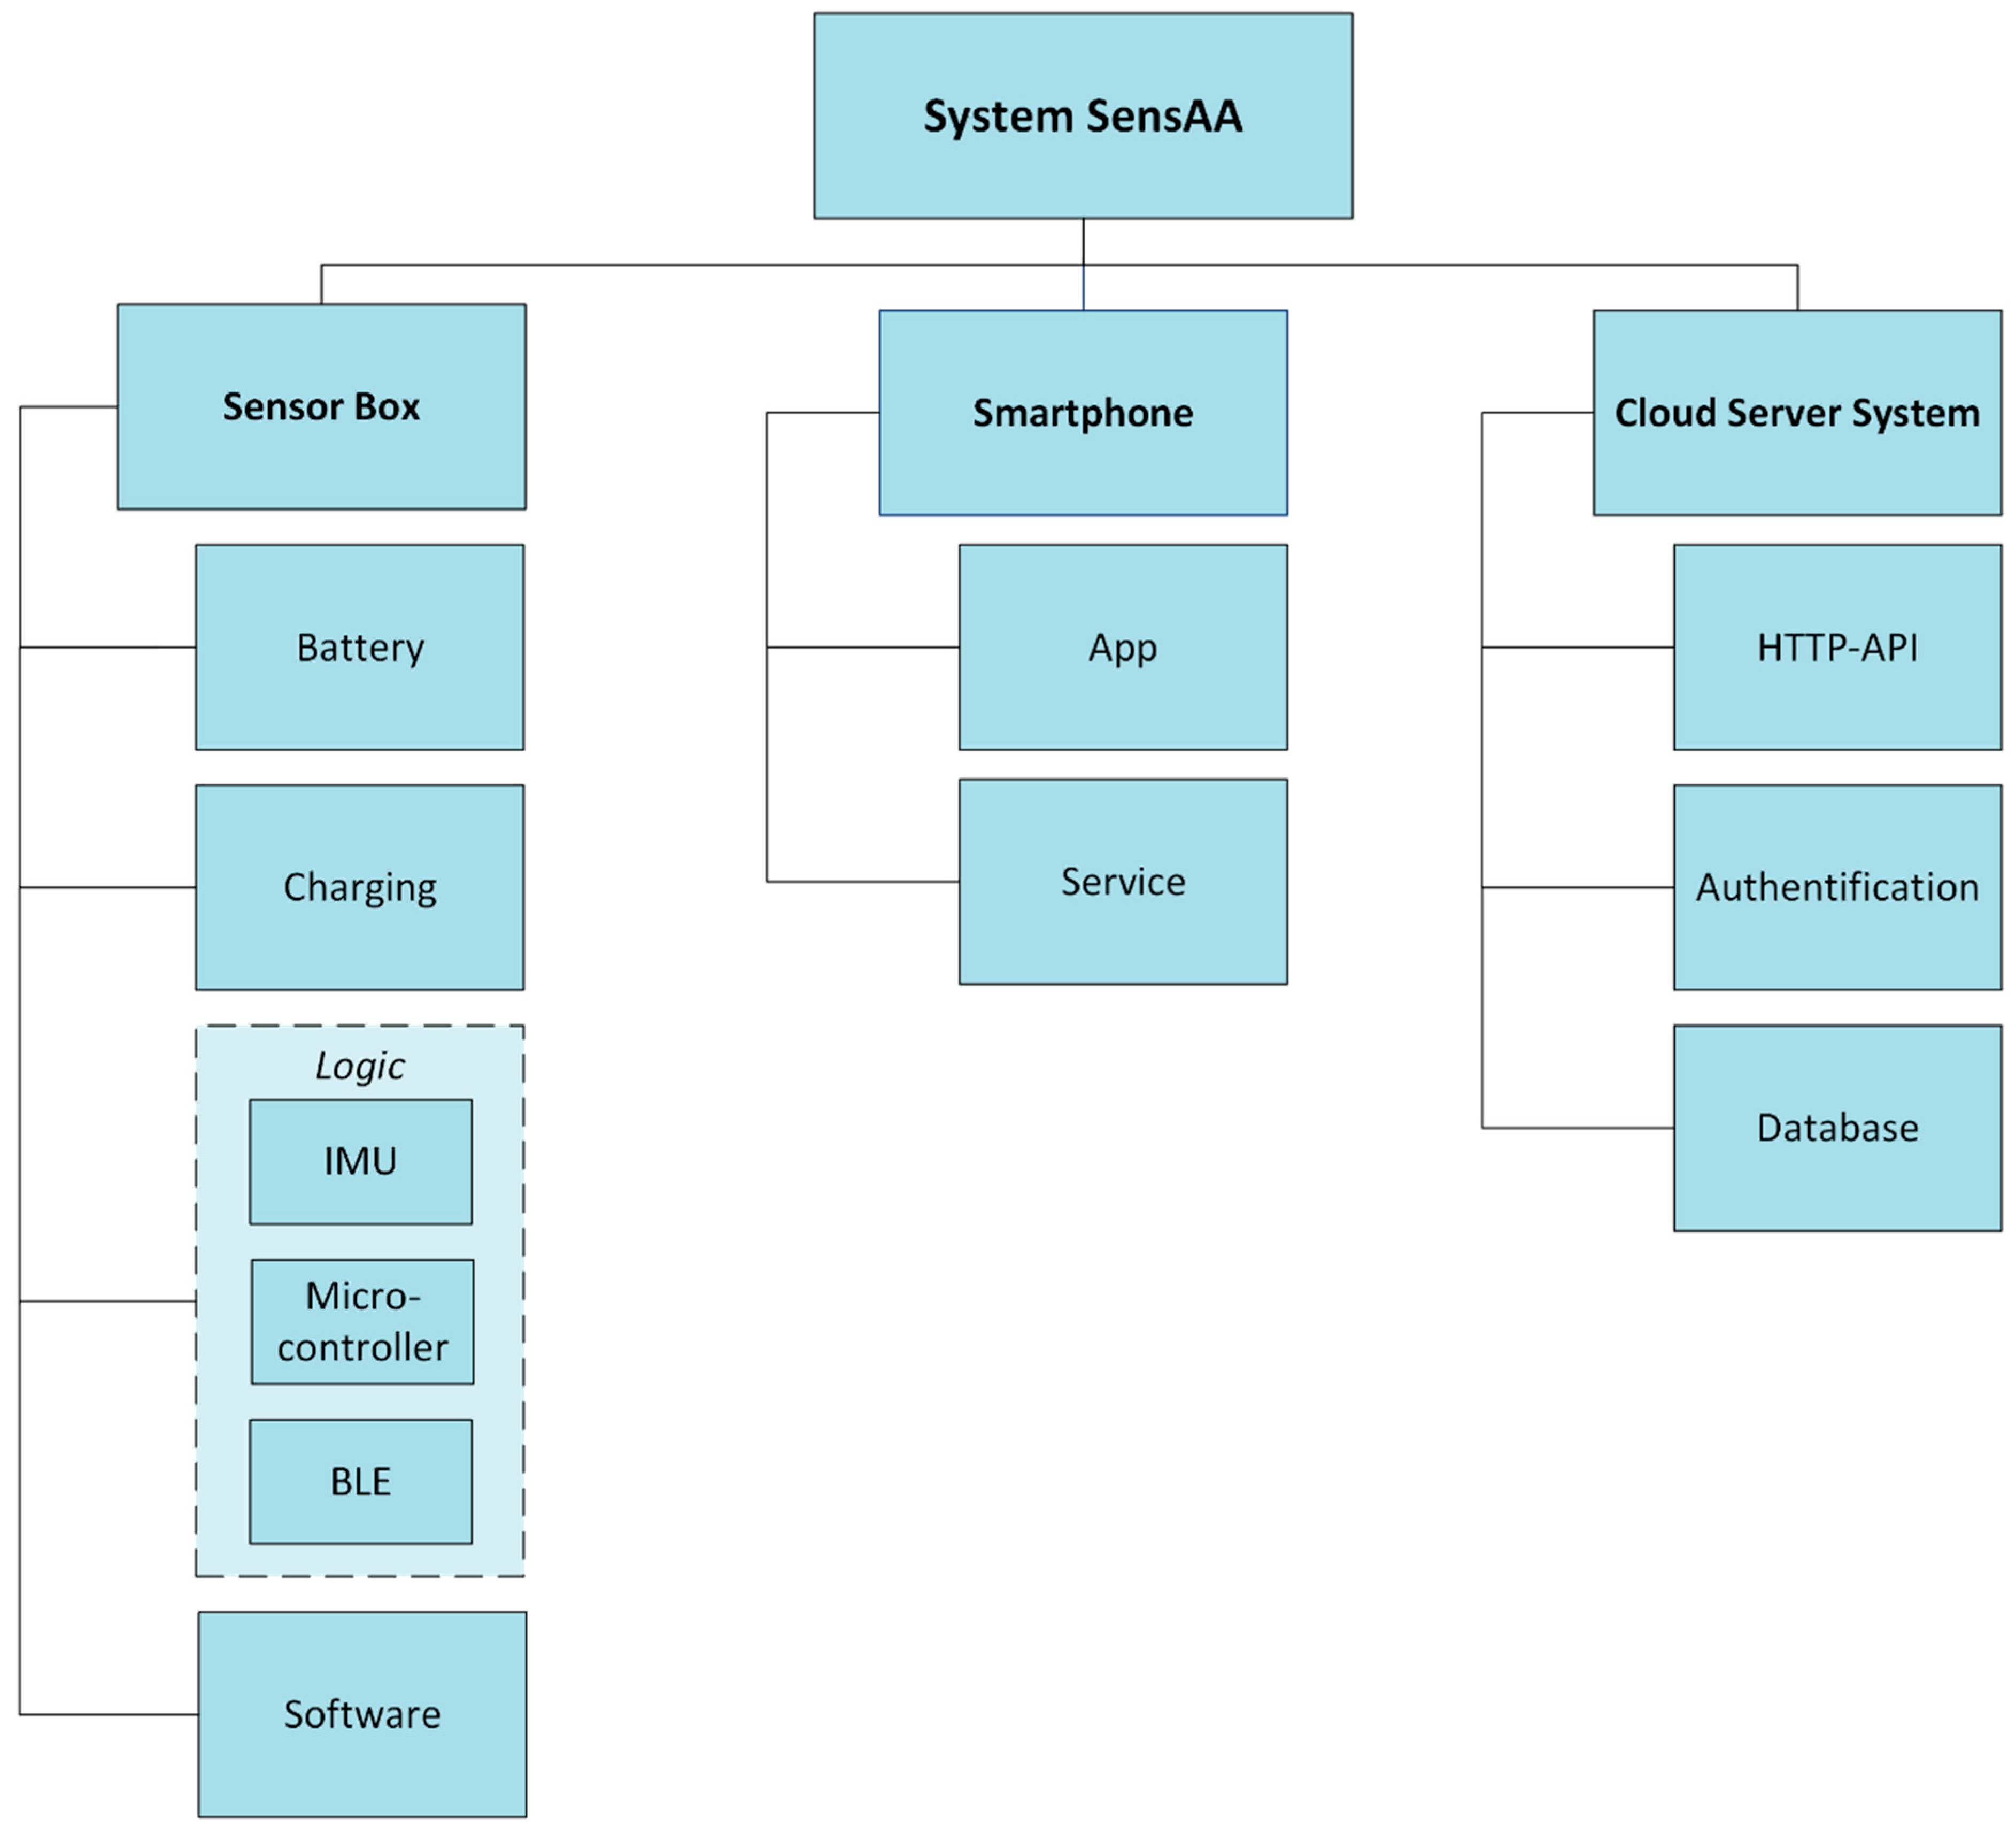
2.1. System Architecture
- Wearable Sensor Boxes
- Android Smartphone Application
- Cloud Server System
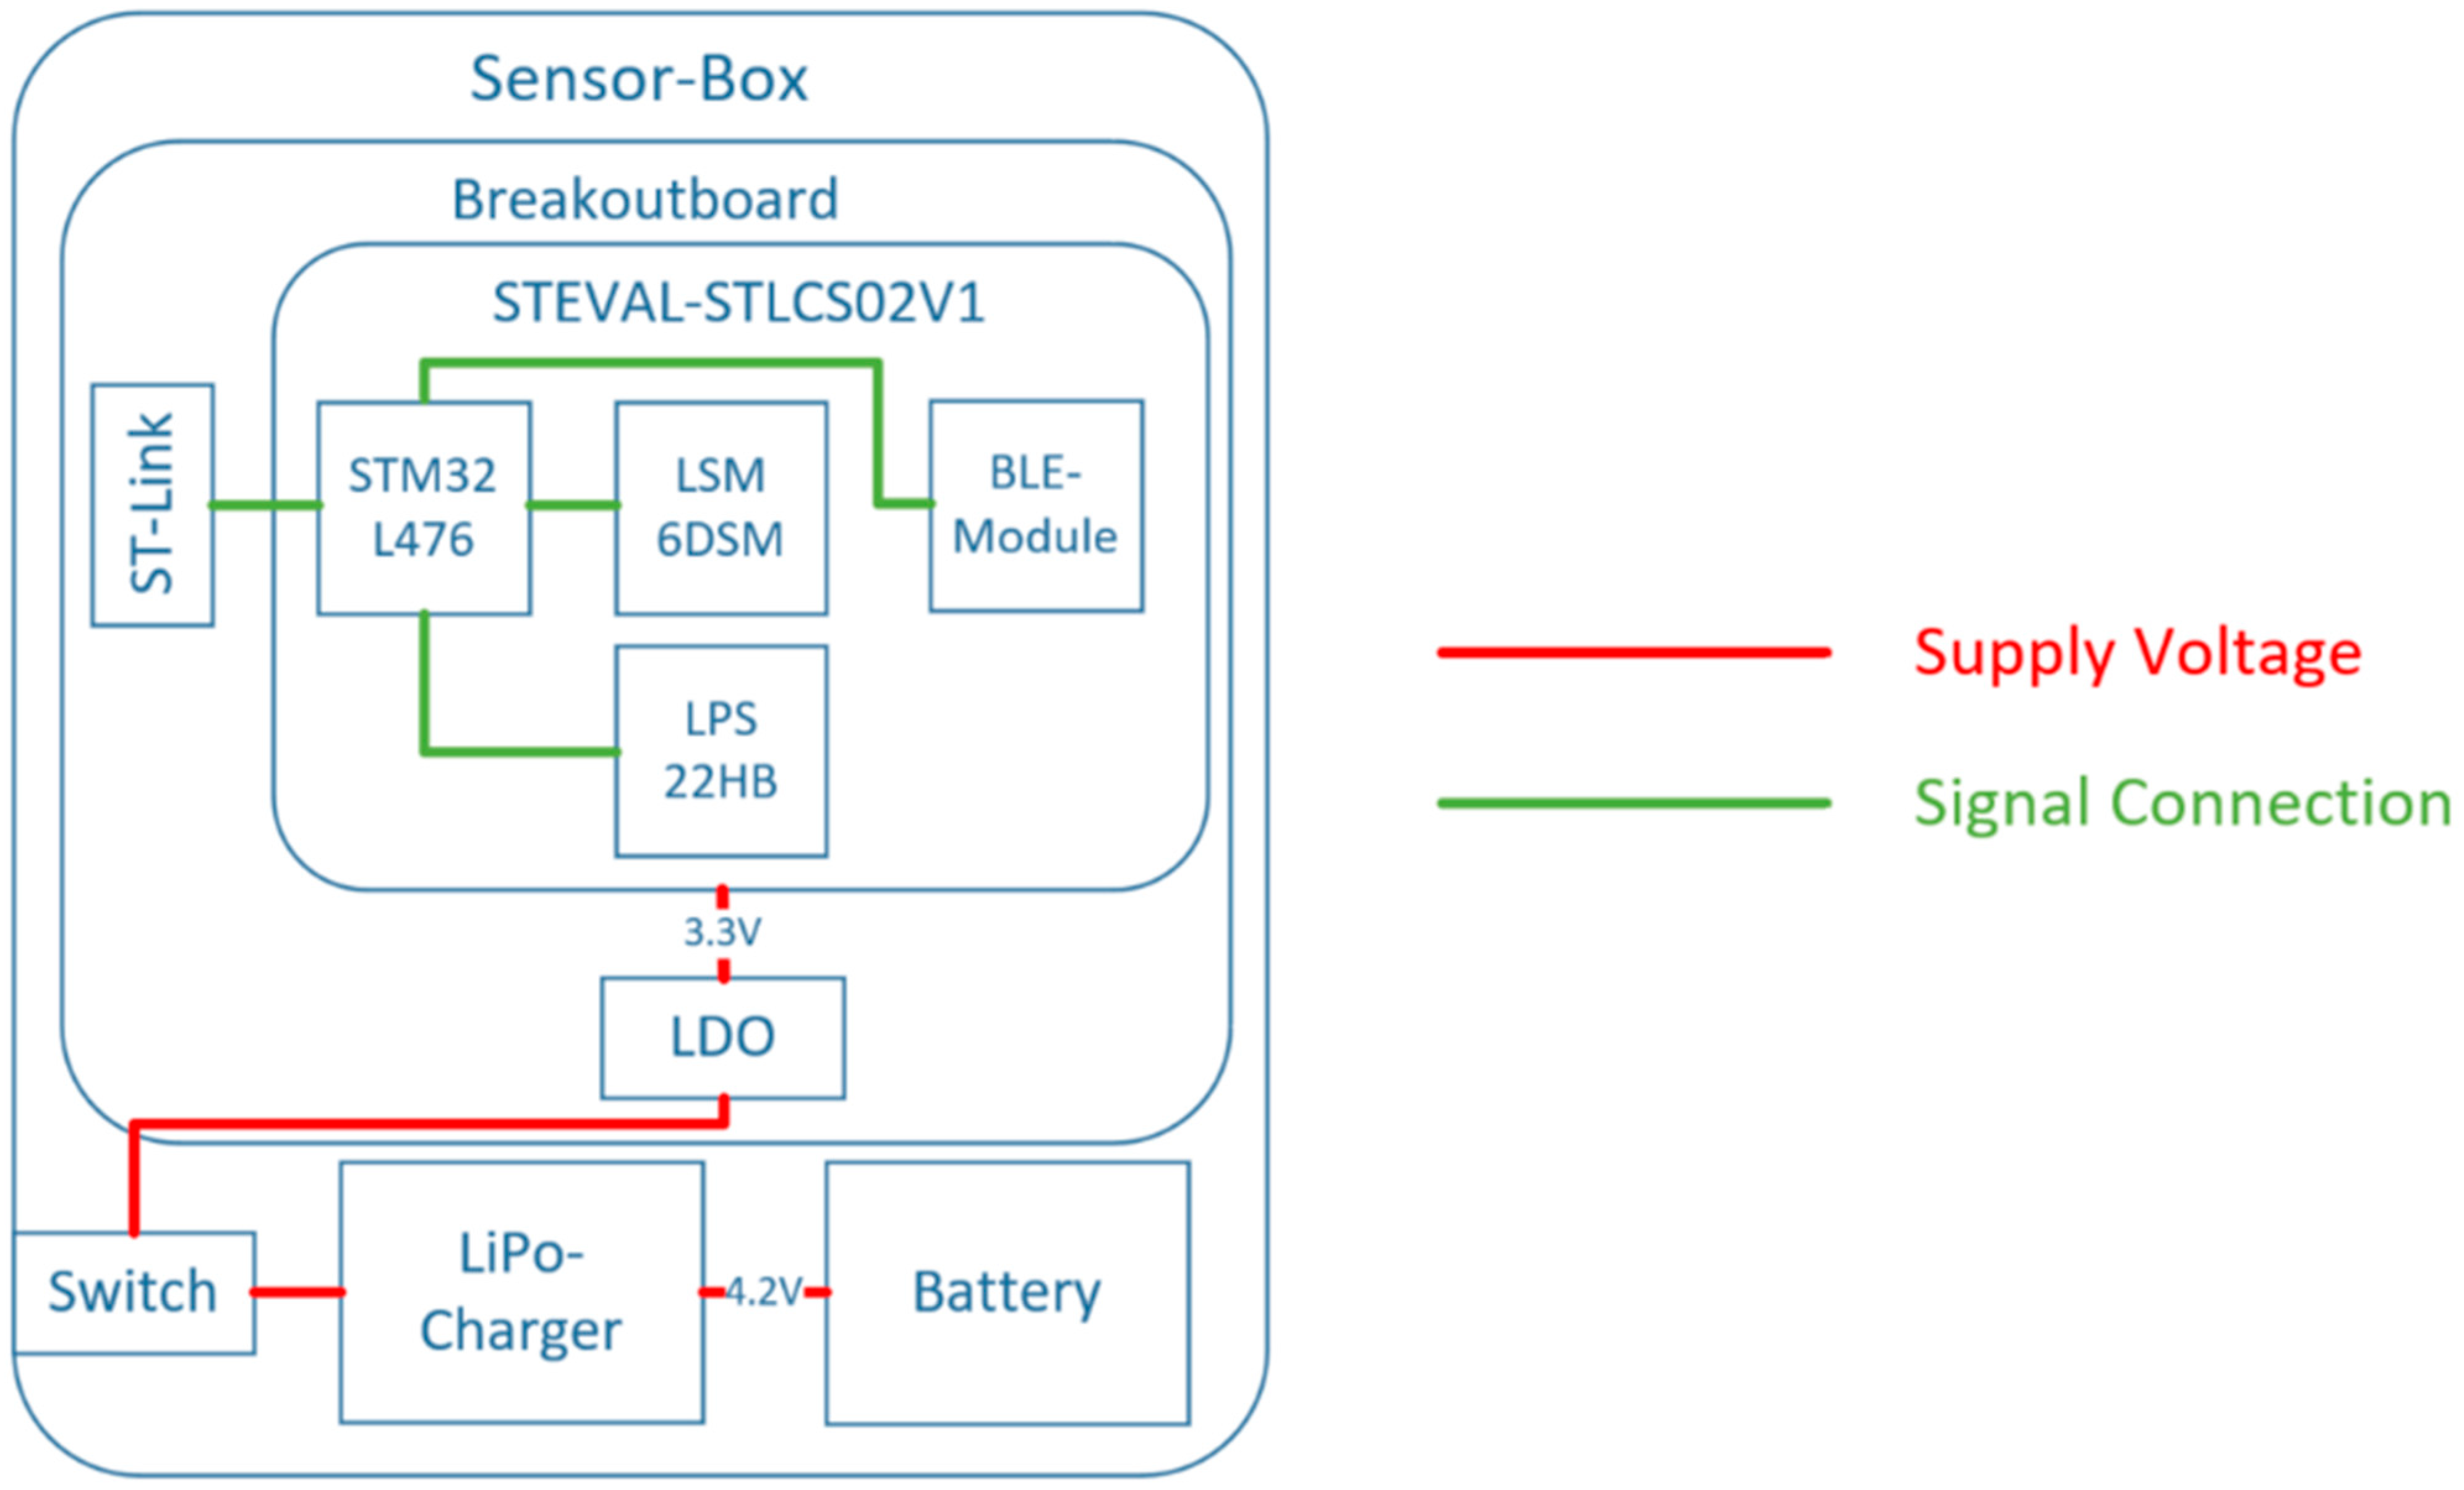
2.2. Sensor Box
2.2.1. Electronic Structure
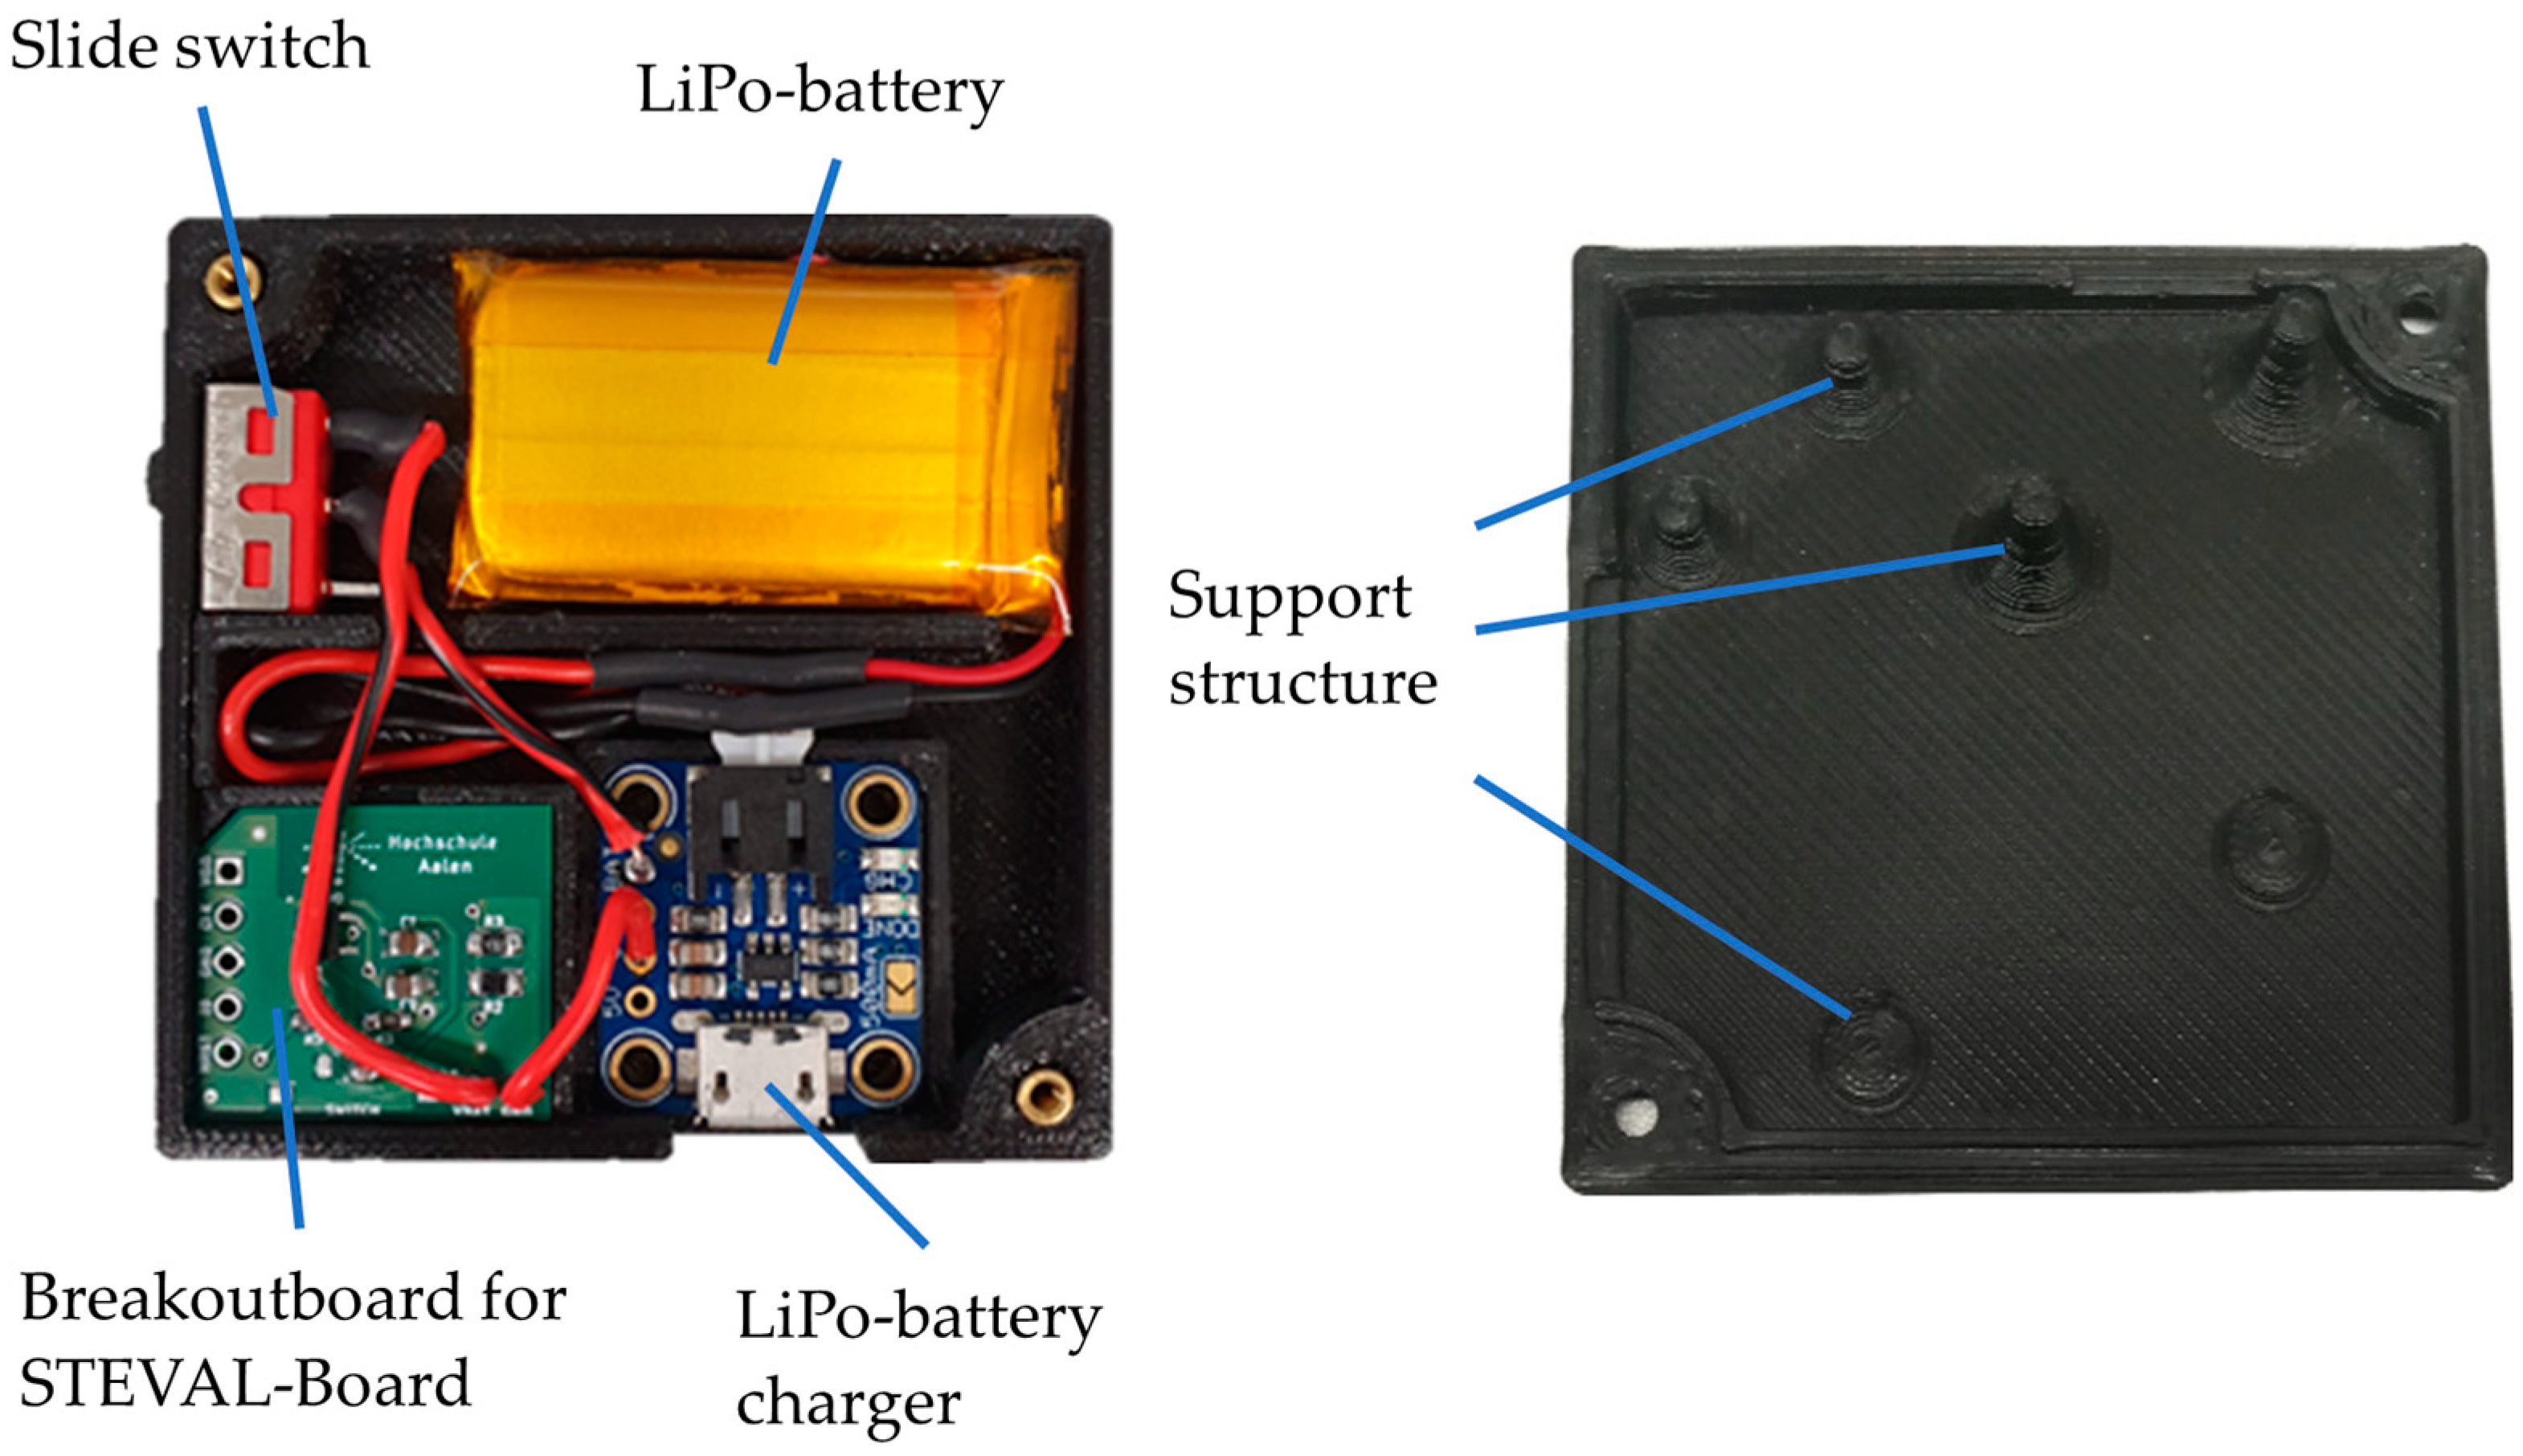
2.2.2. Mechanical Structure
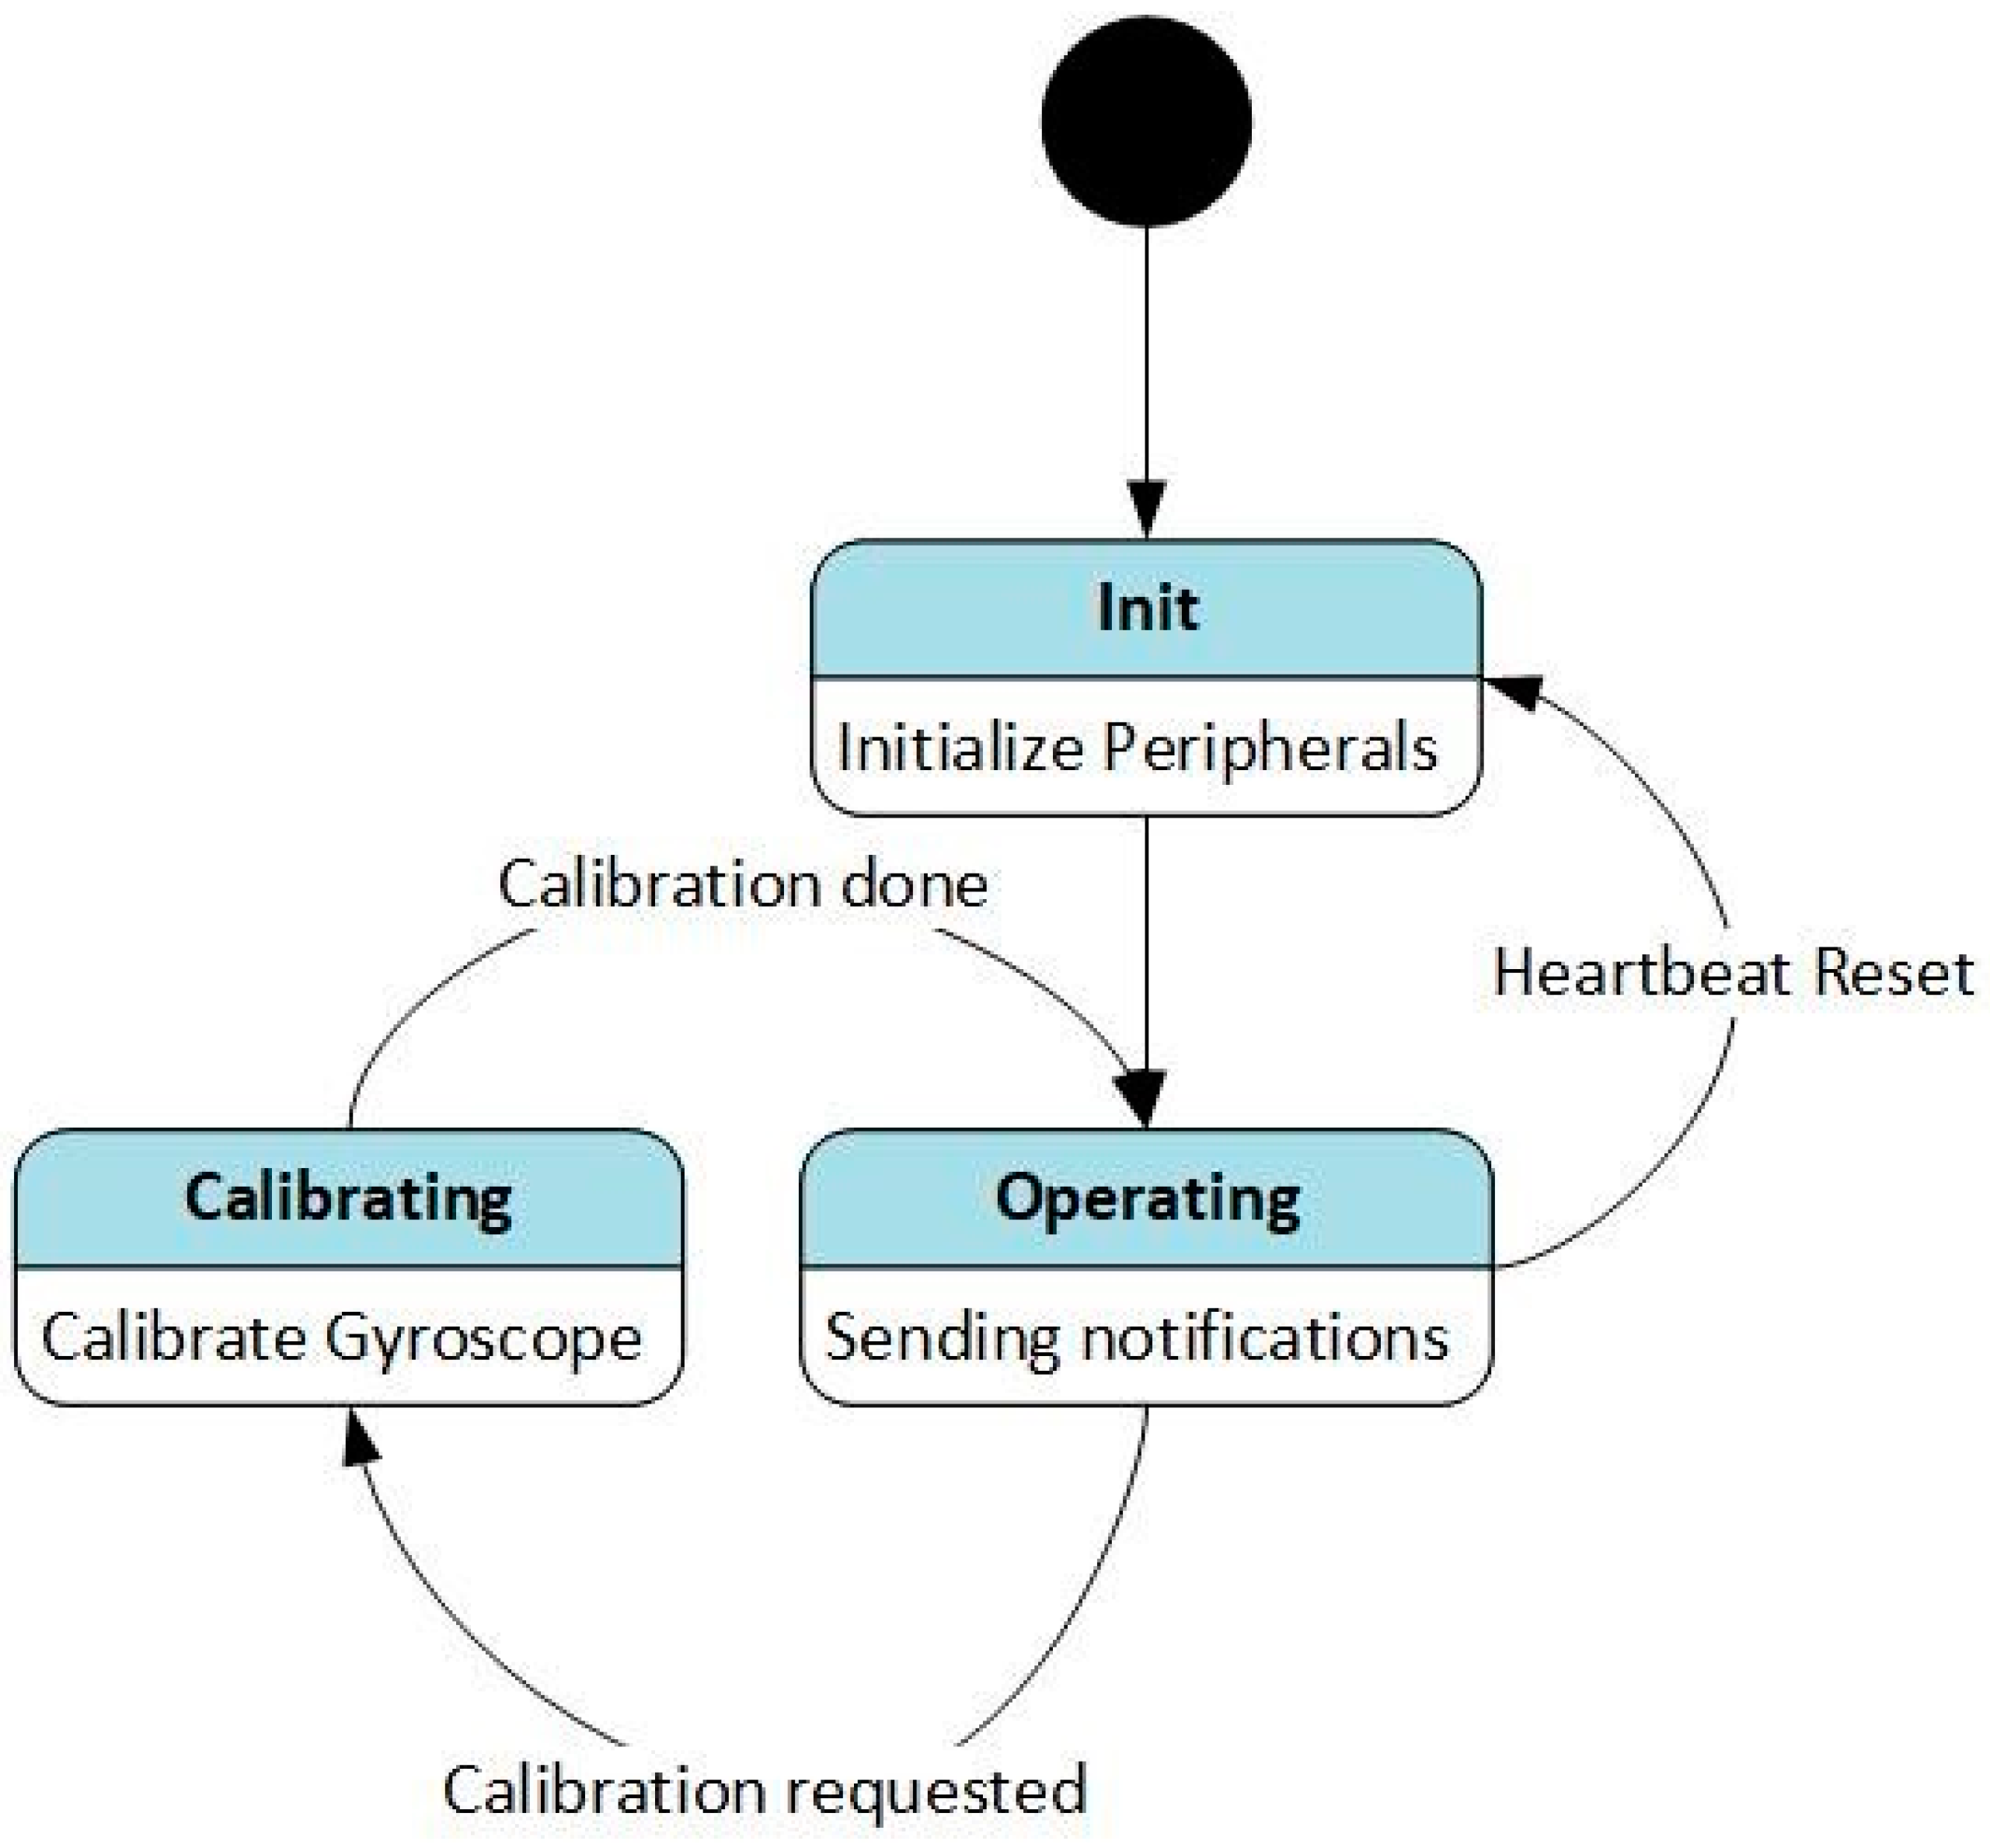
2.3. Sensor Firmware and Smartphone Application
- Reading values from the built-in accelerometer and gyroscope
- Observing the inclination of the sensors by fusing the accelerometer and gyroscope data
- Transmission of measurement data to the Android application
- The “Metric” service provides the sensor data. For each sensor data type (acceleration, angular velocity, inclination), a GATT characteristic is defined and can be subscribed by the smartphone app. Furthermore, a GATT descriptor is added to each characteristic, describing the scale and unit of the provided metrics. Using the descriptor, the full scale of the device can be reconfigured, without reprogramming the scaling in the smartphone application.
- The “Version” service provides the firmware version running on the sensor. It features two characteristics, one for reading the major and minor version numbers and one for the exact build revision.
- The “Control” service is used to imperatively trigger different processes in the sensor firmware. Each characteristic of the service is assigned to an action in the sensor firmware. For now, it is only used to initiate the self-calibration function.
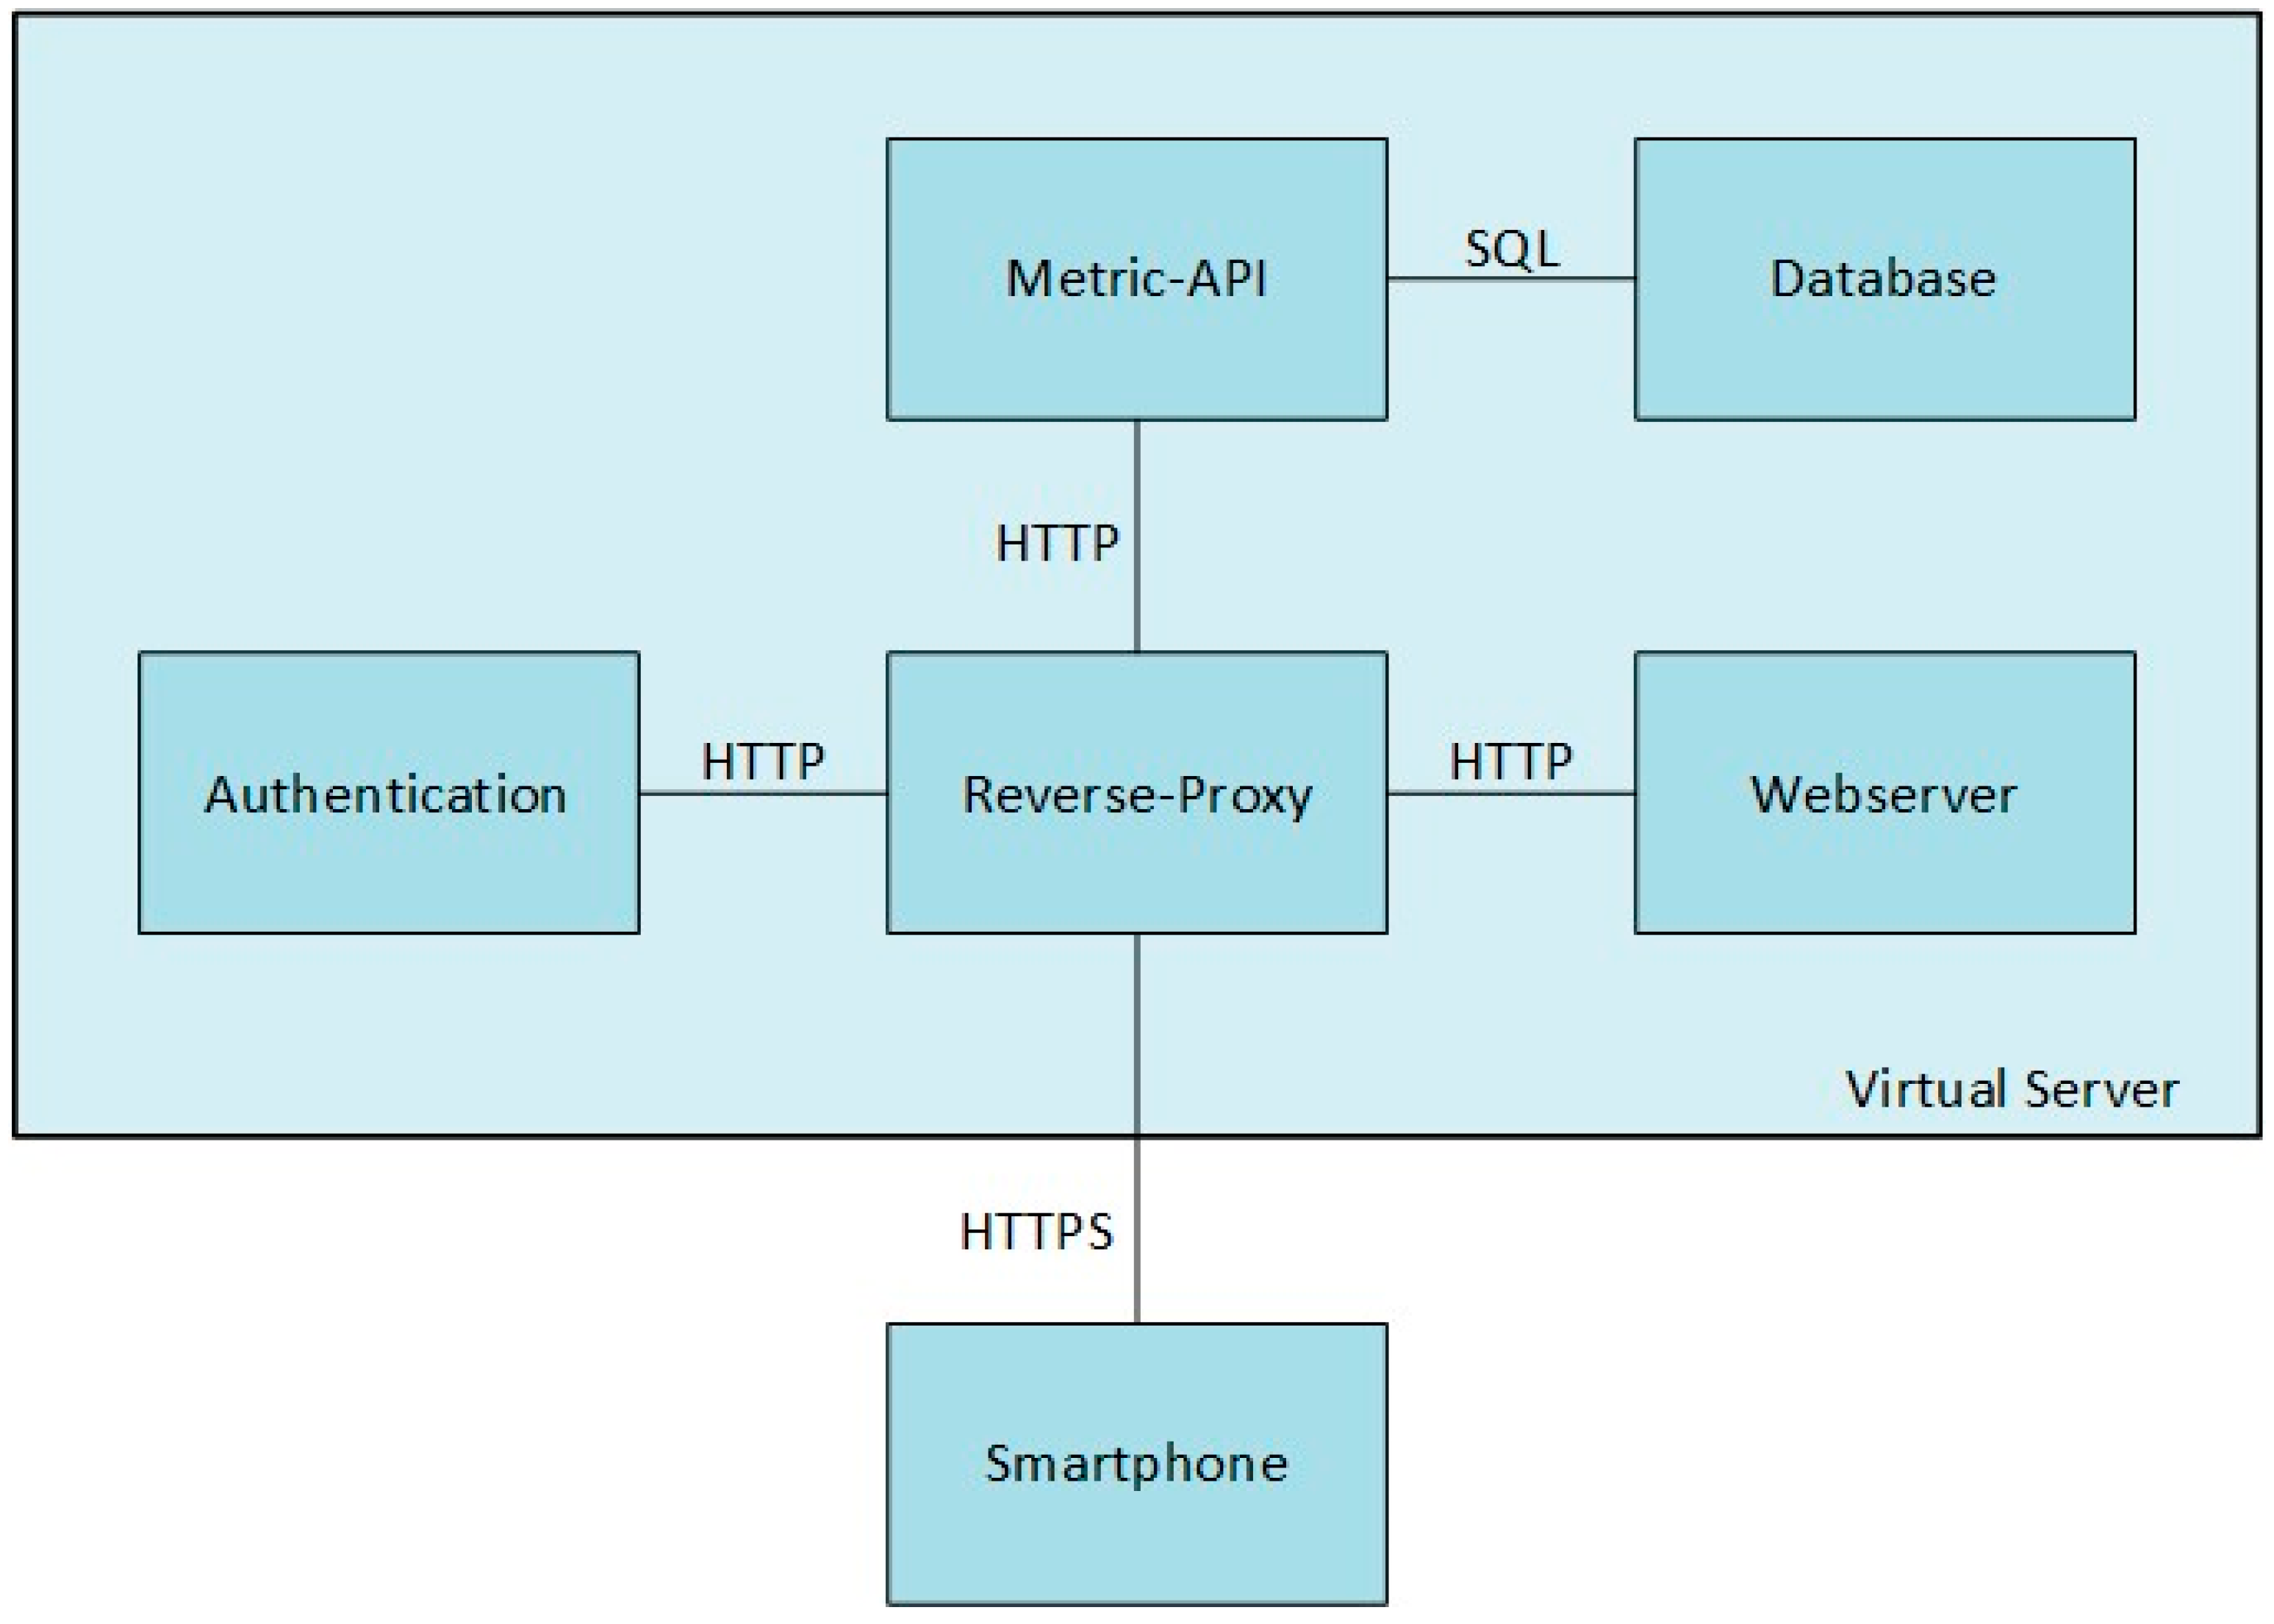
2.4. Cloud Server System
2.5. Verification
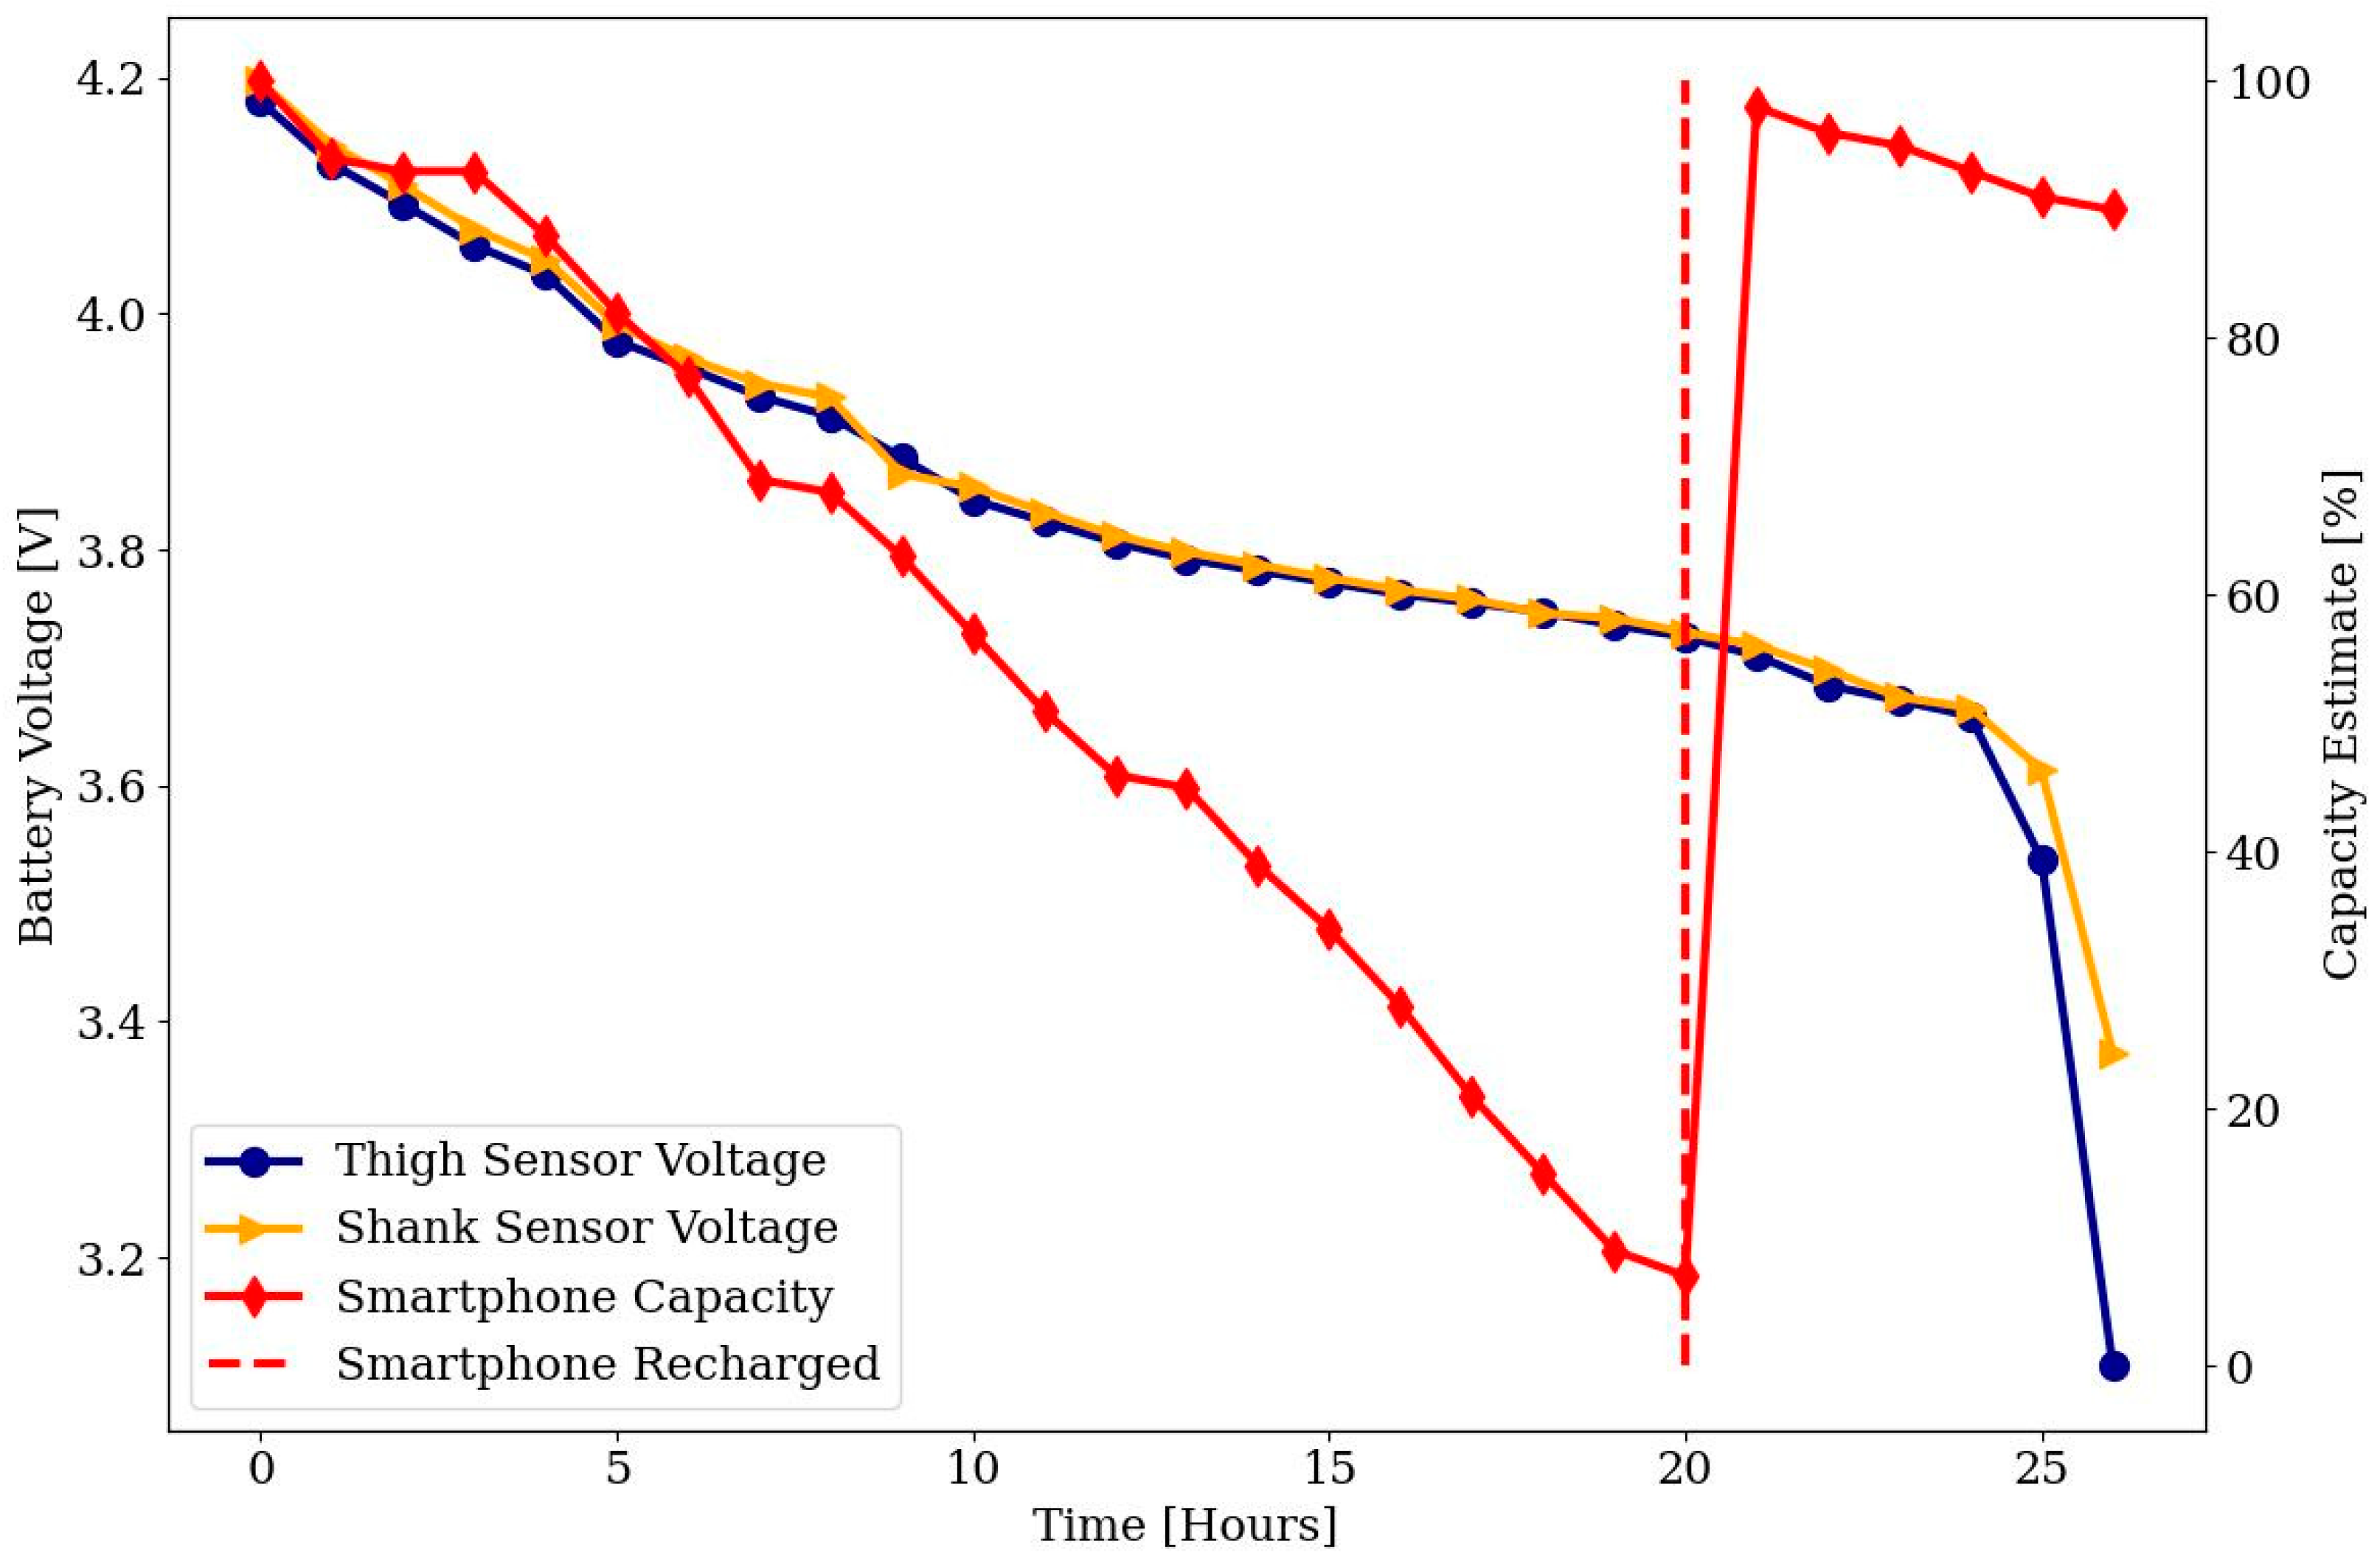
2.5.1. Battery Life Test
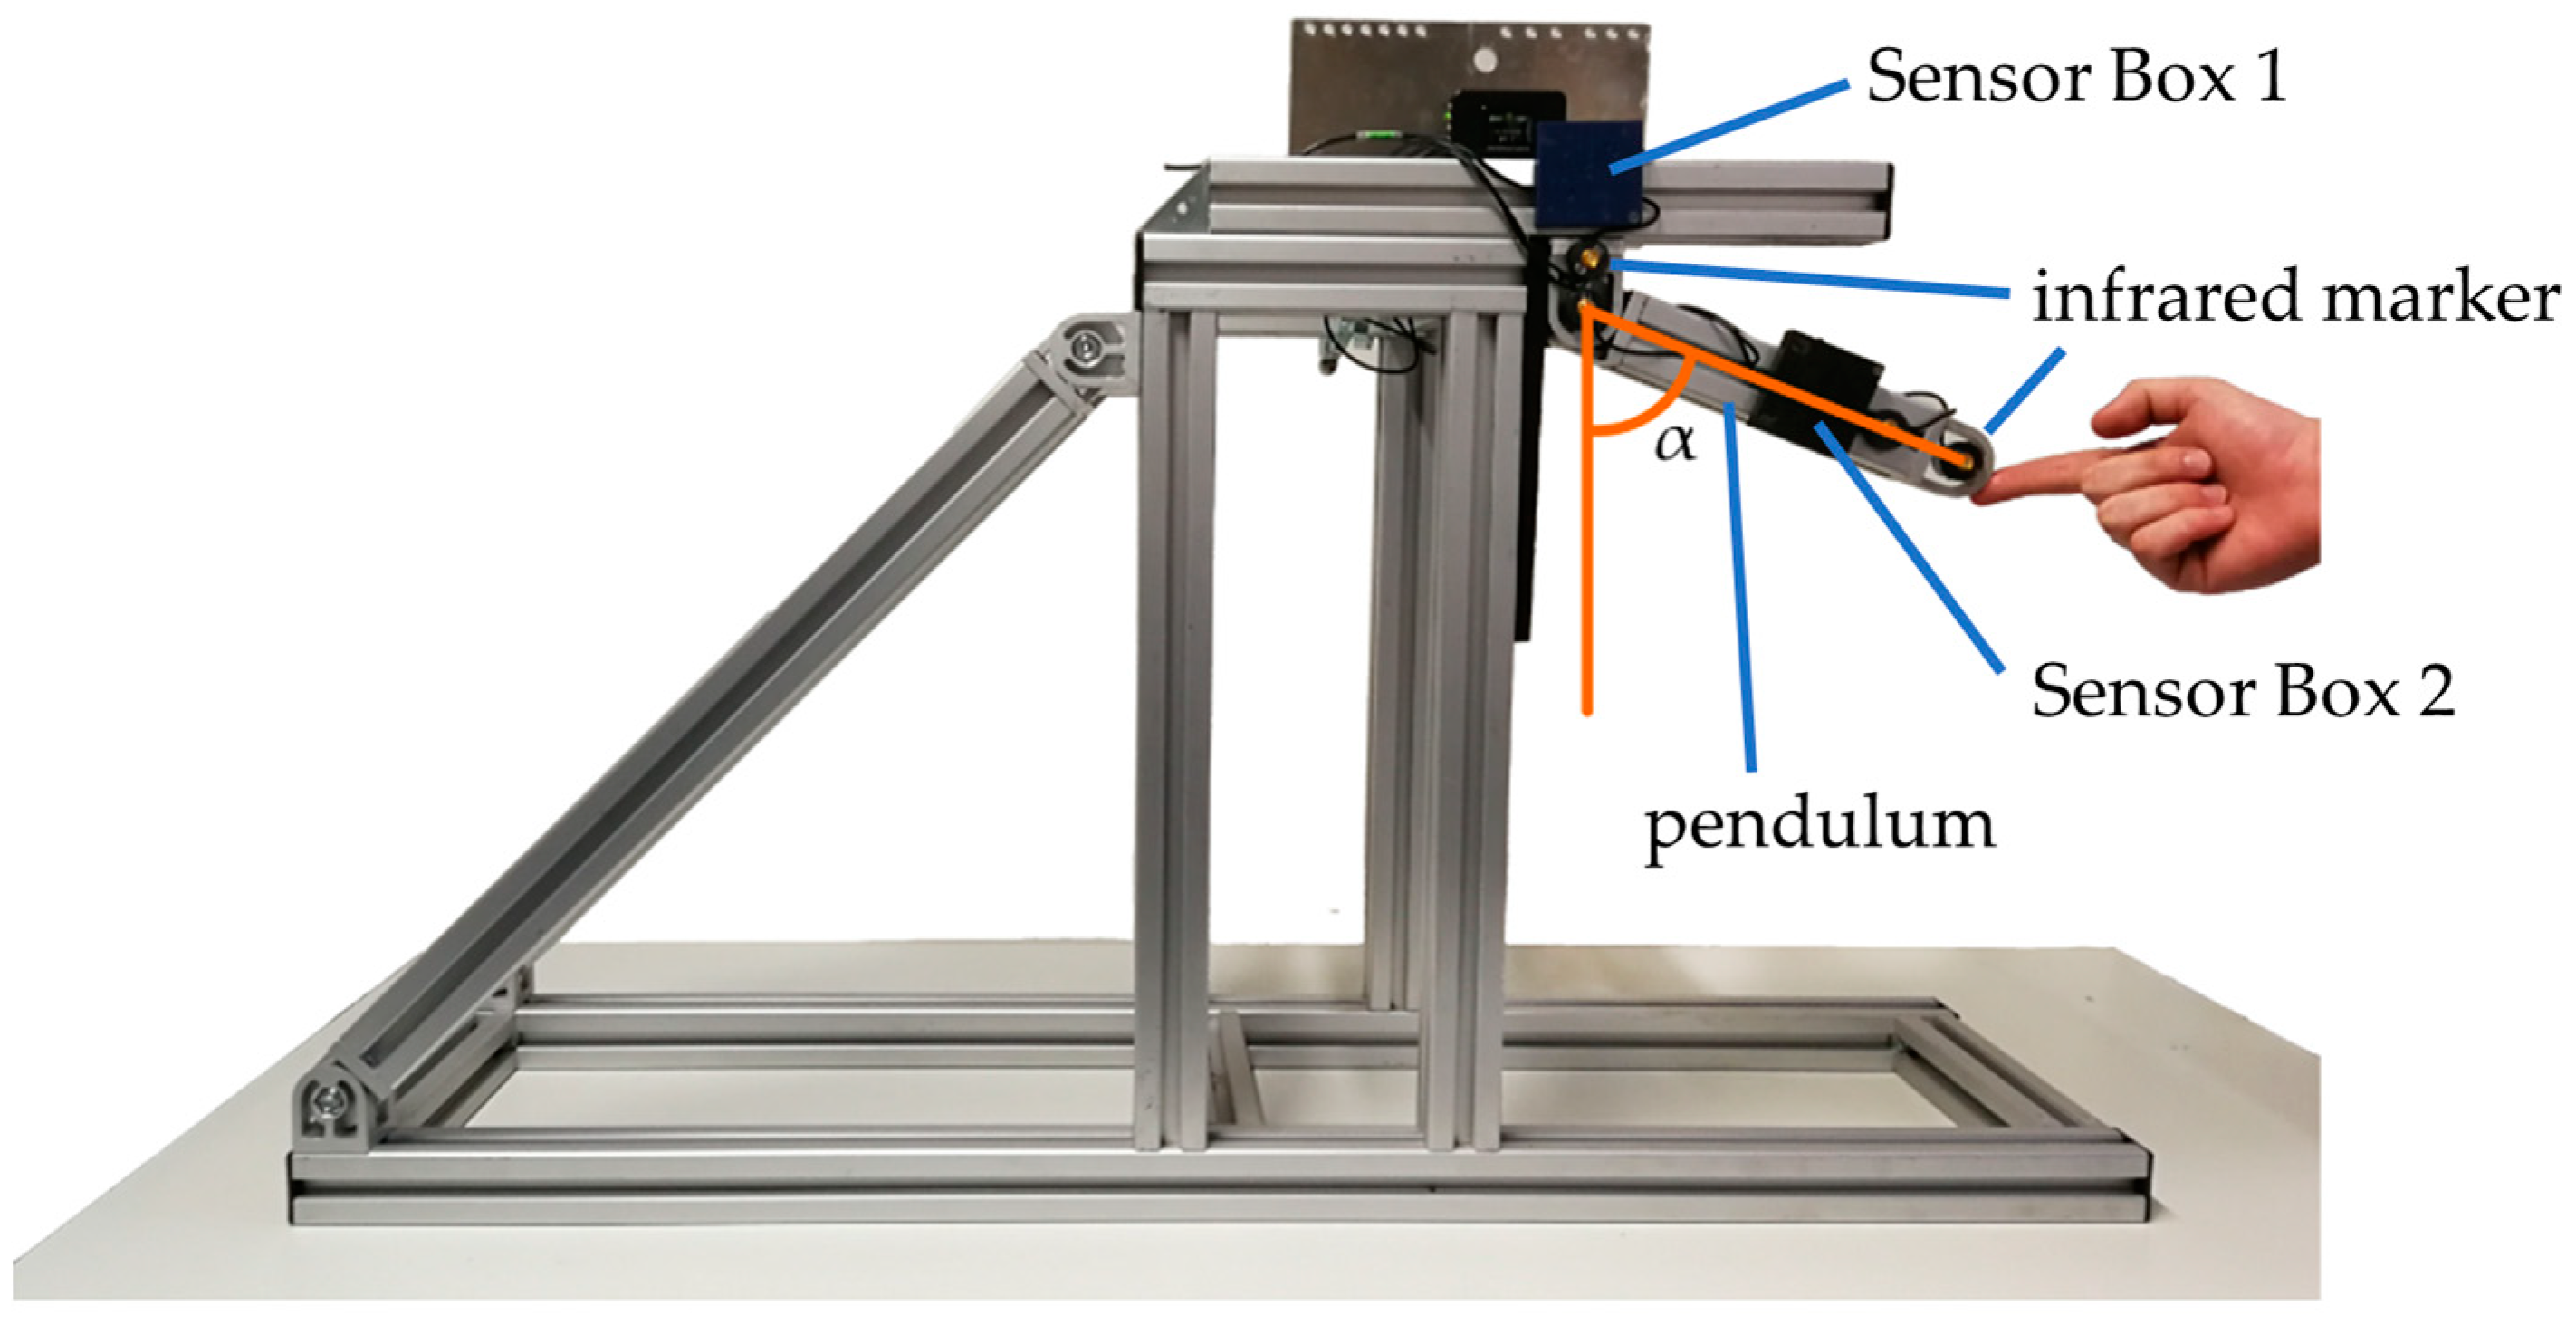
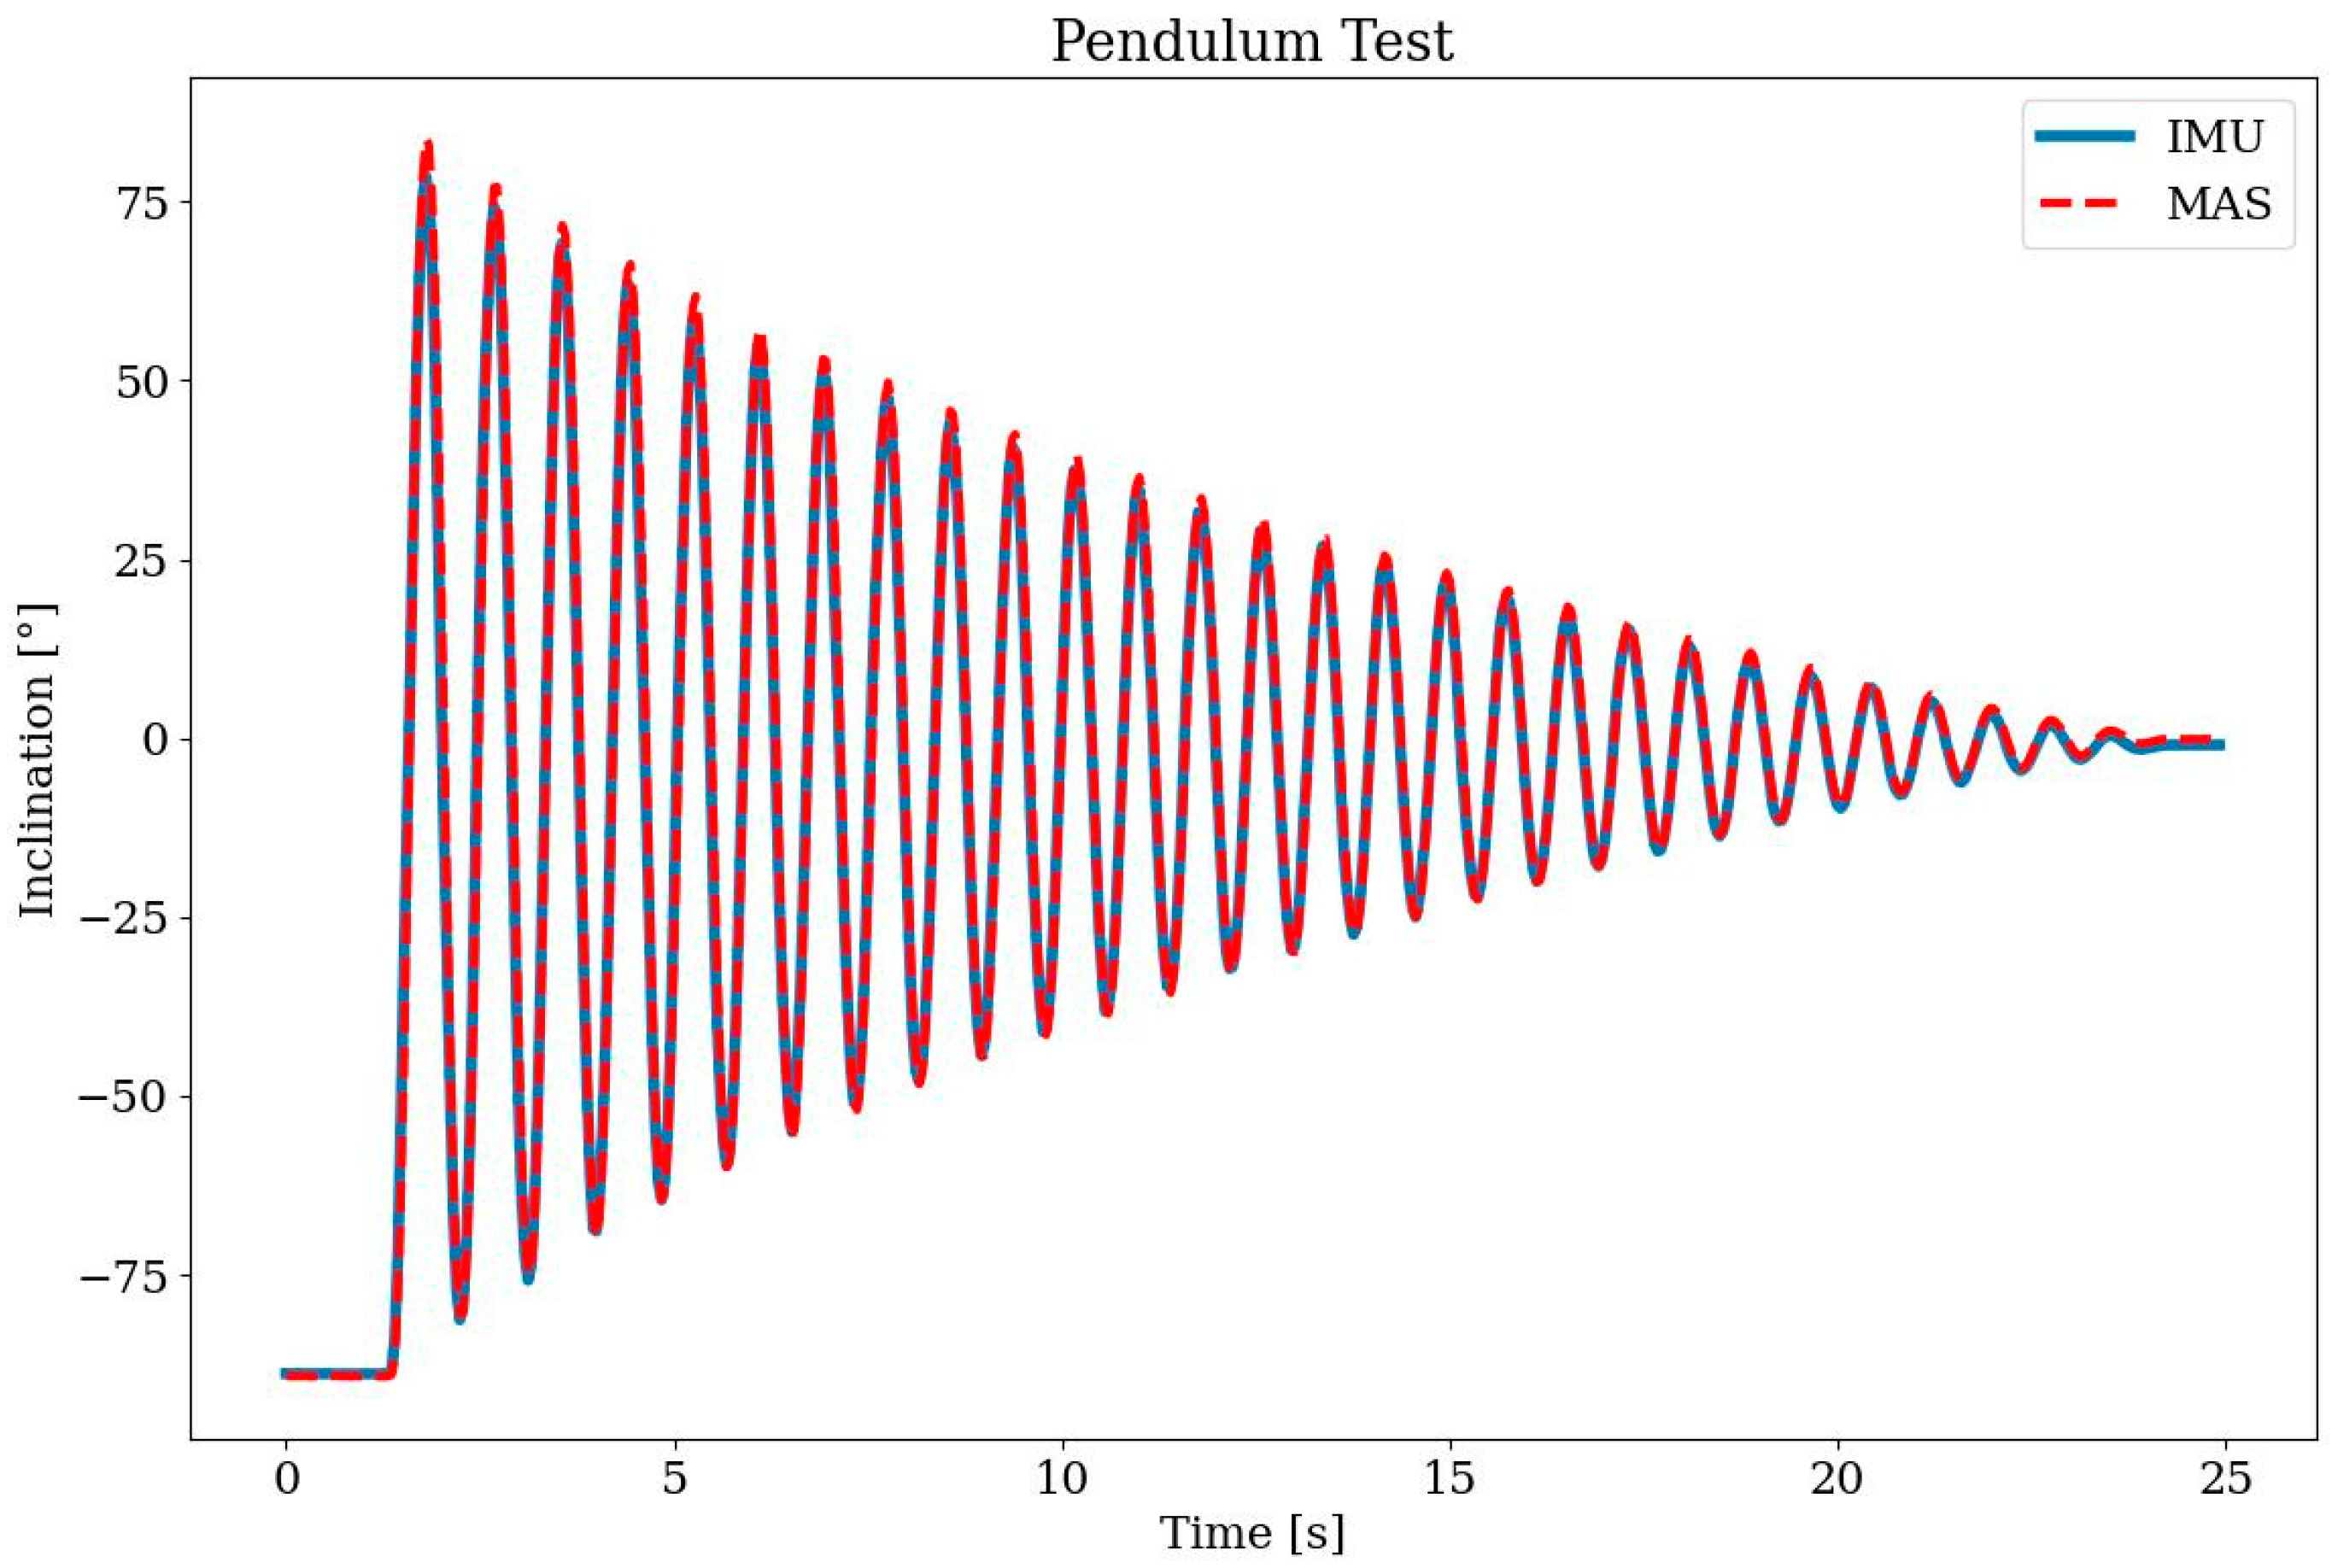
2.5.2. Pendulum Test
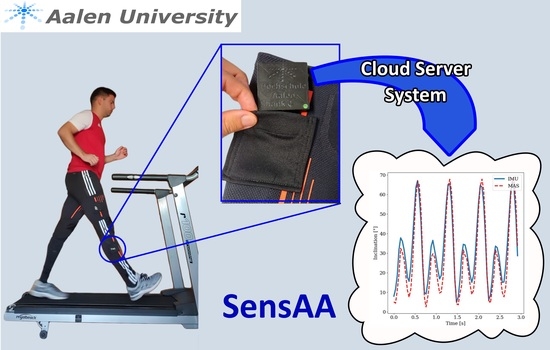
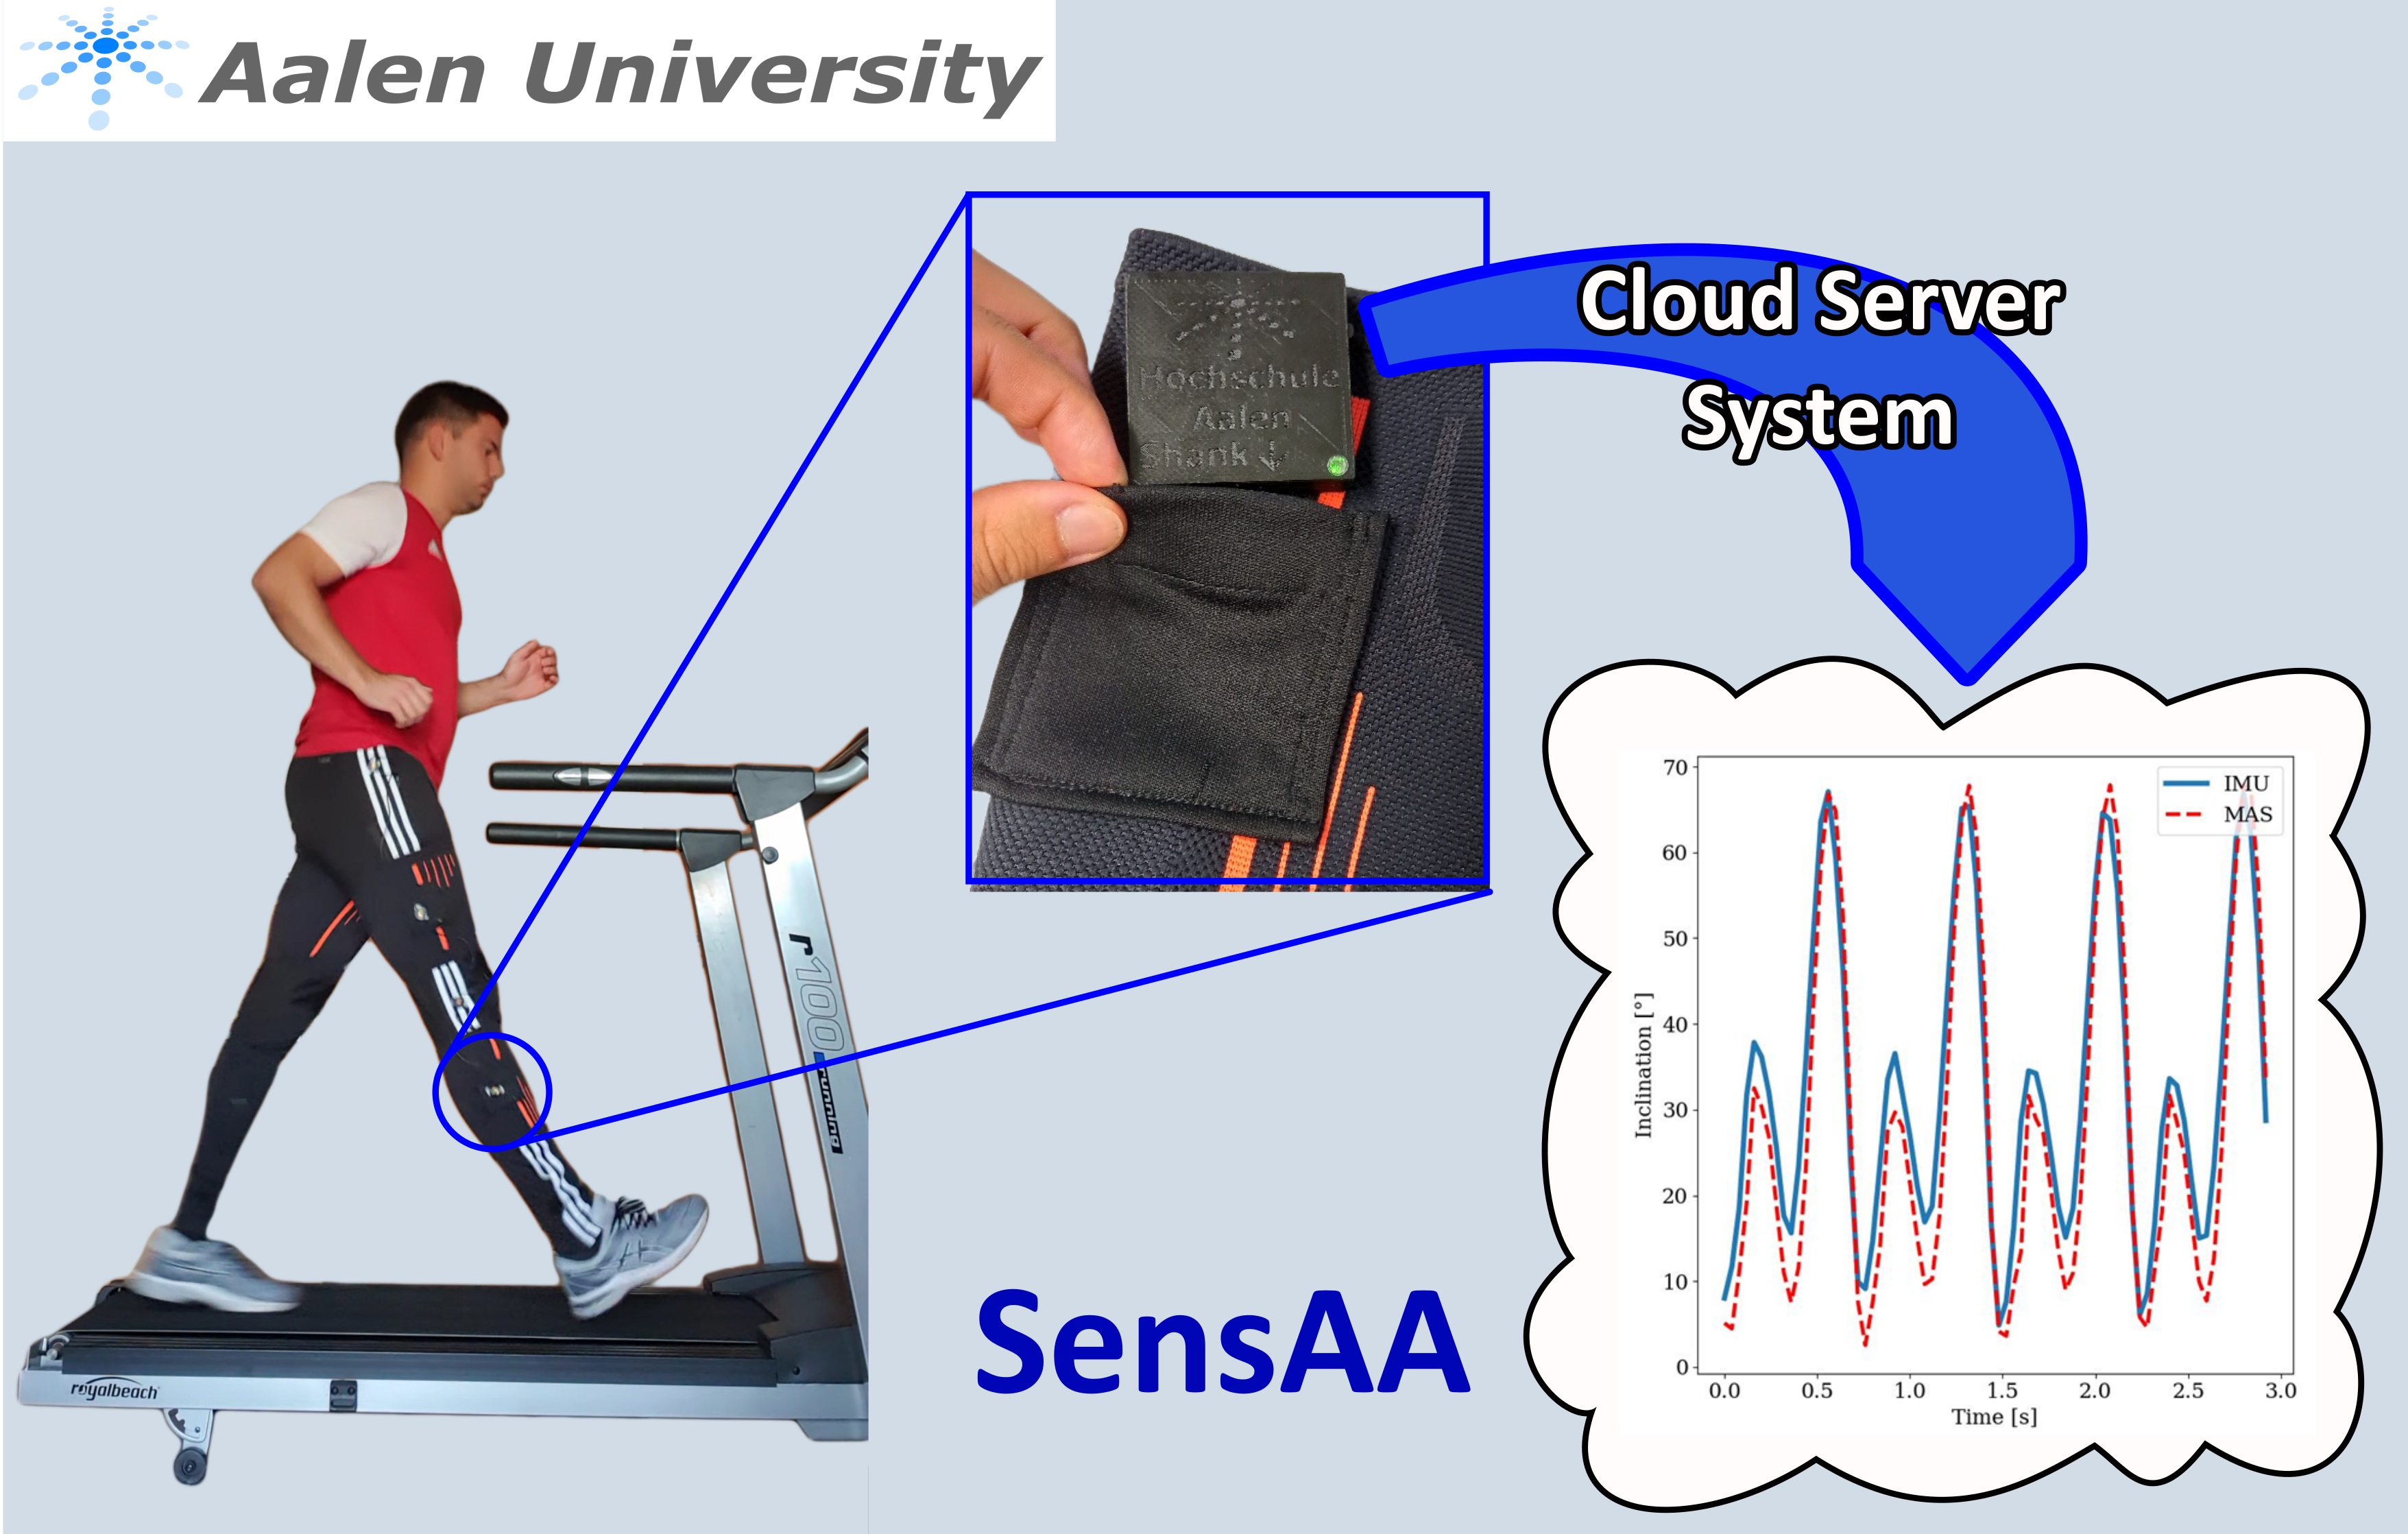
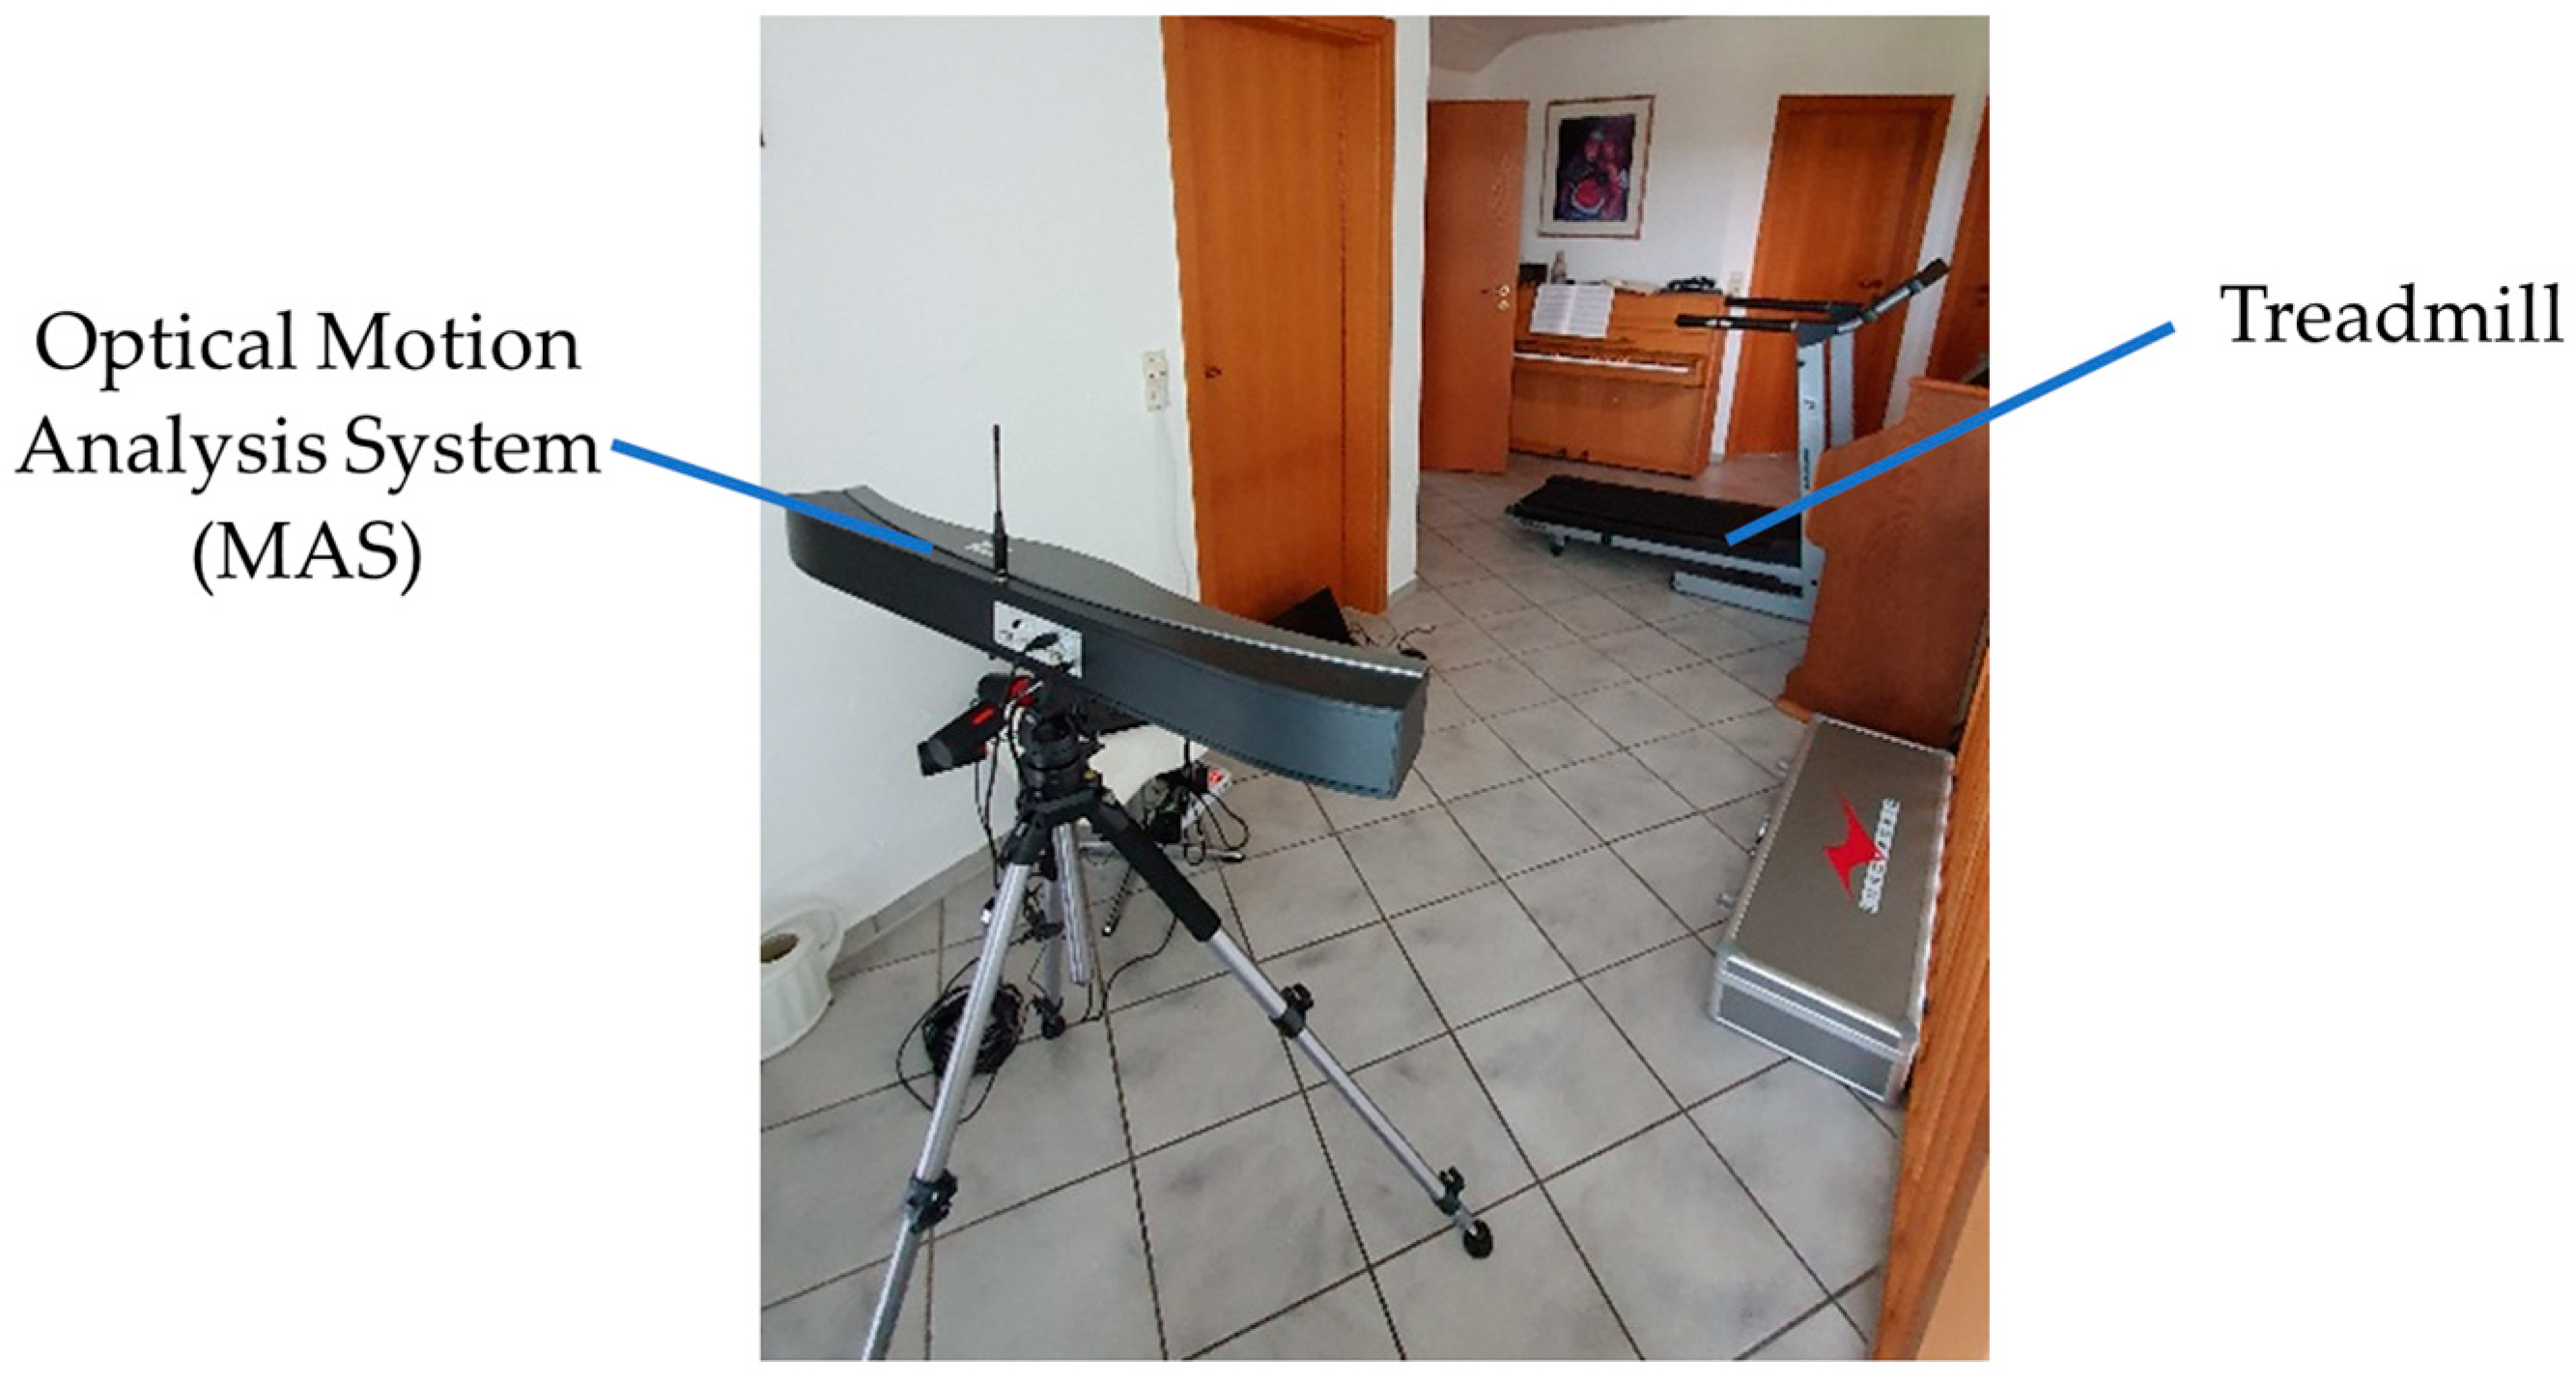
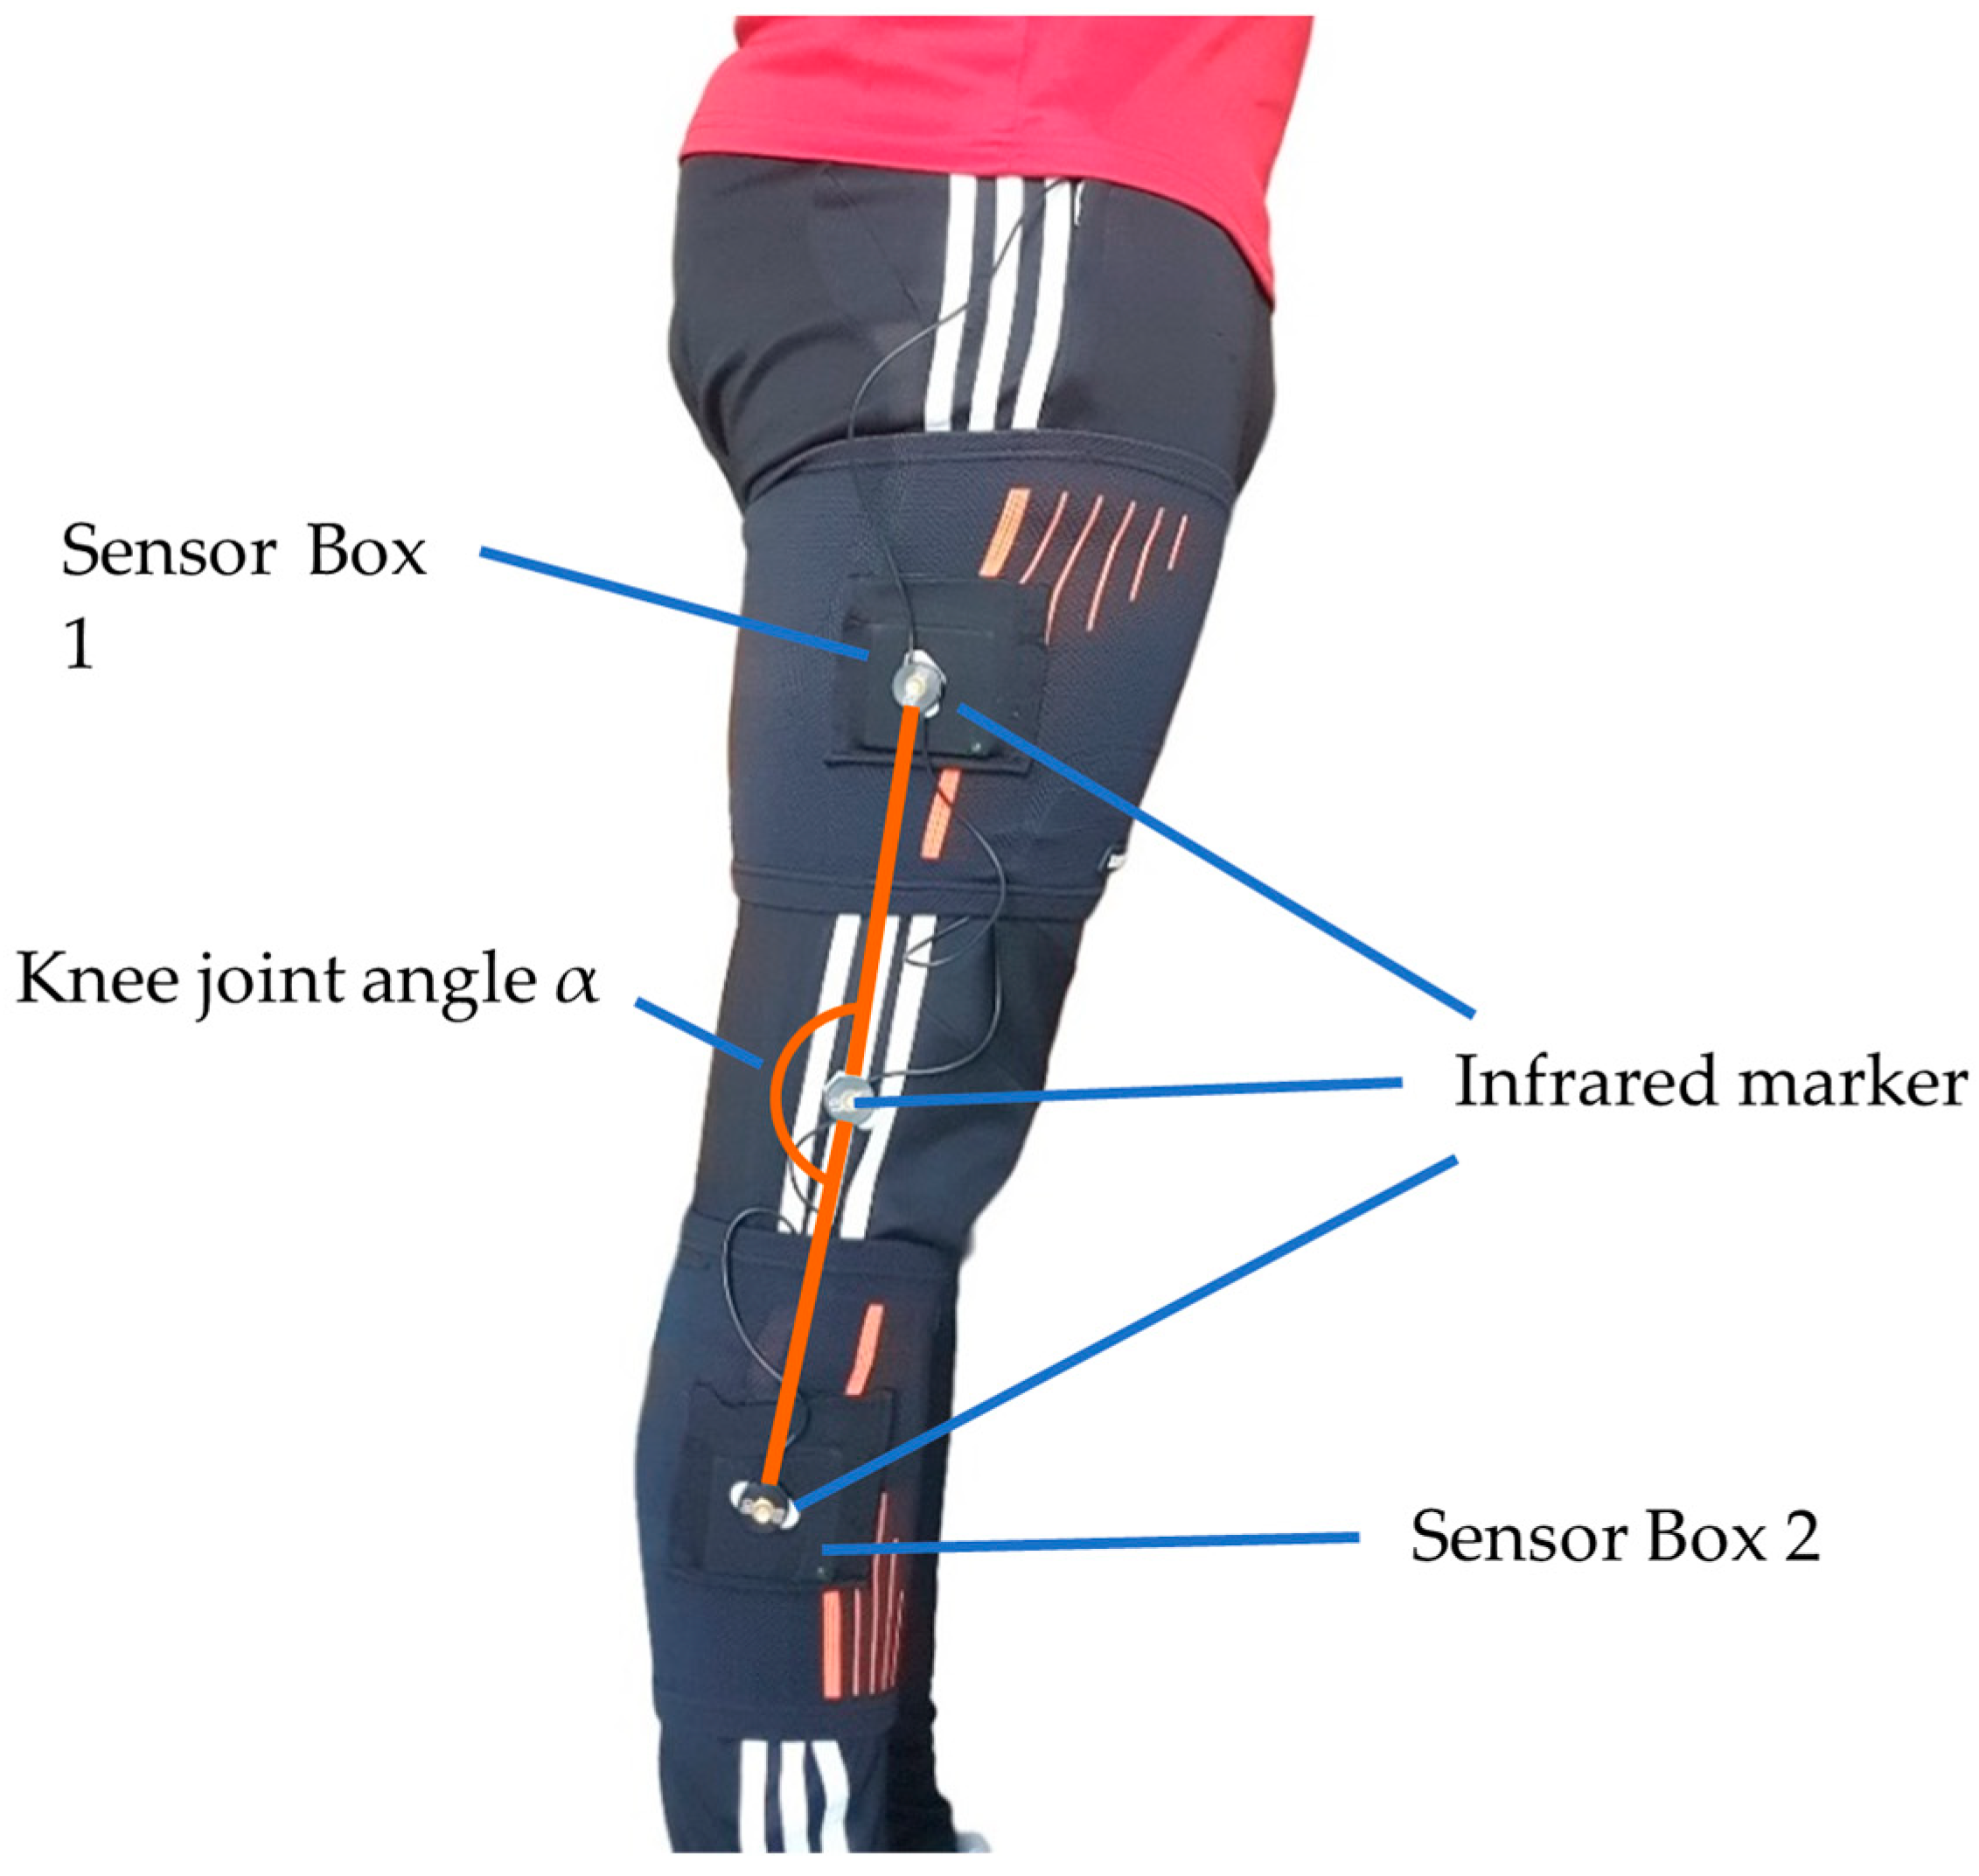
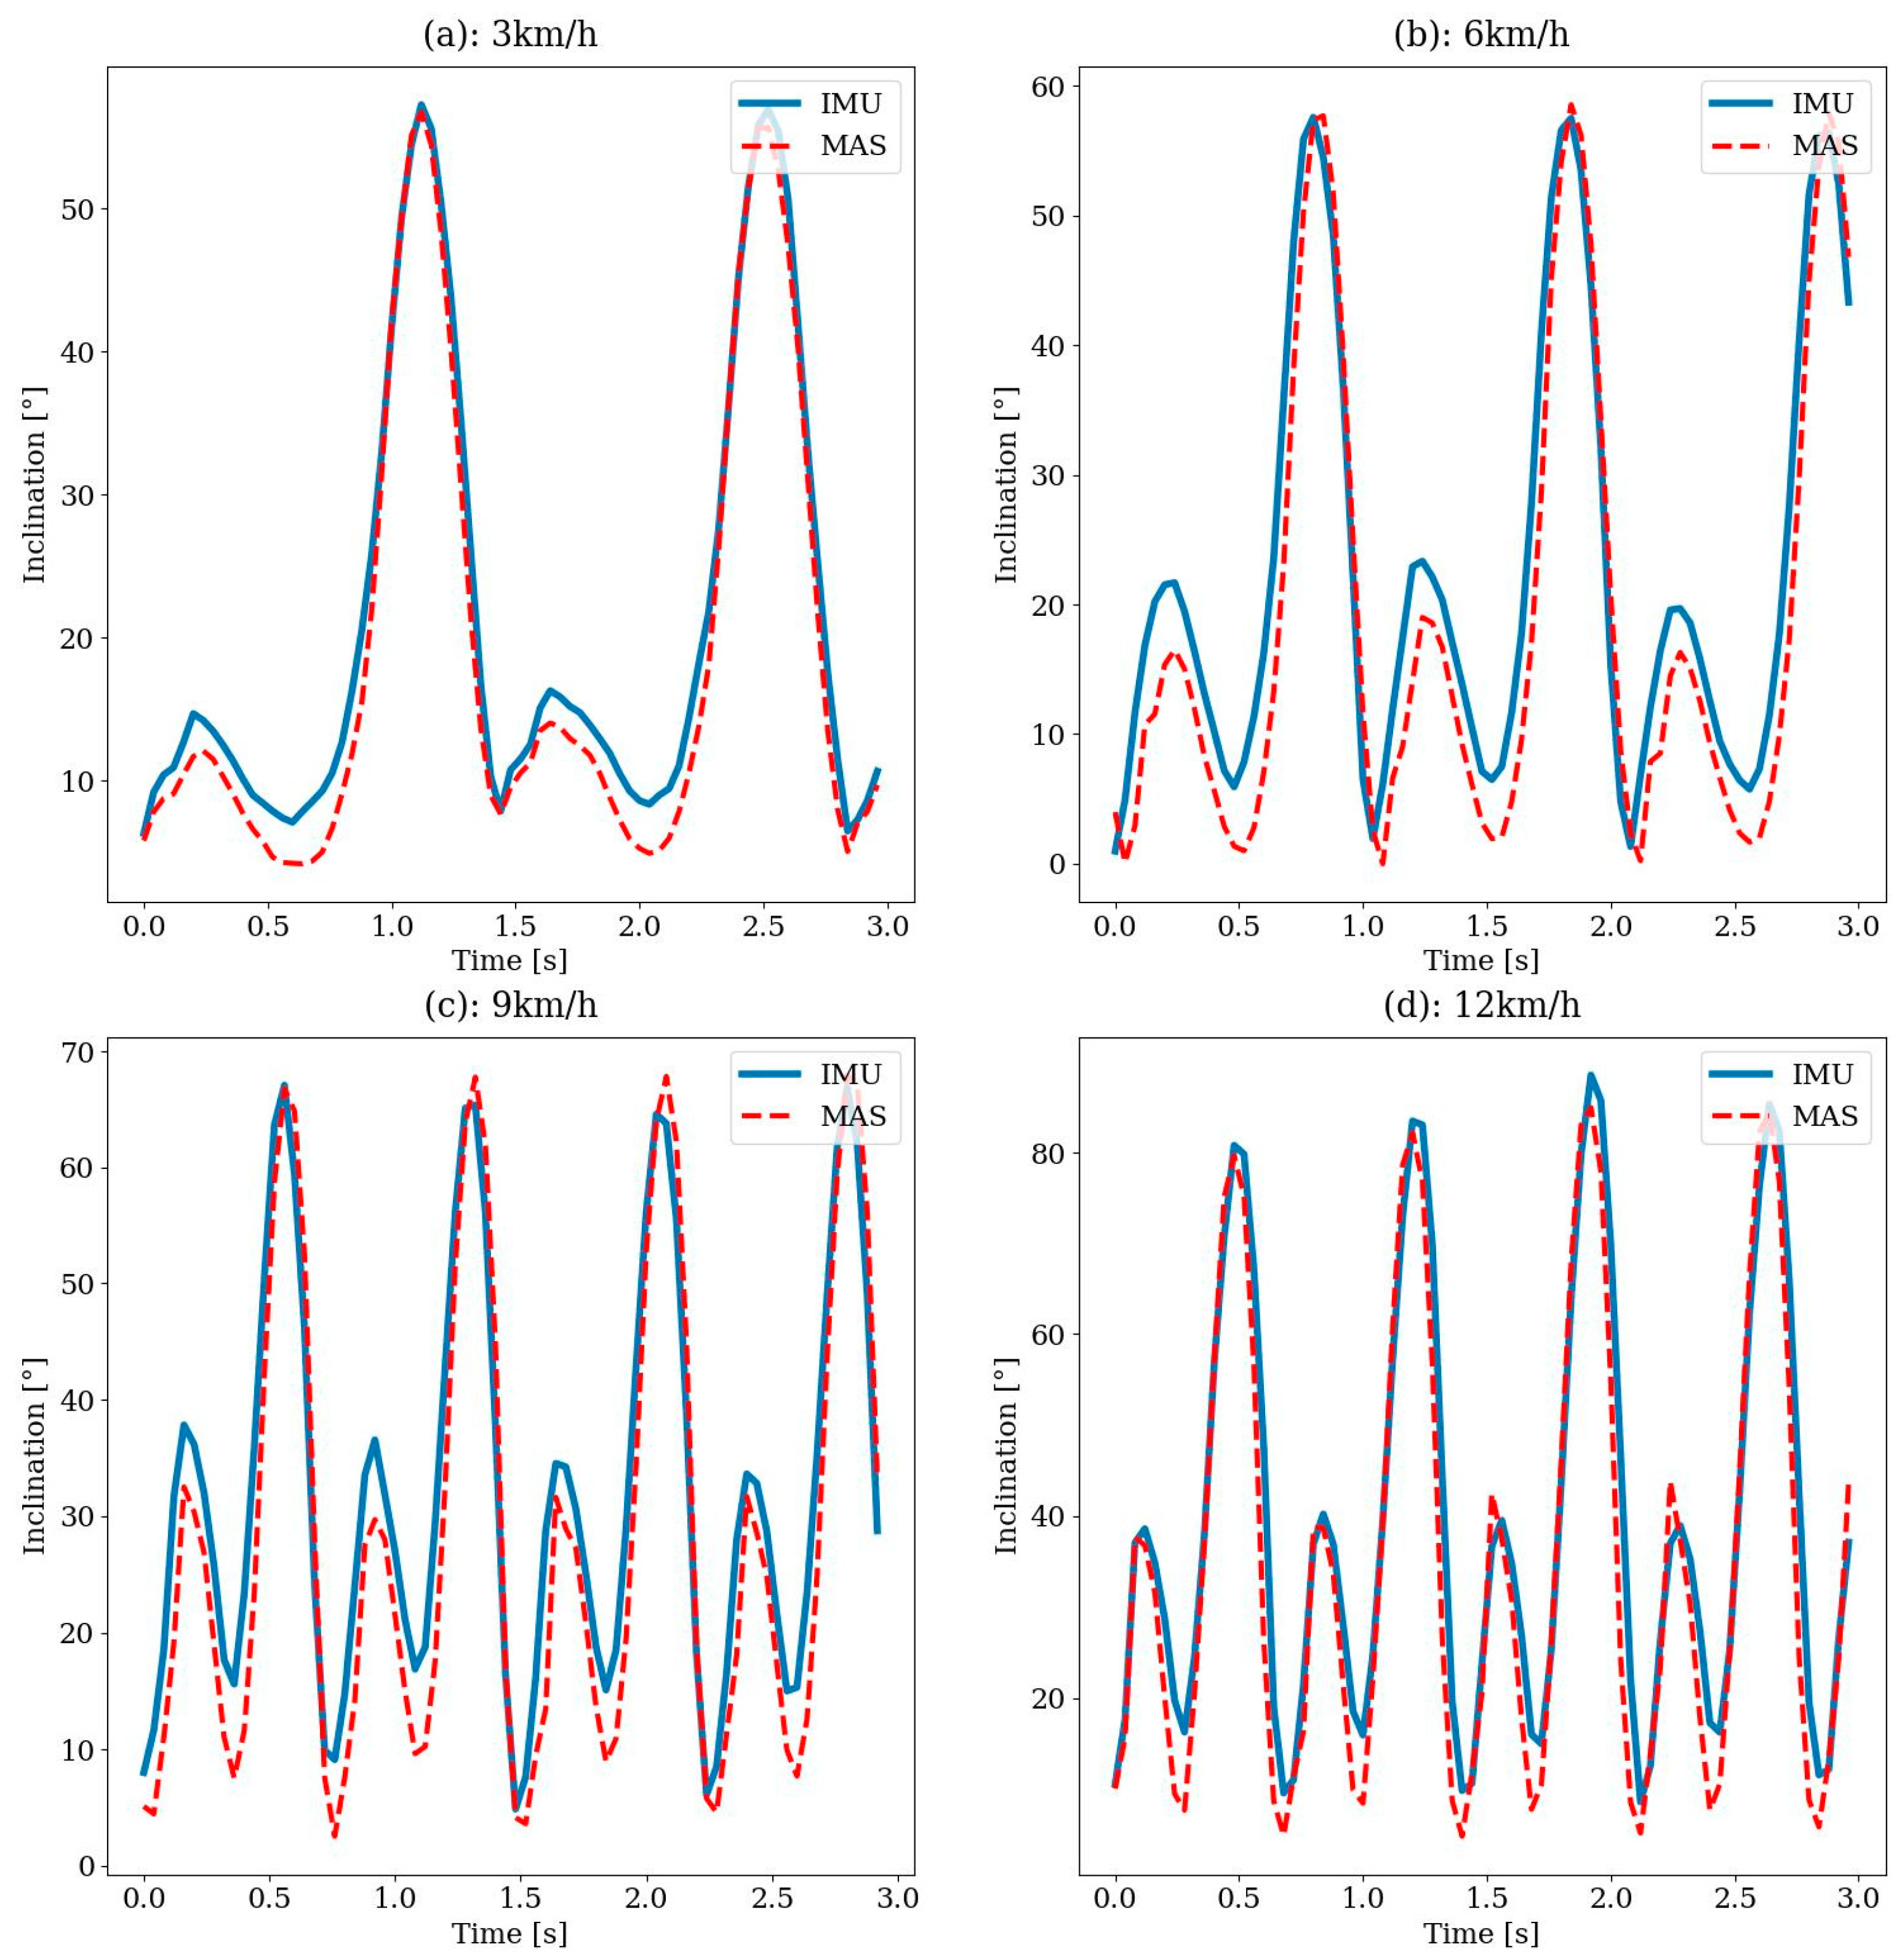
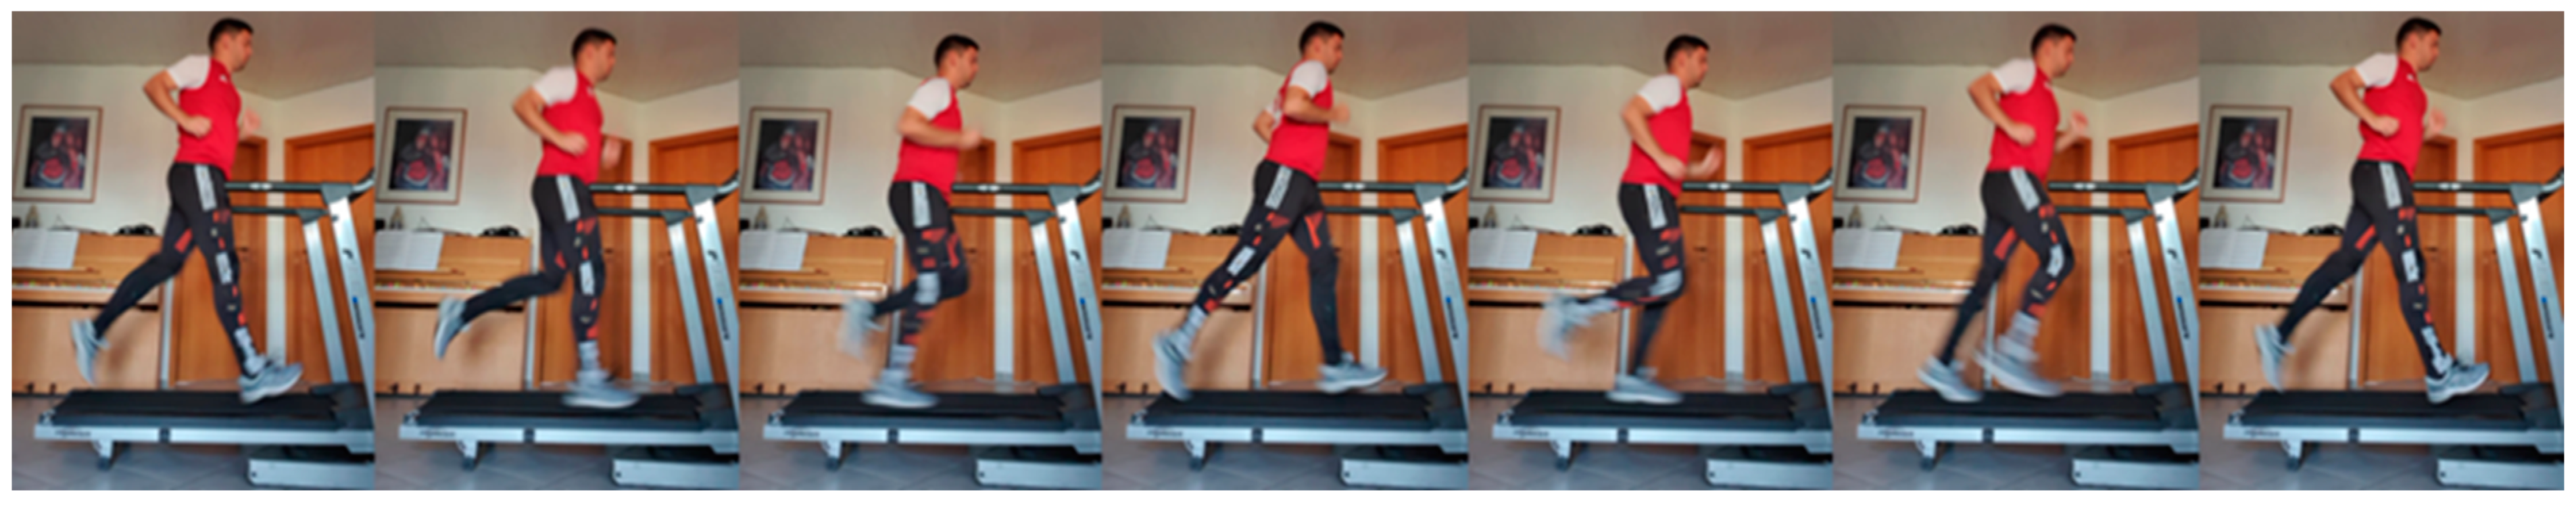
2.5.3. Treadmill Test
3. Results
3.1. Battery Life Test
3.2. Pendulum Test
3.3. Treadmill Test
4. Discussion
5. Conclusions and Outlook
Author Contributions
Funding
Institutional Review Board Statement
Informed Consent Statement
Data Availability Statement
Conflicts of Interest
Abbreviations
| ADL | Activities of Daily Living |
| API | Application Programming Interface |
| BLE | Bluetooth® Low Energy |
| ECG | Electrocardiography |
| EIT | Electrical Impedance Tomography |
| EKF | Extended Kalman Filter |
| EMG | Electromyography |
| GATT | Generic Attribute Profile |
| GRF | Ground Reaction Force |
| HTTP | Hypertext Transfer Protocol |
| HTTPS | Hypertext Transfer Protocol Secure |
| IMU | Inertial Measurement Unit |
| IP | Internet Protocol |
| JSON | Java Script Object Notation |
| LDO | Low Drop-Out Voltage Regulator |
| LiPo | Lithium Polymer |
| LTE | Long Term Evolution |
| MAS | Motion Analysis System |
| MEMS | Micro-Electro-Mechanical Systems |
| OLED | Organic Light Emitting Diode |
| OPD | Organic Photo Diode |
| PCB | Printed Circuit Board |
| RMS | Root Mean Squared |
| RMSE | Root Mean Squared Error |
| STA | Soft Tissue Artifacts |
| SQL | Structured Query Language |
| TLS | Transport Layer Security |
| USB | Universal Serial Bus |
References
- Pirker, W.; Katzenschlager, R. Gait disorders in adults and the elderly: A clinical guide. Wien. Klin. Wochenschr. 2017, 129, 81–95. [Google Scholar] [CrossRef]
- Mahlknecht, P.; Kiechl, S.; Bloem, B.R.; Willeit, J.; Scherfler, C.; Gasperi, A.; Rungger, G.; Poewe, W.; Seppi, K. Prevalence and burden of gait disorders in elderly men and women aged 60–97 years: A population-based study. PLoS ONE 2013, 8, e69627. [Google Scholar] [CrossRef]
- Meda-Gutiérrez, J.R.; Zúñiga-Avilés, L.A.; Vilchis-González, A.H.; Ávila-Vilchis, J.C. Knee Exoskeletons Design Approaches to Boost Strength Capability: A Review. Appl. Sci. 2021, 11, 9990. [Google Scholar] [CrossRef]
- Nesler, C.; Thomas, G.; Divekar, N.; Rouse, E.J.; Gregg, R.D. Enhancing Voluntary Motion with Modular, Backdrivable, Powered Hip and Knee Orthoses. IEEE Robot. Autom. Lett. 2022, 7, 6155–6162. [Google Scholar] [CrossRef]
- Toxiri, S.; Calanca, A.; Poliero, T.; Caldwell, D.G.; Ortiz, J. Actuation Requirements for Assistive Exoskeletons: Exploiting Knowledge of Task Dynamics. In Wearable Robotics: Challenges and Trends, Proceedings of the 4th International Symposium on Wearable Robotics, WeRob2018, Pisa, Italy, 16–20 October 2018; International Symposium on Wearable Robotics; Carrozza, M.C., Micera, S., Pons, J.L., Carrozza, M.C., Eds.; Springer International Publishing: Cham, Switzerland, 2019; pp. 381–385. ISBN 978-3-030-01887-0. [Google Scholar]
- Carrozza, M.C.; Micera, S.; Pons, J.L.; Carrozza, M.C. (Eds.) Wearable Robotics: Challenges and Trends, Proceedings of the 4th International Symposium on Wearable Robotics, WeRob2018, Pisa, Italy, 16–20 October 2018, 1st ed.; International Symposium on Wearable Robotics; Springer International Publishing: Cham, Switzerland, 2019. [Google Scholar]
- Arazpour, M.; Bani, M.A.; Hutchins, S.W. Reciprocal gait orthoses and powered gait orthoses for walking by spinal cord injury patients. Prosthet. Orthot. Int. 2013, 37, 14–21. [Google Scholar] [CrossRef]
- Contreras-Vidal, J.L.; Bhagat, A.N.; Brantley, J.; Cruz-Garza, J.G.; He, Y.; Manley, Q.; Nakagome, S.; Nathan, K.; Tan, S.H.; Zhu, F.; et al. Powered exoskeletons for bipedal locomotion after spinal cord injury. J. Neural Eng. 2016, 13, 31001. [Google Scholar] [CrossRef]
- Alqahtani, M.S.; Al-Tamimi, A.; Almeida, H.; Cooper, G.; Bartolo, P. A review on the use of additive manufacturing to produce lower limb orthoses. Prog. Addit. Manuf. 2020, 5, 85–94. [Google Scholar] [CrossRef]
- Tarbit, J.; Hartley, N.; Previte, J. Exoskeletons at your service: A multi-disciplinary structured literature review. J. Serv. Mark. 2023, 37, 313–339. [Google Scholar] [CrossRef]
- Yan, T.; Cempini, M.; Oddo, C.M.; Vitiello, N. Review of assistive strategies in powered lower-limb orthoses and exoskeletons. Robot. Auton. Syst. 2015, 64, 120–136. [Google Scholar] [CrossRef]
- Willwacher, S.; Robbin, J.; Eßer, T.; Mai, P. Bewegungsanalysesysteme in der Forschung und für niedergelassene Orthopädinnen und Orthopäden. Orthopadie 2023, 52, 610–617. [Google Scholar] [CrossRef]
- Riener, R.; Rabuffetti, M.; Frigo, C. Stair ascent and descent at different inclinations. Gait Posture 2002, 15, 32–44. [Google Scholar] [CrossRef]
- Laudanski, A.; Brouwer, B.; Li, Q. Measurement of lower limb joint kinematics using inertial sensors during stair ascent and descent in healthy older adults and stroke survivors. J. Healthc. Eng. 2013, 4, 555–576. [Google Scholar] [CrossRef]
- Brinckmann, P. Orthopädische Biomechanik: Mit 23 Tabellen; Mit Einem Verzeichnis der Fachausdrücke der Orthopädischen Biomechanik Englisch-Deutsch, 2nd ed.; Monsenstein und Vannerdat: Münster, Germany, 2012; ISBN 978-3-8405-0059-6. [Google Scholar]
- Jasiewicz, J.M.; Allum, J.H.J.; Middleton, J.W.; Barriskill, A.; Condie, P.; Purcell, B.; Li, R.C.T. Gait event detection using linear accelerometers or angular velocity transducers in able-bodied and spinal-cord injured individuals. Gait Posture 2006, 24, 502–509. [Google Scholar] [CrossRef]
- Gao, F.; Liu, G.; Liang, F.; Liao, W.-H. IMU-Based Locomotion Mode Identification for Transtibial Prostheses, Orthoses, and Exoskeletons. IEEE Trans. Neural Syst. Rehabil. Eng. 2020, 28, 1334–1343. [Google Scholar] [CrossRef]
- Wong, Z.Y.; Ishak, A.J.; Ahmad, S.A.; Chong, Y.Z. Mechanical analysis of wearable lower limb exo-skeleton for rehabilitation. J. Eng. Sci. Technol. 2014, 9, 107. [Google Scholar]
- Zhang, Y.; Ma, Z.; Zuo, S.; Liu, J. Gait Prediction and Assist Control of Lower Limb Exoskeleton Based on Inertia Measurement Unit. In Proceedings of the 2022 5th International Conference on Intelligent Robotics and Control Engineering (IRCE), Tianjin, China, 23–25 September 2022; pp. 44–49, ISBN 978-1-6654-6995-1. [Google Scholar]
- Gonzales-Huisa, O.A.; Oshiro, G.; Abarca, V.E.; Chavez-Echajaya, J.G.; Elias, D.A. EMG and IMU Data Fusion for Locomotion Mode Classification in Transtibial Amputees. Prosthesis 2023, 5, 1232–1256. [Google Scholar] [CrossRef]
- Stetter, B.J.; Krafft, F.C.; Ringhof, S.; Stein, T.; Sell, S. A Machine Learning and Wearable Sensor Based Approach to Estimate External Knee Flexion and Adduction Moments during Various Locomotion Tasks. Front. Bioeng. Biotechnol. 2020, 8, 9. [Google Scholar] [CrossRef]
- Zihajehzadeh, S.; Park, E.J. A Novel Biomechanical Model-Aided IMU/UWB Fusion for Magnetometer-Free Lower Body Motion Capture. IEEE Trans. Syst. Man Cybern, Syst. 2017, 47, 927–938. [Google Scholar] [CrossRef]
- Hamdi Mohammed, M.; Awad Mohammed, I.; Abdelhameed Magdy, M.; Tolbah Farid, A. Lower limb motion tracking using IMU sensor network. In Proceedings of the 2014 Cairo International Biomedical Engineering Conference (CIBEC), Giza, Egypt, 11–13 December 2014; pp. 28–33. [Google Scholar]
- Iman, P.; Doik, K. Design and implementation of IMU-based human arm motion capture system. In Proceedings of the 2012 IEEE International Conference on Mechatronics and Automation, Chengdu, China, 5–8 August 2012; pp. 670–675. [Google Scholar]
- Carcreff, L.; Payen, G.; Grouvel, G.; Massé, F.; Armand, S. Three-Dimensional Lower-Limb Kinematics from Accelerometers and Gyroscopes with Simple and Minimal Functional Calibration Tasks: Validation on Asymptomatic Participants. Sensors 2022, 22, 5657. [Google Scholar] [CrossRef]
- Cerfoglio, S.; Capodaglio, P.; Rossi, P.; Conforti, I.; D’Angeli, V.; Milani, E.; Galli, M.; Cimolin, V. Evaluation of Upper Body and Lower Limbs Kinematics through an IMU-Based Medical System: A Comparative Study with the Optoelectronic System. Sensors 2023, 23, 6156. [Google Scholar] [CrossRef]
- Di Raimondo, G.; Vanwanseele, B.; van der Have, A.; Emmerzaal, J.; Willems, M.; Killen, B.A.; Jonkers, I. Inertial Sensor-to-Segment Calibration for Accurate 3D Joint Angle Calculation for Use in OpenSim. Sensors 2022, 22, 3259. [Google Scholar] [CrossRef]
- Dorschky, E.; Nitschke, M.; Seifer, A.-K.; van den Bogert, A.J.; Eskofier, B.M. Estimation of gait kinematics and kinetics from inertial sensor data using optimal control of musculoskeletal models. J. Biomech. 2019, 95, 109278. [Google Scholar] [CrossRef]
- Favre, J.; Aissaoui, R.; Jolles, B.M.; Guise, J.A.d.; Aminian, K. Functional calibration procedure for 3D knee joint angle description using inertial sensors. J. Biomech. 2009, 42, 2330–2335. [Google Scholar] [CrossRef]
- Finco, M.G.; Patterson, R.M.; Moudy, S.C. A pilot case series for concurrent validation of inertial measurement units to motion capture in individuals who use unilateral lower-limb prostheses. J. Rehabil. Assist. Technol. Eng. 2023, 10, 1–13. [Google Scholar] [CrossRef]
- Gard, S.A.P. Use of Quantitative Gait Analysis for the Evaluation of Prosthetic Walking Performance. JPO J. Prosthet. Orthot. 2006, 18, 93–104. [Google Scholar] [CrossRef]
- Joukov, V.; Bonnet, V.; Karg, M.; Venture, G.; Kulic, D. Rhythmic Extended Kalman Filter for Gait Rehabilitation Motion Estimation and Segmentation. IEEE Trans. Neural Syst. Rehabil. Eng. 2018, 26, 407–418. [Google Scholar] [CrossRef]
- Lebleu, J.; Gosseye, T.; Detrembleur, C.; Mahaudens, P.; Cartiaux, O.; Penta, M. Lower Limb Kinematics Using Inertial Sensors during Locomotion: Accuracy and Reproducibility of Joint Angle Calculations with Different Sensor-to-Segment Calibrations. Sensors 2020, 20, 715. [Google Scholar] [CrossRef]
- Lora-Millan, J.S.; Hidalgo, A.F.; Rocon, E. An IMUs-Based Extended Kalman Filter to Estimate Gait Lower Limb Sagittal Kinematics for the Control of Wearable Robotic Devices. IEEE Access 2021, 9, 144540–144554. [Google Scholar] [CrossRef]
- Poitras, I.; Dupuis, F.; Bielmann, M.; Campeau-Lecours, A.; Mercier, C.; Bouyer, L.J.; Roy, J.-S. Validity and Reliability of Wearable Sensors for Joint Angle Estimation: A Systematic Review. Sensors 2019, 19, 1555. [Google Scholar] [CrossRef]
- Robert-Lachaine, X.; Parent, G.; Fuentes, A.; Hagemeister, N.; Aissaoui, R. Inertial motion capture validation of 3D knee kinematics at various gait speed on the treadmill with a double-pose calibration. Gait Posture 2020, 77, 132–137. [Google Scholar] [CrossRef]
- Seel, T.; Raisch, J.; Schauer, T. IMU-based joint angle measurement for gait analysis. Sensors 2014, 14, 6891–6909. [Google Scholar] [CrossRef]
- Shull, P.B.; Jirattigalachote, W.; Hunt, M.A.; Cutkosky, M.R.; Delp, S.L. Quantified self and human movement: A review on the clinical impact of wearable sensing and feedback for gait analysis and intervention. Gait Posture 2014, 40, 11–19. [Google Scholar] [CrossRef]
- Storm, F.A.; Cesareo, A.; Reni, G.; Biffi, E. Wearable Inertial Sensors to Assess Gait during the 6-Minute Walk Test: A Systematic Review. Sensors 2020, 20, 2660. [Google Scholar] [CrossRef]
- Teufl, W.; Miezal, M.; Taetz, B.; Fröhlich, M.; Bleser, G. Validity, Test-Retest Reliability and Long-Term Stability of Magnetometer Free Inertial Sensor Based 3D Joint Kinematics. Sensors 2018, 18, 1980. [Google Scholar] [CrossRef]
- Weygers, I.; Kok, M.; Konings, M.; Hallez, H.; Vroey, H.d.; Claeys, K. Inertial Sensor-Based Lower Limb Joint Kinematics: A Methodological Systematic Review. Sensors 2020, 20, 673. [Google Scholar] [CrossRef]
- Cloete, T.; Scheffer, C. Benchmarking of a full-body inertial motion capture system for clinical gait analysis. In Proceedings of the 2008 30th Annual International Conference of the IEEE Engineering in Medicine and Biology Society, Vancouver, BC, Canada, 21–22 August 2008; pp. 4579–4582. [Google Scholar]
- Robert-Lachaine, X.; Mecheri, H.; Muller, C.; Larue, C.; Plamondon, A. Validation of a low-cost inertial motion capture system for whole-body motion analysis. J. Biomech. 2020, 99, 109520. [Google Scholar] [CrossRef]
- Benson, L.C.; Räisänen, A.M.; Clermont, C.A.; Ferber, R. Is This the Real Life, or Is This Just Laboratory? A Scoping Review of IMU-Based Running Gait Analysis. Sensors 2022, 22, 1722. [Google Scholar] [CrossRef]
- O’Reilly, M.; Caulfield, B.; Ward, T.; Johnston, W.; Doherty, C. Wearable Inertial Sensor Systems for Lower Limb Exercise Detection and Evaluation: A Systematic Review. Sports Med. 2018, 48, 1221–1246. [Google Scholar] [CrossRef]
- Robert-Lachaine, X.; Mecheri, H.; Larue, C.; Plamondon, A. Validation of inertial measurement units with an optoelectronic system for whole-body motion analysis. Med. Biol. Eng. Comput. 2017, 55, 609–619. [Google Scholar] [CrossRef]
- Amin, J.; Ruthiraphong, P. Cloud-based Gait Analysis Using a Single IMU for Parkinson Disease. In Proceedings of the 2021 18th International Conference on Electrical Engineering/Electronics, Computer, Telecommunications and Information Technology (ECTI-CON), Chiang Mai, Thailand, 19–22 May 2021; pp. 1129–1132, ISBN 978-1-6654-0382-5. [Google Scholar]
- Al Borno, M.; O’Day, J.; Ibarra, V.; Dunne, J.; Seth, A.; Habib, A.; Ong, C.; Hicks, J.; Uhlrich, S.; Delp, S. OpenSense: An open-source toolbox for inertial-measurement-unit-based measurement of lower extremity kinematics over long durations. J. Neuroeng. Rehabil. 2022, 19, 22. [Google Scholar] [CrossRef]
- ST Microelectronics. STEVAL-STLCS02V1—Data Brief. Available online: https://www.st.com/resource/en/data_brief/steval-stlcs02v1.pdf (accessed on 1 December 2022).
- ST Microelectronics. LSM6DSM—iNEMO Inertial Module: Always-On 3D Accelerometer and 3D Gyroscope. Available online: https://www.st.com/resource/en/datasheet/lsm6dsm.pdf (accessed on 1 December 2022).
- Adafruit Industries. Adafruit Micro-Lipo Charger for LiPo/LiIon Batt w/MicroUSB Jack. Available online: https://www.adafruit.com/product/1904 (accessed on 27 December 2023).
- Pachi, A.; Ji, T. Frequency and Velocity of People Walking; Institution of Structural Engineers: London, UK, 2005. [Google Scholar]
- Karampour, H.; Piran, F.; Faircloth, A.; Talebian, N.; Miller, D. Vibration of Timber and Hybrid Floors: A Review of Methods of Measurement, Analysis, and Design. Buildings 2023, 13, 1756. [Google Scholar] [CrossRef]
- Niswander, W.; Wang, W.; Kontson, K. Optimization of IMU Sensor Placement for the Measurement of Lower Limb Joint Kinematics. Sensors 2020, 20, 5993. [Google Scholar] [CrossRef]
- Pacher, L.; Chatellier, C.; Vauzelle, R.; Fradet, L. Comparison of lower limb calibration methods for movement analysis with inertial measurement unit (IMU). Comput. Methods Biomech. Biomed. Eng. 2020, 23, S215–S217. [Google Scholar] [CrossRef]
- Prakash, C.; Kumar, R.; Mittal, N. Recent developments in human gait research: Parameters, approaches, applications, machine learning techniques, datasets and challenges. Artif. Intell. Rev. 2018, 49, 1–40. [Google Scholar] [CrossRef]
- Kramers-De Quervain, I.A.; Stüssi, E.; Stacoff, A. Ganganalyse beim Gehen und Laufen. Schweiz. Z. Sportmed. Sport 2008, 56, 35–42. [Google Scholar]


| RMSE | Standard Deviation | Average Difference |
|---|---|---|
| 3.5° | 3.4° | 2.3° |
| Walking Speed | RMSE | Standard Deviation | Difference | ||
|---|---|---|---|---|---|
| Average | Minimum | Maximum | |||
| 3 km/h | 2.9° | 1.6° | 2.4° | −3.0° | 7.0° |
| 6 km/h | 6.1° | 5.1° | 3.4° | −11.1° | 18.2° |
| 9 km/h | 5.2° | 5.1° | 1,0° | −10.1° | 16.3° |
| 12 km/h | 8.0° | 6.7° | 4.3° | −11.9° | 24.2° |
Disclaimer/Publisher’s Note: The statements, opinions and data contained in all publications are solely those of the individual author(s) and contributor(s) and not of MDPI and/or the editor(s). MDPI and/or the editor(s) disclaim responsibility for any injury to people or property resulting from any ideas, methods, instructions or products referred to in the content. |
© 2024 by the authors. Licensee MDPI, Basel, Switzerland. This article is an open access article distributed under the terms and conditions of the Creative Commons Attribution (CC BY) license (https://creativecommons.org/licenses/by/4.0/).
Share and Cite
David, J.P.; Schick, D.; Rapp, L.; Schick, J.; Glaser, M. SensAA—Design and Verification of a Cloud-Based Wearable Biomechanical Data Acquisition System. Sensors 2024, 24, 2405. https://doi.org/10.3390/s24082405
David JP, Schick D, Rapp L, Schick J, Glaser M. SensAA—Design and Verification of a Cloud-Based Wearable Biomechanical Data Acquisition System. Sensors. 2024; 24(8):2405. https://doi.org/10.3390/s24082405
Chicago/Turabian StyleDavid, Jonas Paul, David Schick, Lorenz Rapp, Johannes Schick, and Markus Glaser. 2024. "SensAA—Design and Verification of a Cloud-Based Wearable Biomechanical Data Acquisition System" Sensors 24, no. 8: 2405. https://doi.org/10.3390/s24082405