
Wearable Biosensor Technology in Education: A Systematic Review
 ,
,  , ,
, ,  , , , ,
  , ,
, ,  and
and 
Abstract
:1. Introduction
2. Materials and Methods
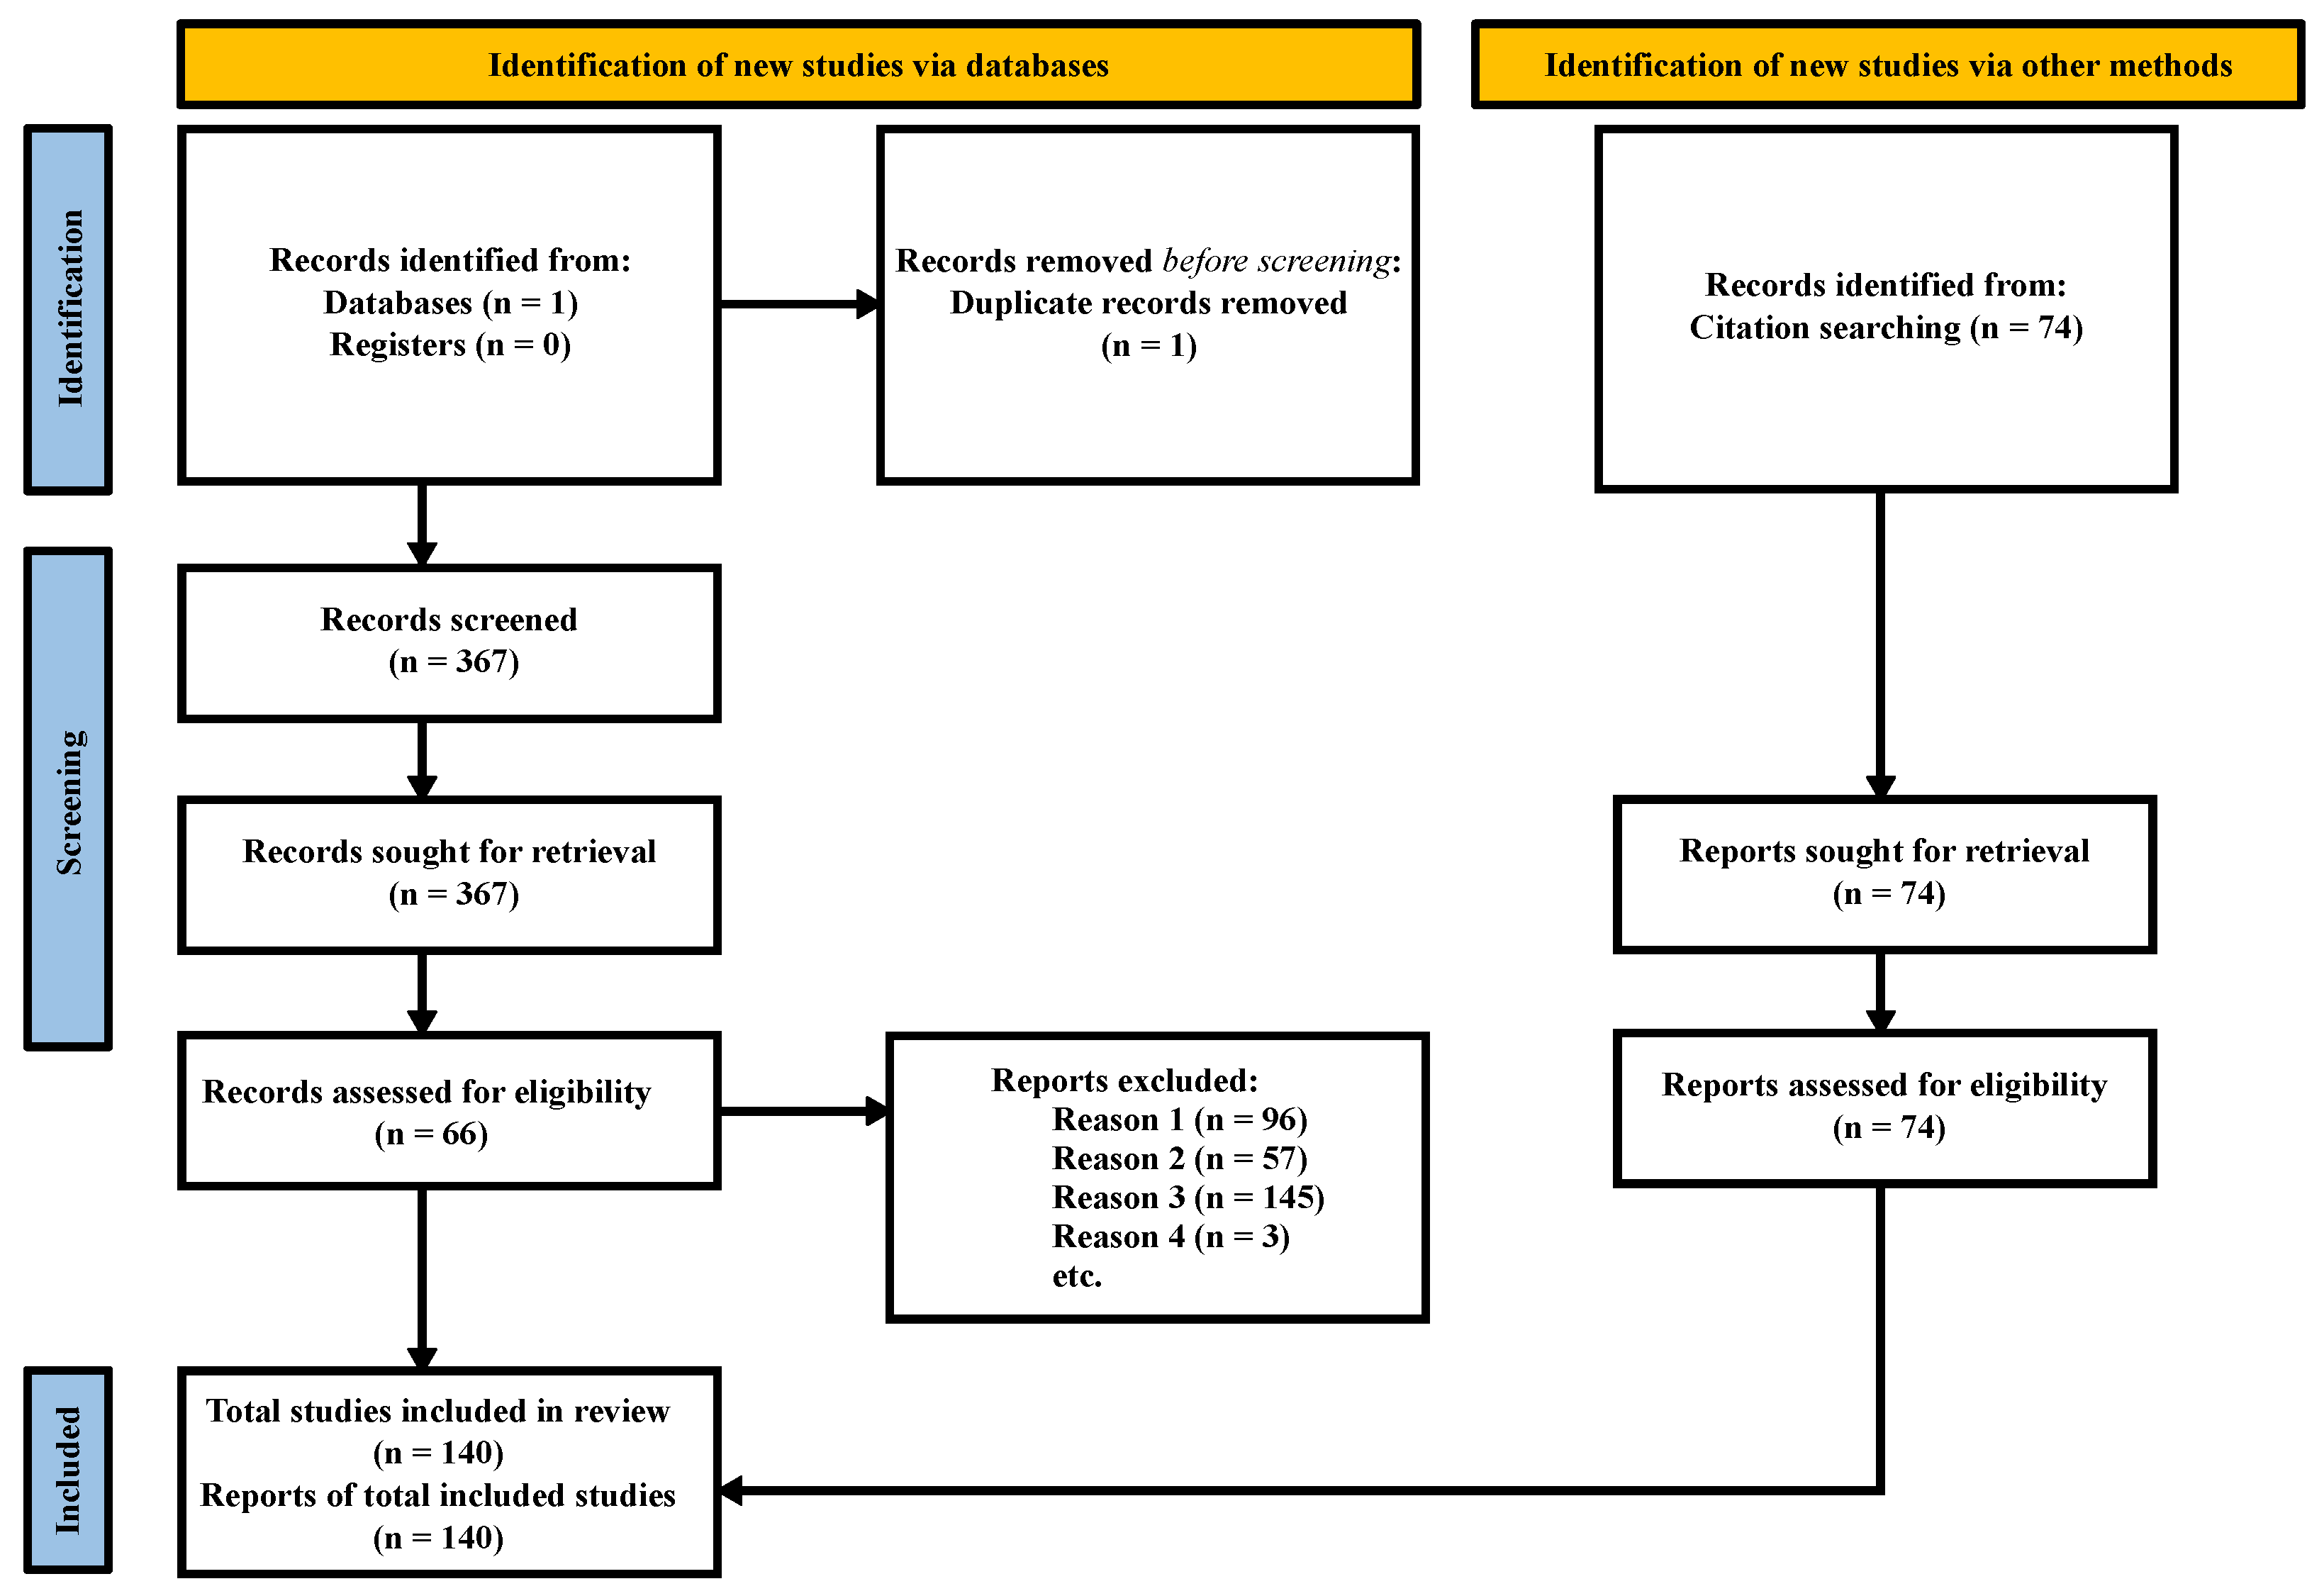
2.1. Study Design and Search Strategy
2.2. Exclusion Criteria
- The publication was not related to biometry or education (n = 96).
- The publication was related to biometry but not to education (n = 57).
- The publication was related to education, but not to biometry (n = 145).
- The search was related to a summary of conference proceedings (n = 3).
3. Results
3.1. Summary of Studies Included
3.2. General Characteristics of the Included Studies
- Objective. Describes the main goal of the study being conducted.
- Education Type. Classifies the study according to the type of education to which it is applied, such as academic, language, medical, Science Technology Engineering Mathematics (STEM), etc.
- Education Level. Classifies the study according to the level of education to which it is applied, such as kindergarten, elementary school, high school, university, etc.
- Institute. Provides the name of the institution in which the study is being conducted.
- Country. Provides the name of the country in which the study was conducted.
- Sample Size. Number of people who participated as test subjects during the study.
- Analysis Tools. Provides information on the tools used to gather and analyze the study’s data. The information collected in each study includes mainly physiological characteristics, such as EEG, ECG, EMG, HR, GSR, and HRV, and some questionnaires such as the Medical Student Stressor Questionnaire (MSSQ), Perceived Stress Scale (PSS-10), Behavior Assessment System for Children (BASC-S2), Global Assessment of Recent Stress (GARS-K), Balance of Challenge and Skill (BCS), and Momentary Test Performance (MOM-tp). On the other hand, a diverse set of tools was used to analyze the information, including MATLAB, Statistical Package for the Social Sciences (SPSS), augmented reality (AR), VR, wearable commercial-off-the-shelf (COTS), and brain–computer interfaces (BCIs). Lastly, in order to provide reliable results, the studies employed various types of metrics or statistics, which included standard deviation of NN intervals (SDNN), root mean square of successive differences between normal heartbeats (RMSSD), proportion of NN50 (pNN50), low frequency (LF) and high frequency (HF) ratio, ANOVA, radial basis neural network (RBFNN), and improved extreme learning machine (IELM).
- Contribution. Contains the main findings of the study.
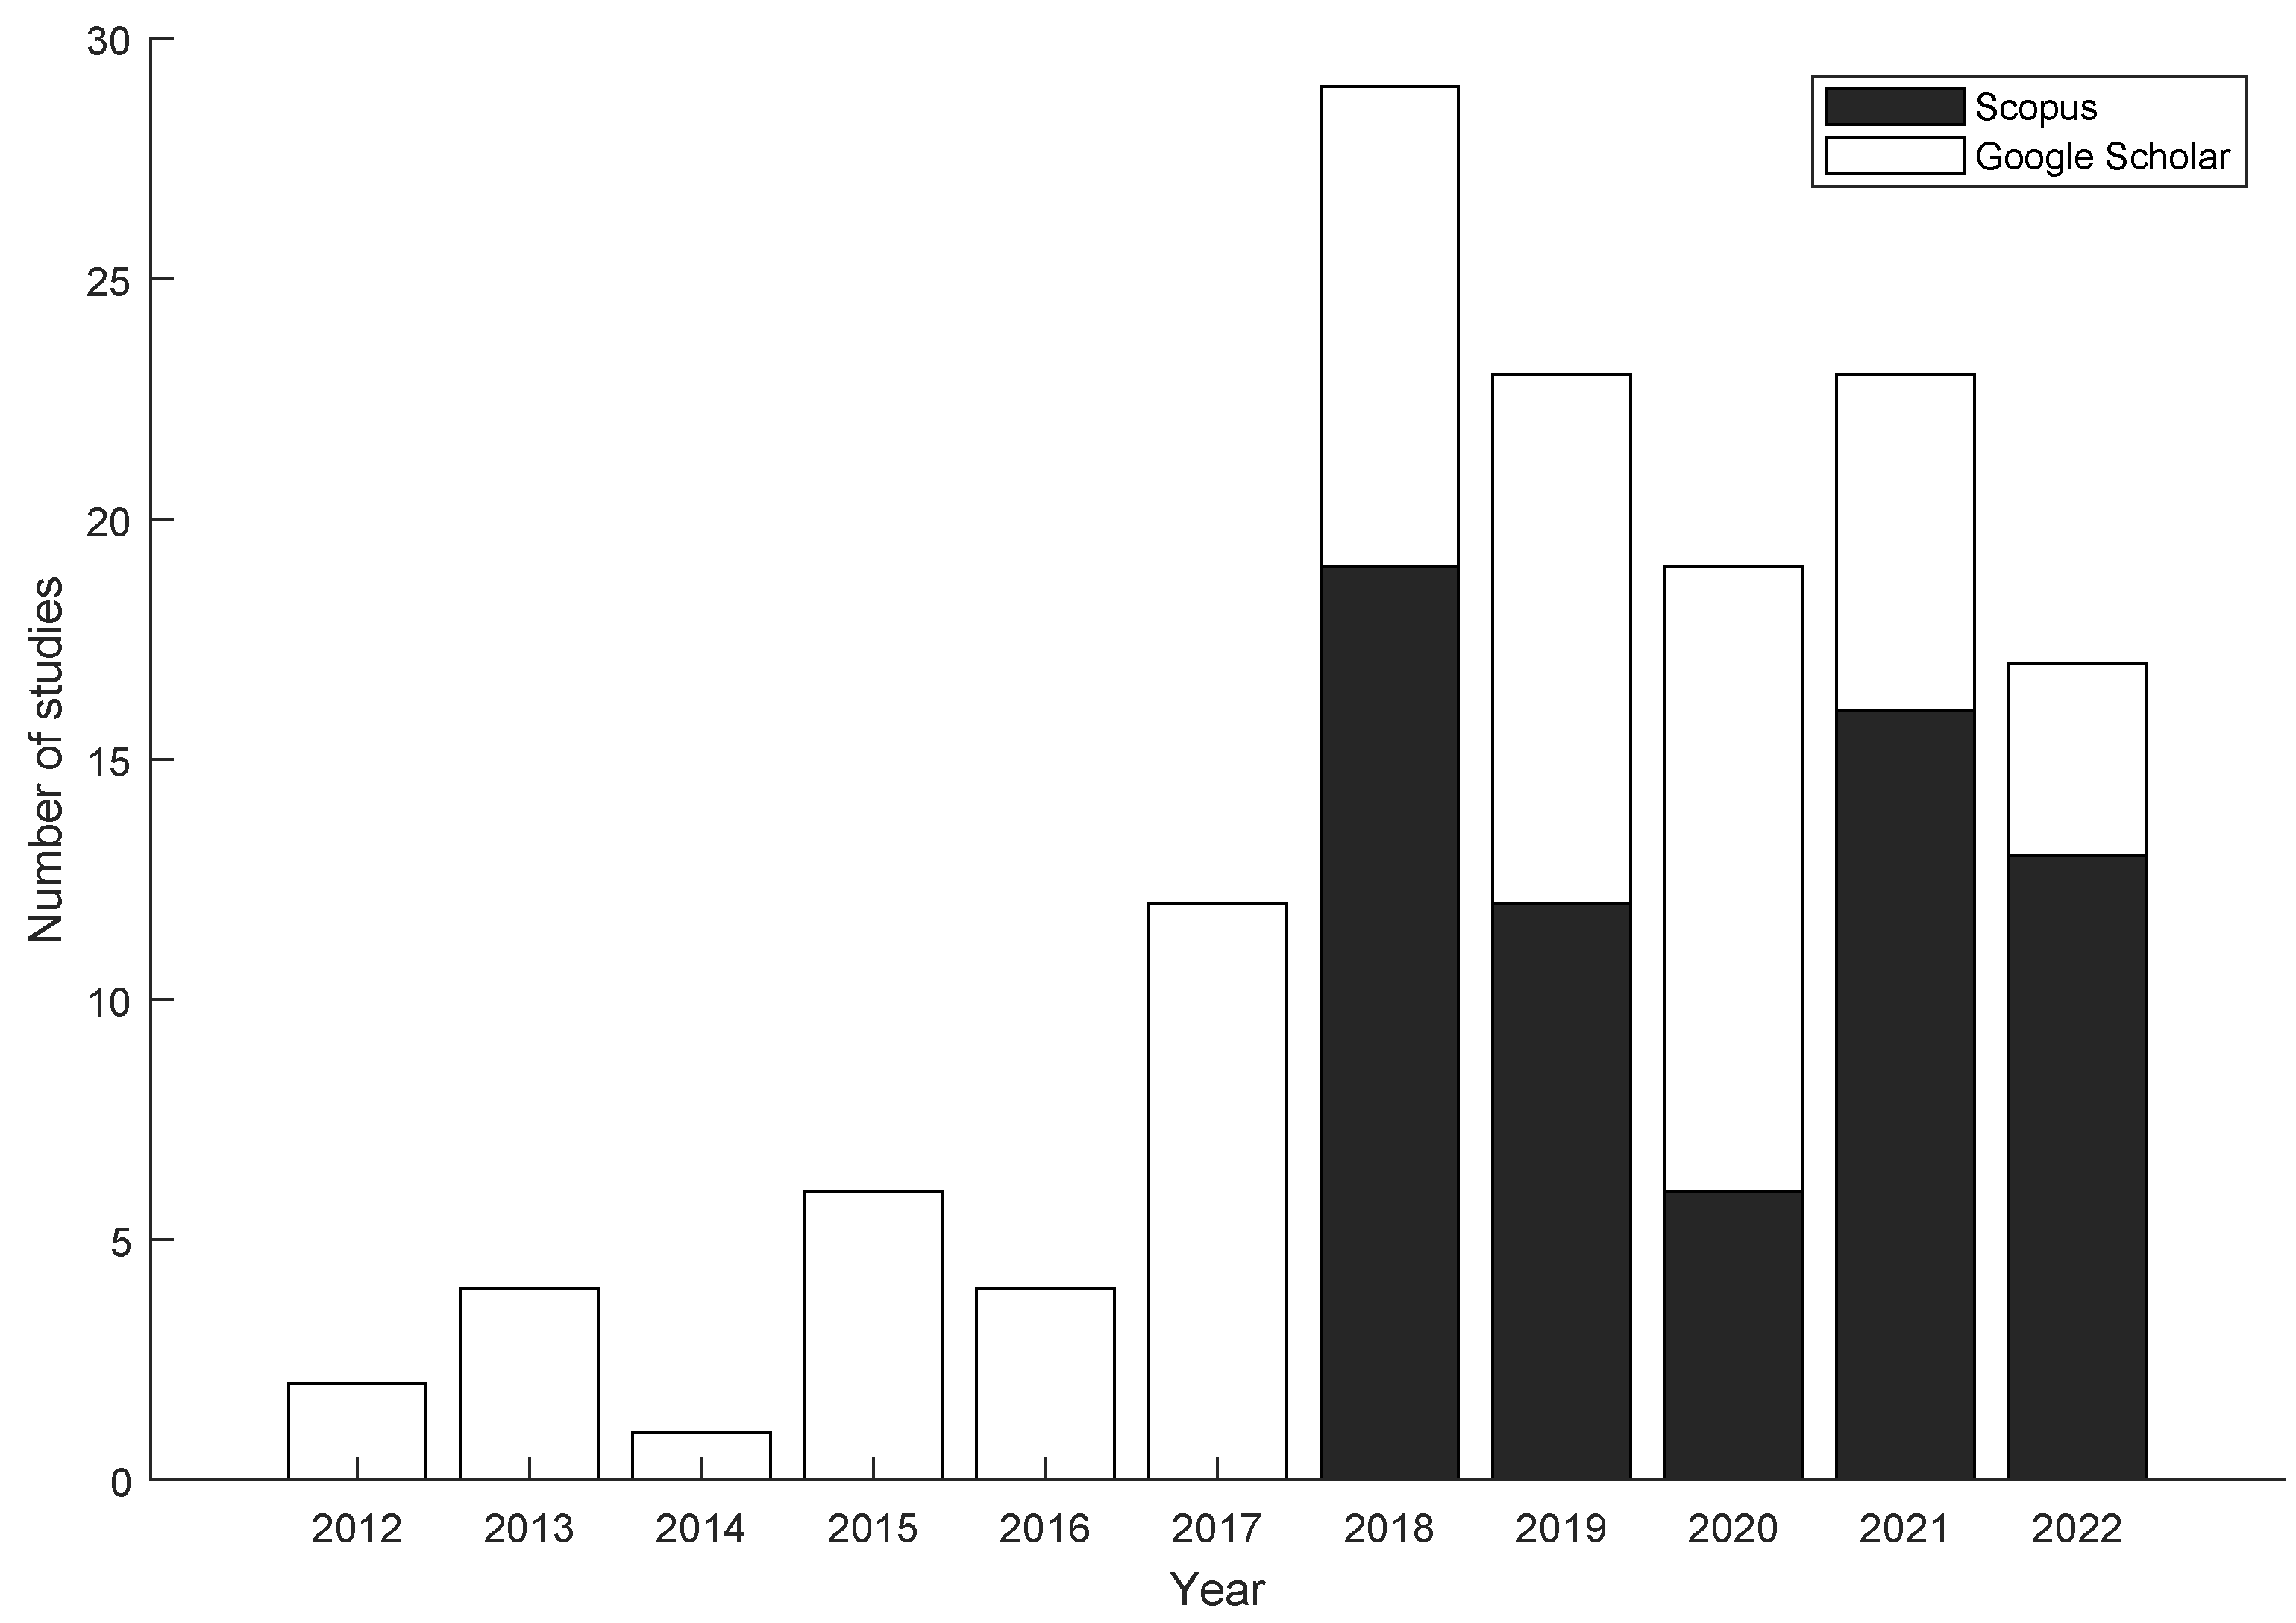
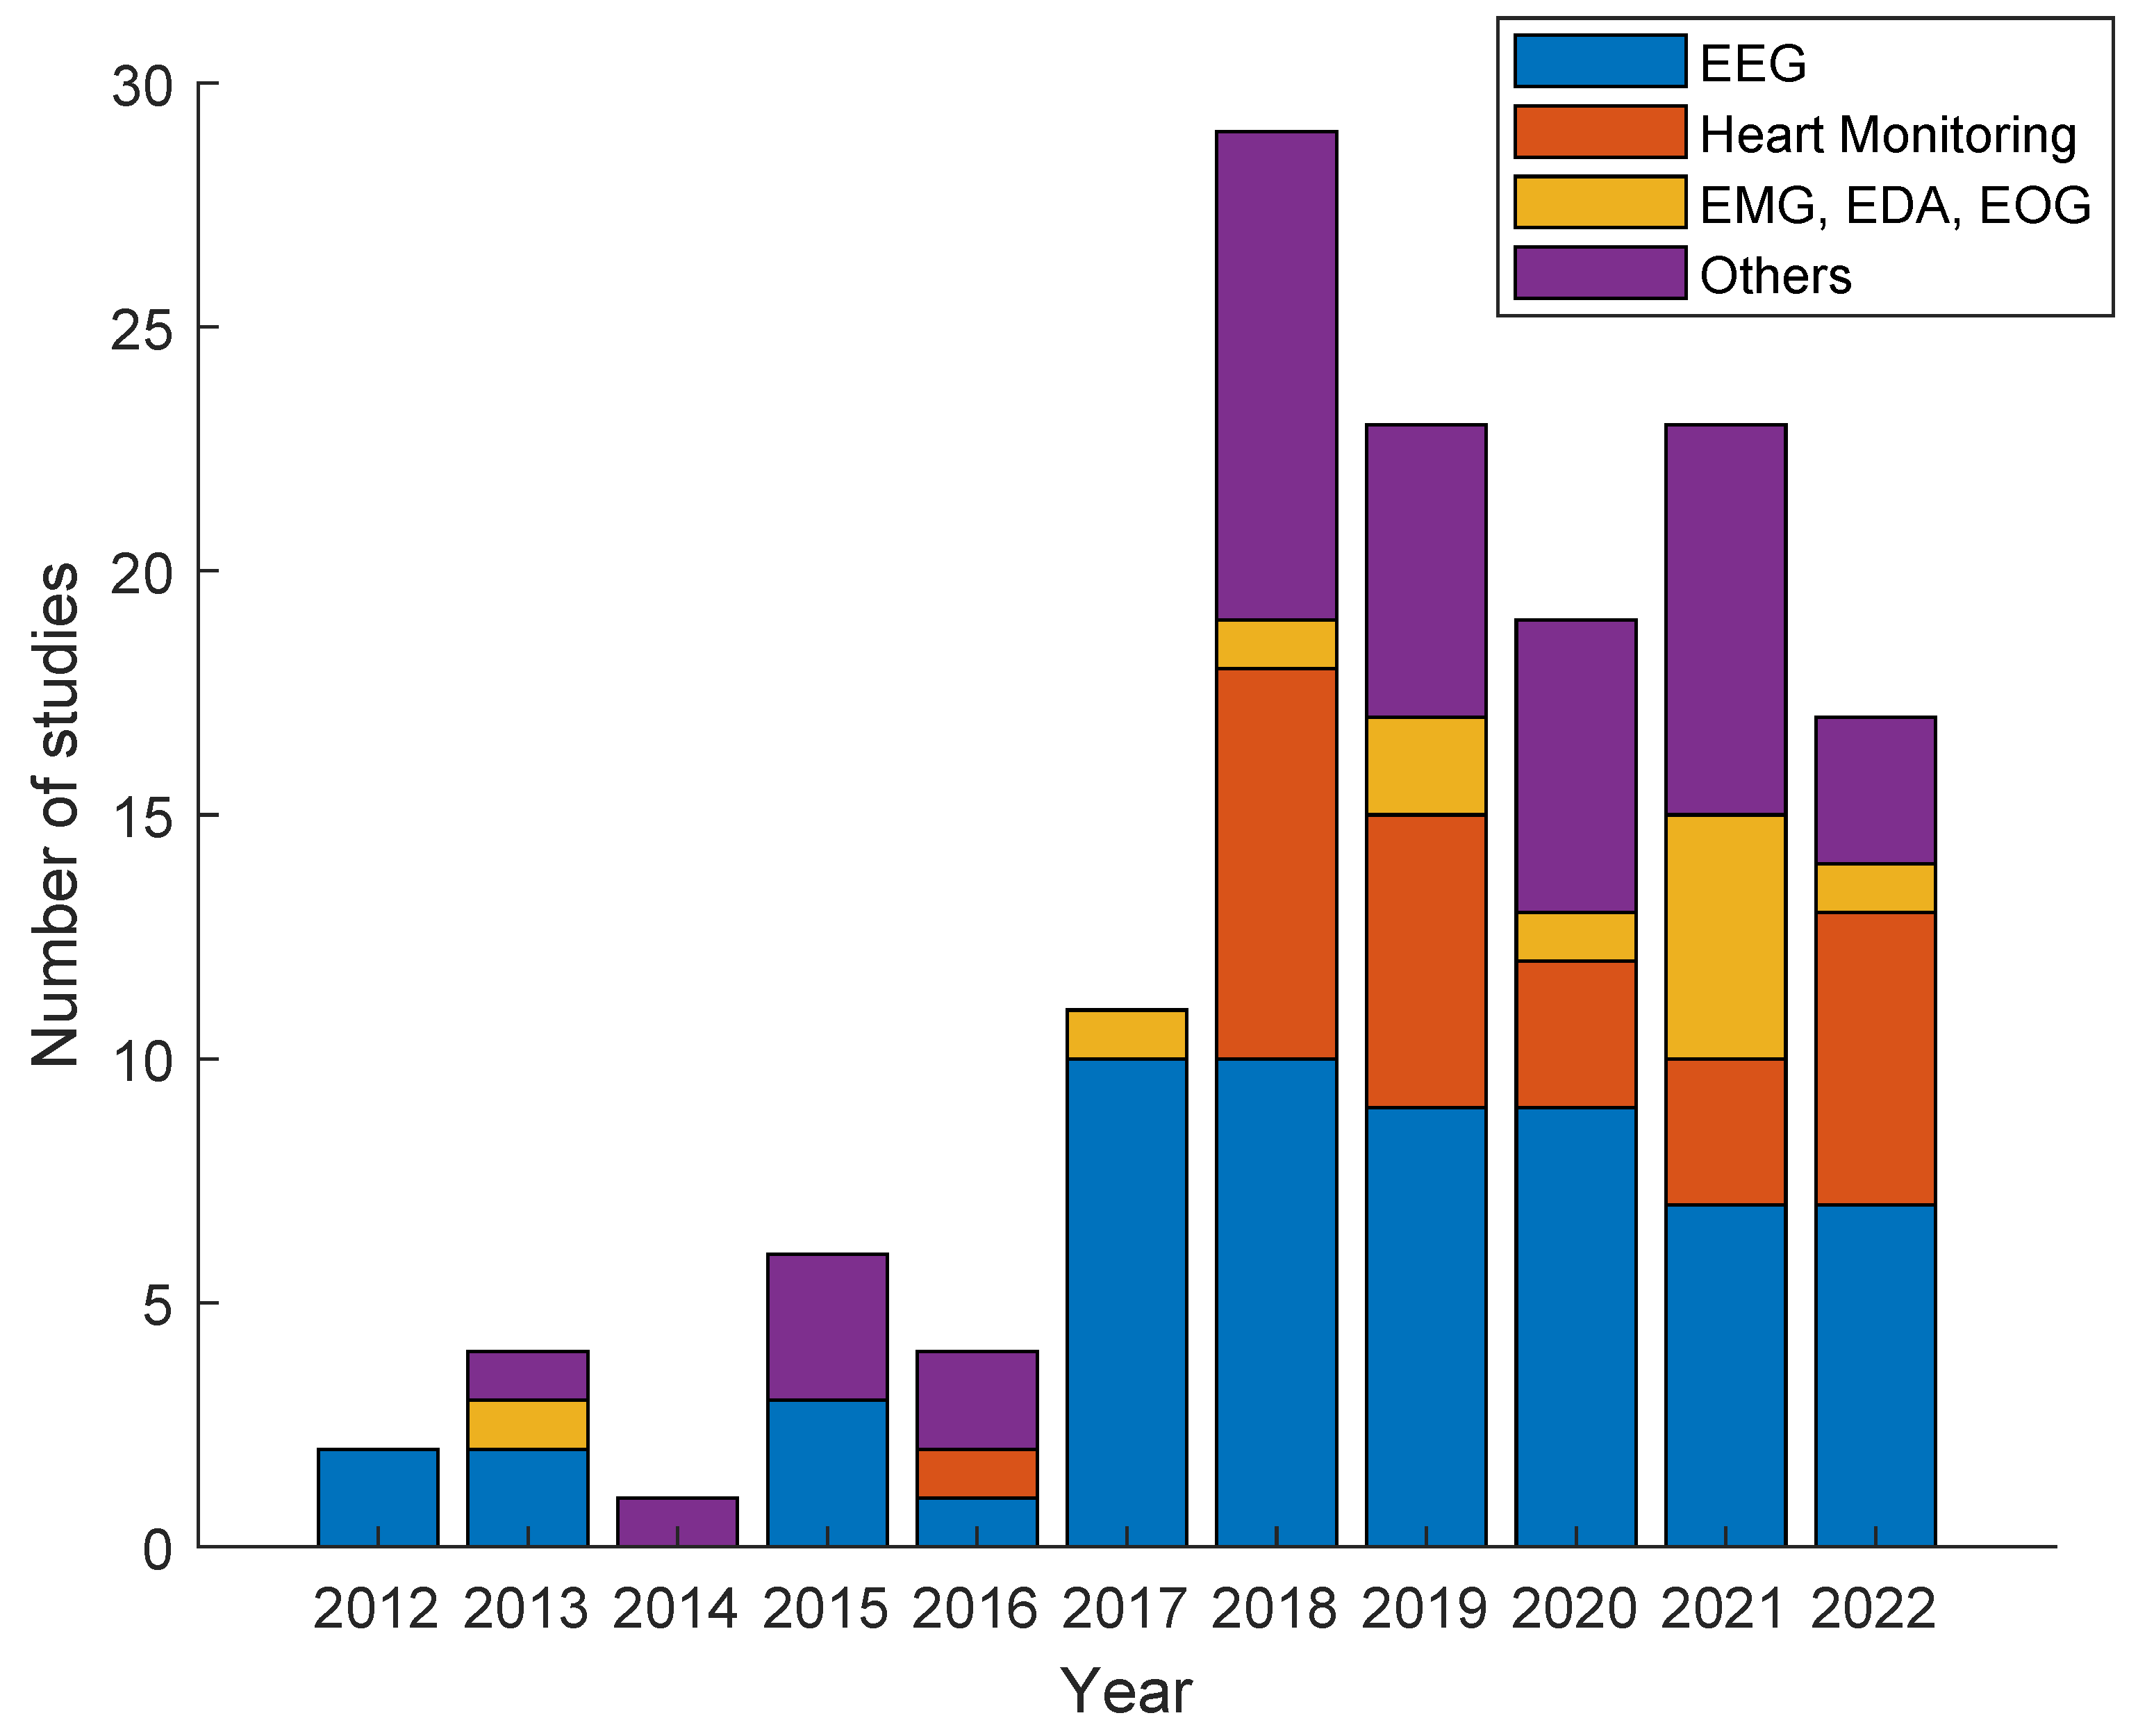
3.3. Temporal Distribution of the Included Studies
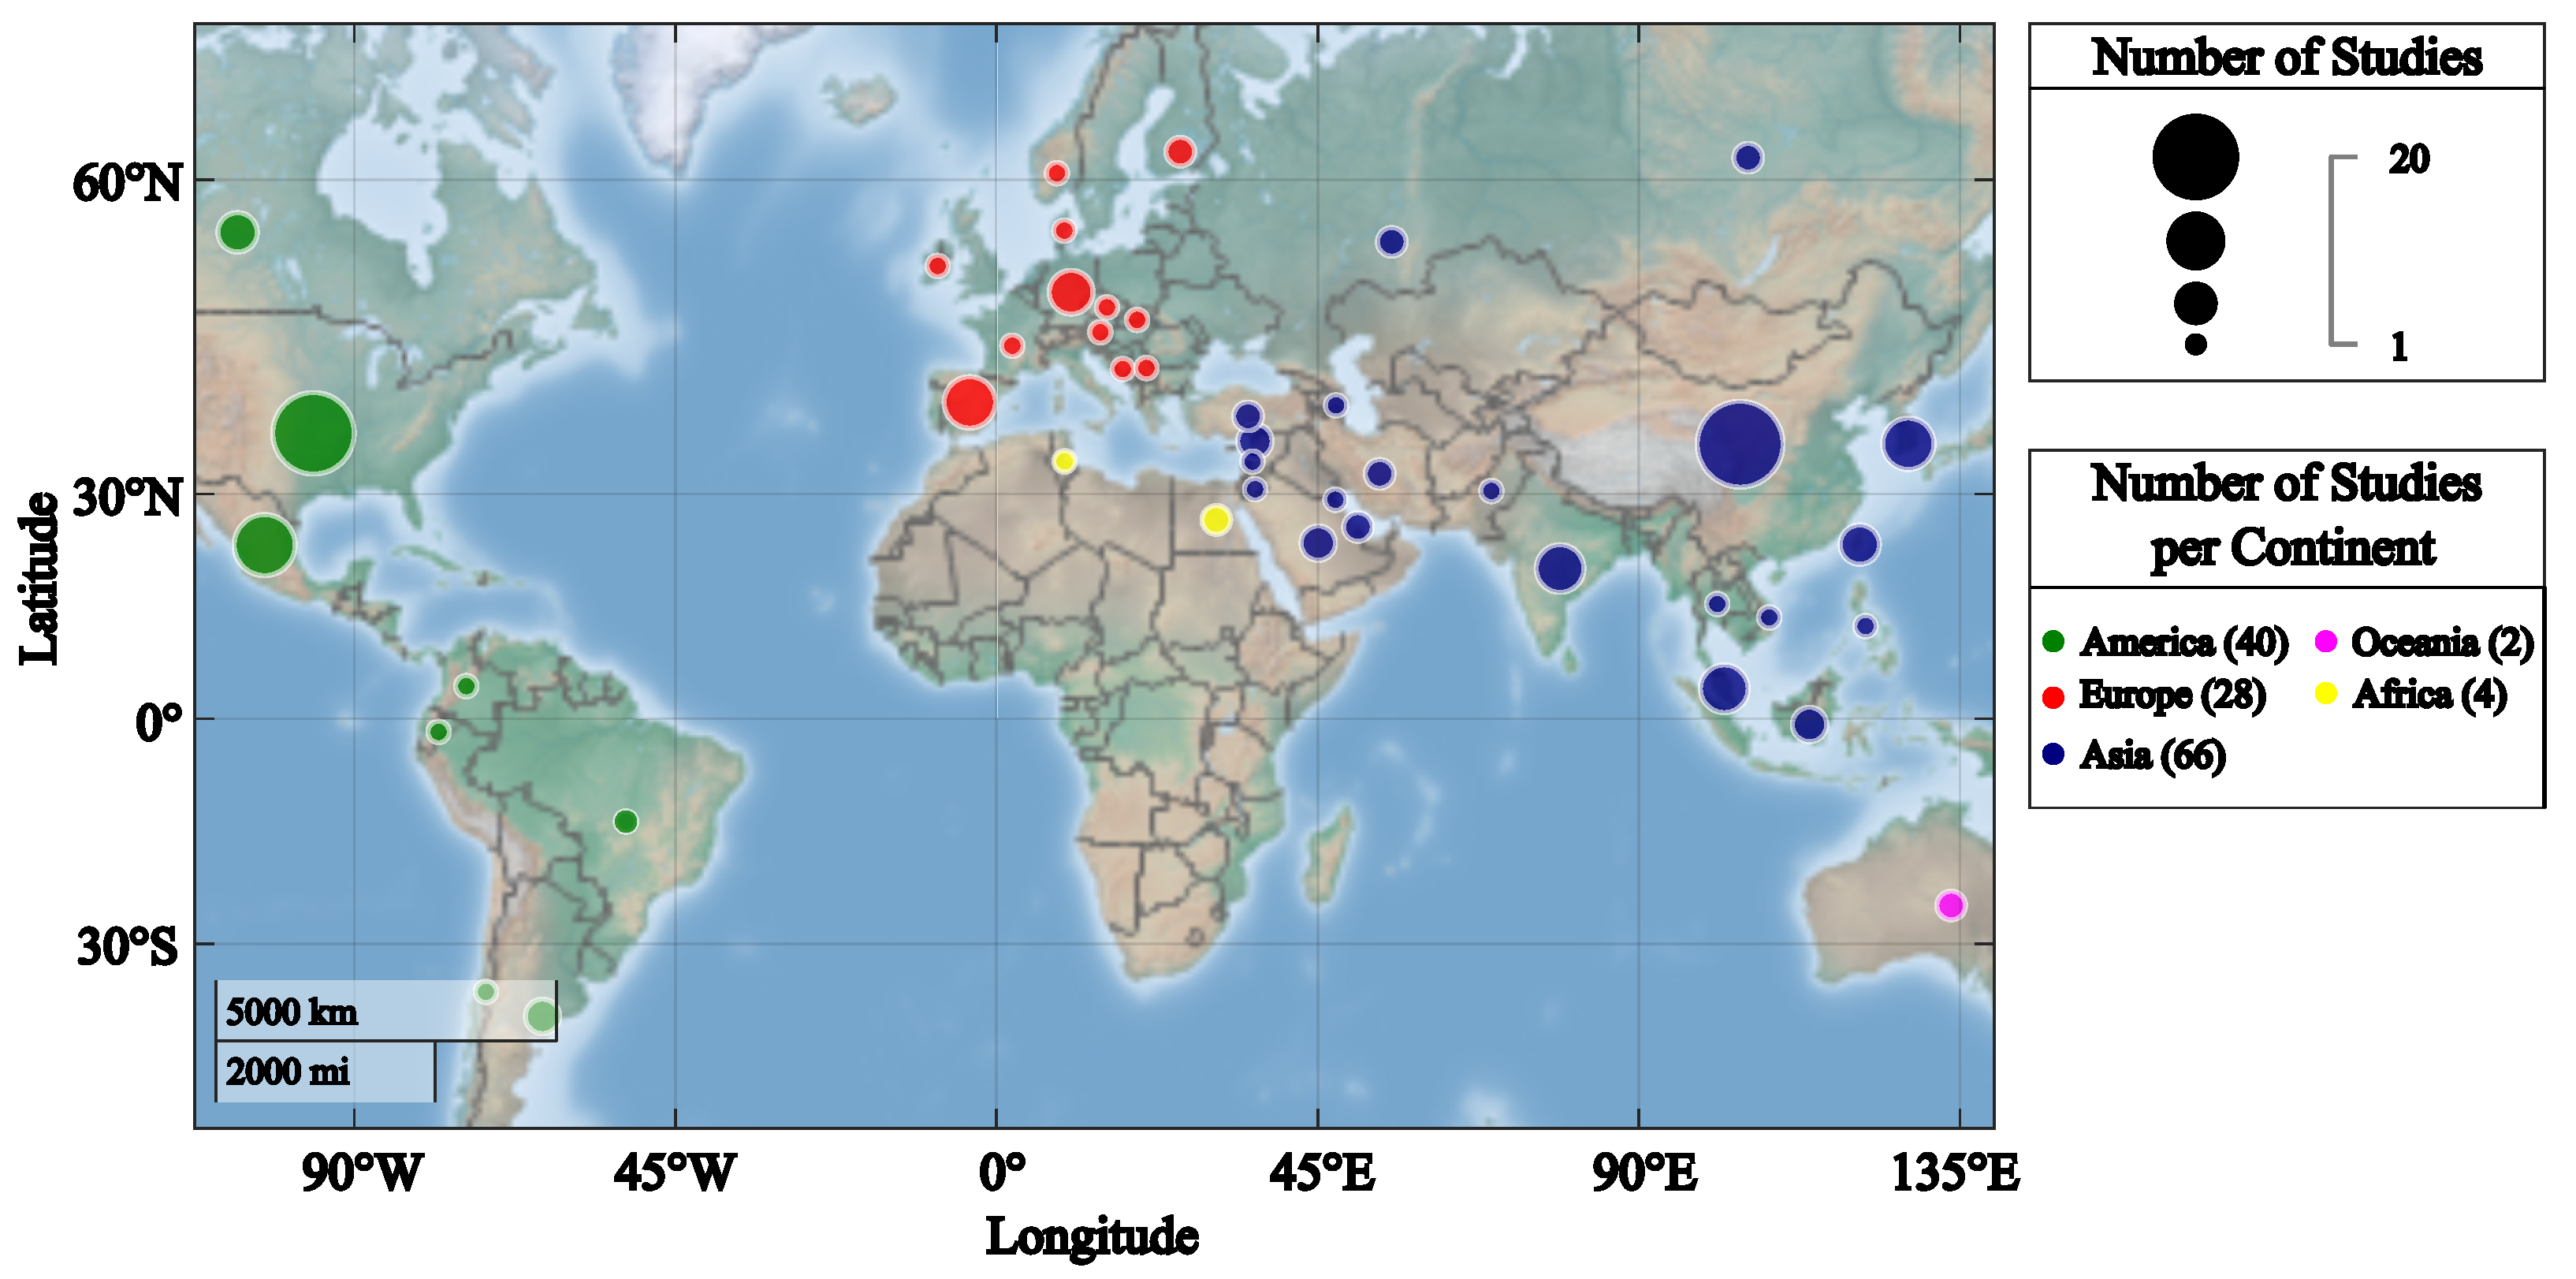
3.4. Geographical Distribution of the Included Studies
3.5. Literature Review
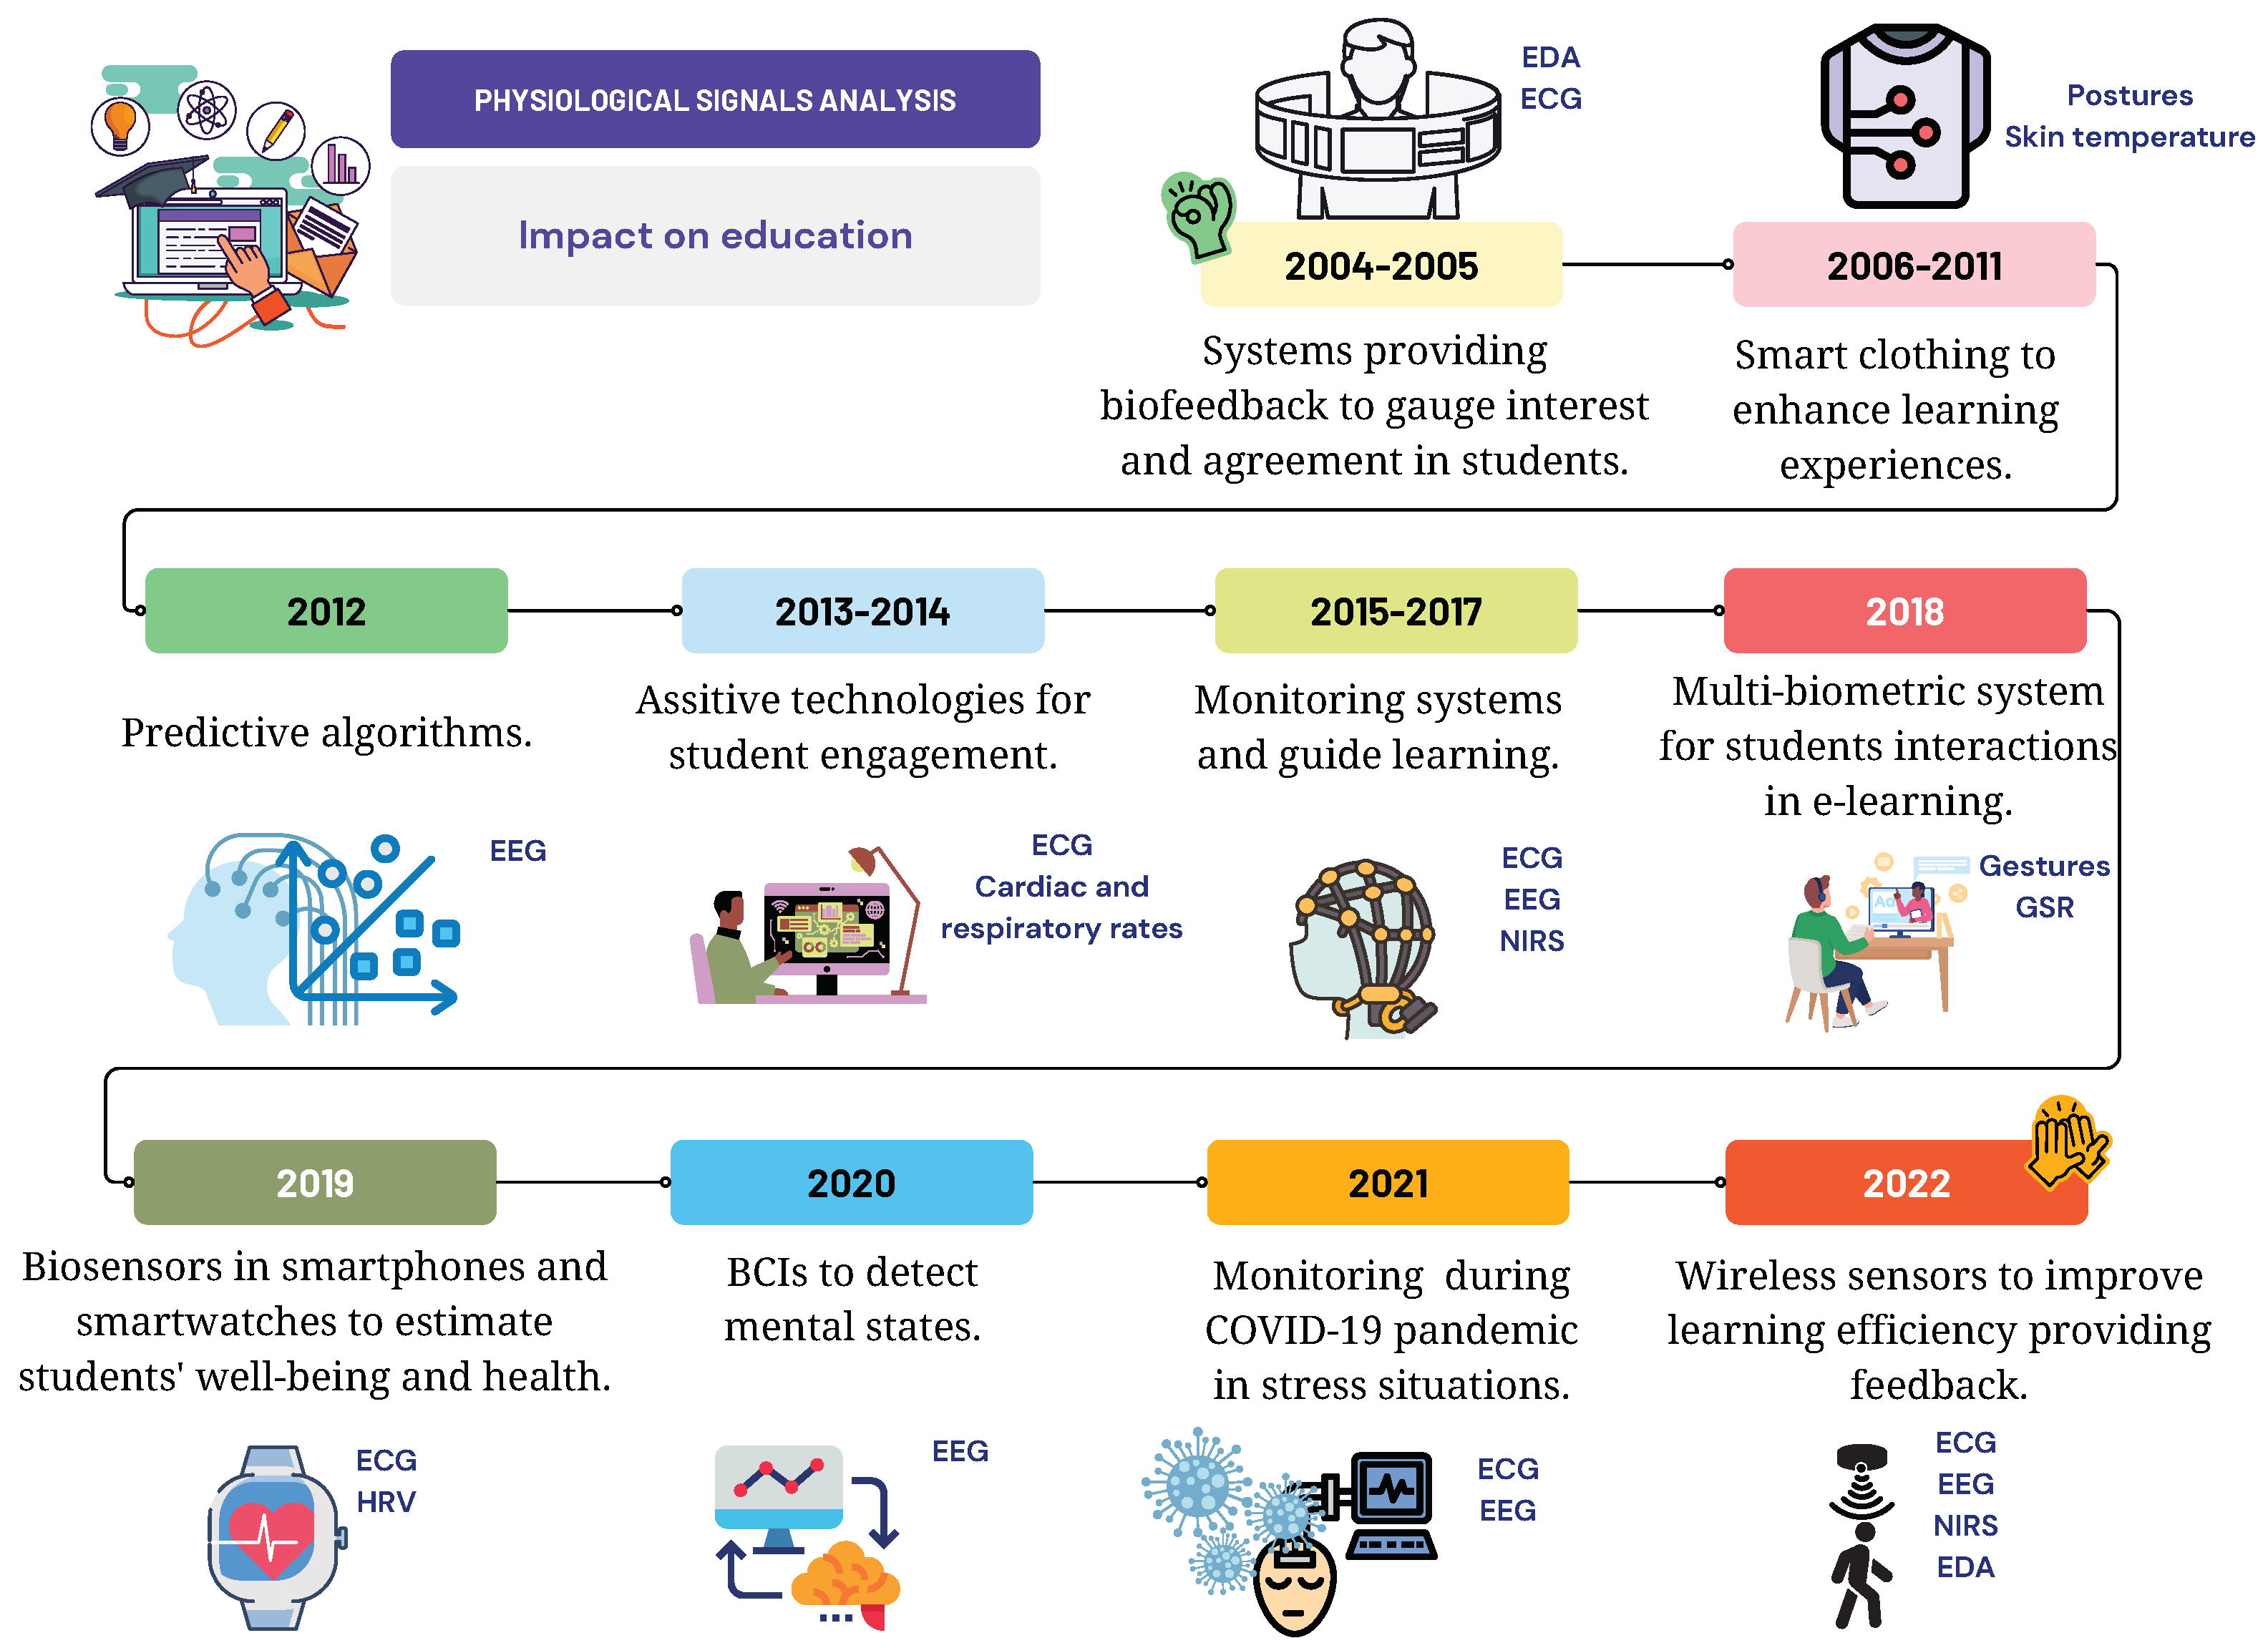
3.5.1. Evolution of WBT in Education
3.5.2. Solving Educational Problems with WBTs

3.5.3. Applications of WBTs in Education
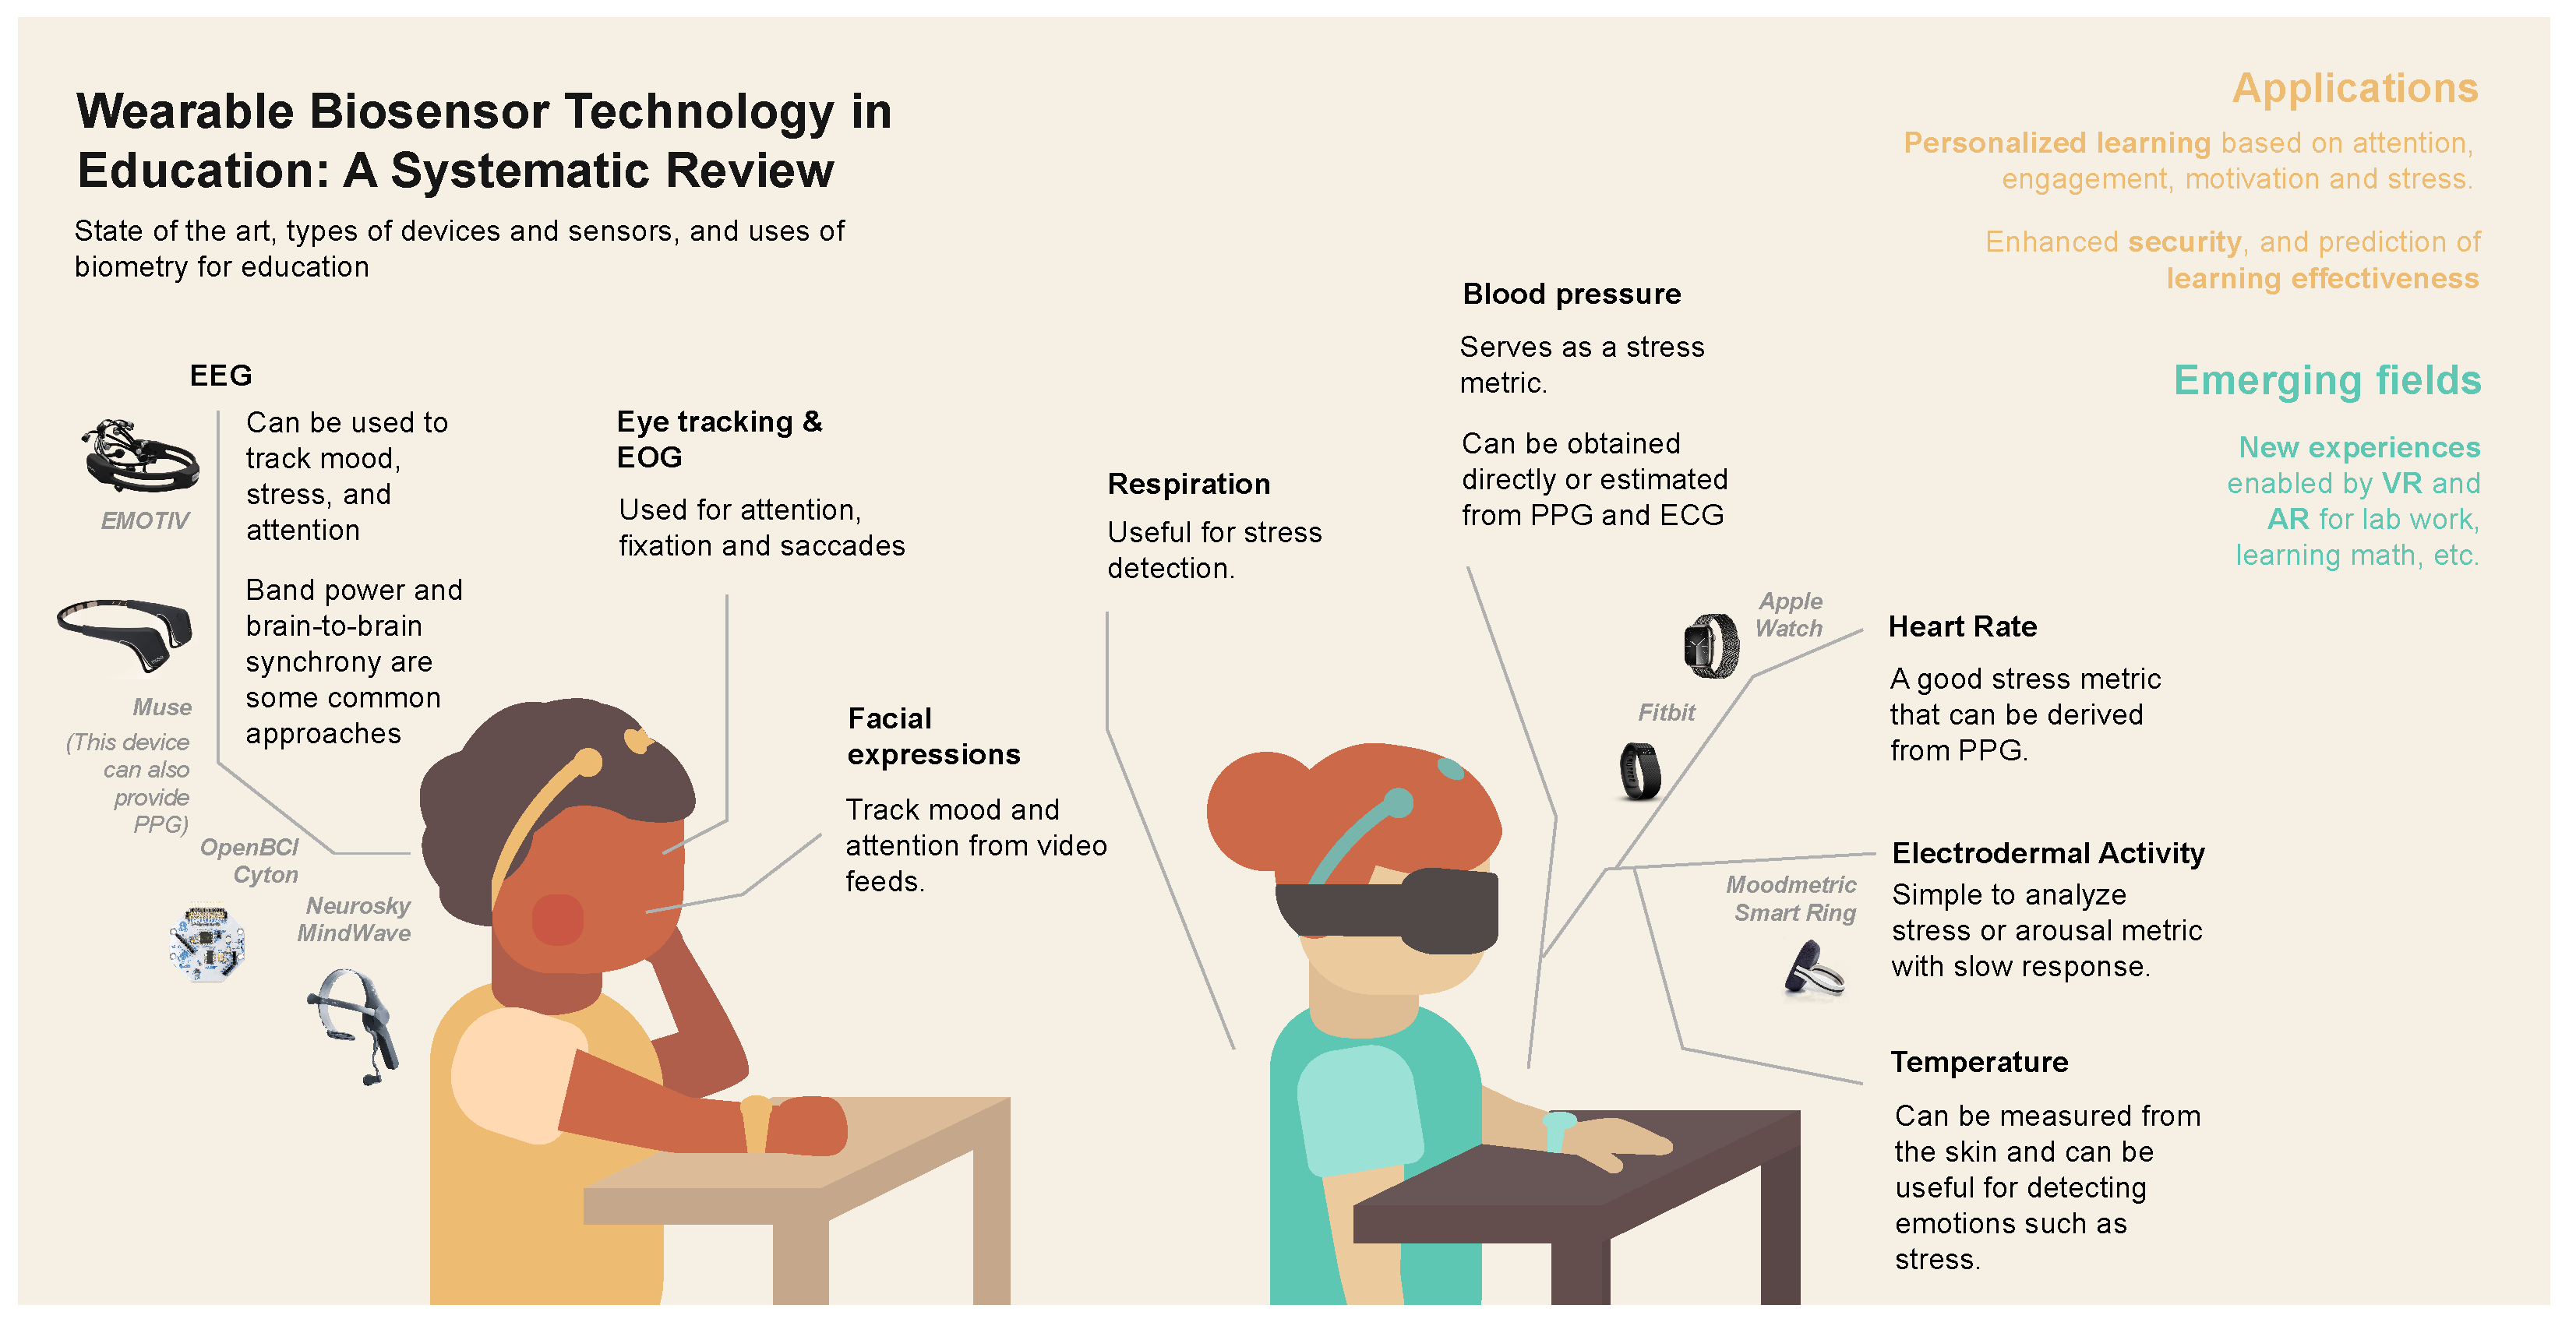
3.5.4. Sensors Used by WBTs in Education
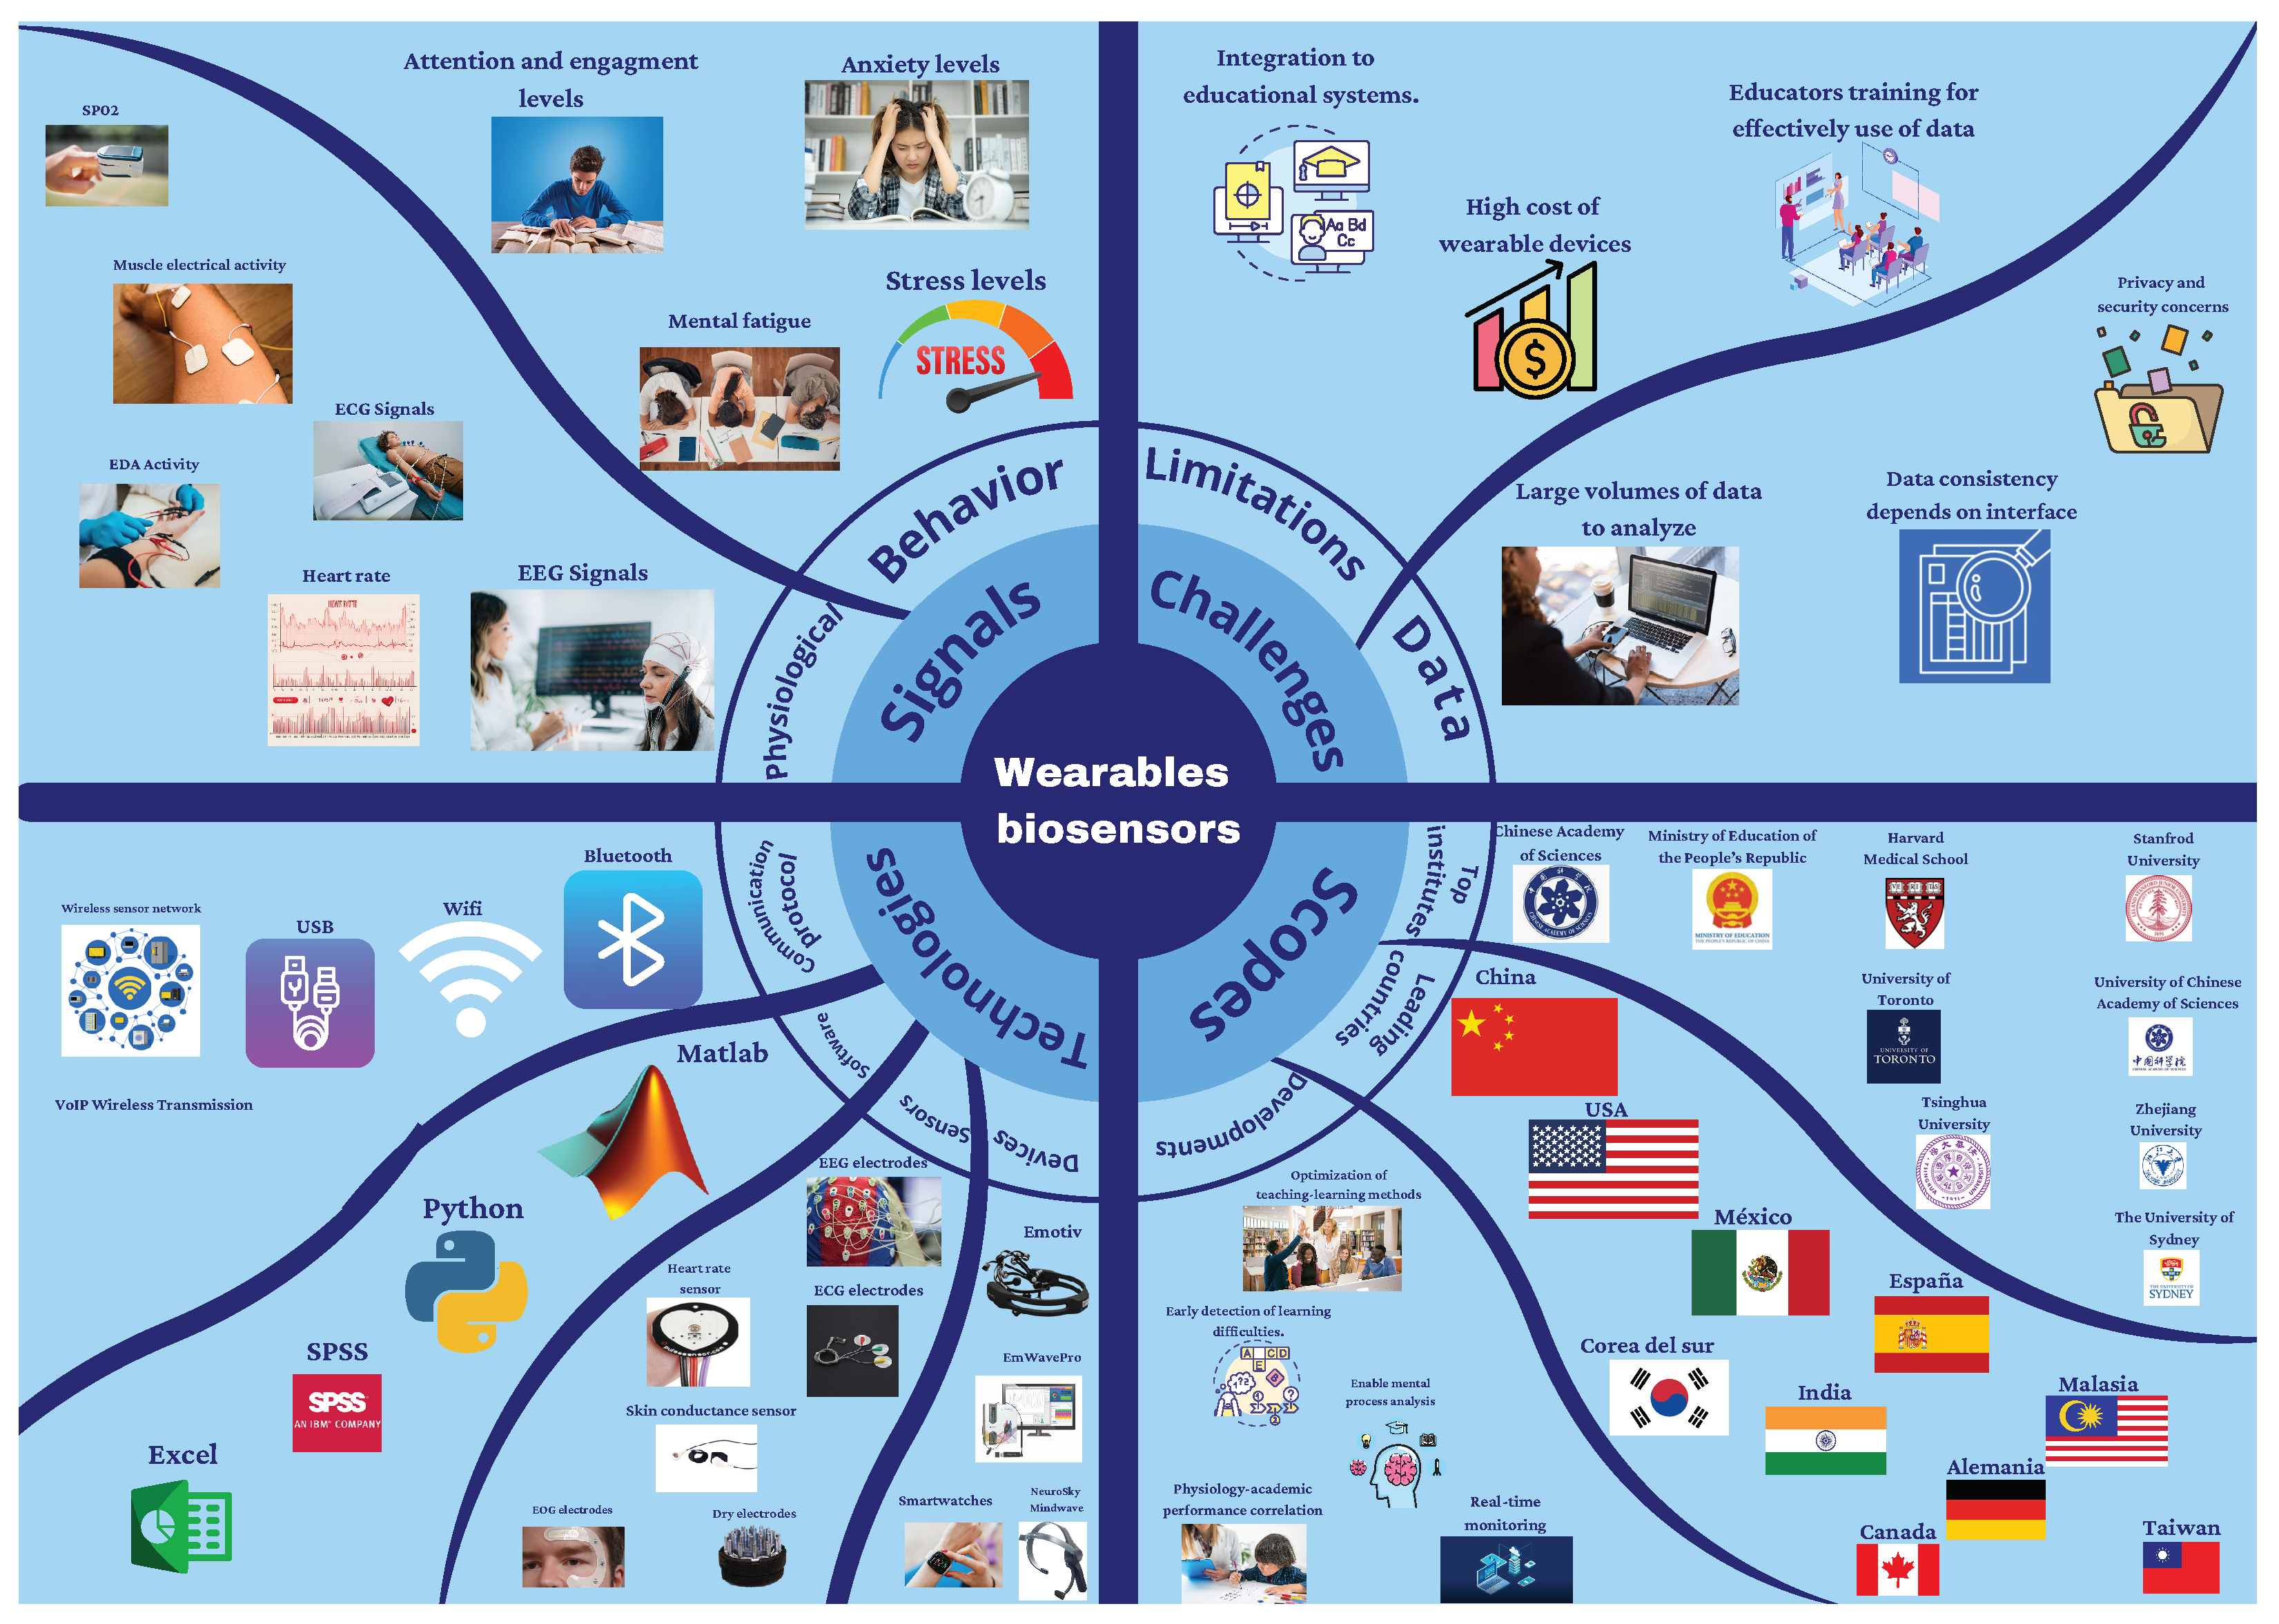
4. Discussion
4.1. Perspectives
4.2. Challenges and Trends
5. Conclusions
Author Contributions
Funding
Institutional Review Board Statement
Informed Consent Statement
Data Availability Statement
Acknowledgments
Conflicts of Interest
Abbreviations
| WBT | Wearable Biosensor Technology |
| VR | virtual reality |
| IoT | Internet of Things |
| CNS | Central Nervous System |
| NPM | neurophysiological measurement |
| EDA | electrodermal activity |
| GSR | galvanic skin response |
| ECG | electrocardiography |
| EEG | electroencephalography |
| EMG | electromyography |
| HRV | heart rate variability |
| ML | machine learning |
| B2B | brain-to-brain |
| STEM | Science Technology Engineering Mathematics |
| MSSQ | Medical Student Stressor Questionnaire |
| PSS | Perceived Stress Scale |
| BASC-S2 | Behavior Assessment System for Children |
| GARS-K | Global Assessment of Recent Stress |
| BCS | Balance of Challenge and Skill |
| MOM-tp | Momentary Test Performance |
| SPSS | Statistical Package for the Social Sciences |
| AR | augmented reality |
| COTS | Wearable Commercial-off-the-shelf |
| BCI | brain–computer interface |
| SVM | Support Vector Machine |
| IDDs | Intellectual and Developmental Disabilities |
| AI | artificial intelligence |
| MOOCs | Massive Open Online Courses |
| ST | skin temperature |
| PPG | photoplethysmography |
| NIRS | near-infrared spectroscopy |
| LDA | linear discriminant analysis |
| EOG | electrooculography |
| TRM | technology readiness models |
| BIDS | Brain Imaging Data Structure |
References
- Niknejad, N.; Ismail, W.B.; Mardani, A.; Liao, H.; Ghani, I. A comprehensive overview of smart wearables: The state of the art literature, recent advances, and future challenges. Eng. Appl. Artif. Intell. 2020, 90, 103529. [Google Scholar] [CrossRef]
- Blasco, J.; Chen, T.M.; Tapiador, J.; Peris-Lopez, P. A Survey of Wearable Biometric Recognition Systems. ACM Comput. Surv. 2016, 49. [Google Scholar] [CrossRef]
- Wu, M.; Luo, J. Wearable technology applications in healthcare: A literature review. Online J. Nurs. Inf. 2019, 23. Available online: https://www.himss.org/resources/wearable-technology-applications-healthcare-literature-review (accessed on 6 March 2024).
- John Dian, F.; Vahidnia, R.; Rahmati, A. Wearables and the Internet of Things (IoT), Applications, Opportunities, and Challenges: A Survey. IEEE Access 2020, 8, 69200–69211. [Google Scholar] [CrossRef]
- Fu, D.; Chen, L.; Cheng, Z. Integration of wearable smart devices and internet of things technology into public physical education. Mob. Inf. Syst. 2021, 2021, 6740987. [Google Scholar] [CrossRef]
- Markvicka, E.; Rich, S.; Liao, J.; Zaini, H.; Majidi, C. Low-cost wearable human–computer interface with conductive fabric for STEAM education. In Proceedings of the 2018 IEEE Integrated STEM Education Conference (ISEC), Princeton, NJ, USA, 10 March 2018; pp. 161–166. [Google Scholar]
- Khosravi, S.; Bailey, S.G.; Parvizi, H.; Ghannam, R. Wearable Sensors for Learning Enhancement in Higher Education. Sensors 2022, 22, 7633. [Google Scholar] [CrossRef]
- Ferrier, B.; Lee, J.; Mbuli, A.; James, D.A. Translational Applications of Wearable Sensors in Education: Implementation and Efficacy. Sensors 2022, 22, 1675. [Google Scholar] [CrossRef] [PubMed]
- Chu, S.L.; Garcia, B.M.; Rani, N. Research on Wearable Technologies for Learning: A Systematic Review. arXiv 2022, arXiv:2201.11878. [Google Scholar] [CrossRef]
- Kaufmann, H. Construct3D: An augmented reality application for mathematics and geometry education. In Proceedings of the tenth ACM International Conference on Multimedia, Juan-les-Pins, France, 1–6 December 2002; pp. 656–657. [Google Scholar]
- Al-Emran, M.; Saeed, R.; Al-Sharafi, M.A. What impacts learning with wearables? An integrated theoretical model. Interact. Learn. Environ. 2020, 30, 1897–1917. [Google Scholar] [CrossRef]
- Garcia, B.; Chu, S.L.; Nam, B.; Banigan, C. Wearables for Learning: Examining the Smartwatch as a Tool for Situated Science Reflection. In Proceedings of the CHI ’18: 2018 CHI Conference on Human Factors in Computing Systems, New York, NY, USA, 21 April 2018; pp. 1–13. [Google Scholar] [CrossRef]
- Zheng, H.; Genaro Motti, V. Assisting Students with Intellectual and Developmental Disabilities in Inclusive Education with Smartwatches. In Proceedings of the CHI ’18: 2018 CHI Conference on Human Factors in Computing Systems, New York, NY, USA, 21 April 2018; pp. 1–12. [Google Scholar] [CrossRef]
- Shapovalov, Y.B.; Bilyk, Z.I.; Usenko, S.A.; Shapovalov, V.B.; Postova, K.H.; Zhadan, S.O.; Antonenko, P.D. Harnessing personal smart tools for enhanced STEM education: Exploring IoT integration. Educ. Technol. Q. 2023, 2023, 210–232. [Google Scholar] [CrossRef]
- de Menendez, M.H.; Morales-Menendez, R.; Escobar, C.A.; Arinez, J. Biometric applications in education. Int. J. Interact. Des. Manuf. 2021, 15, 365–380. [Google Scholar] [CrossRef]
- Unar, J.; Seng, W.C.; Abbasi, A. A review of biometric technology along with trends and prospects. Pattern Recognit. 2014, 47, 2673–2688. [Google Scholar] [CrossRef]
- Bower, M.; Sturman, D. What are the educational affordances of wearable technologies? Comput. Educ. 2015, 88, 343–353. [Google Scholar] [CrossRef]
- Zhong, C.L.; le Li, Y. Internet of things sensors assisted physical activity recognition and health monitoring of college students. Measurement 2020, 159, 107774. [Google Scholar] [CrossRef]
- Zhang, X.; Shan, G.; Wang, Y.; Wan, B.; Li, H. Wearables, biomechanical feedback, and human motor-skills’ learning & optimization. Appl. Sci. 2019, 9, 226. [Google Scholar] [CrossRef]
- Francisti, J.; Balogh, Z.; Reichel, J.; Magdin, M.; Koprda, Š.; Molnár, G. Application Experiences Using IoT Devices in Education. Appl. Sci. 2020, 10, 7286. [Google Scholar] [CrossRef]
- Hernandez-Ortega, J.; Daza, R.; Morales, A.; Fierrez, J.; Ortega-Garcia, J. edBB: Biometrics and behavior for assessing remote education. arXiv 2019, arXiv:1912.04786. [Google Scholar]
- Mehmood, R.M.; Lee, H.J. Towards building a computer aided education system for special students using wearable sensor technologies. Sensors 2017, 17, 317. [Google Scholar] [CrossRef] [PubMed]
- Darvishi, A.; Khosravi, H.; Sadiq, S.W.; Weber, B. Neurophysiological Measurements in Higher Education: A Systematic Literature Review. Int. J. Artif. Intell. Educ. 2021, 32, 413–453. [Google Scholar] [CrossRef]
- Davidesco, I.; Matuk, C.; Bevilacqua, D.; Poeppel, D.; Dikker, S. Neuroscience research in the classroom: Portable brain technologies in education research. Educ. Res. 2021, 50, 649–656. [Google Scholar] [CrossRef]
- Battro, A.M.; Calero, C.I.; Goldin, A.P.; Holper, L.; Pezzatti, L.; Shalóm, D.E.; Sigman, M. The cognitive neuroscience of the teacher–student interaction. Mind, Brain, Educ. 2013, 7, 177–181. [Google Scholar] [CrossRef]
- Wu, S.F.; Lu, Y.L.; Lien, C.J. Detecting Students’ Flow States and Their Construct Through Electroencephalogram: Reflective Flow Experiences, Balance of Challenge and Skill, and Sense of Control. J. Educ. Comput. Res. 2021, 58, 1515–1540. [Google Scholar] [CrossRef]
- Cohen, S.S.; Madsen, J.; Touchan, G.; Robles, D.; Lima, S.F.; Henin, S.; Parra, L.C. Neural engagement with online educational videos predicts learning performance for individual students. Neurobiol. Learn. Mem. 2018, 155, 60–64. [Google Scholar] [CrossRef] [PubMed]
- Ramírez-Moreno, M.A.; Díaz-Padilla, M.; Valenzuela-Gómez, K.D.; Vargas-Martínez, A.; Tudón-Martínez, J.C.; Morales-Menendez, R.; Ramírez-Mendoza, R.A.; Pérez-Henríquez, B.L.; Lozoya-Santos, J.d.J. EEG-Based Tool for Prediction of University Students’ Cognitive Performance in the Classroom. Brain Sci. 2021, 11, 698. [Google Scholar] [CrossRef] [PubMed]
- Solhjoo, S.; Haigney, M.C.; McBee, E.; van Merrienboer, J.J.; Schuwirth, L.; Artino, A.R., Jr.; Battista, A.; Ratcliffe, T.A.; Lee, H.D.; Durning, S.J. Heart rate and heart rate variability correlate with clinical reasoning performance and self-reported measures of cognitive load. Sci. Rep. 2019, 9, 14668. [Google Scholar] [CrossRef] [PubMed]
- Kim, H.; Hong, T.; Kim, J.; Yeom, S. A psychophysiological effect of indoor thermal condition on college students’ learning performance through EEG measurement. Build. Environ. 2020, 184, 107223. [Google Scholar] [CrossRef]
- Villegas-Ch, W.; Román-Cañizares, M.; Palacios-Pacheco, X. Improvement of an online education model with the integration of machine learning and data analysis in an LMS. Appl. Sci. 2020, 10, 5371. [Google Scholar] [CrossRef]
- Gedam, S.; Paul, S. A review on mental stress detection using wearable sensors and machine learning techniques. IEEE Access 2021, 9, 84045–84066. [Google Scholar] [CrossRef]
- Kalantari, S.; Rounds, J.D.; Kan, J.; Tripathi, V.; Cruz-Garza, J.G. Comparing physiological responses during cognitive tests in virtual environments vs. in identical real-world environments. Sci. Rep. 2021, 11, 10227. [Google Scholar] [CrossRef] [PubMed]
- Kalantari, K.; Contreras-Vidal, J.L.; Smith, J.S.; Cruz-Garza, J.; Banner, P. Evaluating educational settings through biometric data and virtual response testing. ACADIA 2018, 118–125. [Google Scholar]
- Cruz-Garza, J.G.; Darfler, M.; Rounds, J.D.; Gao, E.; Kalantari, S. EEG-based investigation of the impact of room size and window placement on cognitive performance. J. Build. Eng. 2022, 53, 104540. [Google Scholar] [CrossRef]
- Dikker, S.; Wan, L.; Davidesco, I.; Kaggen, L.; Oostrik, M.; McClintock, J.; Rowland, J.; Michalareas, G.; Van Bavel, J.J.; Ding, M.; et al. Brain-to-brain synchrony tracks real-world dynamic group interactions in the classroom. Curr. Biol. 2017, 27, 1375–1380. [Google Scholar] [CrossRef]
- Bevilacqua, D.; Davidesco, I.; Wan, L.; Chaloner, K.; Rowland, J.; Ding, M.; Poeppel, D.; Dikker, S. Brain-to-brain synchrony and learning outcomes vary by student–teacher dynamics: Evidence from a real-world classroom electroencephalography study. J. Cogn. Neurosci. 2019, 31, 401–411. [Google Scholar] [CrossRef] [PubMed]
- Chen, C.M.; Wang, J.Y.; Yu, C.M. Assessing the attention levels of students by using a novel attention aware system based on brainwave signals. Br. J. Educ. Technol. 2017, 48, 348–369. [Google Scholar] [CrossRef]
- Holper, L.; Goldin, A.P.; Shalom, D.E.; Battro, A.M.; Wolf, M.; Sigman, M. The teaching and the learning brain: A cortical hemodynamic marker of teacher–student interactions in the Socratic dialog. Int. J. Educ. Res. 2013, 59, 1–10. [Google Scholar] [CrossRef]
- Moher, D.; Liberati, A.; Tetzlaff, J.; Altman, D.G. Preferred reporting items for systematic reviews and meta-analyses: The PRISMA statement. Int. J. Surg. 2010, 8, 336–341. [Google Scholar] [CrossRef] [PubMed]
- Pranckutė, R. Web of Science (WoS) and Scopus: The titans of bibliographic information in today’s academic world. Publications 2021, 9, 12. [Google Scholar] [CrossRef]
- Tripska, K.; Draessler, J.; Pokladnikova, J. Heart rate variability, perceived stress and willingness to seek counselling in undergraduate students. J. Psychosom. Res. 2022, 160, 110972. [Google Scholar] [CrossRef] [PubMed]
- Aranberri-Ruiz, A.; Aritzeta, A.; Olarza, A.; Soroa, G.; Mindeguia, R. Reducing Anxiety and Social Stress in Primary Education: A Breath-Focused Heart Rate Variability Biofeedback Intervention. Int. J. Environ. Res. Public Health 2022, 19. [Google Scholar] [CrossRef] [PubMed]
- Suh, M. The association of salivary alpha-amylase, heart rate variability, and psychological stress on objectively measured sleep behaviors among college students. Front. Nurs. 2022, 9, 63–70. [Google Scholar] [CrossRef]
- Siripongpan, A.; Namkunee, T.; Uthansakul, P.; Jumphoo, T.; Duangmanee, P. Stress among Medical Students Presented with an EEG at Suranaree University of Technology, Thailand. Health Psychol. Res. 2022, 10, 1–6. [Google Scholar] [CrossRef] [PubMed]
- Dong, J. Analysis of Emotional Stress of Teachers in Japanese Teaching Process Based on EEG Signal Analysis. Occup. Ther. Int. 2022, 2022, 2593338. [Google Scholar] [CrossRef] [PubMed]
- Lai, Y.H.; Su, K.; You, Y.Q.; Liang, Y.X.; Lan, L.; Lee, M.H.; Huang, F.; Chen, D.Q. Development of Arduino Based ECG Device for STEM Education and HRV Applications. In Proceedings of the 2022 8th International Conference on Control, Automation and Robotics (ICCAR), Xiamen, China, 8–10 April 2022; Institute of Electrical and Electronics Engineers Inc.: Xiamen, China, 2022; pp. 329–333. [Google Scholar] [CrossRef]
- Liu, L.; Ji, Y.; Gao, Y.; Li, T.; Xu, W. A Novel Stress State Assessment Method for College Students Based on EEG. Comput. Intell. Neurosci. 2022, 2022, 4565968. [Google Scholar] [CrossRef] [PubMed]
- Bi, Y. The Application of Wireless Sensor Technology of Internet of Things in Korean Language Teaching. Wirel. Commun. Mob. Comput. 2022, 2022, 7476225. [Google Scholar] [CrossRef]
- Ma, X. Teaching Mode of Augmented Reality College English Listening and Speaking Supported by Wearable Technology. Wirel. Commun. Mob. Comput. 2022, 2022, 2181512. [Google Scholar] [CrossRef]
- Brown, W.J.; Kinshuk, K. Improving simulation-based healthcare education through human actors, wearable, and web-based technology. In Proceedings of the 2022 International Conference on Advanced Learning Technologies (ICALT), Bucharest, Romania, 1–4 July 2022; pp. 411–413. [Google Scholar] [CrossRef]
- Cao, Y. Exploration, Analysis, and Practice of Sensor English Teaching Based on Immersive Augmented Reality Technology. Mob. Inf. Syst. 2022, 2022, 4494448. [Google Scholar] [CrossRef]
- Yoo, H.H.; Yune, S.J.; Im, S.J.; Kam, B.S.; Lee, S.Y. Heart Rate Variability-Measured Stress and Academic Achievement in Medical Students. Med Princ. Pract. 2021, 30, 193–200. [Google Scholar] [CrossRef] [PubMed]
- Yin, S.; Zhang, D.; Zhang, D.; Li, H. Wireless sensors application in smart English classroom design based on artificial intelligent system. Microprocess. Microsyst. 2021, 81, 103798. [Google Scholar] [CrossRef]
- Durán-Acevedo, C.M.; Carrillo-Gómez, J.K.; Albarracín-Rojas, C.A. Electronic devices for stress detection in academic contexts during confinement because of the COVID-19 pandemic. Electronics 2021, 10, 301. [Google Scholar] [CrossRef]
- Wu, J.; Zhang, Y.; Zhao, X. Stress Detection Using Wearable Devices based on Transfer Learning. In Proceedings of the 2021 IEEE International Conference on Bioinformatics and Biomedicine (BIBM), Houston, TX, USA, 9–12 December 2021; pp. 3122–3128. [Google Scholar] [CrossRef]
- Yufei, W.; Dandan, W.; Yanwei, Z. Research on the Advantages of Digital Sensor Equipment in Language Audio-Visual and Oral Teaching. J. Sens. 2021, 2021, 3006397. [Google Scholar] [CrossRef]
- Jiang, S.; Wang, L.; Dong, Y. Application of Virtual Reality Human–Computer Interaction Technology Based on the Sensor in English Teaching. J. Sens. 2021, 2021, 2505119. [Google Scholar] [CrossRef]
- Komaini, A.; Hidayat, H.; Ganefri; Alnedra.; Kiram, Y.; Gusril.; Mario, D.T. Motor Learning Measuring Tools: A Design And Implementation Using Sensor Technology For Preschool Education. Int. J. Interact. Mob. Technol. 2021, 15, 177–191. [Google Scholar] [CrossRef]
- Rajendran, V.; Jayalalitha, S.; Adalarasu, K. EEG Based Evaluation of Examination Stress and Test Anxiety Among College Students. IRBM 2022, 43, 349–361. [Google Scholar] [CrossRef]
- Labayen, M.; Vea, R.; Florez, J.; Aginako, N.; Sierra, B. Online Student Authentication and Proctoring System Based on Multimodal Biometrics Technology. IEEE Access 2021, 9, 72398–72411. [Google Scholar] [CrossRef]
- Ciolacu, M.L.; Tehrani, A.F.; Svasta, P.; Tache, I.; Stoichescu, D. Education 4.0: An Adaptive Framework with Artificial Intelligence, Raspberry Pi and Wearables-Innovation for Creating Value. In Proceedings of the 2020 IEEE 26th International Symposium for Design and Technology in Electronic Packaging, SIITME 2020-Conference Proceedings, Pitesti, Romania, 21–24 October 2020; pp. 298–303. [Google Scholar] [CrossRef]
- Kumari, P.; Deb, S. EEG Cross Validation of Effective Mobile Technology by Analyzing Attention Level in Classroom. In Proceedings of the International Conference on Electronics and Sustainable Communication Systems, ICESC, Coimbatore, India, 2–4 July 2020; pp. 961–965. [Google Scholar] [CrossRef]
- Tyas, A.E.; Dharma Wibawa, A.; Purnomo, M.H. Theta, Alpha and Beta Activity in the Occipital Based on EEG Signals for Mental Fatigue in High School Students. In Proceedings of the ICoSTA 2020: 2020 International Conference on Smart Technology and Applications: Empowering Industrial IoT by Implementing Green Technology for Sustainable Development, Surabaya, Indonesia, 20 February 2020. [Google Scholar] [CrossRef]
- Rustamova, T.V. Influence of examination stress on eeg amplitude in the cerebral sphere of the brain of students of the faculty of biology-chemistry with different individual typological features. Sib. J. Life Sci. Agric. 2020, 12, 97–112. [Google Scholar] [CrossRef]
- Bos, A.S.; Herpich, F.; Kuhn, I.; Guarese, R.L.; Tarouco, L.M.; Zaro, M.A.; Pizzato, M.; Wives, L. Educational Technology and Its Contributions in Students’ Focus and Attention Regarding Augmented Reality Environments and the Use of Sensors. J. Educ. Comput. Res. 2019, 57, 1832–1848. [Google Scholar] [CrossRef]
- Jiang, J.Y.; Chao, Z.; Bertozzi, A.L.; Wang, W.; Young, S.D.; Needell, D. Learning to predict human stress level with incomplete sensor data from wearable devices. In Proceedings of the International Conference on Information and Knowledge Management, Proceedings, Beijing, China, 3–7 November 2019; pp. 2773–2781. [Google Scholar] [CrossRef]
- Hasanbasic, A.; Spahic, M.; Bosnjic, D.; Adzic, H.H.; Mesic, V.; Jahic, O. Recognition of stress levels among students with wearable sensors. In Proceedings of the 2019 18th International Symposium INFOTEH-JAHORINA, INFOTEH 2019-Proceedings, East Sarajevo, Bosnia and Herzegovina, 20–22 March 2019; pp. 20–22. [Google Scholar] [CrossRef]
- Hafeez, M.A.; Shakil, S.; Jangsher, S. Stress Effects on Exam Performance using EEG. In Proceedings of the 2018 14th International Conference on Emerging Technologies (ICET), Islamabad, Pakistan, 21–22 November 2018. [Google Scholar] [CrossRef]
- Kajasilta, H.; Apiola, M.V.; Lokkila, E.; Veerasamy, A.; Laakso, M.J. Measuring Students’ Stress with Mood Sensors: First Findings; Springer International Publishing: Cham, Switzerland, 2019; Volume 11841 LNCS, pp. 92–99. [Google Scholar] [CrossRef]
- Gasah, M.; Baharum, A.; Zain, N. Measure learning effectiveness among children using EEG device and mobile application. Indones. J. Electr. Eng. Comput. Sci. 2019, 17, 191–196. [Google Scholar] [CrossRef]
- Hammoud, S.; Karam, R.; Mourad, R.; Saad, I.; Kurdi, M. Stress and heart rate variability during university final examination among Lebanese students. Behav. Sci. 2019, 9, 3. [Google Scholar] [CrossRef] [PubMed]
- Oweis, K.; Quteishat, H.; Zgoul, M.; Haddad, A. A Study on the Effect of Sports on Academic Stress Using Wearable Galvanic Skin Response. In Proceedings of the 2018 12th International Symposium on Medical Information and Communication Technology (ISMICT), Sydney, NSW, Australia, 26–28 March 2018; Volume 2018. [Google Scholar] [CrossRef]
- Zhai, X.; Fang, Q.; Dong, Y.; Wei, Z.; Yuan, J.; Cacciolatti, L.; Yang, Y. The effects of biofeedback-based stimulated recall on self-regulated online learning: A gender and cognitive taxonomy perspective. J. Comput. Assist. Learn. 2018, 34, 775–786. [Google Scholar] [CrossRef]
- Li, Z.L. Analysis of psychological health status of college students under examination stress based on EEG neuroscience. Kuram Ve Uygulamada Egit. Bilim. 2018, 18, 1547–1557. [Google Scholar] [CrossRef]
- Hunasgi, S.; Koneru, A.; Rudraraju, A.; Manvikar, V.; Vanishree, M. Stress recognition in dental students using smartphone sensor and a software: A pilot study. J. Oral Maxillofac. Pathol. 2018, 22, 314–317. [Google Scholar] [CrossRef] [PubMed]
- Horgan, K.; Howard, S.; Gardiner-Hyland, F. Pre-service Teachers and Stress During Microteaching: An Experimental Investigation of the Effectiveness of Relaxation Training with Biofeedback on Psychological and Physiological Indices of Stress. Appl. Psychophysiol. Biofeedback 2018, 43, 217–225. [Google Scholar] [CrossRef] [PubMed]
- Pérez, F.d.A.; Santos-Gago, J.M.; Caeiro-Rodríguez, M.; Fernández Iglesias, M.J. Evaluation of commercial-off-the-shelf wrist wearables to estimate stress on students. J. Vis. Exp. 2018, 2018, e57590. [Google Scholar] [CrossRef]
- Chen, X.J.; Niu, Y.F.; Ding, F.Q.; Xue, C.Q. Application of electroencephalogram physiological experiment in interface design teaching: A case study of visual cognitive errors. Kuram Uygulamada Egit. Bilim. 2018, 18, 2306–2324. [Google Scholar] [CrossRef]
- Engen, B.K.; GiÆver, T.H.; Mifsud, L. Wearable technologies in the K-12 classroom–Cross-disciplinary possibilities and privacy pitfalls. J. Interact. Learn. Res. 2018, 29, 323–341. [Google Scholar]
- Polo, A.; Guillot, J.; Calle, M.; Sarmiento, J. Monitoreo del estrés estudiantil durante la realización de un examen académico: Caso de Estudio utilizando dispositivos wearables. In Proceedings of the LACCEI International Multi-Conference for Engineering, Education and Technology, Lima, Perú, 18–20 July 2018; pp. 19–21. [Google Scholar] [CrossRef]
- Miao, R.; Dong, Q.; Weng, W.Y.; Yu, X.Y. The Application Model of Wearable Devices in Physical Education. In Blended Learning. Enhancing Learning Success; Lecture Notes in Computer Science (including subseries Lecture Notes in Artificial Intelligence and Lecture Notes in Bioinformatics); Springer: Cham, Switzerland, 2018; Volume 10949 LNCS, pp. 311–322. [Google Scholar] [CrossRef]
- Kara, E.; Güleç, M.; Çağıltay, K. Teaching concepts with wearable technology: Learning internal body organs. In Universal Access in Human–Computer Interaction. Methods, Technologies, and Users; Lecture Notes in Computer Science (including subseries Lecture Notes in Artificial Intelligence and Lecture Notes in Bioinformatics); Springer: Cham, Switzerland, 2018; Volume 10907 LNCS, pp. 542–550. [Google Scholar] [CrossRef]
- Bauer, M.; Bräuer, C.; Schuldt, J.; Krömker, H. Adaptive E-learning technologies for sustained learning motivation in engineering science acquisition of motivation through self-reports and wearable technology. In Proceedings of the 10th International Conference on Computer Supported Education, CSEDU, Madeira, Portugal, 15–17 March 2018; Volume 1, pp. 418–425. [Google Scholar] [CrossRef]
- Pavlova, L.P.; Berlov, D.N.; Kurismaa, A. Dominant and opponent relations in cortical function: An EEG study of exam performance and stress. AIMS Neurosci. 2018, 5, 32–35. [Google Scholar] [CrossRef] [PubMed]
- Dafoulas, G.A.; Maia, C.C.; Clarke, J.S.; Ali, A.; Augusto, J. Investigating the role of biometrics in education–The use of sensor data in collaborative learning. MCCSIS 2018–Multi Conference on Computer Science and Information Systems. In Proceedings of the International Conferences on e-Learning 2018, international association for development of the information society (IADIS), Madrid, Spain, 17–19 July 2018; pp. 115–123. [Google Scholar]
- Thomas, L. Student Retention in Higher Education: The Role of Institutional Habitus. J. Educ. Policy 2002, 17, 423–442. [Google Scholar] [CrossRef]
- de Arriba Pérez, F.; Santos Gago, J.; Caeiro Rodríguez, M. Analytics of biometric data from wearable devices to support teaching and learning activities. J. Inf. Syst. Eng. Manag. 2016, 1, 41–54. [Google Scholar] [CrossRef]
- Fesol, S.; Salam, S.; Bakar, N. Framework for enhancing learning experience with wearable technology in technical MOOC. J. Telecommun. Electron. Comput. Eng. 2018, 10, 83–91. [Google Scholar]
- Cirett Galán, F.; Beal, C.R. EEG estimates of engagement and cognitive workload predict math problem solving outcomes. In User Modeling, Adaptation, and Personalization; Lecture Notes in Computer Science (including subseries Lecture Notes in Artificial Intelligence and Lecture Notes in Bioinformatics); Springer: Cham, Switzerland, 2012; Volume 7379 LNCS, pp. 51–62. [Google Scholar] [CrossRef]
- Zheng, H.; Motti, V.G. Assisting students with intellectual and developmental disabilities in inclusive education with Smartwatches. In Proceedings of the Conference on Human Factors in Computing Systems–Proceeding, Montreal, QC, Canada, 21–26 April 2018. [Google Scholar]
- Fenu, G.; Marras, M.; Boratto, L. A multi-biometric system for continuous student authentication in e-learning platforms. Pattern Recognit. Lett. 2018, 113, 83–92. [Google Scholar] [CrossRef]
- Ciolacu, M.I.; Binder, L.; Popp, H. Enabling IoT in Education 4.0 with BioSensors from Wearables and Artificial Intelligence. In Proceedings of the 2019 IEEE 25th International Symposium for Design and Technology in Electronic Packaging (SIITME), Cluj-Napoca, Romania, 23–26 October 2019; pp. 17–24. [Google Scholar] [CrossRef]
- Apicella, A.; Arpaia, P.; Frosolone, M.; Improta, G.; Moccaldi, N.; Pollastro, A. EEG-based measurement system for monitoring student engagement in learning 4.0. Sci. Rep. 2022, 12, 5857. [Google Scholar] [CrossRef] [PubMed]
- Balamurugan, B.; Mullai, M.; Soundararajan, S.; Selvakanmani, S.; Arun, D. Brain–computer interface for assessment of mental efforts in e-learning using the nonmarkovian queueing model. Comput. Appl. Eng. Educ. 2020, 29, 394–410. [Google Scholar] [CrossRef]
- Poulsen, A.T.; Kamronn, S.; Dmochowski, J.; Parra, L.C.; Hansen, L.K. EEG in the classroom: Synchronised neural recordings during video presentation. Sci. Rep. 2017, 7, 43916. [Google Scholar] [CrossRef] [PubMed]
- Babiker, A.; Faye, I.; Mumtaz, W.; Malik, A.S.; Sato, H. EEG in classroom: EMD features to detect situational interest of students during learning. Multimed. Tools Appl. 2018, 78, 16261–16281. [Google Scholar] [CrossRef]
- Ramírez-Moreno, M.A.; Cruz-Garza, J.G.; Acharya, A.; Chatufale, G.; Witt, W.; Gelok, D.; Reza, G.; Contreras-Vidal, J.L. Brain-to-brain communication during musical improvisation: A performance case study. F1000Research 2022, 11, 989. [Google Scholar] [CrossRef] [PubMed]
- Kim, H.; Chae, Y.; Kim, S.; Im, C.H. Development of a Computer-Aided Education System Inspired by Face-to-Face Learning by Incorporating EEG-Based Neurofeedback Into Online Video Lectures. IEEE Trans. Learn. Technol. 2022, 16, 78–91. [Google Scholar] [CrossRef]
- Almusawi, H.A.; Durugbo, C.M.; Bugawa, A.M. Wearable Technology in Education: A Systematic Review. IEEE Trans. Learn. Technol. 2021, 14, 540–554. [Google Scholar] [CrossRef]
- Bustos-López, M.; Cruz-Ramírez, N.; Guerra-Hernández, A.; Sánchez-Morales, L.N.; Cruz-Ramos, N.A.; Alor-Hernández, G. Wearables for Engagement Detection in Learning Environments: A Review. Biosensors 2022, 12, 509. [Google Scholar] [CrossRef] [PubMed]
- Candela-Leal, M.; García-Briones, J.; Olivas, G.; Abrego-Ramos, R.; Álvarez Espinoza, G.; Botin, D.; Rodríguez-Hernández, K.; Pachego-Quintana, J.; Sampogna-Montemayor, S.; Morales-Menendez, R.; et al. Real-time Biofeedback System for Interactive Learning using Wearables and IoT. In Proceedings of the International Conference on Industrial Engineering and Operations Management Monterrey, Monterrey, Mexico, 3–5 November 2021. [Google Scholar]
- Miao, R.; Dong, Q.; Weng, W.Y.; Yu, X.Y. The Application Model of Wearable Devices in Physical Education. In Proceedings of the Blended Learning. Enhancing Learning Success, Osaka, Japan, 31 July–2 August 2018; Cheung, S.K., Kwok, L.f., Kubota, K., Lee, L.K., Tokito, J., Eds.; Springer: Cham, Switzerland, 2018; pp. 311–322. [Google Scholar]
- Dafoulas, G.; Cardoso Maia, C.; Samuels-Clarke, J.; Ali, A.; Augusto, J.C. Investigating the role of biometrics in education—the use of sensor data in collaborative learning. In Proceedings of the International Conference e-Learning, Madrid, Spain, 17–19 July 2018. [Google Scholar]
- de J Lozoya-Santos, J.; Ramírez-Moreno, M.A.; Diaz-Armas, G.G.; Acosta-Soto, L.F.; Leal, M.O.C.; Abrego-Ramos, R.; Ramirez-Mendoza, R.A. Current and Future Biometrics: Technology and Applications. In Biometry; CRC Press: Boca Raton, FL, USA, 2022; pp. 1–30. [Google Scholar]
- Papousek, I.; Wimmer, S.; Lackner, H.K.; Schulter, G.; Perchtold, C.M.; Paechter, M. Trait positive affect and students’ prefrontal EEG alpha asymmetry responses during a simulated exam situation. Biol. Psychol. 2019, 148, 107762. [Google Scholar] [CrossRef] [PubMed]
- Zennifa, F.; Ide, J.; Noguchi, Y.; Iramina, K. Monitoring of cognitive state on mental retardation child using EEG, ECG and NIRS in four years study. In Proceedings of the 2015 37th Annual International Conference of the IEEE Engineering in Medicine and Biology Society (EMBC), Milan, Italy, 25–29 August 2015; pp. 6610–6613. [Google Scholar]
- Martínez, G.O.; Leal, M.O.C.; Alvarado, J.C.O.; Soto, L.F.A.; Sanabria, D.M.B.; Armas, G.G.D.; Herrera, A.J.A.; Jiménez, E.A.D.; Espinosa, M.A.; Moreno, M.A.R.; et al. Detection of Engineering Interest in Children Through an Intelligent System Using Biometric Signals. In Proceedings of the International Conference on Industrial Engineering and Operations Management, Monterrey, Mexico, 3–5 November 2021; pp. 3–5. [Google Scholar]
- Ramírez-Moreno, M.A.; Carrillo-Tijerina, P.; Candela-Leal, M.O.; Alanis-Espinosa, M.; Tudón-Martínez, J.C.; Roman-Flores, A.; Ramírez-Mendoza, R.A.; Lozoya-Santos, J.d.J. Evaluation of a fast test based on biometric signals to assess mental fatigue at the workplace—A pilot study. Int. J. Environ. Res. Public Health 2021, 18, 11891. [Google Scholar] [CrossRef] [PubMed]
- Posada-Quintero, H.F.; Bolkhovsky, J.B. Machine learning models for the identification of cognitive tasks using autonomic reactions from heart rate variability and electrodermal activity. Behav. Sci. 2019, 9, 45. [Google Scholar] [CrossRef] [PubMed]
- Ramírez-Moreno, M.; Díaz-Padilla, M.; Valenzuela-Gómez, K.; Vargas-Martínez, A.; Roman-Flores, A.; Morales-Menendez, R.; Ramírez-Mendoza, R.; Lozoya-Santos, J. Advanced Learning Assistant System (ALAS) for Engineering Education. In Proceedings of the 2020 IEEE Global Engineering Education Conference (EDUCON), Porto, Portugal, 27–30 April 2020; pp. 1858–1861. [Google Scholar]
- Aguilar-Herrera, A.J.; Delgado-Jiménez, E.A.; Candela-Leal, M.O.; Olivas-Martinez, G.; Álvarez-Espinosa, G.J.; Ramírez-Moreno, M.A.; de Jesús Lozoya-Santos, J.; Ramírez-Mendoza, R.A. Advanced Learner Assistance System’s (ALAS) Recent Results. In Proceedings of the 2021 Machine Learning-Driven Digital Technologies for Educational Innovation Workshop, Monterrey, Mexico, 15–17 December 2021; pp. 1–7. [Google Scholar]
- Ko, L.W.; Komarov, O.; Hairston, W.D.; Jung, T.P.; Lin, C.T. Sustained attention in real classroom settings: An EEG study. Front. Hum. Neurosci. 2017, 11, 388. [Google Scholar] [CrossRef] [PubMed]
- Cruz-Garza, J.G.; Sujatha Ravindran, A.; Kopteva, A.E.; Rivera Garza, C.; Contreras-Vidal, J.L. Characterization of the stages of creative writing with mobile eeg using generalized partial directed coherence. Front. Hum. Neurosci. 2020, 14, 577651. [Google Scholar] [CrossRef] [PubMed]
- Kerdawy, M.E.; Halaby, M.E.; Hassan, A.; Maher, M.; Fayed, H.; Shawky, D.; Badawi, A. The Automatic Detection of Cognition Using EEG and Facial Expressions. Sensors 2020, 20, 3516. [Google Scholar] [CrossRef] [PubMed]
- Moissa, B.; Bonnin, G.; Boyer, A. Exploiting Wearable Technologies to Measure and Predict Students’ Effort; Springer International Publishing: Cham, Switzerland, 2019; pp. 411–431. [Google Scholar] [CrossRef]
- Alirezaei, M.; Hajipour Sardouie, S. Detection of Human Attention Using EEG Signals. In Proceedings of the 2017 24th National and 2nd International Iranian Conference on Biomedical Engineering (ICBME), Tehran, Iran, 30 November–1 December 2017; pp. 1–5. [Google Scholar] [CrossRef]
- Olivas, G.; Candela, M.; Ocampo, J.; Acosta, L.; Aguilar, A.; Delgado, E.; Alanis, M.; Ramirez, M.; Lozoya, J.; Murrieta, J.; et al. Detecting Change in Engineering Interest in Children through Machine Learning using Biometric Signals. In Proceedings of the 2021 Machine Learning-Driven Digital Technologies for Educational Innovation Workshop, Monterrey, Mexico, 15–17 December 2021; pp. 1–7. [Google Scholar] [CrossRef]
- de Wit, B.; Badcock, N.; Grootswagers, T.; Hardwick, K.; Teichmann, L.; Wehrman, J.; Williams, M.; Kaplan, D. Neurogaming Technology Meets Neuroscience Education: A Cost-Effective, Scalable, and Highly Portable Undergraduate Teaching Laboratory for Neuroscience. J. Undergrad. Neurosci. Educ. JUNE A Publ. FUN Fac. Undergrad. Neurosci. 2017, 15, A104–A109. [Google Scholar]
- Johnson, J.; Conderman, G.; Van Laarhoven, T.; Liberty, L. Wearable Technologies: A New Way to Address Student Anxiety. Kappa Delta Pi Rec. 2022, 58, 124–129. [Google Scholar] [CrossRef]
- AlShorman, O.; Masadeh, M.; Alzyoud, A.; Bin Heyat, M.B.; Akhtar, F.; Rishipal. The Effects of Emotional Stress on Learning and Memory Cognitive Functions: An EEG Review Study in Education. In Proceedings of the 2020 Sixth International Conference on e-Learning (econf), Sakheer, Bahrain, 6–7 December 2020; pp. 177–182. [CrossRef]
- Ueda, T.; Ikeda, Y. Stimulation methods for students’ studies using wearables technology. In Proceedings of the 2016 IEEE Region 10 Conference (TENCON), Singapore, 22–25 November 2016; pp. 1043–1047. [Google Scholar] [CrossRef]
- Pourmohammadi, S.; Maleki, A. Stress detection using ECG and EMG signals: A comprehensive study. Comput. Methods Programs Biomed. 2020, 193, 105482. [Google Scholar] [CrossRef]
- Darfler, M.; Cruz-Garza, J.G.; Kalantari, S. An EEG-based investigation of the effect of perceived observation on visual memory in virtual environments. Brain Sci. 2022, 12, 269. [Google Scholar] [CrossRef]
- Almusawi, H.A.; Durugbo, C.M.; Bugawa, A.M. Innovation in physical education: Teachers’ perspectives on readiness for wearable technology integration. Comput. Educ. 2021, 167, 104185. [Google Scholar] [CrossRef]
- Motti, V.G. Wearable Technologies in Education: A Design Space. In Learning and Collaboration Technologies. Ubiquitous and Virtual Environments for Learning and Collaboration; Lecture Notes in Computer Science (including subseries Lecture Notes in Artificial Intelligence and Lecture Notes in Bioinformatics); Springer: Cham, Switzerland, 2019; Volume 11591 LNCS, pp. 55–67. [Google Scholar] [CrossRef]
- Gao, W.; Wei, T.; Huang, H.; Chen, X.; Li, Q. Toward a Systematic Survey on Wearable Computing for Education Applications. IEEE Internet Things J. 2022, 9, 12901–12915. [Google Scholar] [CrossRef]
- Pernet, C.R.; Appelhoff, S.; Gorgolewski, K.J.; Flandin, G.; Phillips, C.; Delorme, A.; Oostenveld, R. EEG-BIDS, an extension to the brain imaging data structure for electroencephalography. Sci. Data 2019, 6, 103. [Google Scholar] [CrossRef] [PubMed]
- Sujatha Ravindran, A.; Aleksi, T.; Ramos-Murguialday, A.; Biasiucci, A.; Forsland, A.; Paek, A.; Karalikkadan, A.; Soria-Frisch, A.; Onaral, B.; Erlandson, B.-E.; et al. Standards Roadmap: Neurotechnologies for Brain–Machine Interfacing; Technical Report; IEEE: Piscataway, NJ, USA, 2020. [Google Scholar]
- Camarillo-Abad, H.M. Wearable technology as a mediator for communication and learning. In Proceedings of the MexIHC ’18: Proceedings of the 7th Mexican Conference on Human–Computer Interaction, Merida, Mexico, 29–31 October 2018. [CrossRef]
- Gelb, A.; Clark, J. Identification for Development: The Biometrics Revolution. Center for Global Development Working Paper. 2013. Available online: https://papers.ssrn.com/sol3/papers.cfm?abstract_id=2226594 (accessed on 31 January 2024).
- Ye, S.; Feng, S.; Huang, L.; Bian, S. Recent Progress in Wearable Biosensors: From Healthcare Monitoring to Sports Analytics. Biosensors 2020, 10, 205. [Google Scholar] [CrossRef] [PubMed]
- Ki, J.J.; Kelly, S.P.; Parra, L.C. Attention strongly modulates reliability of neural responses to naturalistic narrative stimuli. J. Neurosci. 2016, 36, 3092–3101. [Google Scholar] [CrossRef] [PubMed]
- Muldner, K.; Burleson, W. Utilizing sensor data to model students’ creativity in a digital environment. Comput. Hum. Behav. 2015, 42, 127–137. [Google Scholar] [CrossRef]
- Wang, M.; Yin, X.; Zhu, Y.; Hu, J. Representation Learning and Pattern Recognition in Cognitive Biometrics: A Survey. Sensors 2022, 22, 5111. [Google Scholar] [CrossRef] [PubMed]
- Li, M.; Sun, M.; Wang, L. Application Analysis of Smart Wearable Devices in Students’ Physical Activity under the Background of Big Data. J. Phys. Conf. Ser. 2021, 1757, 012124. [Google Scholar] [CrossRef]
- Sánchez, J.A.; Camarillo-Abad, H.M.; Magallanes, Y. Environments for learning motor skills using wearable technologies. In Proceedings of the CLIHC ’19: IX Latin American Conference on Human Computer Interaction, Panama City, Panama, 30 September–4 October 2019; ACM International Conference Proceeding Series. pp. 4–7. [Google Scholar] [CrossRef]
- Shen, M.; He, Y.; Tang, J.; Liang, Z.; Xue, W.; Li, P. Research on the Application of Wearable Devices in Implicit stratified Soccer Teaching. In Proceedings of the 2021 International Conference on Information Technology and Contemporary Sports (TCS), Guangzhou, China, 15–17 January 2021; pp. 481–484. [Google Scholar] [CrossRef]
- Crespo, R.G.; Burgos, D. Advanced sensors technology in education. Sensors 2019, 19, 4155. [Google Scholar] [CrossRef] [PubMed]
- Ezenwoke, A.; Ezenwoke, O.; Adewumi, A.; Omoregbe, N. Wearable technology: Opportunities and challenges for teaching and learning in higher education in developing countries. In Proceedings of the 10th International Technology, Education and Development Conference, Valencia, Spain, 7–9 March 2016; Volume 1, pp. 1872–1879. [Google Scholar] [CrossRef]
- Rathgeb, C.; Pöppelmann, K.; Gonzalez-Sosa, E. Biometric Technologies for eLearning: State-of-the-Art, Issues and Challenges. In Proceedings of the 2020 18th International Conference on Emerging eLearning Technologies and Applications (ICETA), Košice, Slovenia, 12–13 November 2020; pp. 558–563. [Google Scholar] [CrossRef]
- Sapargaliyev, D. Wearables in education: Expectations and disappointments. In Technology in Education. Technology-Mediated Proactive Learning; Springer: Berlin/Heidelberg, Germany, 2015; Volume 559, pp. 73–78. [Google Scholar] [CrossRef]
- Buchem, I.; Klamma, R.; Wild, F. Introduction to wearable enhanced learning (WELL): Trends, opportunities, and challenges. In Perspectives on Wearable Enhanced Learning (WELL); Springer: Cham, Switzerland, 2019; pp. 3–32. [Google Scholar] [CrossRef]
- Johnson, K.T.; Picard, R.W. Advancing Neuroscience through Wearable Devices. Neuron 2020, 108, 8–12. [Google Scholar] [CrossRef] [PubMed]
- Babiker, A.; Faye, I.; Malik, A.S.; Sato, H. Studying the Effect of Lecture Content on Students’ EEG data in Classroom using SVD. In Proceedings of the 2018 IEEE-EMBS Conference on Biomedical Engineering and Sciences (IECBES), Sarawak, Malaysia, 3–6 December 2018; pp. 200–204. [Google Scholar] [CrossRef]
- Nunes, M.B.; Isaias, P. Proceedings of the international conference E-learning 2018, Madrid, Spain, 17–19 July 2018; IADIS Press: Algarve, Portugal, 2018. [Google Scholar]
- Tahmassebi, A.; Gandomi, A.H.; Meyer-Baese, A. An Evolutionary Online Framework for MOOC Performance Using EEG Data. In Proceedings of the 2018 IEEE Congress on Evolutionary Computation (CEC), Rio de Janeiro, Brazil, 8–13 July 2018; pp. 1–8. [Google Scholar] [CrossRef]
- Baceviciute, S.; Mottelson, A.; Terkildsen, T.; Makransky, G. Investigating Representation of Text and Audio in Educational VR using Learning Outcomes and EEG. In Proceedings of the CHI ’20: 2020 CHI Conference on Human Factors in Computing Systems, New York, NY, USA, 25–30 April 2020; pp. 1–13. [Google Scholar] [CrossRef]


| Study | Objective | Education Type | Education Level | Institute | Country | Sample Size | Analysis Tools | Contribution |
|---|---|---|---|---|---|---|---|---|
| [42] | To determine stress levels in pharmacy students | Pharmacy education | University | Faculty of Pharmacy in Hradec Krávolé | Czech Republic | 375 students | HRV, PSS-10, Statistics | Moderate stress levels while studying |
| [43] | To reduce children’s anxiety and stress | Academic education | Elementary school | Public school from the “Amara Berri” group | Spain | 585 students | EmWave, BASC-S2, statistics | Biofeedback reduces students’ anxiety and stress |
| [44] | To evaluate sleep behaviors among college students | Academic education | University | Local university in South Korea | South Korea | 86 students | Sleep behavior, Saliva sampling, HRV, GARS-K, statistics | Sleep behaviors are associated with stress |
| [45] | To investigate daily stress levels and EEG | Academic education | University | Suranaree University of Technology | Thailand | 60 students | MSSQ, EEG, statistics | Stress among students alters brain functions |
| [46] | To analyze emotional stress in teachers | Academic education | University | Not provided | Japan | Not provided | EEG signals | Emotional stress recognition model for teachers |
| [47] | To develop a cost-effective monitoring device | STEM education | University | Not provided | China | Not provided | Arduino, Smartphone app, ECG signals | Cost-effective ECG signal testing device |
| [48] | To evaluate psychological stress in students | Academic education | University | Not provided | China | 90 students | Classification algorithm, RBFNN and IELM | Importance of stress detection in education |
| [49] | To test technology in Korean teaching | Language education | University | Korean major in a university | China | 50 students | Wireless sensing technology, tests | Impact of sensing technology in education |
| [50] | The use of wearables in the teaching and learning of English | Language education | University | Universiti Utara Malaysia | China | 263 students | Statistics | Wearables can make learning easier by improving teaching themes, providing graphic teaching scenarios, and creating an overall independent teaching environment |
| [51] | To create scenarios for students to build confidence | Medical Education | University | Georgian College of Applied Arts and Technology | Canada | 6 personal support worker students | Arduino, Bluetooth, vibration motor | Simulation enables students to reach learning outcomes |
| [52] | To integrate sensors and AR in EFL teaching | Language education | University | Zhejiang Yuexiu University | China | Simulation experiment | Sensors | AR is effective and can support English teaching |
| [53] | To investigate academic stress–achievement relationships | Medical education | University | Pusan National University School of Medicine | South Korea | 97 students | HRV, statistics | Students with higher academic achievements have higher stress |
| [54] | To identify how sensors improve learning efficiency | Language education | University | Xingtai University, Universiti Teknologi Malaysia | China and Malaysia | Not provided | Machine learning, statistics | A classroom learning environment affected by the students’ movements allowed learning free from constraints |
| [55] | To detect students’ stress during the COVID-19 pandemic | Academic education | University | Engineering Department at the University of Pamplona | Colombia | 25 students | Python 3.8, Tkinter library, ScikitLearn library | GSR resulted in the best NPM to identify stress |
| [56] | To propose a stress detection framework | Academic education | University | Not provided | Not provided | 264 students and 32 police school students | Machine learning classification | Development of stress detection algorithms based on an adversarial transfer learning method and analysis of physiological signals |
| [57] | To use sensors in audio–visual language teaching | Language education | University | Speech and hearing research center of Peking University | China | 4 subjects | MATLAB, classification | Line-of-sight change estimation classifier |
| [58] | To improve English language teaching by using sensors and VR | Language education | All education levels | Not provided | China | Not provided | Statistics | An online English teaching system via sensors/VR |
| [59] | To implement motor learning tools for students | Motor learning | Preschool | Not provided | Indonesia | 65 students | Not provided | Measuring tool based on sensors to evaluate motor skills |
| [5] | To analyze teaching methods in basketball students | Physical education | University | Not provided | Not provided | 108 students (49 women) | Statistics | Integration of micro classes and smart bands in a basketball course |
| [60] | To analyze stress in students during examination | Academic education | University | Sastra University | India | 14 students | Statistics | Identification of higher stress before testing |
| [61] | To create a student authentication system for online learning | Online academic education | University | Moodle, Blackboard and OpenEdx | Latin America, Europe and Asia | 350 students | Electron JS | An automated, online student authentication system |
| [26] | To create a real-time detection system of students’ flow state through EEG | Academic education | Elementary school | Department of Science Education, National Taipei University of Education | Taiwan | 30 students | BCS, MOM-tp, Statistics | Future e-learning development with a BCI system |
| [62] | To motivate students with AI to improve their perfomance | Academic education | University | Not provided | Not provided | 4 students | Statistic, HRV, Grovi Pi Sensors, Raspberry Pi | Introduction of the Education 4.0 Framework |
| [20] | To find links between physiological measurements, obtained with IoT devices, and students’ concentration | Academic education | University | University of Novi Sad | Serbia | 15 students | Apple Watch, eye tracker, canvas, statistics | A higher HR correlates to lower concentration levels. |
| [63] | To find cognitive-wise growth in mobile device use in the classroom | Academic education | University | National Institute of Technology Agartala | India | 58 students | EEG Headset, survey, statistics | Use of mobile devices in classrooms to enhance the quality of education |
| [64] | To analyze mental fatigue conditions in the occipital region | Academic education | High school | Senior High School 2 Malang | Indonesia | 13 students | EEG Headset, questionnaire, statistics | Mental fatigue is a life-threatening factor in high-school students |
| [65] | To study changes in stress patterns during tests | Academic education | University | Ganja State University | Azerbaijan | 68 students | EEG, Excel, SPSS | Reference physiological values are needed for studying stress patterns in education |
| [66] | To demonstrate the influence of AR in concentration | Technological education | University | Federal University of Rio Grande do Sul | Brasil | 5 students | AR, EEG headset, platforms | Increased student attention during AR interaction |
| [67] | To solve missing data problems and human stress level prediction | Academic education | University | Not provided | Not provided | 75 students | Smart-wristband data, MATLAB | Method for solving missing data problems through data completion with diurnal regularizers and temporally hierarchical attention network methods |
| [68] | To recognize students’ exam stress levels | Academic education | University | University of Tuzla | Bosnia and Herzegovina | 10 students | BITalino, MATLAB, machine learning | Wearables can be used for building automated stress detection systems |
| [69] | To test the effects of time limitation on exam performance | Academic education | University | Institute of Space Technology, Islamabad | Pakistan | 14 students | EEG signals | Performance deteriorates during timed tests |
| [70] | To measure academic stress to provide better ways to cope with it | Academic education | University | University of Turku | Finland | 17 students | Smart device measures stress via physiological signals | Relation between study-related and non-study-related stress |
| [71] | To use EEG to measure e-learning effectiveness | Academic education | Kindergarten | Tadika Advent Goshen Kota Marudu, Pacos Trust Penampang, Pusat Minda Lestari UMS Kota Kinabalu | Malaysia | 98 students and 6 teachers | Effective learner application for EEG, and a mobile learning app | E-learning success is best judged in short sessions with suburban children |
| [72] | To measure HRV changes in students during different stages of an exam | Academic education | University | Lebanese University | Lebanon | 90 students | HR, SDNN, RMSSD, pNN50, LF, HF, LF/HF | Gender differences during assessment of stress in real exams |
| [73] | To find statistical differences between lifestyles and stress levels | Academic education | University | American University of Madaba | Jordan | 19 students | GRS data, Microsoft Band 2, mobile app, online survey | Correlations were found between GSR values and physical activity level |
| [74] | To review the learning behavior with biofeedback | Academic education | University | Not provided | China | 106 students | EEG headset, eye tracker, statistics | Improving learning efficiency in autonomous learning settings is essential |
| [75] | To evaluate the psychological state of college students under test stress | Academic education | Junior college | Not provided | Not provided | 15 students | MATLAB, EEG, neural networks, test questions | Students with higher test stress are more likely to face psychological health problems |
| [76] | To compare students stress appearing for previva/postviva during exams | Medical education | University | Navodaya Dental College and Hospital | India | 70 students | Statistics, mobile app, Smartphone | Academic examinations produce situational stress in students and result in anxiety |
| [77] | To study stress-reduction techniques during microteaching in preservice teachers | Academic education | University | Not provided | Not provided | 100 teachers | HR, blood pressure, statistics | Biofeedback was not effective to reduce stress in this sample of preservice teachers |
| [78] | To evaluate solutions for stress in students using COTS wristbands | Academic education | University | University of Vigo | Spain | 12 students | COTS wristbands, machine learning, lectures | A protocol to evaluate student stress in classrooms based on HR, temperature, and GSR |
| [79] | To understand interactions with a visual search interface | Academic education | All education levels | Not provided | Not provided | 20 students | EEG signals, E-prime 2, EEGO, ASA, Minitab17, ANOVA, Statistics | EEG experiment can be used as a basis to judge cognitive errors |
| [80] | To study how wearables support learning activities and ethical responsibilities | Academic education | All education levels | Oslo Metropolitan University | Norway | Not provided | Wearables | Wearables in teaching and learning provide pedagogical opportunities |
| [81] | To monitor stress levels during exams in students | Academic education | University | Universidad del Magdalena, Universidad del Norte | Colombia | 20 students | EEG Emotiv Insight | A desktop app that monitors stress according to parameters obtained from EEG signals and the Emotiv Insight Software |
| [82] | To help teachers with wearables to collect data and provide feedback | Academic education | Elementary school | An elementary school in Zhaoqing City | China | Not provided | Wearable device | A model to collect data and give feedback |
| [83] | To help students with intellectual disabilities to learn | Academic education | All education levels | Middle East Technical University | Turkey | 4 students | Wearable clothing | A way to help people with disabilities by creating an app and plushies with smart clothing that facilitate the learning of internal body organs |
| [84] | To improve the quality of teaching micro technology | Academic education | University | Technische Universität Ilmenau | Germany | 30 students | Smart watch, fitness tracker, EEG, EMG | Techniques in the design process through formative evaluation |
| [85] | To analyze human motivation and efficacy processes | Academic education | University | St. Petersburg State University‘s Psychology Faculty | Russian | 20 students | Biofizpribor, ECG | Improved educational and therapeutic interventions |
| Study | Sensor | Biometry Device | Sim or Exp | Communication Protocol | Type of Storage | Computing Engine | Processing | Software | Qualitative Index | Quantitative Index | Study Outcome |
|---|---|---|---|---|---|---|---|---|---|---|---|
| [42] | Infrared PPG ear sensor | EmWavePro (HeartMath Inc., Boulder Creek, CA, USA) | Experimental | Not provided | Not provided | No | Statistics | Kubios HRV (Kubios, Kuopio, Finland) | PSS-10, sociodemographic data | Total power, VLF, LF, HF, LF/HF, SDNN, Coherence5 | No significant changes in PSS-1O and HRV |
| [43] | Non-invasive auditory sensor | Not provided | Experimental | USB | No | No | Statistics | EmWave 2021 Pro. Version (HeartMath Inc, Boulder Creek, CA, USA) | BASC II test | HRV | Students learned to breathe consciously |
| [44] | Heart rhythm scanner PE | Octagonal motion logger Sleep Watch-L (Ambulatory Monitoring, Ardsley, NY, USA) | Experimental | Not provided | Not provided | No | Statistics | Action W-2, IBM SPSS Statistics version 25 (IBM, Armonk, NY, USA) | GARS-K | Saliva, HR, SD, SDNN, LF/HF | sAA and HRV are significant in sleep disorders |
| [45] | EEG electrodes | Not provided | Experimental | Not provided | Not provided | No | Statistics | IBM SPSS Statistics version 17 | MSSQ, sociodemographic data | EEG signals | Stress analysis improves classes |
| [46] | EEG electrodes | Not provided | Experimental | Not provided | Not provided | No | DFA, Linear Feature Selection, statistics | Not provided | Not provided | EEG signals | Deep learning for emotion recognition |
| [47] | AD8232 ECG chip | Not provided | Experimental | Bluetooth HC-05 | Not provided | No | Signal filtering | Not provided | Not provided | HRV | System that facilitates HRV analysis |
| [48] | EEG electrodes | Not provided | Experimental | Not provided | Not provided | No | AdaBoost, RBFNN, IELM | Not provided | Sociodemographic data, self-evaluation | EEG signals | Algorithm with excellent accuracy |
| [49] | EEG electrodes | Not provided | Experimental | Wireless communication | Internet and satellite | No | Statistics | Not provided | Not provided | Not provided | Wireless sensors can improve student grades |
| [50] | Not provided | Not provided | Experimental | Not provided | Not provided | No | Statistics | IBM SPSS Statistics version 13.0 | Not provided | Not provided | Wearable use is associated with better test scores |
| [51] | Arduino MKR1010, vibration motor | Not provided | Experimental | Bluetooth and visual via website | Not provided | No | Statistics | Arduino (Arduino, Lombardia, Italy) | Not provided | Not provided | Wearables provided insight into a medical scenario |
| [52] | Track movement, heartbeat, trajectory | Not provided | Simulation | High-bandwidth optical fiber technology | Not provided | No | Survey summary and statistics | Not provided | Not provided | Temp, Disp, RS, MF, Stress, Vibration | AR supports the practice of English teaching |
| [53] | Not provided | SA2000E HRV analytic equipment | Experimental | Not provided | Not provided | Not provided | Statistics | IBM SPSS Statistics 24.0 | Socio-demographic data | BMI, HRV, SDNN, LF, HF, LF/HF | Women suffer more academic stress than men |
| [54] | Light and temperature sensors | Not provided | Experimental | WiFi | Not provided | Not provided | Machine learning | Not provided | Satisfaction survey | Light and temperature | Students approve of the system |
| [55] | GSR sensor, MOX gas sensors, electrodes | GSR, ECG, EMG, Electronic Nose System | Experimental | I2C, Wifi | Not provided | No | LDA, KNN, SVM | Python 3.8, (Python Software Foundation, Beaverton, OR, USA), Raspbian environment | SISCO Inventory | HRV of ECG, GSR, gas sensors’ response, EMG | GSR data were best in relaxed and stressed states |
| [56] | EDA, PPG, ST, ACC sensors | Wrist-worn wearable device | Experimental | Bluetooth | Not provided | No | SVM, KNN | Python | Self-reported stress levels | Mean, SD, HRV, BPM, IBI, LF, HF, Average | Classification of stressed and relaxed states |
| [57] | Heog, NEMG, and IMU sensors | NeuroScan synamps 2 system | Experimental | Not provided | Not provided | No | Window slicing, FCN, LSTM and SVM | MATLAB (The Mathworks Inc., Natick, MA, USA) | No | Heog Value, NEMG amplitude and RMS | Estimation of change angle of line of sight |
| [58] | Odometer, Polaroid 6500 sonar modules | Milodometer and Sonar systems | No | Not provided | Not provided | No | SIFA, KF, statistics | Not provided | No | Skeleton position, movement, rotation angle | VR for an online English teaching experience |
| [59] | Movement sensor | Limit switch sensor | Experimental | Not provided | Not provided | No | No | Not provided | Scoring of motor ability | Time between movements | A motor skills test tool from the locomotor component |
| [5] | Heart rate and blood pressure sensors | Smart Redmi bracelet (Xiaomi, Beijing, China) | Experimental | Wireless sensor network | Not provided | Semantic mobile computing | Statistics | IBM SPSS Statistics 17.0 | No | Scores of physical exercises, P value | Better student performance in basketball classes |
| [60] | Dry EEG electrodes | Enobio system (Neuroelectrics, Barcelona, Spain) | Experimental | Not provided | Stored in the computer | Not provided | WPT, Statistics | PSYTASK (Bio-Medical Instruments Inc., Detroit, MI, USA), ENOBIO NIC 1.4 (Neuroelectrics, Barcelona, Spain) | Arithmetic task | EEG relevant alpha and theta component energy | Students were highly stressed before examination |
| [61] | Microphone, webcam, keyboard | Proctoring system | Experimental | VoIP | DB | Cloud | FaceBoxes, M3L, NNs, Kaldi | Electron JS (OpenJS Foundation, San Fransisco, CA, USA) | User experience test | Images, audio, keystroke dynamics | Better biometric models are needed |
| [26] | Mobile dry EEG sensors | NeuroSky MindWave Headset (NeuroSky, San Jose, CA, USA) | Experimental | Not provided | Not provided | No | Average, EEG power, statistics | SPSS 20.0 (SPSS Inc., Chicago, IL, USA), Microsoft Excel (Microsoft, Redmond, WA, USA), WEKA 3.8 (University of Waikato, Hamilton, New Zealand) | SR-F | EEG signals | EEG-F detects flow experience |
| [62] | PPG, Grove Pi sensors | Smartphone, Raspberry Pi (Raspberry Pi, Cambridge, UK), Smartwatch | Experimental | I2C, Wifi, Bluetooth | Not provided | Google Cloud TTS | Statistics | Python, ECG for Everybody | Sound | HRV, Temp, Cal, Hum, Steps | Relation between self-test and biosignals |
| [20] | HR and eye tracking sensor | Apple Watch (Apple, Cupertino, CA, USA) | Experimental | Not provided | Health Mobile App | Cloud | Statistics | Not provided | Quiz evaluation | Heart rate | Initial HR in the quiz affects concentration |
| [63] | Mobile dry EEG sensors | NeuroSky MindWave Headset | Experimental | Not provided | Not provided | No | ThinkGear ASIC, statistics | JASP 0.10.2 (JASP Statistics, Amsterdam, The Netherlands) | Survey | EEG signals | Bayes factor supports that mobile devices have positive effects in class |
| [64] | EEG electrodes | EMOTIV EPOC+ (EMOTIV, San Francisco, CA, USA) | Experimental | Bluetooth | Not provided | No | MAV and SD | Not provided | IFS | EEG signals | 8 h school days can cause mental fatigue |
| [65] | EEG electrodes | Not provided | Experimental | Not provided | Not provided | No | Statistics | IBM SPSS Statistics, Microsoft Excel | Not provided | EEG signals | Differences in brain signals between 1st and 5th year students |
| [66] | Mobile dry EEG sensors | NeuroSky MindWave Headset | Both | Bluetooth | Student’s inventory | No | Statistics | Moodle (Moodle, West Perth, WA, USA), Unity 3D (Unity Technologies, San Francisco, CA, USA), Vuforia (PTC, Boston, MA, USA) | Self-reported attention levels | EEG signals, attention levels | High concentration with AR app |
| [67] | Sleeping, walking, running, and cycling sensor data | Smart-wristband | Experimental | Not provided | Not provided | No | Machine learning | MATLAB, Tensorflow (USENIX Association, Berkeley, CA, USA) | Online survey | Data from smart-wristband | Data filling and stress level prediction |
| [68] | EDA and ECG sensors | BITalino | Experimental | Bluetooth | Not provided | No | Statistics, KNN, SVM, LDA | MATLAB | Not provided | ECG and EDA signals | SVM was the most accurate with 91% |
| [69] | EEG electrodes | OpenBCI Cyton (OpenBCI, Brooklyn, NY, USA) | Experimental | Wireless transmission | At the device level | No | Mean and SD of PSD | MATLAB and EEGLAB (Swartz Center for Computational Neuroscience, San Diego, CA, USA) | Math test | EEG signals | Stress increases in timed exams |
| [70] | EDA sensor | Moodmetric smart ring | Experimental | Not provided | Not provided | No | Statistics | Microsoft Excel | Written diary | EDA signal | Correlation between non-study and studying |
| [71] | EEG electrodes | NeuroSky MindWave Headset | Experimental | Not provided | Not provided | No | Statistics | Mobile learning application | Questionnaire | EEG signals | Suburban students tend to learn more with m-learning |
| [72] | Ambu WhiteSensor WS electrodes | Cardio Diagnostics (Cardio Diagnostics Inc., Chicago, IL, USA) | Experimental | Not provided | Not provided | No | Statistics | Kubios HRV 2.2 | Questionnaire | HRV parameters | HRV in females is lower before/after examination |
| [73] | GSR sensor | Microsoft Band 2 (Microsoft, Redmond, WA, USA) | Experimental | Bluetooth | Mobile app | No | Statistics | Not provided | Online survey | GSR data | GSR data are dependent on human behavior |
| [74] | Mobile dry EEG sensors, eye tracker | NeuroSky MindWave Headset | Experimental | Not provided | Not provided | No | Statistics | Minxp, IMB SPSS Statistics 19 | Bloom’s taxonomy survey | EEG signal | Biofeedback may act as a metacognitive method |
| [75] | EEG electrodes | Not provided | Experimental | Not provided | Not provided | No | Neural networks | MATLAB | Test questions | EEG signals | EEG signals are multi-fractal signals |
| [76] | HR, oxygen and stress sensors | Smartphone Samsung S7 (Samsung, San Jose, CA, USA) | Experimental | Not provided | Mobile app | No | Statistics | Android S-HEALTH (Android, Palo Alto, CA, USA) | Not provided | HR, oxygen saturation, stress levels | Gender differences in stress aptitude |
| [77] | HR, blood pressure sensors | HeartMath EmWave, GE Dinamap PRO 400 Vitals | Experimental | Not provided | Not provided | Not provided | No | Statistics | Online survey | HR and blood pressure data | No differences in stress levels after microteaching |
| [78] | HR, ST, GSR, ACC sensors | Wristband | Experimental | Bluetooth | Server’s database | No | Machine learning | Not provided | Quiz and lecture sessions | Information from wearable | Average classification accuracy of 97.62% |
| [79] | EEG electrodes | Not provided | Experimental | Not provided | Not provided | No | ANOVA, statistics | E-prime 2 (Psychology Software Tools, Pittsburgh, PA, USA), EEGO (ANT Neuro, Hengelo, The Netherlands), ASA, Minitab17 (Minitab LLC, State College, PA, USA) | Not provided | EEG signals | N200 is produced by visual attention |
| [80] | GPS and HR | Fitbit Surge (Fitbit, San Francisco, CA, USA) | Experimental | WiFi | Computer storage | Cloud | Statistics | Microsoft Excel | Not provided | Location and pulse data | Wearables are not yet ready for use in teaching and learning |
| [81] | EEG electrodes | EMOTIV Insight (EMOTIV, San Francisco, CA, USA) | Experimental | Bluetooth Smart 4.0 | Not provided | No | Not provided | Microsoft Excel, SDK of EMOTIV Insight (EMOTIV, San Francisco, CA, USA) | Test IDARE | EEG signals | Increased stress in both subjects |
| [82] | HR sensor | Love buckle health (CoCoQCB2) | Experimental | Bluetooth | System platform | Server | Statistics | Not provided | RPE scale | Heart rate | Measured data should be more accurate |
| [83] | Not provided | Not provided | Experimental | Not provided | Not provided | No | Not provided | App | Position of organs | Not provided | Students learned organ locations |
| [84] | EEG, ECG, EDA, EMG, HR, BP, BG, BO sensors | Not provided | Experimental | Not provided | Not provided | No | Not provided | Not provided | SR-F | EEG, ECG, EDA, EMG, HR, BP, BG, BO | E-learning system prototype |
| [85] | EEG and ECG electrodes | Not provided | Experimental | Not provided | Not provided | No | Statistics | Not provided | FAM test | EEG and ECG signals | Stress was related to poor answers |
| Biometry Device | Signal | Sensing Device | Communication Protocol | Type of Data Storage | Power | Studies |
|---|---|---|---|---|---|---|
| EmWavePro | HRV | PPG, ear sensor | USB | Software | Rechargeable lithium-ion battery | [42,77] |
| Octagonal motion logger sleep Watch-L | Not provided | Not provided | Serial communications (COM) port | 2 Mb of non-volatile memory | Power supply, changeable batteries | [44] |
| SA2000E HRV analytic equipment | HRV | Not provided | Not provided | Not provided | Not provided | [53] |
| NeuroScan synamps 2 system | EEG | EEG Electrodes | USB 2.0 | Neuroscan software | 120V AC | [57] |
| Smart Redmi bracelet | Heart rate, blood pressure, oxygen saturation | 6-axis sensor: 3-axis accelerometer and 3-axis gyroscope, PPG heart rate sensor and light sensor | Bluetooth low energy | App | 200 mAh | [5] |
| Enobio system | EEG | Wet, semi-dry and dry electrodes | WiFi or USB | MicroSD or Software | Rechargeable system using Li-Ion battery | [60] |
| NeuroSky MindWave Headset | EEG and ECG signals | 12 bit raw brainwaves and power spectrum, eSense, sensor arm up and down | BT/BLE dual mode module | App | AAA battery | [26,63,66,71,74] |
| Raspberry Pi | Not provided | GPIO to connect sensors | SSH, UART, I2C, SPI, USB, LAN, WIFI, Bluetooth | DAS, NAS | 1.8 a 5.4 W | [62] |
| Apple Watch | Heart rate, blood pressure, oxygen saturation, movement | PPG heart rate sensor, light sensor, 3-axis accelerometer, 3-axis gyroscope | Bluetooth | DAS, NAS, App | Rechargeable lithium battery | [20] |
| EMOTIV EPOC+ | EEG signals | 9 axis sensor: 3-axis accelerometer, 3-axis magnetometer. EGG sensors. | Bluetooth low energy | Software | Internal 640mAh lithium-polymer battery (rechargeable) | [64] |
| BITalino | ECG, EMG, EDA, and EEG signals | MCU, Bluetooth, Power, EMG, EDA, ECG, Accelerometer, LED, and Light Sensor | Bluetooth 2.0 + EDR or Bluetooth 4.1 BLE, Bluetooth (BT) or Bluetooth low energy (BLE)/BT dual mode | OpenSignals Software | Battery: 700 mA 3.7 V LiPo (rechargeable) | [68] |
| OpenBCI Cyton | EEG, EMG, ECG | Not applicable—it serves as a connection between sensors | BLE, USB dongle via RFDuino radio module | PC, mobile device | 3–6 V DC | [69] |
| Moodmetric smart ring | EDA | Not provided | Bluetooth Smart | Moodmetric app and Moodmetric cloud | Internal, non-removable, rechargeable Li-Ion battery | [70] |
| Cardio Diagnostics | ECG | Transmitter adhesive patch | Not provided | Cloud | Rechargeable battery | [72] |
| Microsoft Band 2 | ECG and temperature | Optical sensor, three-axis accelerometer, gyrometer, galvanic skin sensors and skin temperature sensor. | Bluetooth 4.0 | Not provided | Charge by a 200 mAh Li-polymer battery. | [73] |
| Smartphone Samsung S7 | Heart rate and oxygen saturation | SpO2 and heart rate sensor | Not provided | Samsung S-health software | Rechargeable Li-Ion battery | [76] |
| GE Dinamap PRO 400 Vitals | Blood pressure, temperature, oxygen saturation | Blood pressure cuff, SpO2 sensor, oral temp sensor | Remote operation with DINAMAP® Host Communications Protocol | Not provided | DC input, battery power, host port power | [77] |
| Fitbit Surge | ECG | An MEMS 3-axis accelerometer and optical heart rate tracker | Bluetooth 4.0 | fitbit.com dashboard | Rechargeable lithium-polymer battery. | [80] |
| EMOTIV Insight | EEG signals | EEG semi-dry sensors, IMU, accelerometer, gyroscope, magnetometer | Bluetooth low energy | Not provided | 480 mAh battery | [81] |
| Love buckle health (CoCoQCB2) | Heart rate | Not provided | 433 MHz radio, Bluetooth | App, server | Not provided | [82] |
Disclaimer/Publisher’s Note: The statements, opinions and data contained in all publications are solely those of the individual author(s) and contributor(s) and not of MDPI and/or the editor(s). MDPI and/or the editor(s) disclaim responsibility for any injury to people or property resulting from any ideas, methods, instructions or products referred to in the content. |
© 2024 by the authors. Licensee MDPI, Basel, Switzerland. This article is an open access article distributed under the terms and conditions of the Creative Commons Attribution (CC BY) license (https://creativecommons.org/licenses/by/4.0/).
Share and Cite
Hernández-Mustieles, M.A.; Lima-Carmona, Y.E.; Pacheco-Ramírez, M.A.; Mendoza-Armenta, A.A.; Romero-Gómez, J.E.; Cruz-Gómez, C.F.; Rodríguez-Alvarado, D.C.; Arceo, A.; Cruz-Garza, J.G.; Ramírez-Moreno, M.A.; et al. Wearable Biosensor Technology in Education: A Systematic Review. Sensors 2024, 24, 2437. https://doi.org/10.3390/s24082437
Hernández-Mustieles MA, Lima-Carmona YE, Pacheco-Ramírez MA, Mendoza-Armenta AA, Romero-Gómez JE, Cruz-Gómez CF, Rodríguez-Alvarado DC, Arceo A, Cruz-Garza JG, Ramírez-Moreno MA, et al. Wearable Biosensor Technology in Education: A Systematic Review. Sensors. 2024; 24(8):2437. https://doi.org/10.3390/s24082437
Chicago/Turabian StyleHernández-Mustieles, María A., Yoshua E. Lima-Carmona, Maxine A. Pacheco-Ramírez, Axel A. Mendoza-Armenta, José Esteban Romero-Gómez, César F. Cruz-Gómez, Diana C. Rodríguez-Alvarado, Alejandro Arceo, Jesús G. Cruz-Garza, Mauricio A. Ramírez-Moreno, and et al. 2024. "Wearable Biosensor Technology in Education: A Systematic Review" Sensors 24, no. 8: 2437. https://doi.org/10.3390/s24082437
APA StyleHernández-Mustieles, M. A., Lima-Carmona, Y. E., Pacheco-Ramírez, M. A., Mendoza-Armenta, A. A., Romero-Gómez, J. E., Cruz-Gómez, C. F., Rodríguez-Alvarado, D. C., Arceo, A., Cruz-Garza, J. G., Ramírez-Moreno, M. A., & Lozoya-Santos, J. d. J. (2024). Wearable Biosensor Technology in Education: A Systematic Review. Sensors, 24(8), 2437. https://doi.org/10.3390/s24082437