1. Introduction
Permanent Magnet Synchronous Motors (PMSM) are widely used as a power source in all kinds of machinery and equipment, and, once an abnormality occurs, the equipment stops running if it is light, or the workers who operate the equipment are injured if it is heavy, so the detection of abnormalities in PMSM is crucial. Existing permanent magnet synchronous motor fault diagnosis research focuses on the lack of permanent magnet synchronous motor such as elevator industry research [
1,
2]. This paper aims to study the multi-current fusion of permanent magnet synchronous motor fault diagnosis method. Faults in permanent magnet synchronous motors are generally categorized into four types: (1) bearing faults, (2) stator faults, (3) rotor faults, and (4) magnetic path faults [
3]. Intelligent anomaly detection for permanent magnet synchronous motors using deep learning has achieved remarkable results due to advances in sensor technology and data-driven techniques [
4].
Currently, mainstream methods for detecting anomalies in permanent magnet synchronous motors employ signals such as raw vibration [
5], current [
6], magnetic field [
7], and other signals. As vibration models can effectively reflect internal faults, Xu et al. [
8] proposed an improved global contextual residual neural network for motor anomaly detection by extracting vibration signal features. Zeng et al. [
9] analyzed the spatiotemporal distribution characteristics of the stator magnetic flux to extract rotor features, enabling online detection of the motor rotor faults. Mbo’o et al. [
10] utilized current characteristics generated by the stator current spectra for bearing fault diagnosis.
Different sensor signals have various advantages in fault diagnosis. However, in practical applications, non-invasive current signals have the advantages of easy acquisition, high accuracy, and minimal sensitivity to other components due to the noise interference of vibration signals from the environment, such as noisy machine rooms and magnetic sensitivity to changes in magnetic fields. Researchers more frequently investigate such methods.
Zhang et al. [
11] employed the hypergraph neural network to mine the direct correlation of multiple nodes of current signals. Moreover, the authors also employed hyperedge convolution to capture high-order feature relationships. Zhuo et al. [
12] used the multi-sensor information-driven attention mechanism and the improved Adaboost method to train different signals, evaluating signal sensitivity to enhance diagnostic efficiency. However, most CNN-based methods fail to explore hierarchical representations from measured current signals. Such methods solely utilize features from the final convolutional layer for fault recognition, leaving some useful hierarchical features extracted from the intermediate layers unexplored and underutilized. Furthermore, these methods lack a fault signal learning mechanism, i.e., there is no model updating and indiscriminate processing of signals (including all pulses and patterns) in a single pass, making them prone to signal learning overfitting. Since different features have a different importance for the fault detection task, the network should focus more on extracting discriminative features.
To improve the fault feature extraction ability of CNN applied to the fault monitoring system of the appropriate amount of computation—so that it has an explicit physical meaning and mechanistic significance, as well as relationships between preceding and succeeding signals—scholars have introduced traditional signal analysis methods, Recurrent Neural Networks (RNN) methods [
13], and federal learning methods into the CNN. Li et al. [
14] designed a continuous wavelet convolution layer to replace the first convolution layer of the standard CNN. Hence, the CNN gradually incorporates the advantages of the wavelet transform to extract additional fault features in bearing failures. Chen et al. [
15] replaced the fully connected CNN layer with LSTM when investigating grid anomalies. Moreover, the authors used the gating mechanism and timing characteristics of LSTM to extract additional internal fault features. Gao et al. [
16] proposed federated learning combined with reinforcement learning to train the measured signals in a distributed manner, which not only reduces the amount of model computation but also guarantees data security. The solutions mentioned above have achieved favorable outcomes in their respective fields. However, as low-speed, high-torque permanent magnet synchronous motors for industrial use require precise position control, the resulting faults are slightly different from those of ordinary permanent magnet synchronous motors, which are more prone to asymmetrical three-phase currents due to noise and other causes [
17]. In practical engineering, the cost-saving of detecting the power of only two out of the three phases will be used when detecting the motor currents, deducing information about the third phase [
18]. Although K Jankowska et al. [
19] proposed fault diagnosis methods for two-phase currents, calculating the residual differentials of currents and currents in the DC bus, the residual differentials contain less information about other faults. Hence, the above solutions do not take into account, for example, low-speed, high-torque permanent magnet synchronous motor application scenarios.
A new DW-CNN feature fusion-weighted updating LSTM classification network is proposed in this paper to address the issue of CNN networks struggling to effectively extract current features from PMSMs and achieve abnormal detection under non-steady-state conditions. The proposed method integrates cyclical wavelet packets and CNN to extract high and low-frequency features of two-phase or three-phase current signals. The weighted updating LSTM network enhances the accuracy of abnormal detection of PMSMs under various operating conditions and eliminates interference caused by incomplete symmetry in three-phase currents. An overview of the main work in this paper is as follows.
A DW-CNN feature fusion method with separate processing of high and low frequencies is proposed to fuse different current signals and perform feature processing for targeted high and low frequencies. The high- and low-frequency signal features of the current signals are obtained based on wavelet packet transform. Moreover, the noise-resistant and strong multiscale features are obtained by simple coding-based CNN and direct CNN, laying the foundation for the subsequent model.
The circular attention mechanism is incorporated into the network to guide the model and target the inconspicuous frequency and time features of the multi-current signal. The multi-current signal is transformed via a wavelet-convolution-attention loop to form a complete fusion feature signal rich in time-domain frequency.
A weighted updating LSTM anomaly detection method is introduced in this paper based on the improvements above. The model is referred to as the Multilayer Wavelet Attention LSTM Convolutional Neural Network (MWAL-CNN) model. The proposed method is verified on the induction motor test beds and industrial motor pumping system datasets. The experimental results demonstrate that, compared to five state-of-the-art methods, the proposed model achieves higher diagnostic accuracy under non-steady-state conditions, affirming the effectiveness of the proposed approach.
The remainder of the paper is organized as follows. The relevant theoretical background is briefly reviewed in
Section 2. The details of the proposed method are explained in
Section 3. The effectiveness of the proposed MWAL-CNN is validated in
Section 4 against two experimental datasets with two-phase and three-phase current signals. Lastly, a discussion on the feasibility of the method for anomaly detection of permanent magnet synchronous motors is provided in
Section 5.
3. LSTM Anomaly Detection with DW-CNN Weight Updating
A detailed introduction to the DW-CNN feature fusion and weight-updated LSTM classification network used for motor anomaly detection under non-stationary conditions is provided in this section.
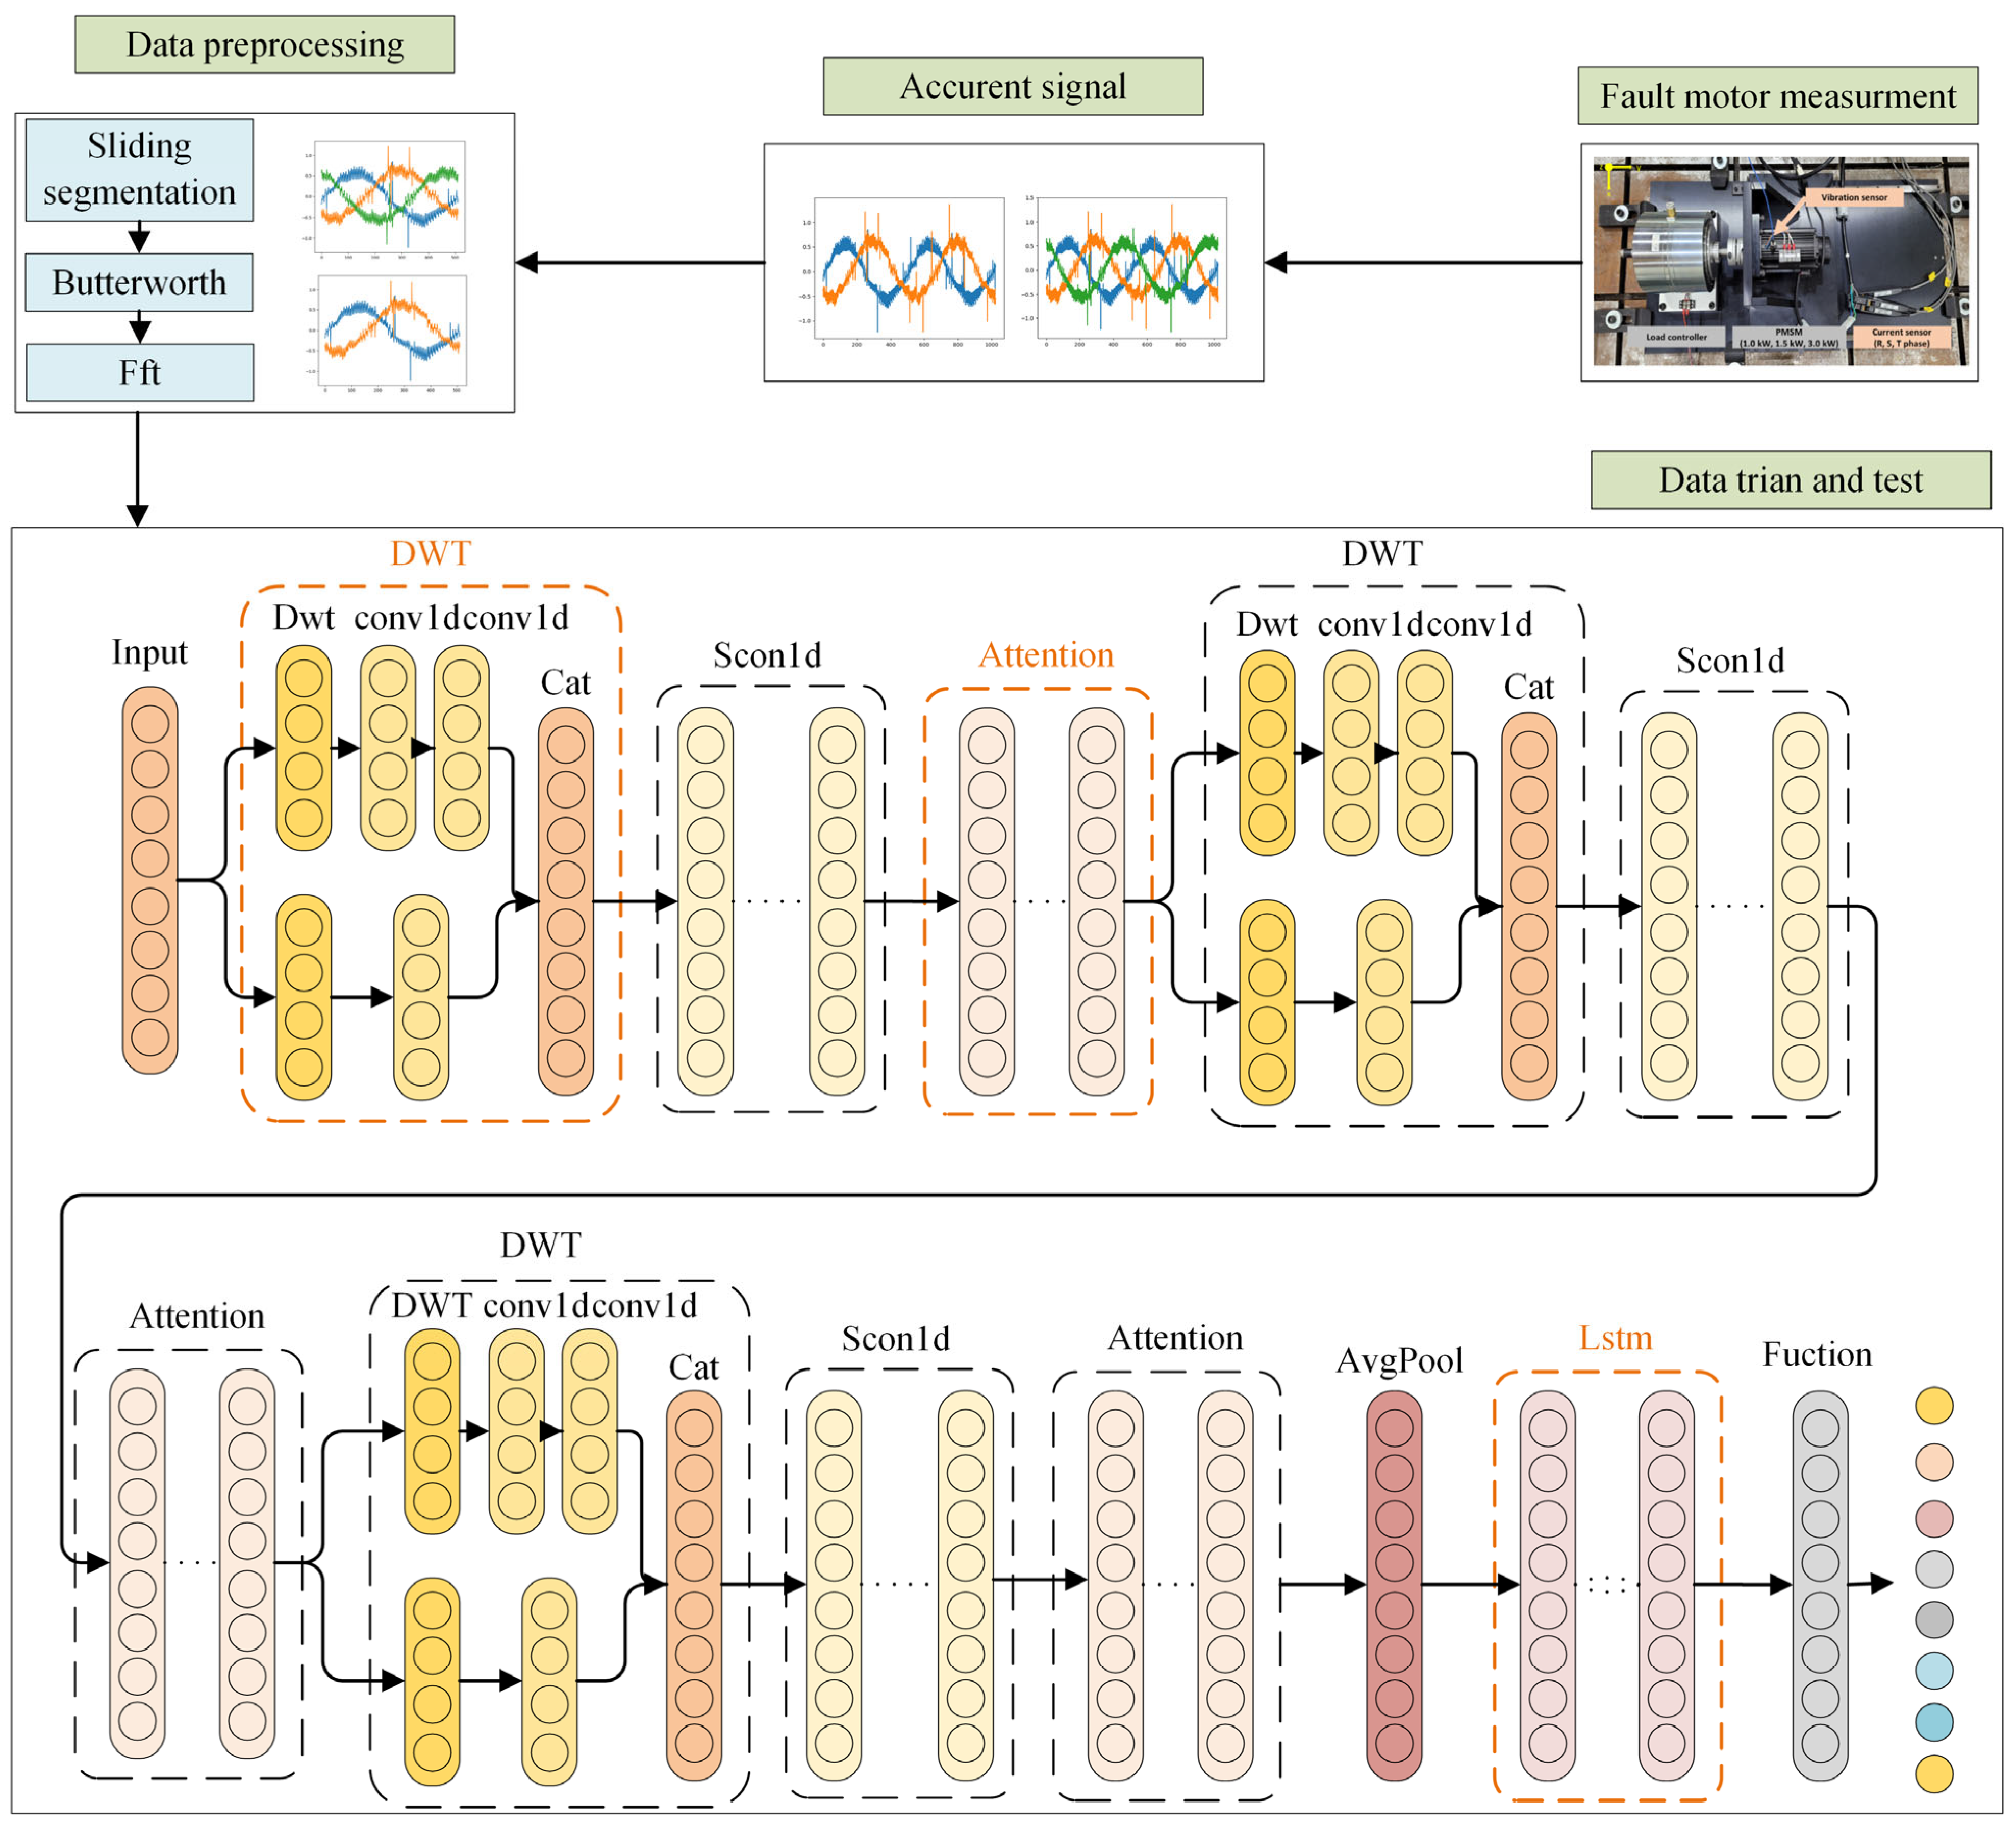
3.1. MWAL-CNN Structure
The MWAL-CNN structure is shown in
Figure 4 and it comprises four parts, i.e., the high- and low-frequency DWT layer, the standard CNN layer, the hybrid attention mechanism layer, and the weight update LSTM layer. For a detailed description of the symbols in this diagram, see
Table A1 and
Table A2. The first three parts are combined into one and looped three times to connect with the weight-updating LSTM layer to form a looped DW-CNN structure. The DWT and CNN layers remove the high-frequency noise component in the multi-current signal and amplify the low-frequency component containing many features. The hybrid attention mechanism layer extracts the inconspicuous frequency signals and time signals in the high- and low-frequency signals. Lastly, the LSTM layer of weight updating classifies the anomalous faults from the extracted feature signals. The specific steps are as follows.
Step 1: Data preparation. The three-phase current signals of the induction motor are collected in different operating states. The long signal data from each sensor is divided into windows to enhance the number of samples. Each window contains at least one period of sinusoidal signals. Each divided signal is preprocessed with Fast Fourier Transform and Butterworth Filter and divided into training and test samples. The Fourier transform can extract the frequency domain features of the current information and other filtering methods, such as the Butterworth filter and the Chebyshev filter, that have the advantage of maximum smoothing of the frequency response curve in the passband.
Step 2: Training process. The initial weights of the LSTM network are determined, the preprocessed data are input into the MAWL-CNN model for training, and the fusion features after three layers of the network’s feature extraction are obtained. The fused features are mapped to different fault categories via LSTM, and LSTM weights are updated until optimal weights are obtained.
Step 3: Validation procedure. Test samples are placed into the trained model to test its reliability and the response degree, and evaluation metrics (such as accuracy) are used to evaluate the model.
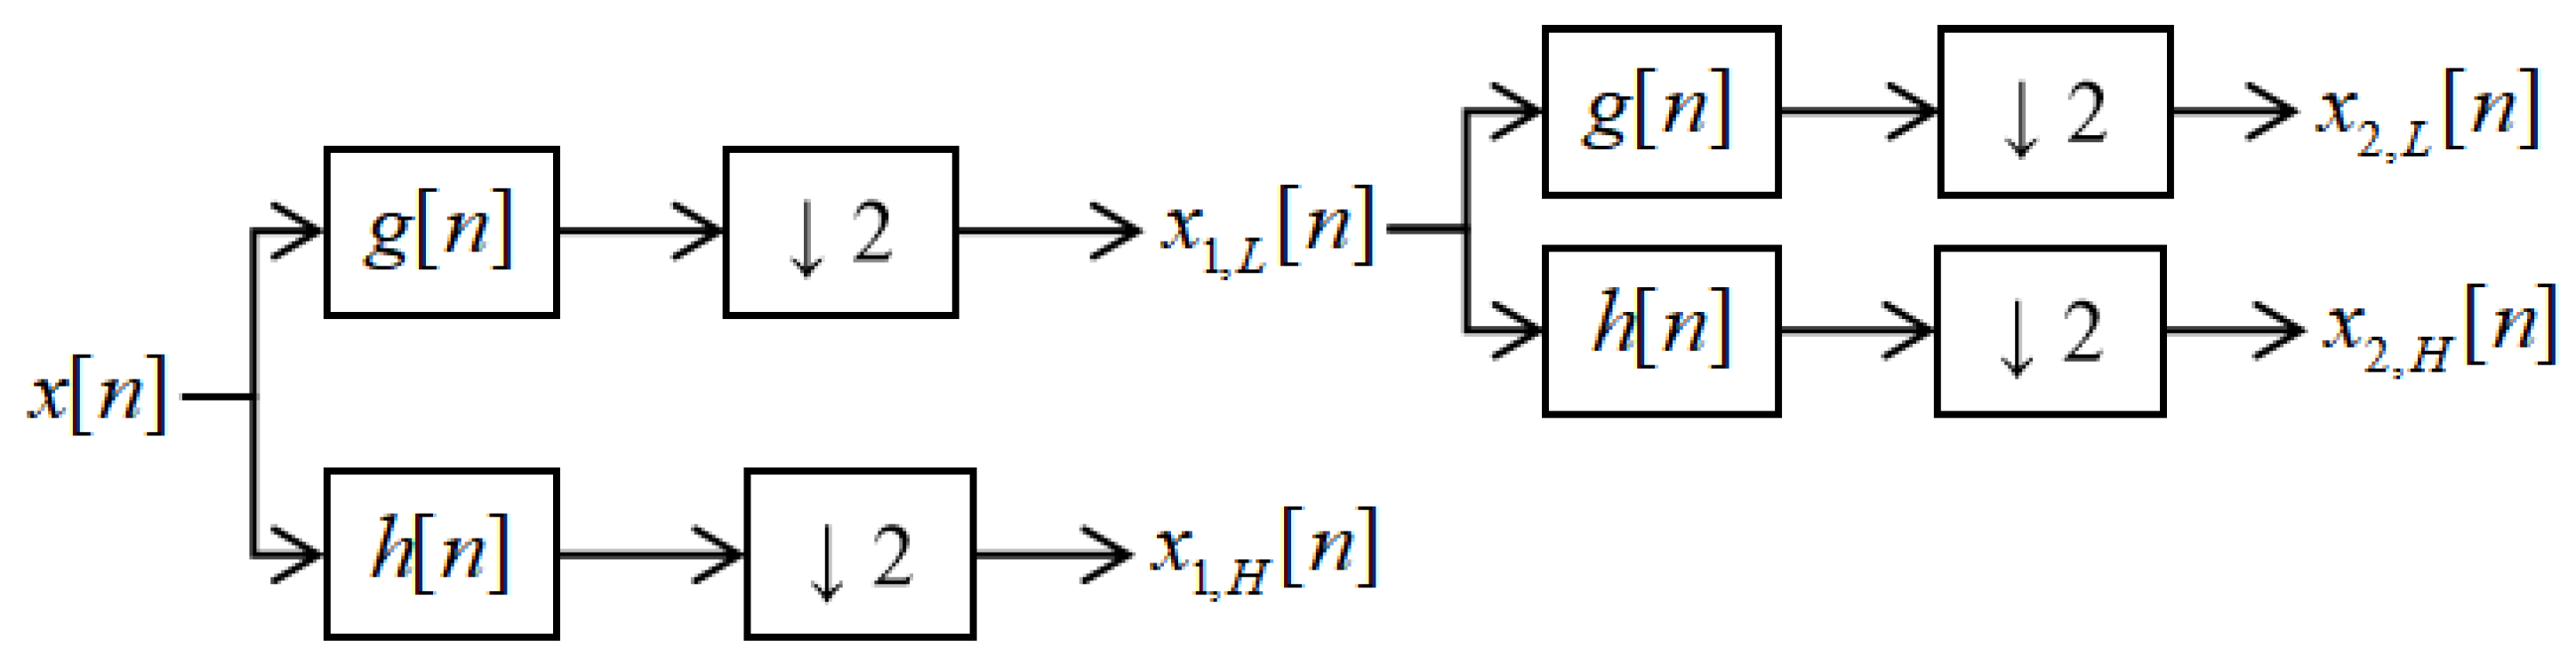
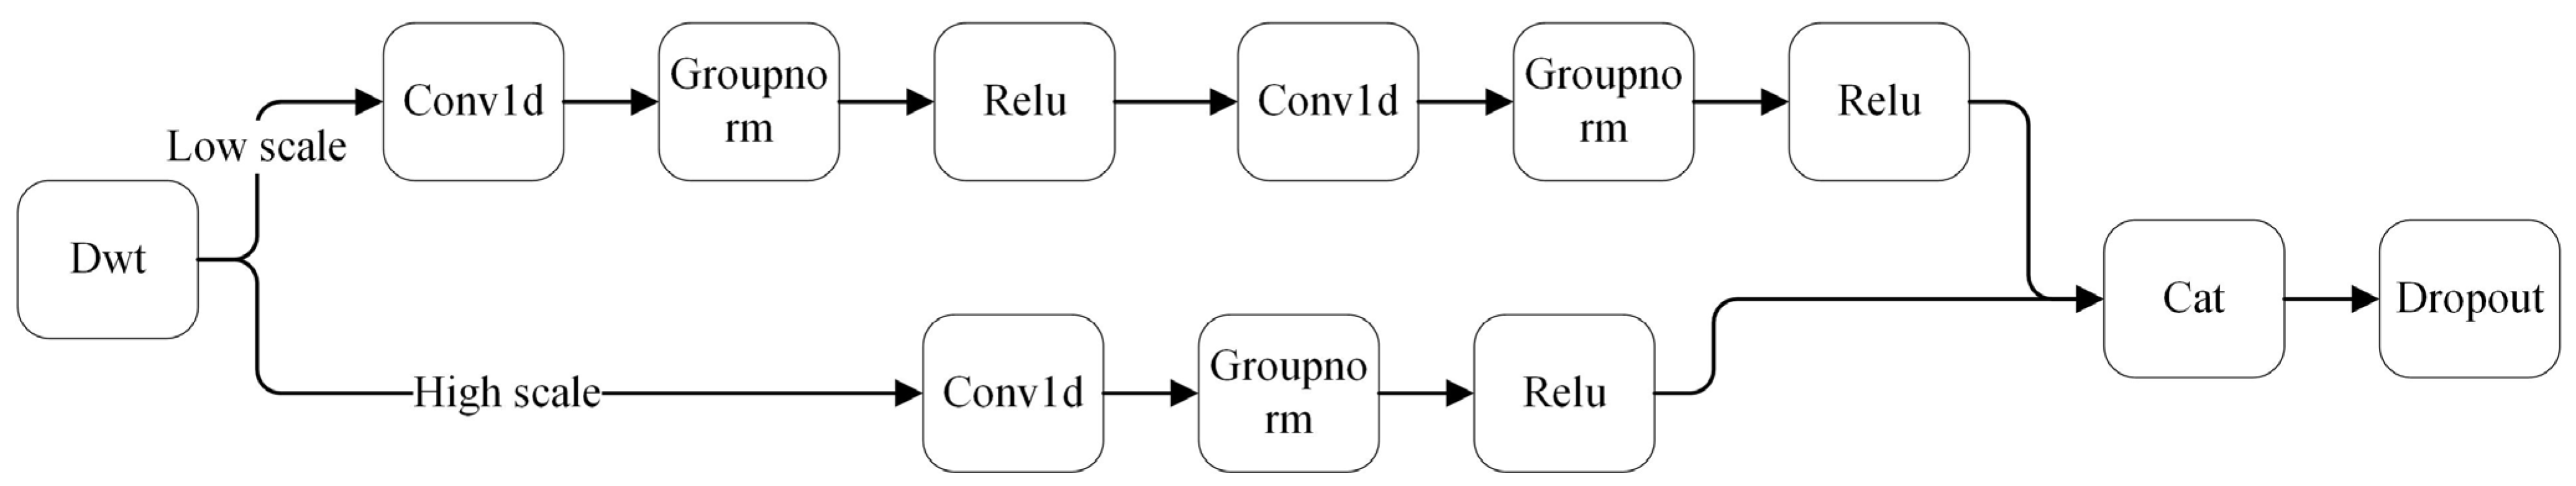
3.2. DWT Structure for Simple Coding
The combination of one-dimensional Discrete Wavelet Transform and CNN is characterized by excellent signal feature extraction capabilities. It can decompose the signal into low- and high-frequency components. Additional processing of these two components can be used for denoising and amplifying hidden information. The commonly used DWT method combined with CNN is as follows. Through the DWT layer decomposition of the signal into high- and low-frequency components, where the components or processed components are treated through the cat function and turned into the original signal dimensions consistent with the DWT layer or CWT layer instead of the first convolutional layer, this method of extracting the features of the ability to be limited cannot be processed for the subsequent features. For this reason, this paper proposes a new DWT layer to be used to extract the high- and low-frequency components, respectively, through the combination of the DWT layer and the CNN layer into a single unit to replace each convolutional layer [
26]. As shown in
Figure 5 and
Table A2, when combined with the multiscale attention mechanism described in
Section 3.3, the new DWT layer learns information hidden in the time and frequency domains of multi-current signals.
Once the DWT layer decomposes the signal into high- and low-frequency components, the high-frequency component reduces the noise through the one-dimensional convolution of a larger kernel. Moreover, the low-frequency component is formed through the one-dimensional convolution of two smaller kernels to form a simple coding and decoding and a low-frequency feature map with clearer features. A dropout layer is added to enhance robustness after recombining the high- and low-frequency components. The feature models of the low-frequency components can be extracted by different processing of high- and low-frequency components decomposed by DWT to reduce the high-frequency noise generated by the PMSM.
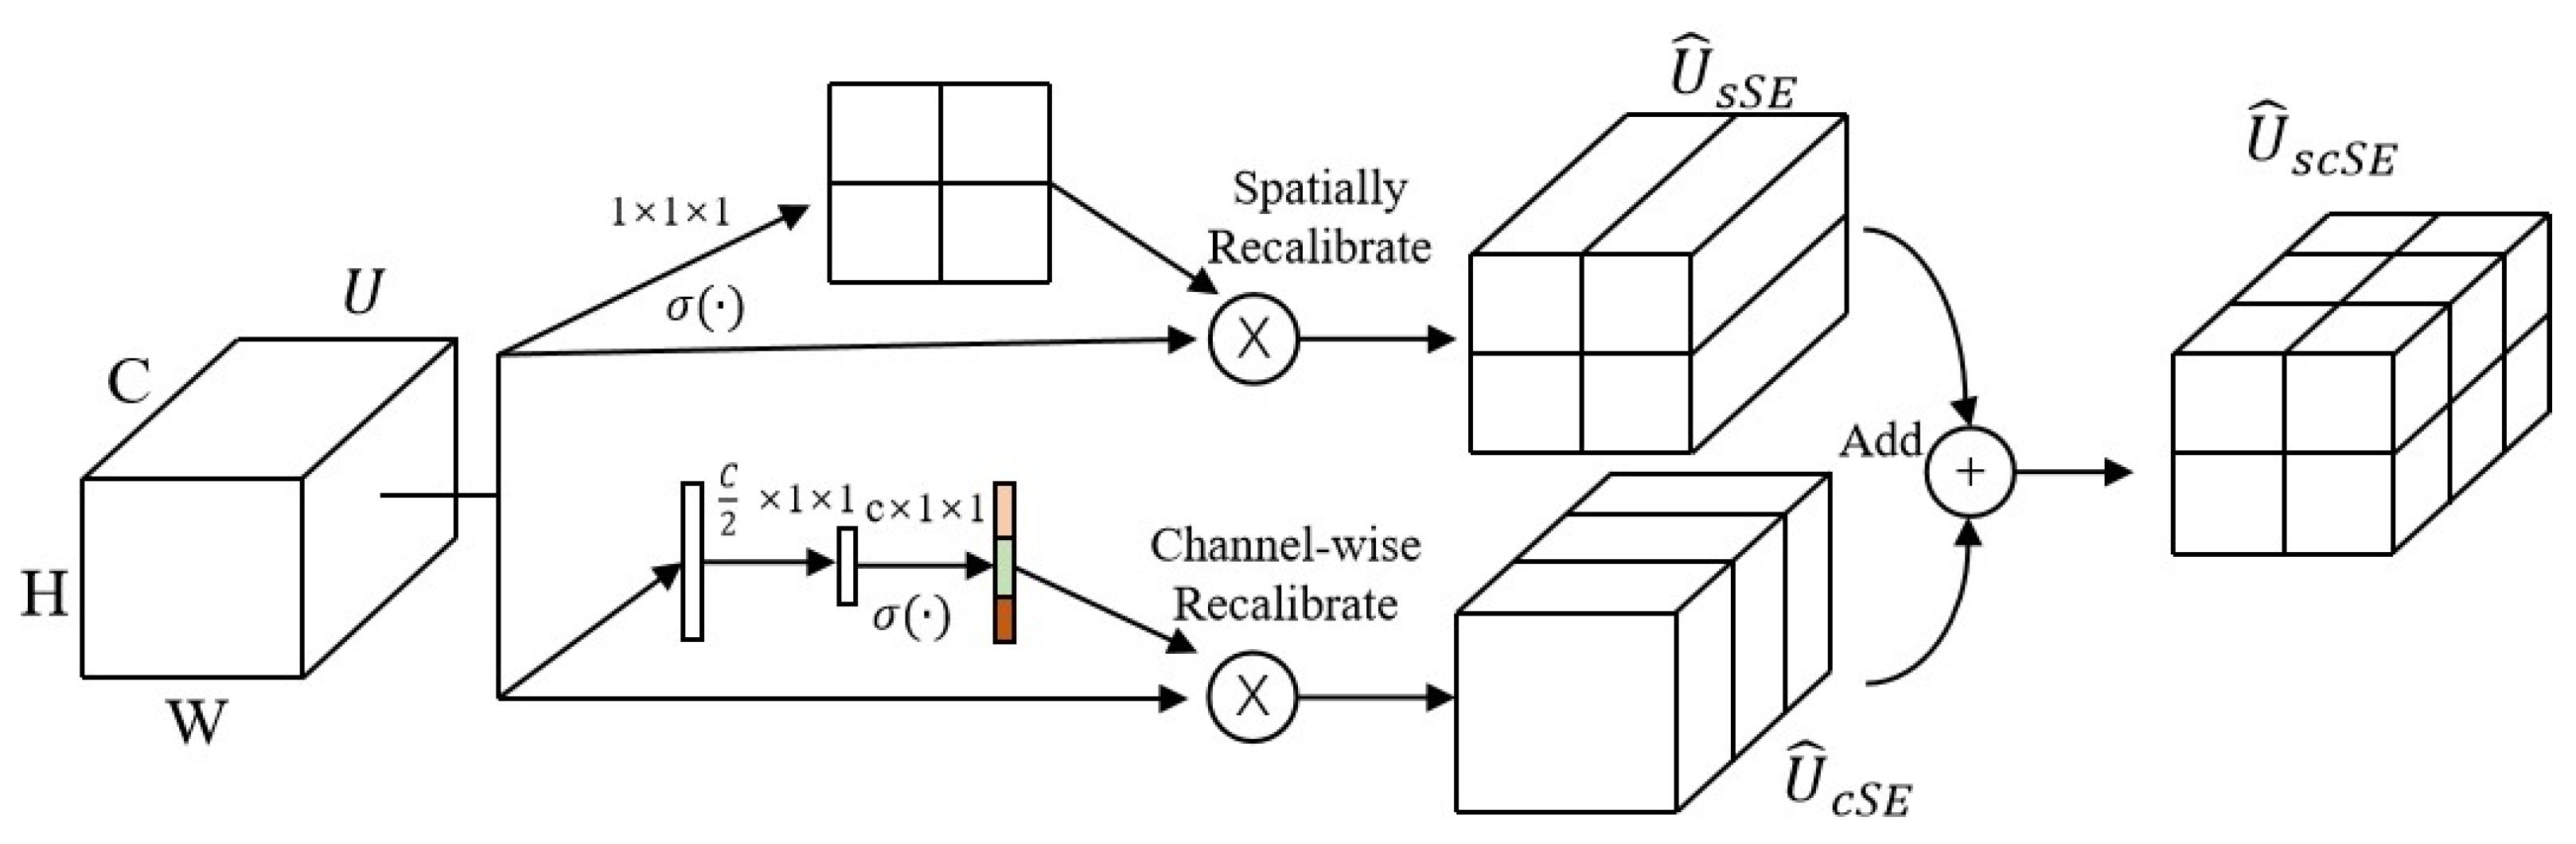
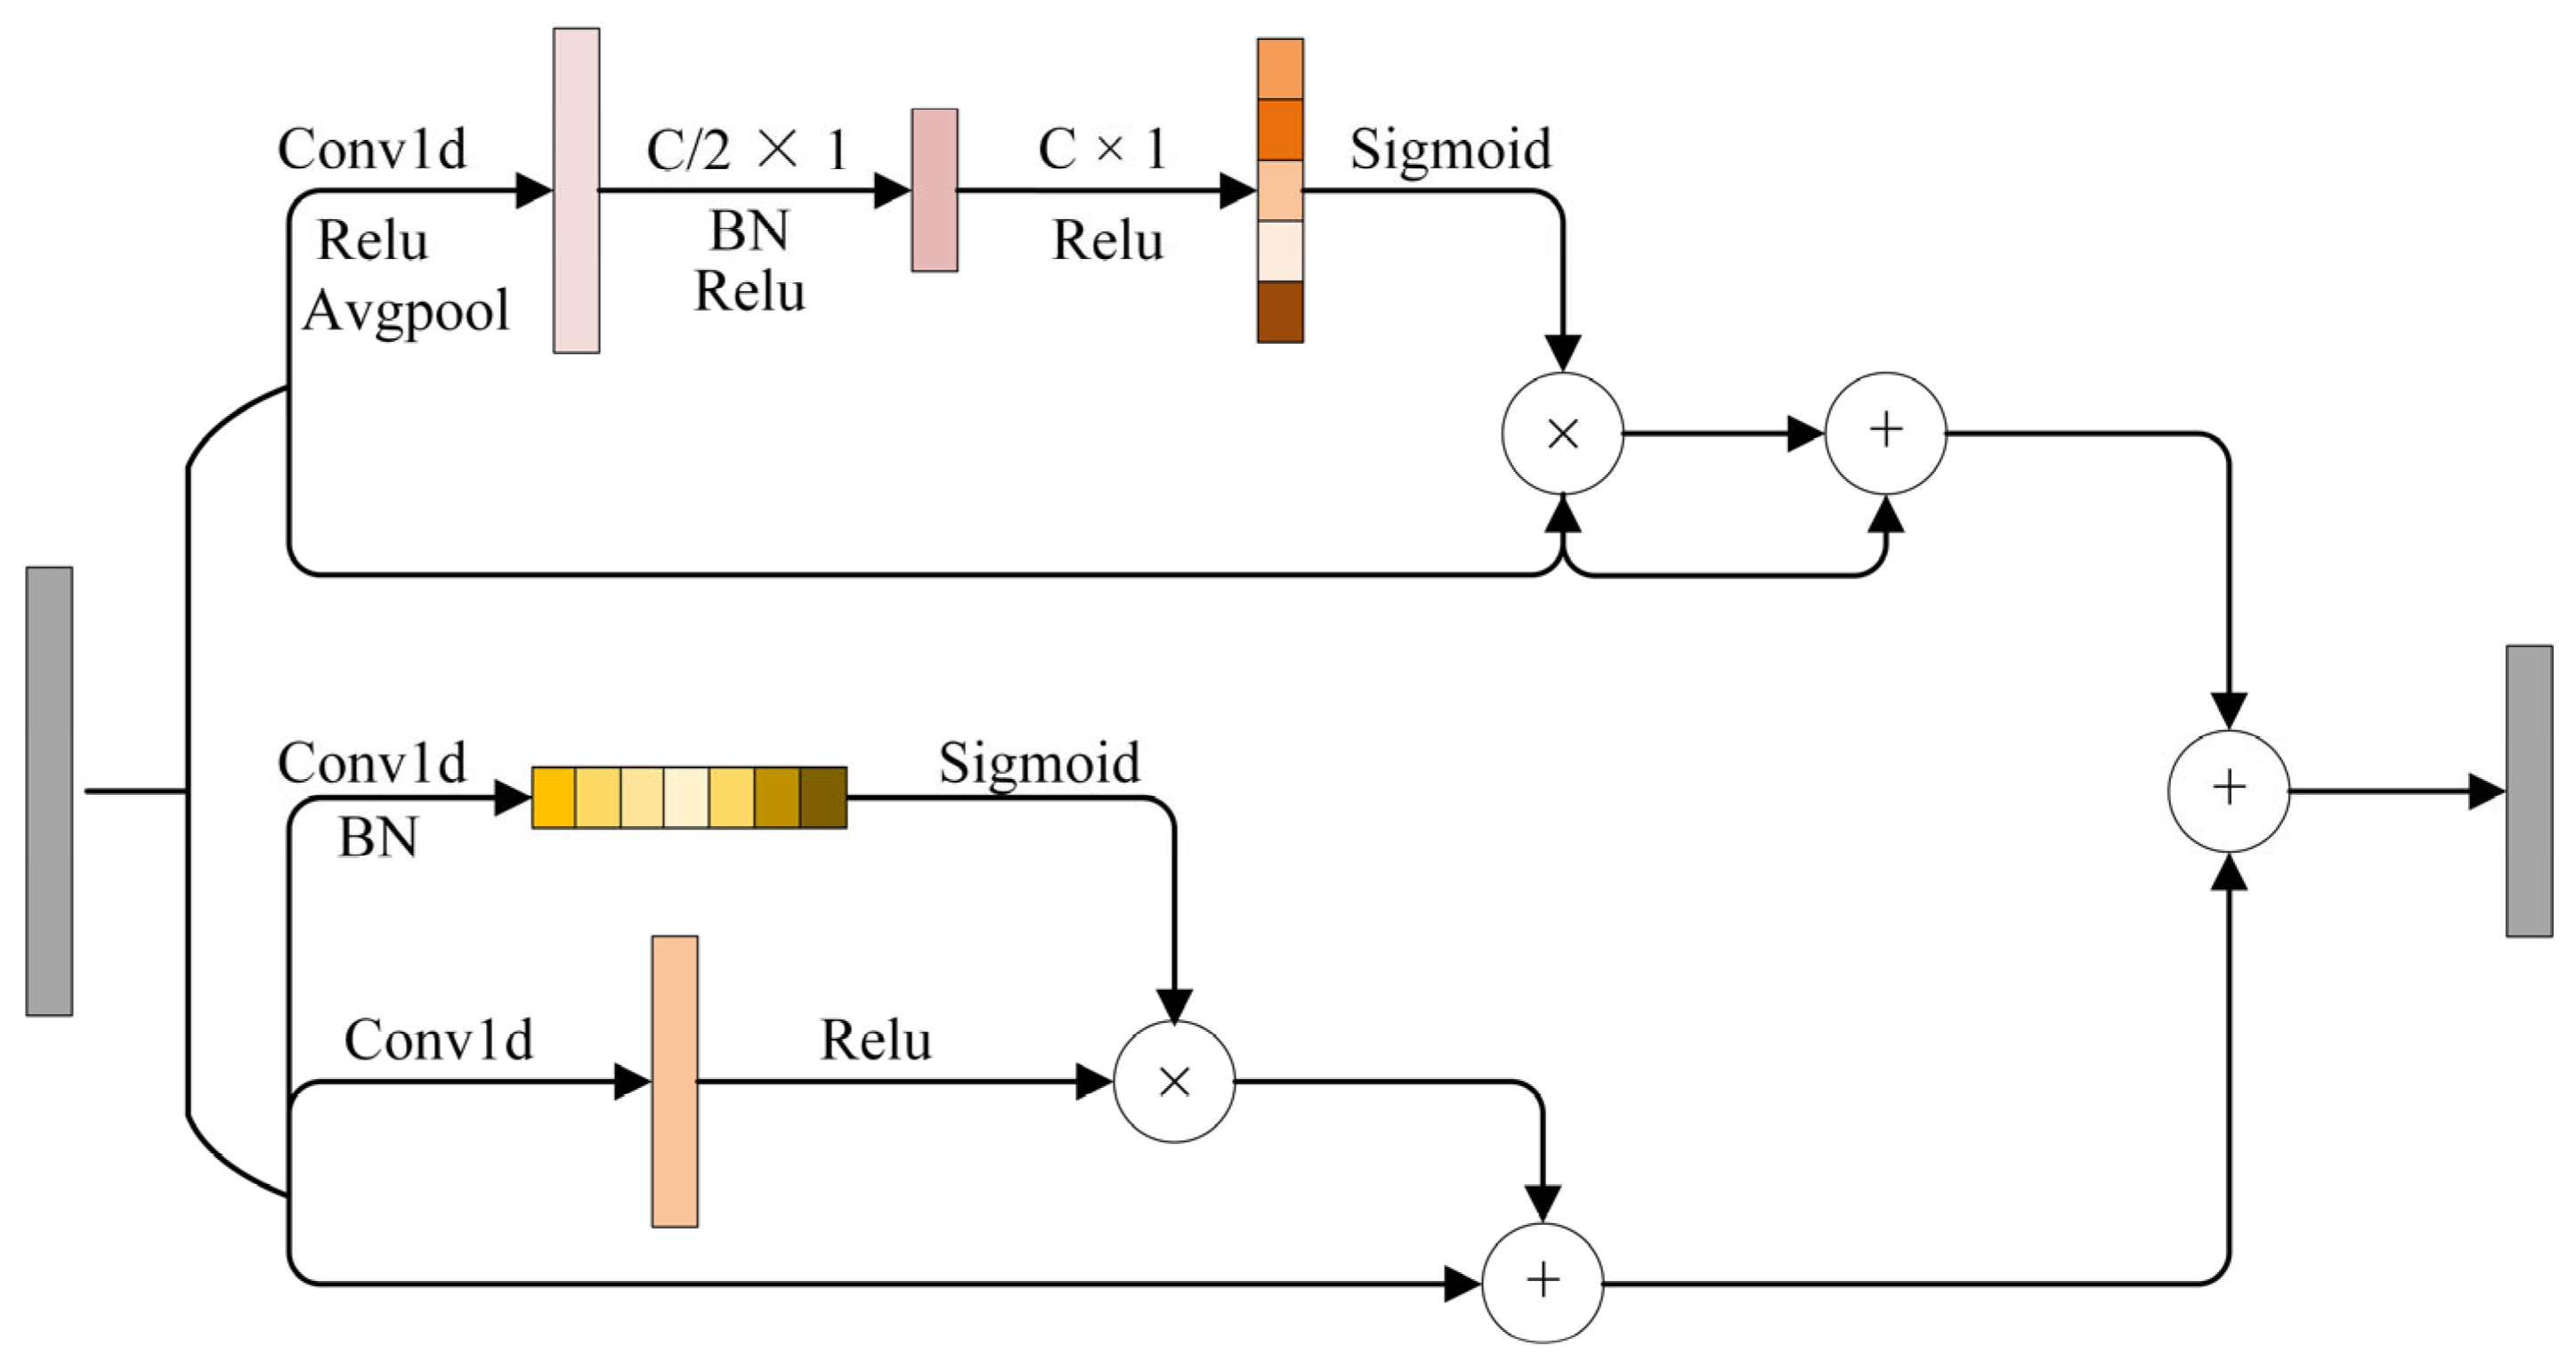
3.3. Hybrid Attention Mechanisms
The hybrid attention mechanism is effective in the visual domain, and it plays a similar role in fault diagnosis. The structure of the hybrid mechanism layer (
Figure 6 and
Table A2) comprises two attention layers, i.e., the Channel Frequency Attention Mechanism (FAM) layer and the Time Attention Layer. The FAM layer effect is consistent with that of the channel attention layer in the visual domain. The core idea of FAM is to operate in conjunction with the self-learning ability of CNN to filter out the most useful channel frequency features from the mixed features. The FAM layer first inputs the feature into a 1 × 1 convolution to reduce the input feature aliasing effect. Then, the FAM layer introduces avgpool to compress the global information into a channel representation vector. Lastly, the FAM layer maps the cross-channel feature information through two 1 × 1 convolution operations. The layer introduces a sigmoid function to map the feature vector into the 0–1 interval to form a feature weight vector. Finally, the FAM layer introduces a residual block to optimize the backward propagation.
The time attention layer effect is consistent with that of the spatial attention layer. The core idea is to leverage useful temporal features extracted by different CNNs. The time attention layer consists of two 1 × 1 convolutions to obtain different weight values, introducing ReLU and normalization functions. Finally, the input and the weighted features are combined using a matrix multiplication to obtain the final time feature.
The combination of the results from both FAM and time attention layer forms a hybrid attention mechanism. FAM extracts the frequency features of the current signal in detail, especially inconspicuous features. On the other hand, the time attention layer focuses on the temporal features of the current signal, guiding the feature learning of the CNN model to complete channel and time aspects and ensuring comprehensive feature extraction.
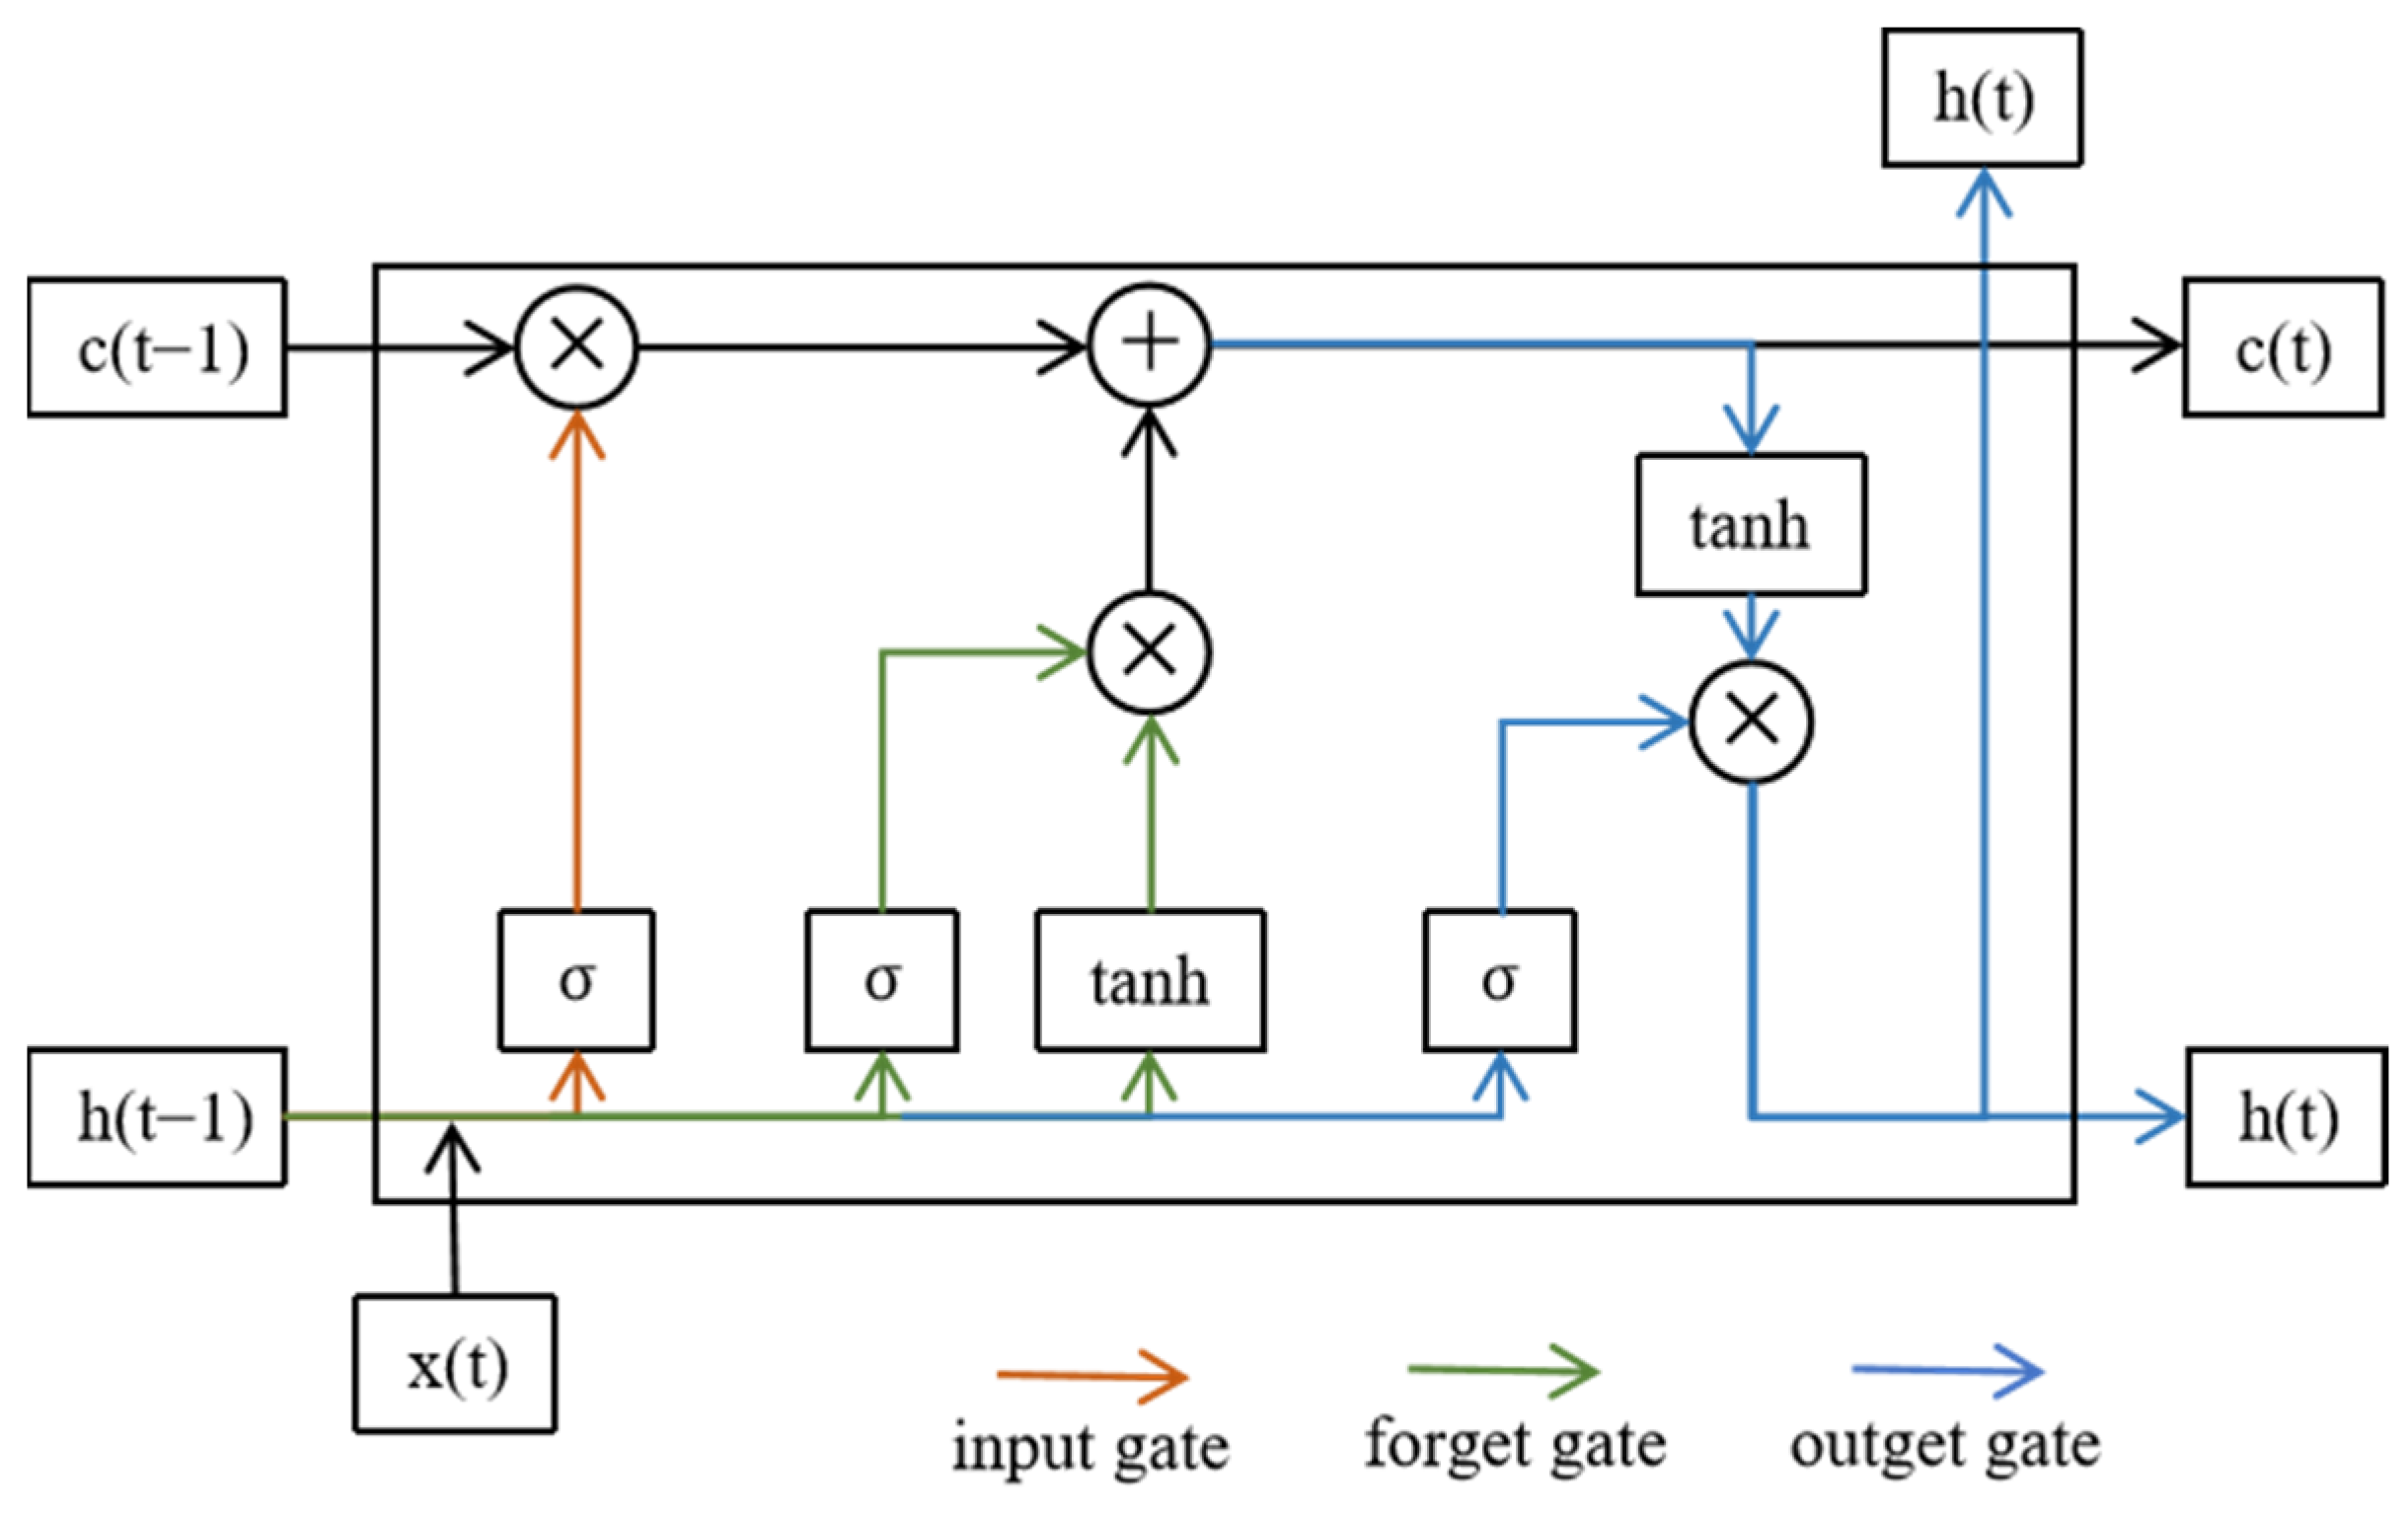
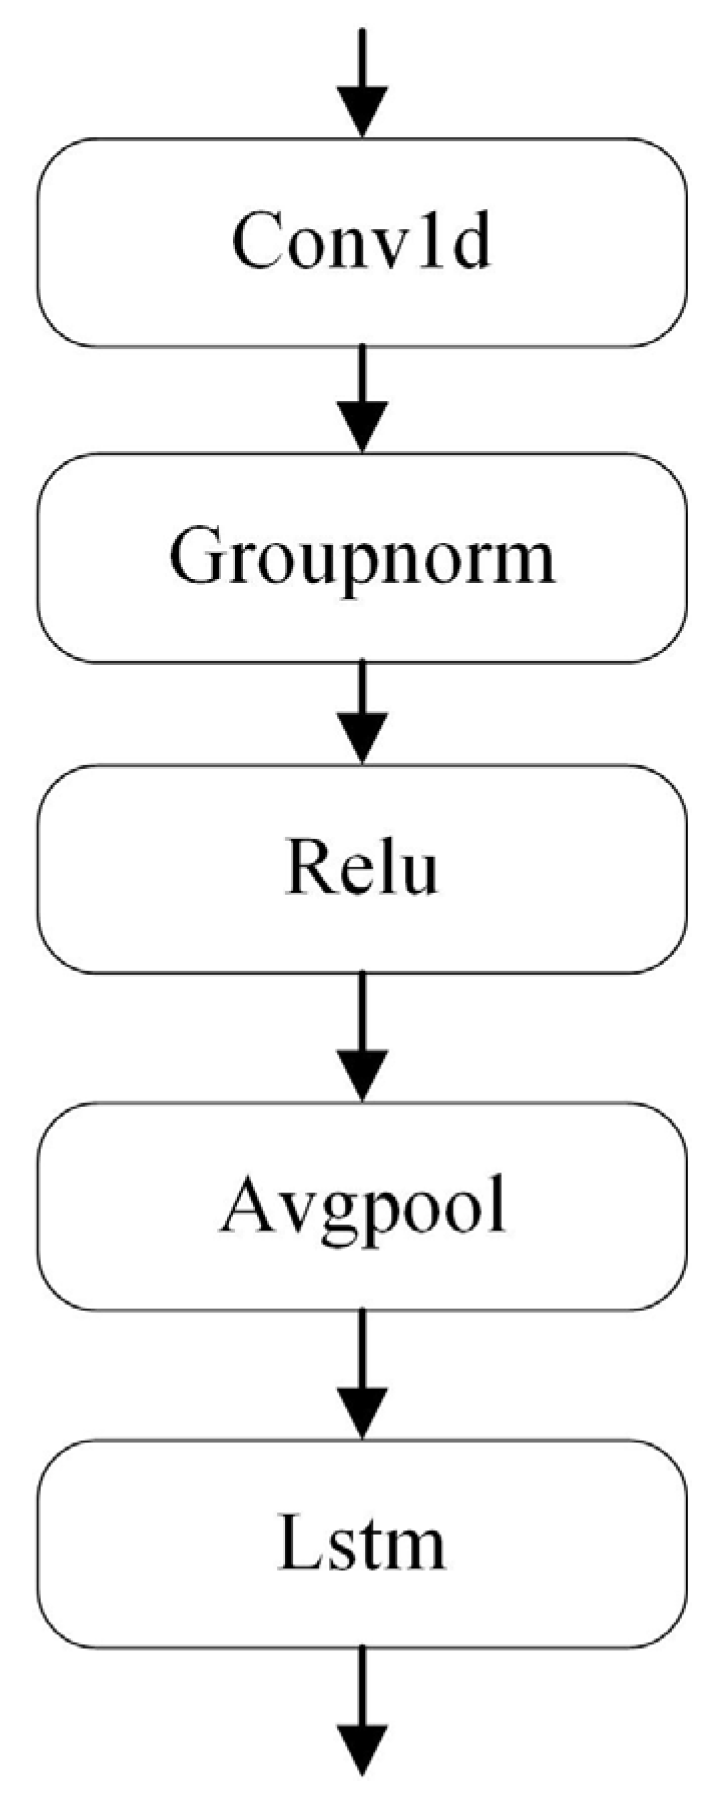
3.4. LSTM with Weight Update
The classifier for anomaly detection comprises a one-dimensional convolutional layer, a weight-updated LSTM layer, and full connectivity to fuse the linear mapping between features and outputs, as shown in
Figure 7 and
Table A2. Synchronous motor anomalies of a permanent magnet tend to arise gradually. Moreover, there is a great correlation before and after anomaly occurrence. Lastly, the hidden layer of the LSTM can connect these correlated features and select the optimal hyperparameters.
4. Method Validation
4.1. Experimental Setup and Evaluation Metrics
The proposed MAWL-CNN was tested on a computer with Intel i5-12600kf CPU and NVIDIA GTX 3060ti GPU equipped with pytorch library and pytorch wavelet [
27]. Several performance metrics [
28] such as accuracy, precision, recall, and F1 score were used to evaluate the proposed method. Accuracy is the ratio of correctly predicted samples to the total samples. At the same time, precision refers to the ratio of the proportion of actually positive samples among those predicted to be positive to the proportion of samples that are predicted to be positive. Recall refers to the proportion of samples that are actually positive among those that are predicted to be positive, and the F1 score denotes the classification accuracy of each category in the anomaly detection task. In addition, the single epoch training time was chosen as a computational complexity evaluation metric to evaluate the computational burden of the model. Four state-of-the-art methods and a single machine learning method were chosen as the basis for comparison with MWAL-CNN: a Multilayer Wavelet Attention Convolutional Neural Network (MWA-CNN) [
29], a Multiattention One-Dimensional Convolutional Neural Network (MA1DCNN) [
30], a One-Dimensional Convolutional Neural Network (1DCNN) [
31], a Deep Residual Network (ResNet18), and a Multilayer Perceptron (MLP). The training strategy for these five methods is the same as that proposed for the MWAL-CNN. Each method was executed five times in the experiment to reduce the randomness of the results and to verify the model’s robustness.
Two datasets, i.e., the real damaged motor bearing dataset and the vibration and current dataset of a three-phase permanent magnet synchronous motor with stator faults, were used in the experiments to evaluate the performance of the proposed method. The motor bearing data were obtained from the University of Paderborn, Germany, and the vibration and current dataset of a three-phase permanent magnet synchronous motor with stator faults were obtained from the Korean Academy of Sciences. Cross entropy loss and Adam’s algorithm were used in the training process, where the motor bearing data learning rate and batch size were set to 0.008 and 150, respectively. The data learning rate and batch size were set to 0.01 and 150, respectively, due to the more distinctive characteristics of the applicable current faults. Moreover, the data were not preprocessed. The mother wavelet used in this paper was the Daubechies (db) wavelet. Other wavelets, such as Haar and Dmeyer, were tested. However, their effect was slightly lower than that of the db wavelet.
4.2. Anomaly Detection of the Real Bearing Fault Data Set
4.2.1. Data Description
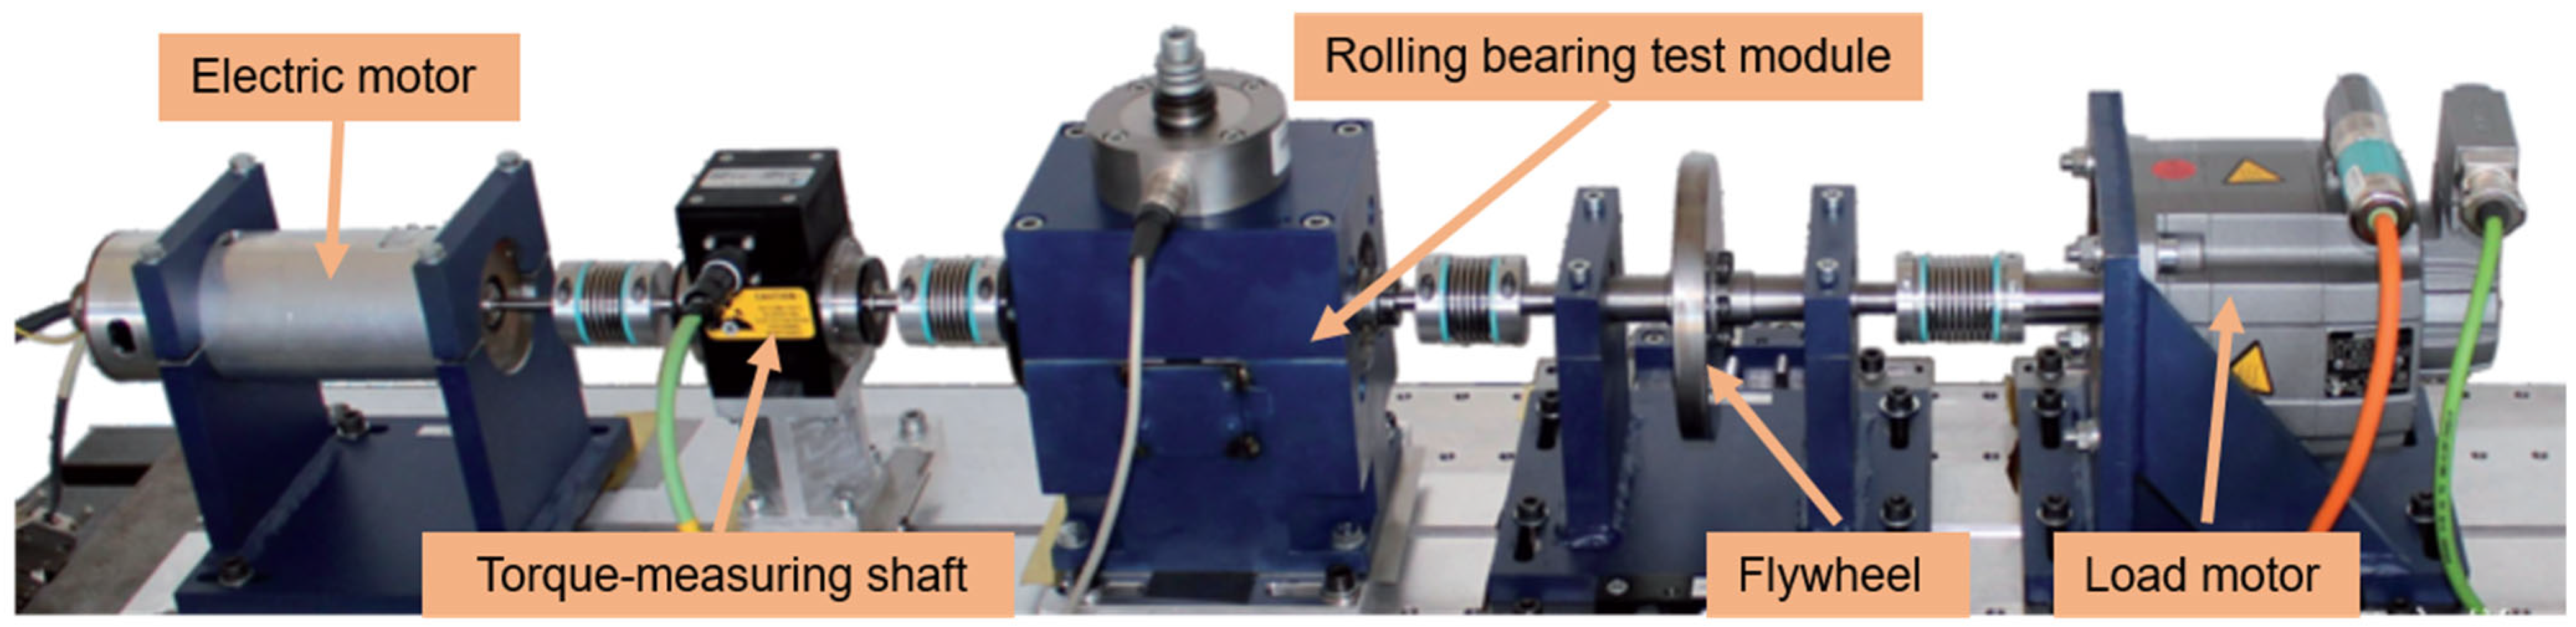
As previously mentioned, the experimental data were obtained from the acquisition test bed for the motor bearing signal at the University of Paderborn (PU), Germany [
32]. The test stand comprised several modules (shown in
Figure 8 in order from left to right): an electric motor, a torque-measuring shaft, a rolling bearing test module, a flywheel, and a load motor. The test rig generated experimental data by mounting ball bearings characterized by various damage degrees in the bearing test module. The faulty bearings were classified into artificial damage and real damage. Only the real damage bearing data were used in this paper to better test the practicality of the model in real scenarios. The real damage was obtained via an accelerated life test rig, which comprised a bearing housing and an electric motor, providing power to the shafts of four type 6203 test bearings in the housing. The test bearings rotated under the radial load applied by a spring-screw mechanism. Failures included three types.
Single-point damage (single damage): a single component of a rolling bearing is affected by a single damage, such as a pitting pit on the inner ring.
Repetitive damage: the same damage symptoms in the same bearing parts of several places repeatedly; for example, the inner ring has more than one non-continuous pitting.
Multiple damage: different ring-breaking symptoms occur in different parts of the same bearing, such as pitting pits on the inner and outer rings.
These three types of damage comprise a total of 14 categories. Detailed parameters are shown in
Table 1.
The sampling frequency of the current and vibration signals used in this experiment was 64 kHz, and the sampling frequency of mechanical parameters (loading force, loading torque, speed) was 4 kHz. Specifically, the dataset chosen for the analysis was “N09_M07_F10,” comprising 20 samples for each fault type, with each sample having a length of 256,823 data points. The sliding window function increased the signal samples. The length of each sample was 2048 × 1, and the training and test samples were divided according to the ratio of 7:2:1. Thus, a total of 24,544 training samples, 7012 validation samples, and 3508 test samples were obtained.
4.2.2. Comparative Analysis
Experiments were conducted on MWAL-CNN, four state-of-the-art models, and a single machine-learning model, with the results shown in
Table 2. The network using convolutional networks as the main body outperformed the machine learning representative MLP in every way. Of the five convolutional main body models, the proposed MWAL-CNN exhibited a high accuracy of 99.772% and an F1 score of 99.786%. From the time, it can be seen that the proposed model exhibited a time difference of 1 s relative to the other advanced models, and 1DCNN and MLP required less time due to the simplicity of their models, thus achieving satisfactory results in the fault diagnosis task.
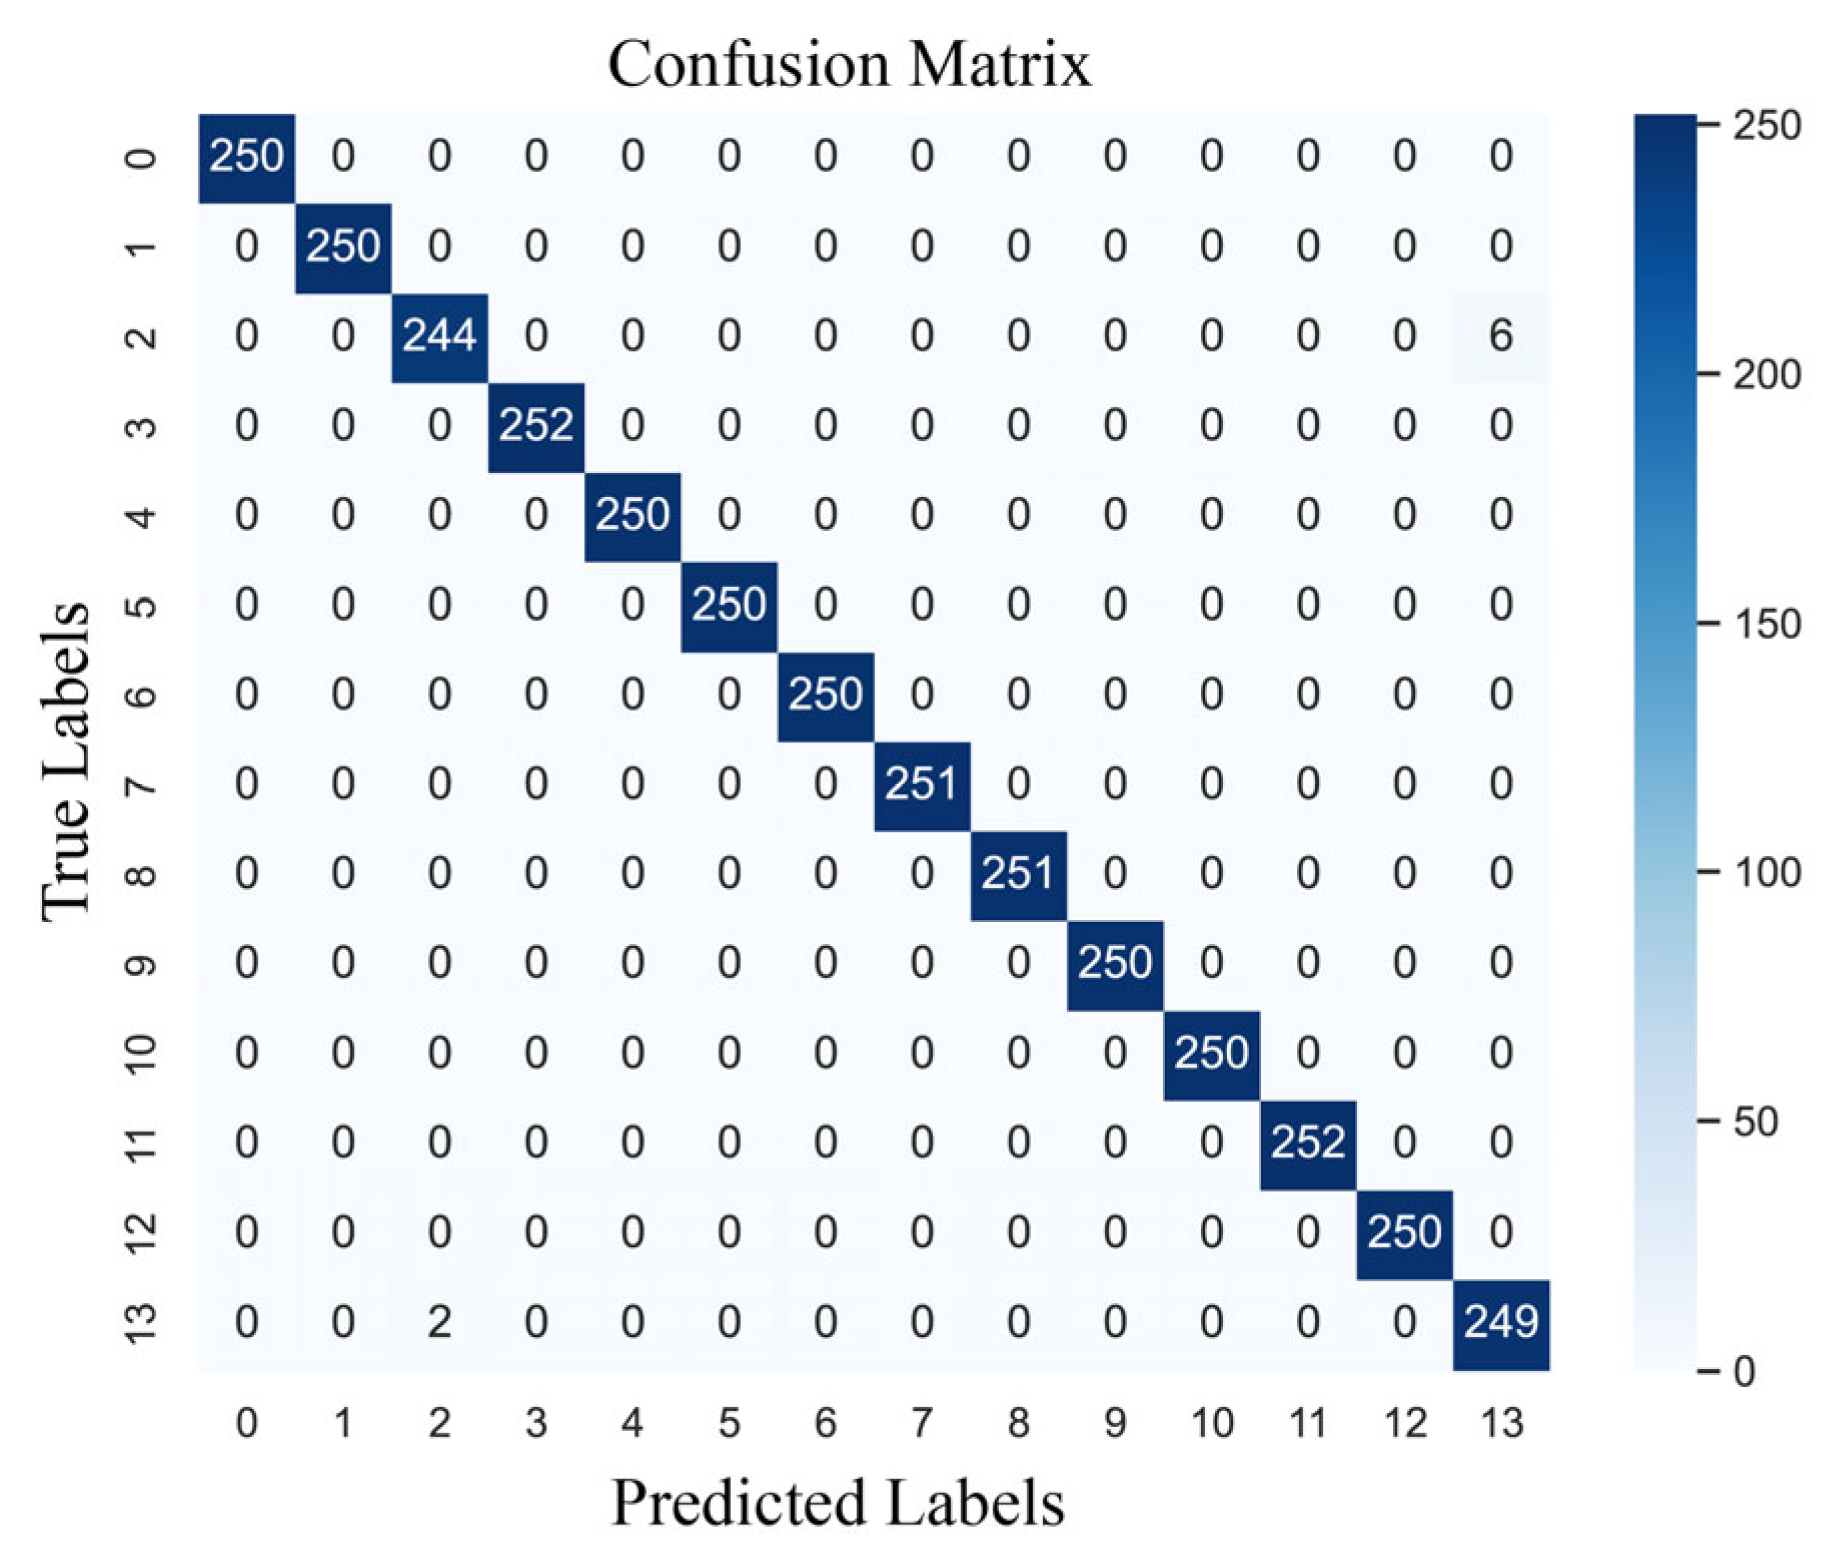
The confusion matrix for one of the training models in this paper is shown in
Figure 9, with the values along the diagonal indicating the number of correct samples for each category. There was only a single classification error in category 12, while the rest were correctly classified. Therefore, it can be concluded that the model obtains good detection results for most of the real bearing faults of motors.
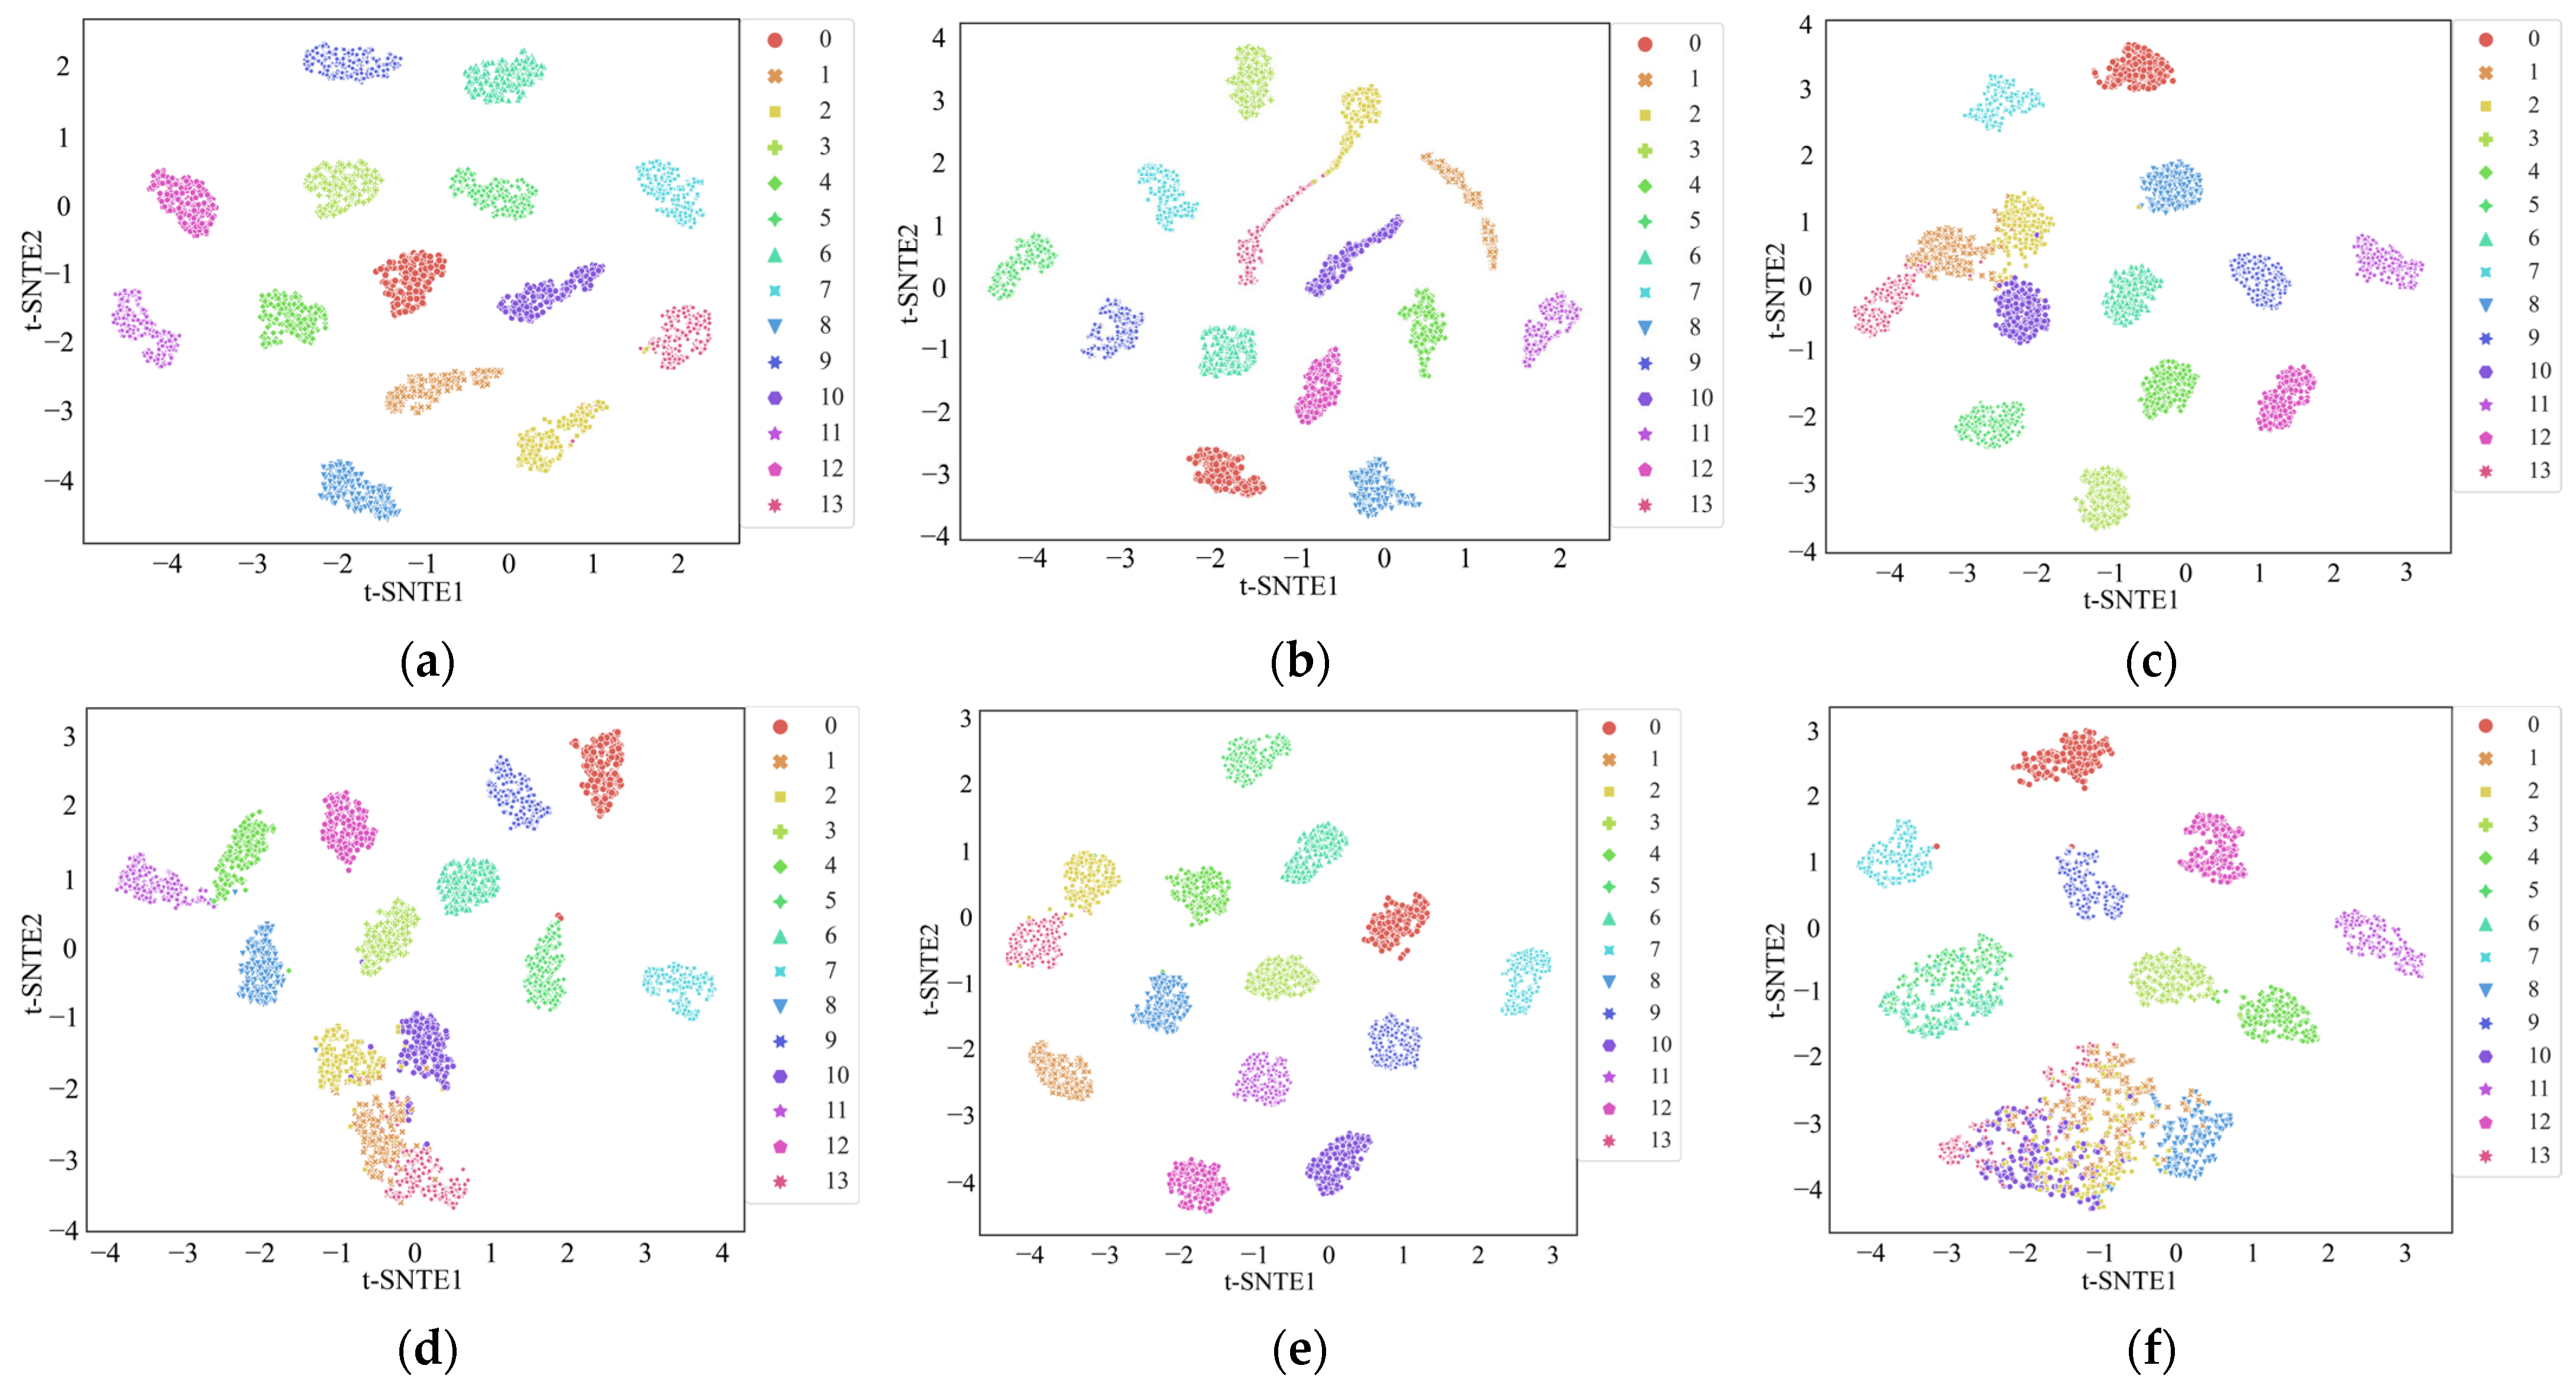
The t-distributed Stochastic Neighbor Embedding (t-SNE) algorithm was introduced to visualize the distribution of the results from the six methods and provide more intuitive results [
33]. In a good classification model, the high-dimensional features extracted in the intermediate layers should separate features into a lower dimension, allowing a visual assessment of feature clustering. As shown in
Figure 10, each color represents a different state of the motor. It is evident that, compared to the other five methods, the feature distribution map associated with the MWAL-CNN almost entirely distinguishes between each category. Furthermore, the other networks exhibited some instances of overlapping categories or misclassification. This observation indicates that the MWAL-CNN model has better discriminative power, confirming the superiority of the proposed method.
4.2.3. Effectiveness of Multiple Current Signals
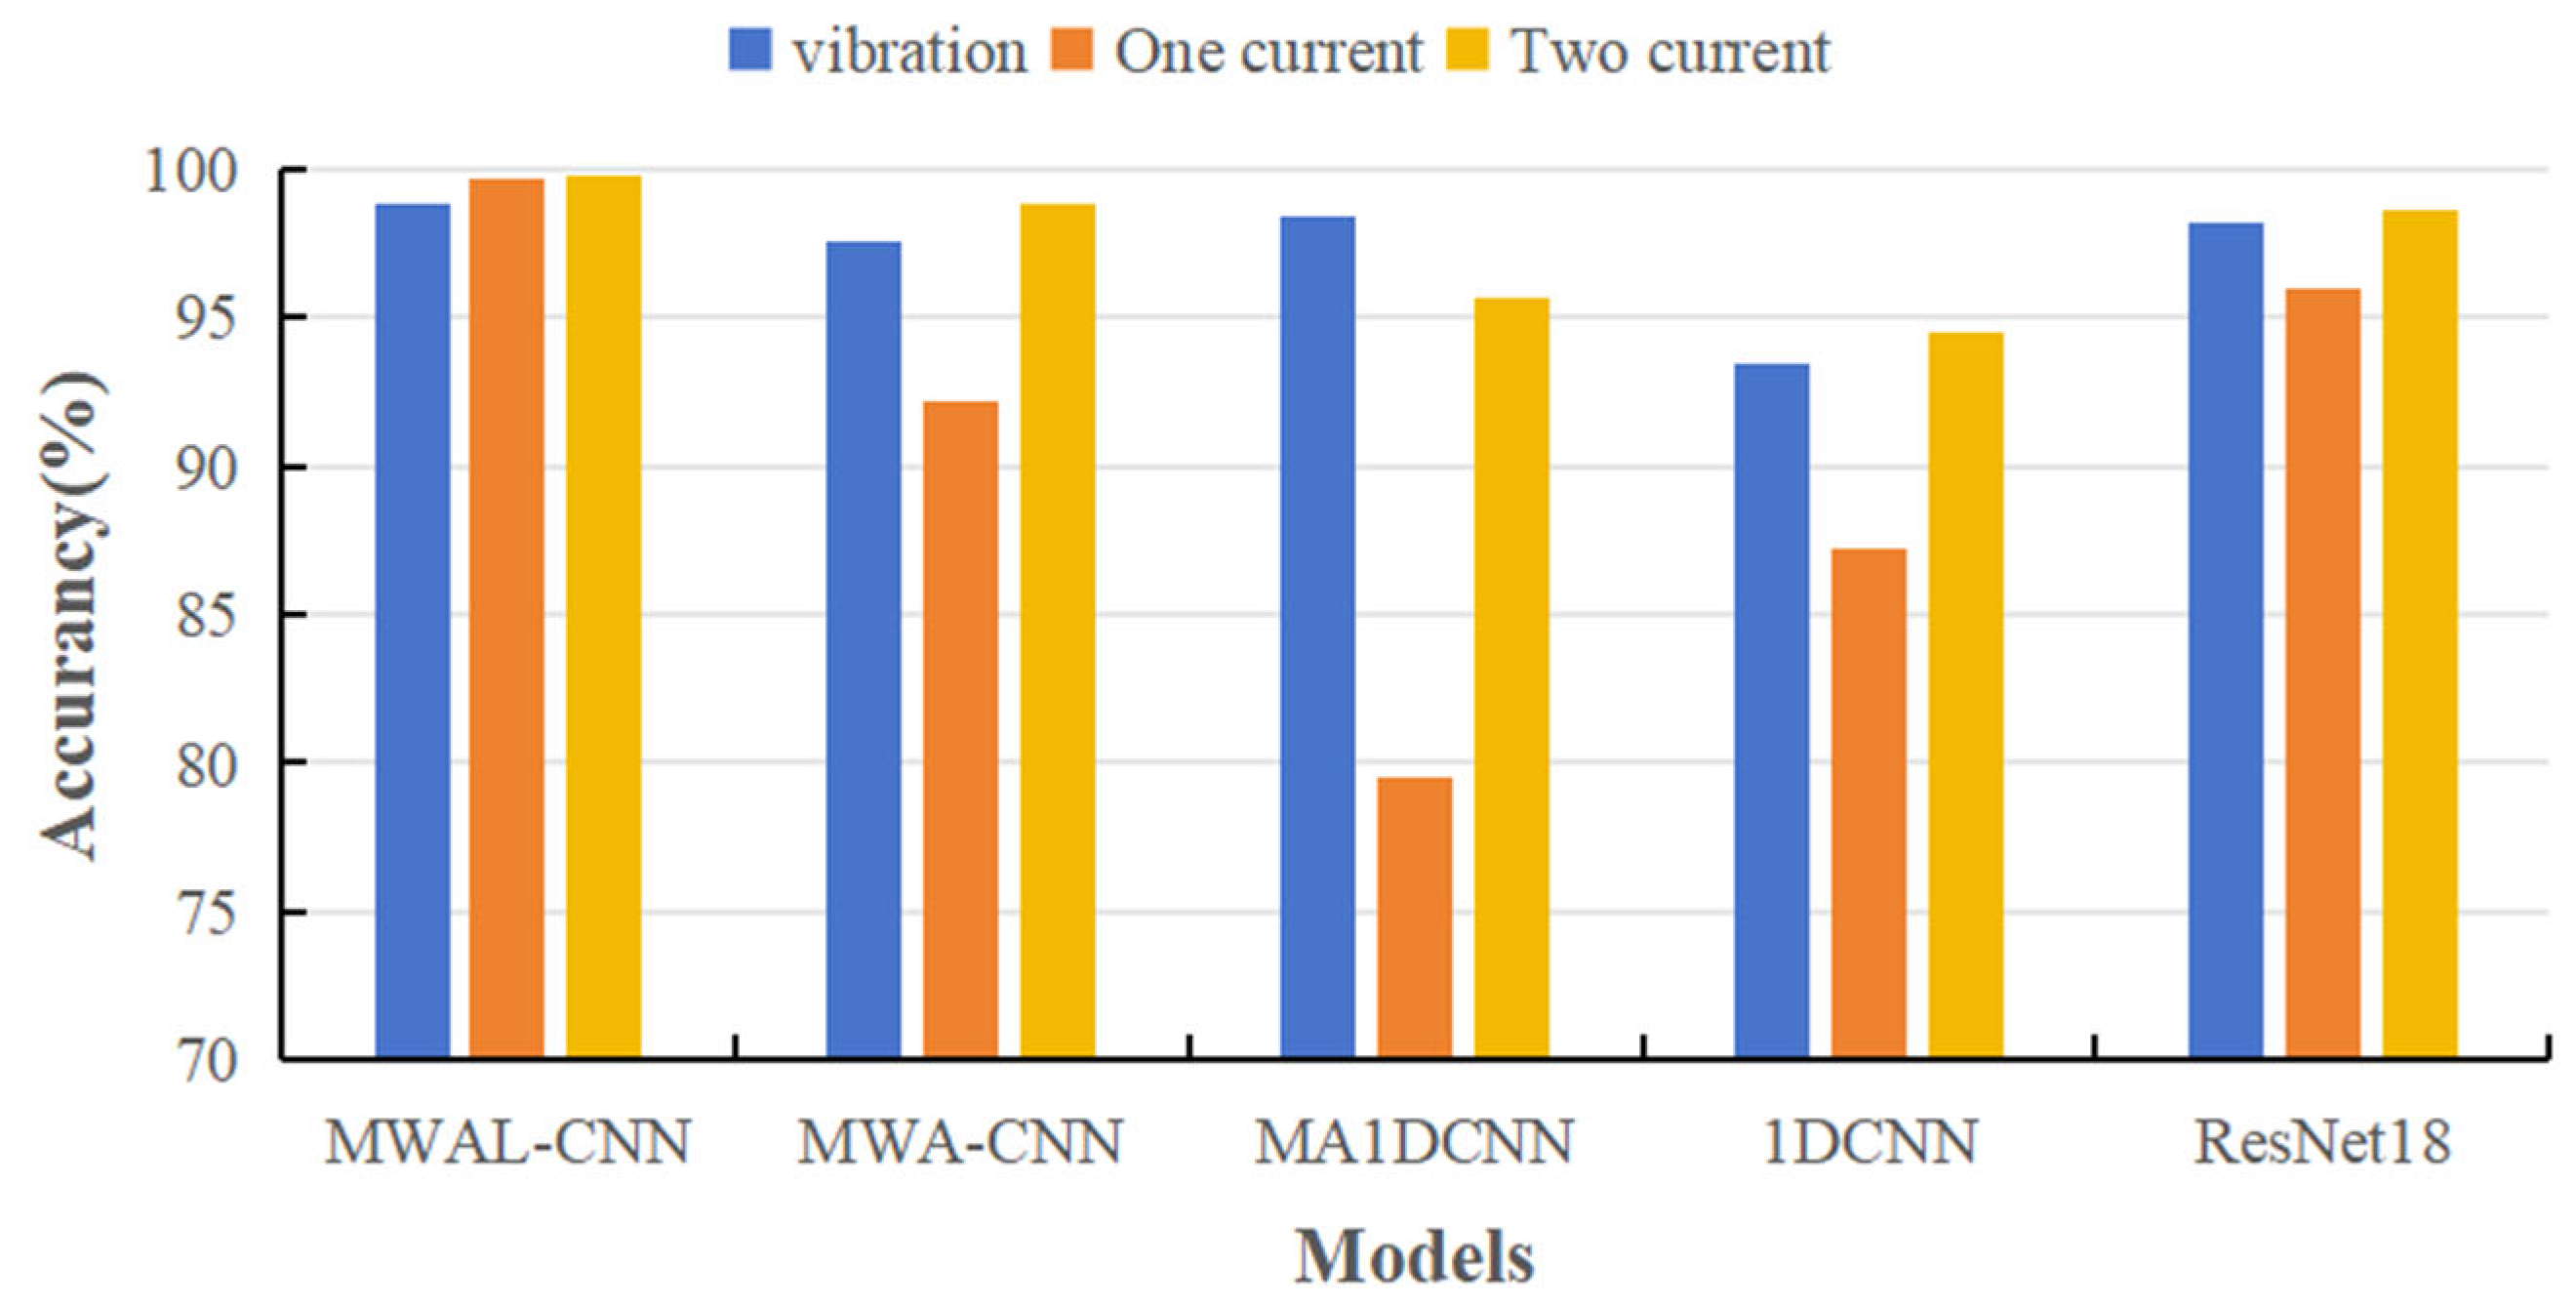
Four types of advanced models and the proposed model (a total of five model types) were selected in this paper to verify the effectiveness of multi-current fusion. A single vibration signal and multiple current signals were tested and compared across five model types. Each type of experiment was executed five times; only the current dimension was changed, while the remaining conditions remained the same. Only the accuracy rate and F1 score were used as evaluation indices. The results are shown in
Table 3 and
Figure 11.
It can be observed that most models worked well for a single vibration signal. Moreover, some models used a single current signal to correctly identify the true bearing abnormality of the motor with low accuracy. In addition, most models attained a high accuracy rate and F1 score for multi-current abnormality detection. It can be inferred that a single-current signal contains significantly fewer features than a vibration signal. Therefore, the anomaly detection of a single-vibration signal is stronger than that of a single-current signal. Moreover, fusing the features of a multi-current signal results in more features than the single-vibration signal, a phenomenon which can be interpreted as the validity of the multi-current signal.
4.2.4. Validity of the Included Modules
Ablation experiments with six control variables were designed to verify the validity of the different modules used in the proposed model. All model structures were the same as those of the MWAL-CNN (except for the missing modules) and can be defined as follows:
- (1)
The original model with only a three-layer CNN has a structure containing only three one-dimensional convolutional modules and a DWT structure without high- and low-frequency processing. The model’s name is CNN.
- (2)
The three-layer CNN model is based on the DWT module containing high- and low-frequency processing. The model’s name is CNN-W.
- (3)
The three-layer CNN model is based on the hybrid attention mechanism module, denoted as CNN-A.
- (4)
The three-layer CNN model is based on the addition of a hybrid attention mechanism and a weight update for two modules of the LSTM and has no high- and low-frequency processing DWT structure, and the model is denoted as CNN-AL.
- (5)
The three-layer CNN model is based on adding two modules of DWT for high- and low-frequency separation and LSTM for weight update without a hybrid attention structure; the model’s name is CNN-WL.
- (6)
The three-layer CNN model is based on the addition of high-frequency separated DWT and two hybrid attention t-modules. No weight update is included for the LSTM structure, and the model is denoted as CNN-AW.
Since the combination of a three-layer CNN model and a hybrid attention mechanism module with few layers can easily cause overfitting, the case is not discussed in this paper. The experiments used the accuracy rate and F1 score as evaluation indices. The results are shown in
Table 4, from which it can be evinced that the model CNN-W, with the addition of high- and low-frequency fused DWT structures, was able to improve the accuracy rate by 33.637% compared to a single three-layer CNN model. This percentage is significantly higher than that of the other two modules. Furthermore, the accuracy rate improvement of the added two modules containing high- and low-frequency fused DWT structures is greater than that of the other models, indicating that the high- and low-frequency fused DWT can fuse the current features. Moreover, its feature extraction ability is even greater than the sum of the hybrid attention mechanism and the weight update for LSTM. Adding only the hybrid attention module will cause the model to extract too many small features, resulting in overfitting.
Combining the DWT module with separate high- and low-frequency processing can force the model to play an important role in the extraction of inconspicuous features. For example, the accuracy of the CNN-AW model was 0.856% higher than that of other models, indicating that the high- and low-frequency fused DWT can fuse the current features. Moreover, its feature extraction ability was found to be even greater than the sum of the hybrid attention mechanism and the weight update for LSTM.
Adding only the hybrid attention module will make the model extract too many small features, resulting in overfitting. Combining the DWT module with separate high- and low-frequency processing can force the model to play an important role in the extraction of inconspicuous features. For example, the accuracy of the CNN-AW model was 0.856% higher than that of CNN-W, while the accuracy of the MWAL-CNN model was 1.824% higher than that of CNN-WL. Adding the LSTM module with weight updating improved CNN-L by 16.22% compared to CNN. On the other hand, the MWAL-CNN model improved CNN-AW by 1.482%, indicating that the addition of the LSTM module with weight updating further improves the anomaly classification ability of the CNN model.
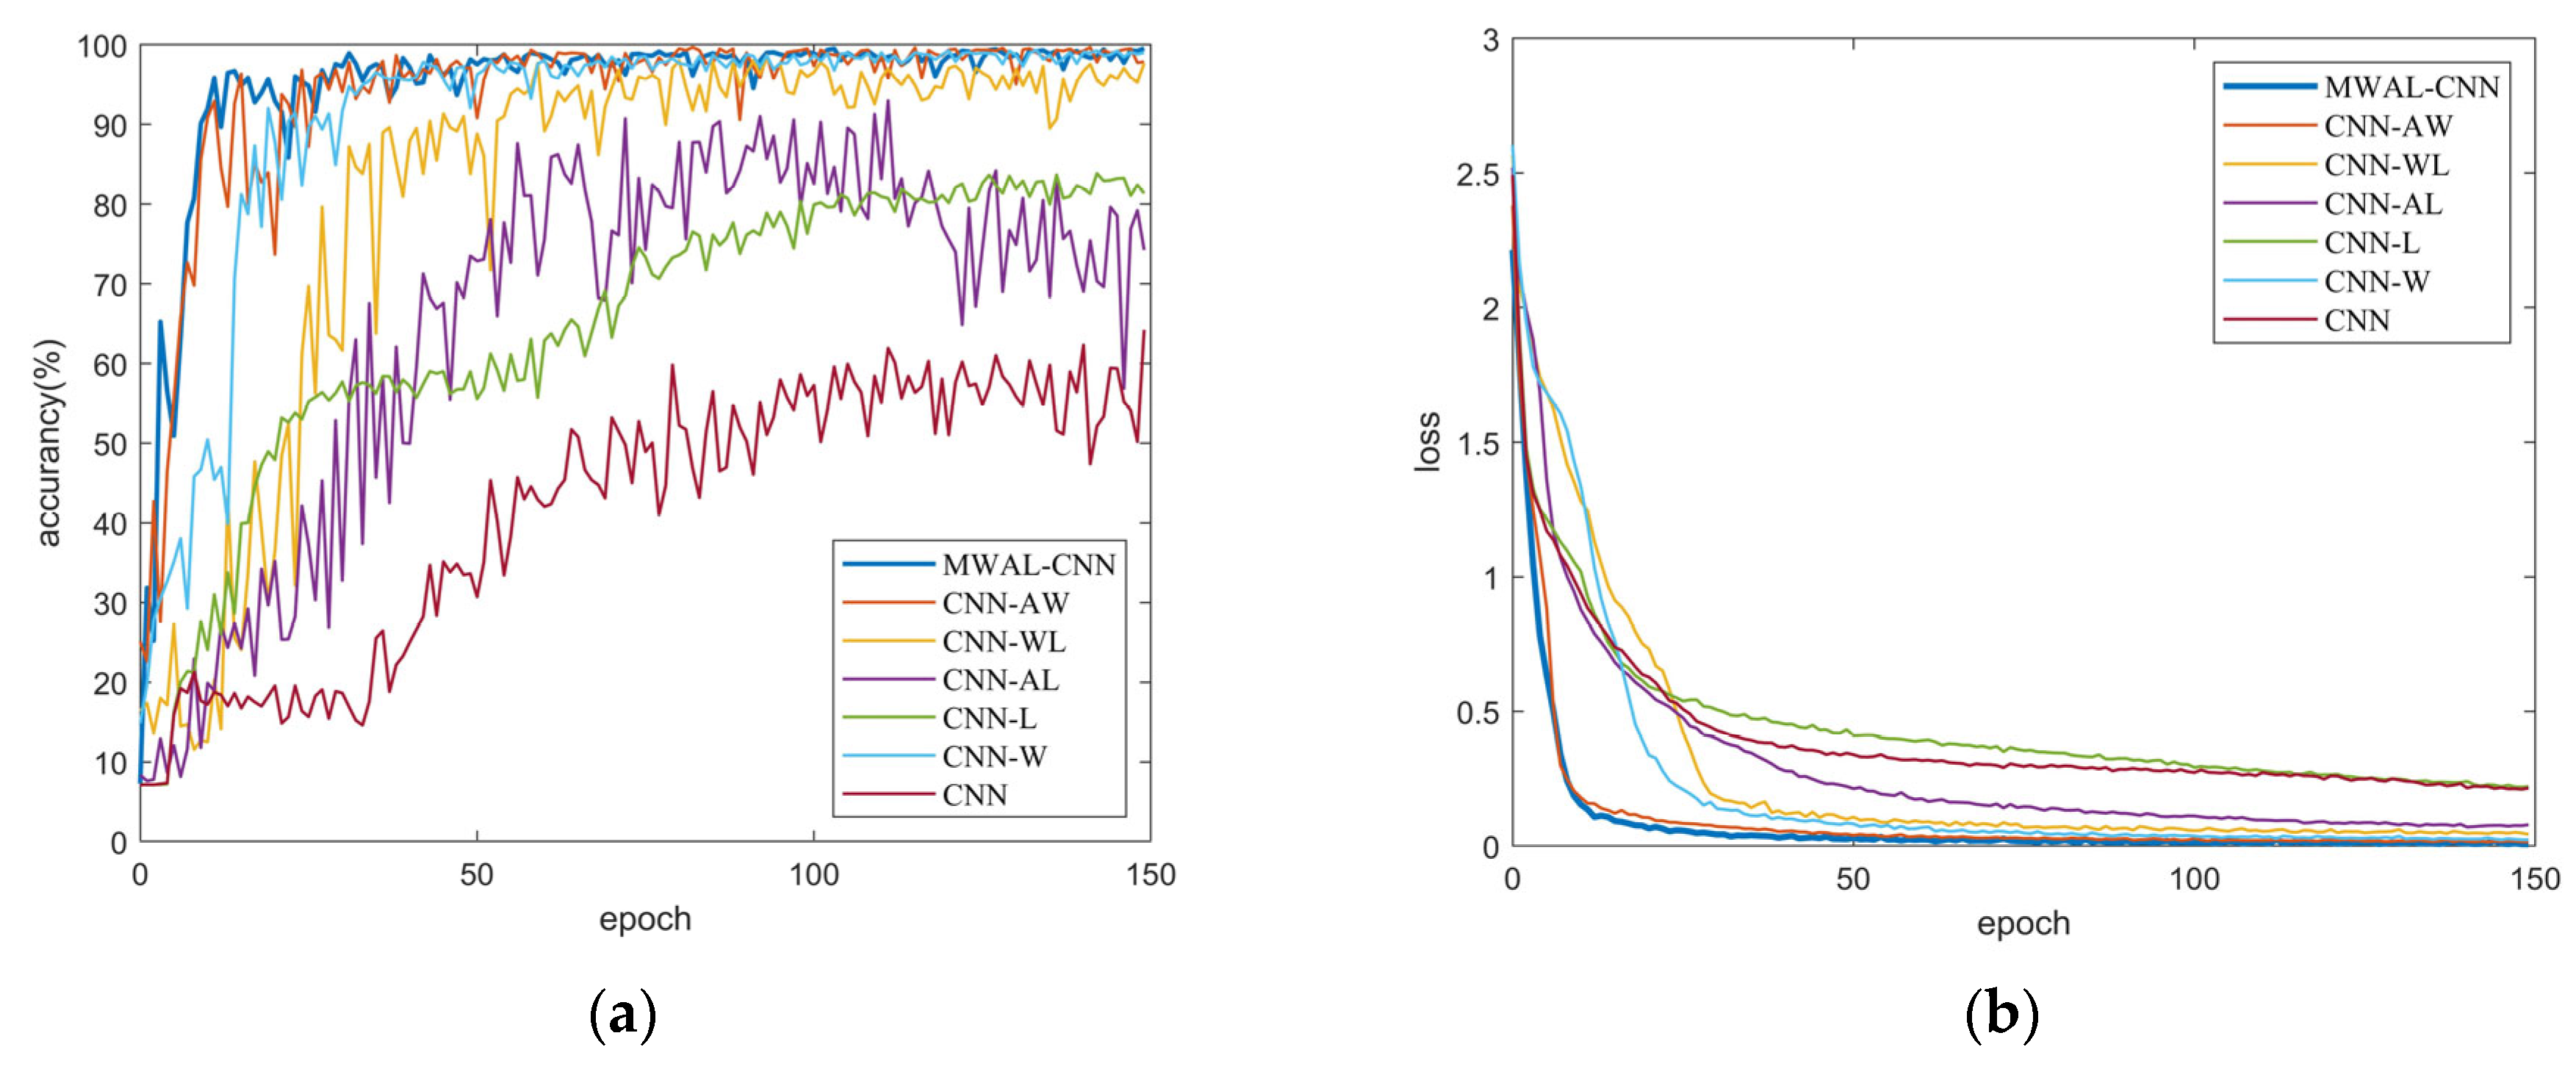
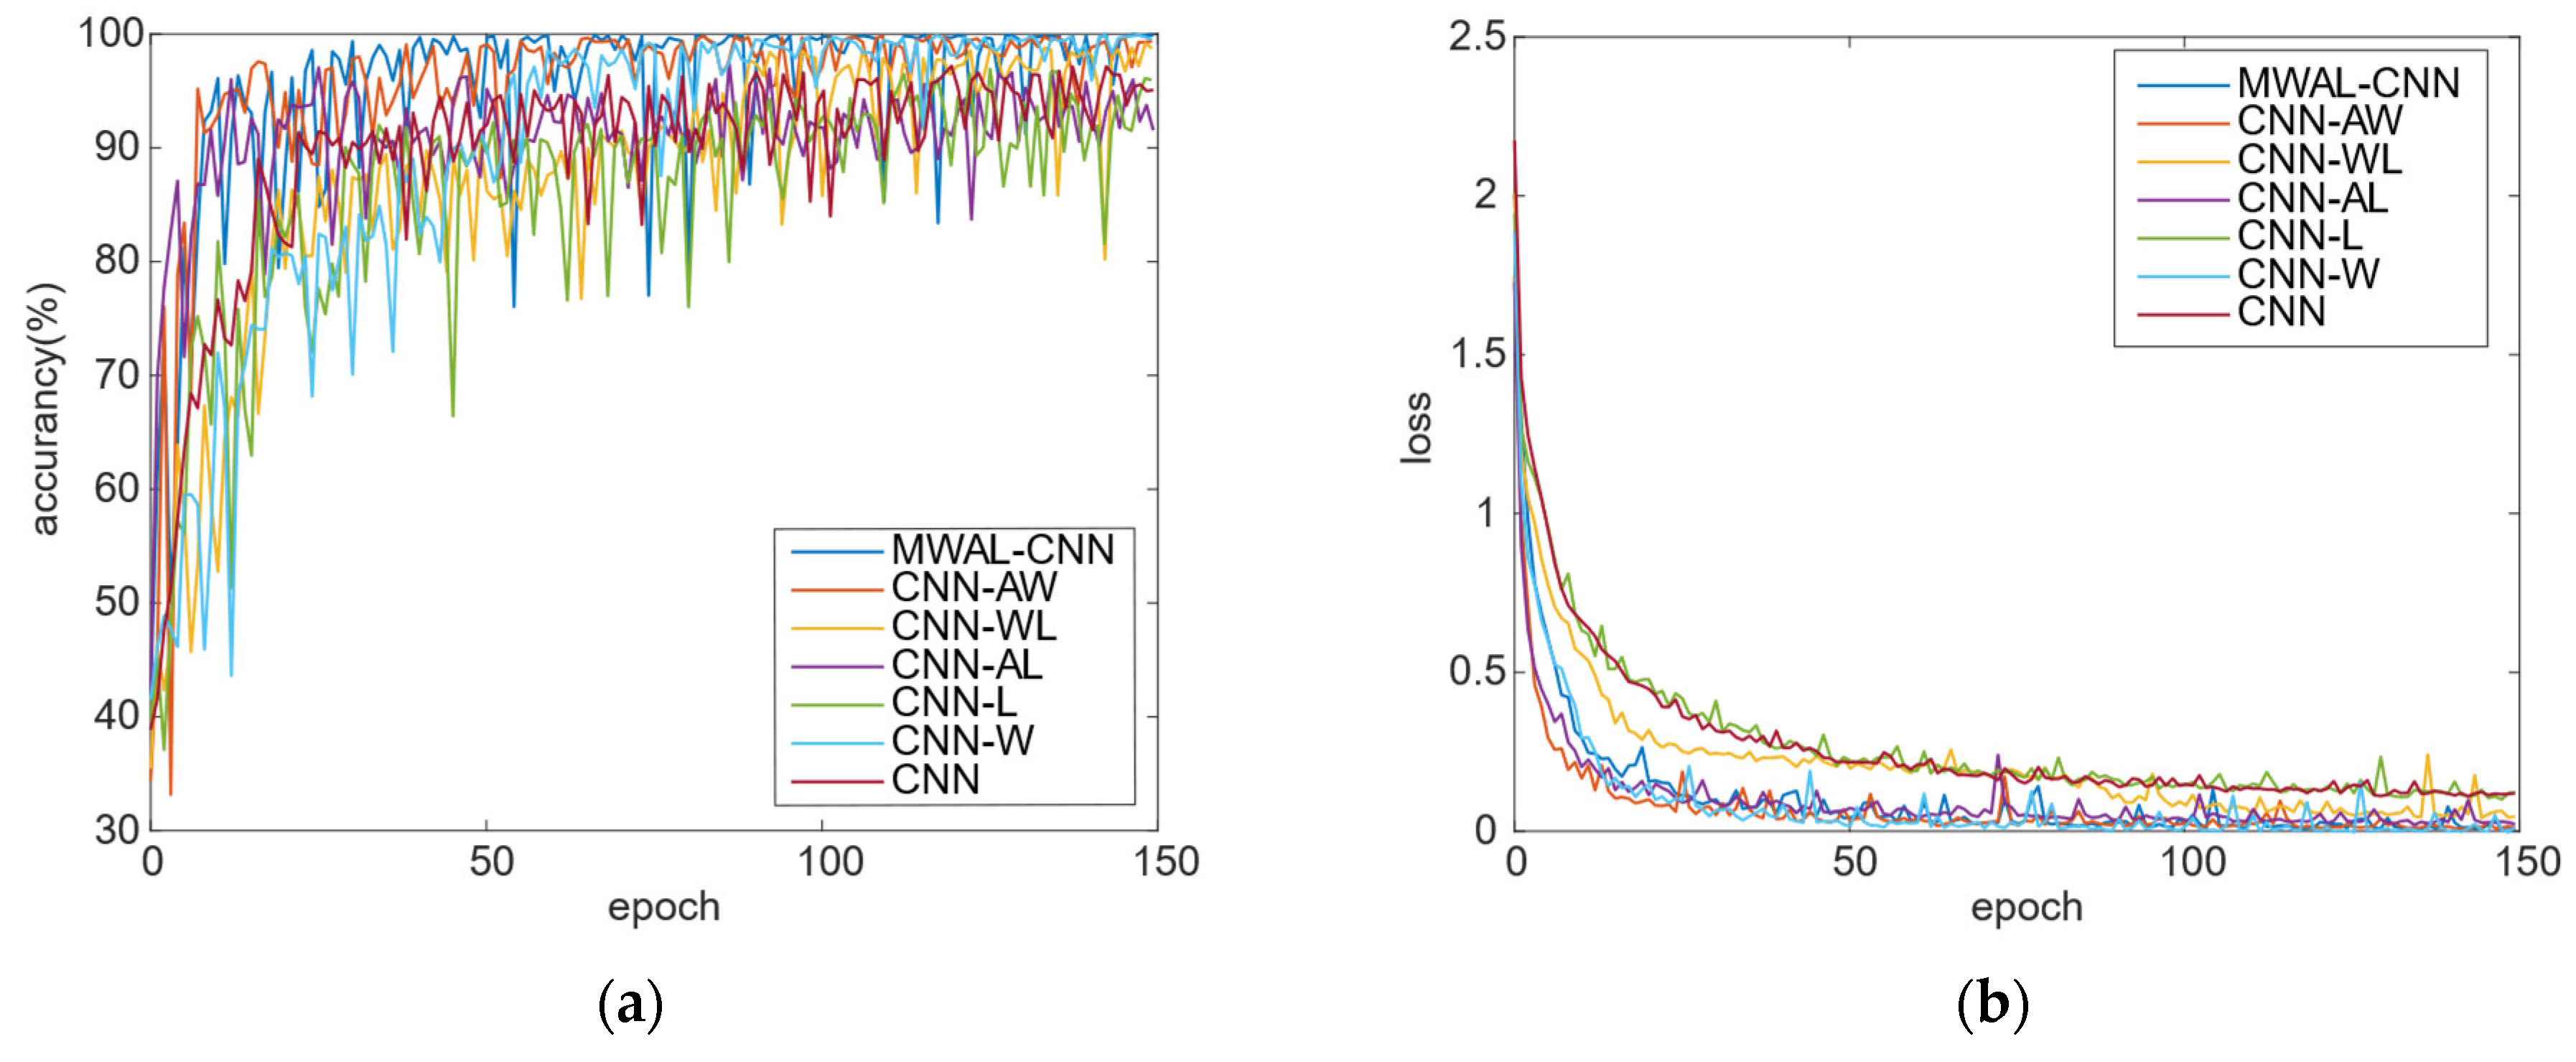
The training loss and test accuracy curves of different models are provided in
Figure 12. It can be seen that the highest accuracy was achieved when all three modules were added. In contrast, overfitting occurred when only the attention mechanism and weight update for the LSTM modules were added. Moreover, the oscillation amplitude of the curves with the inclusion of the high- and low-frequency frequency-separated DWT module is slightly larger than that of the other curves. The smaller the oscillation, the more stable the model.
According to the training loss curve, the convergence performance of the final model is close to that of the three-layer CNN model. In addition, the DWT model with high- and low-frequency separation converges faster than the others, indicating that the mixed attention mechanism module and the weight-updating LSTM module can improve the model stability. Lastly, the high- and low-frequency separation of the DWT module can improve the model convergence.
In summary, it can be concluded that the DWT layer can extract the obvious and non-obvious features of the current signal. The multiscale attention mechanism layer can fuse the features of multiple current signals, and the weight-updating LSTM layer can classify anomalous signals. Consequently, the CNN-LSTM model can obtain more favorable results.
4.3. Experiments on Stator Fault Data Set for Permanent Magnet Synchronous Motors
4.3.1. Data Description
The vibration and current datasets of a three-phase permanent magnet synchronous motor with stator faults collected by the Korea Institute of Science and Technology (KIST) were used for the experiments [
34]. As shown in
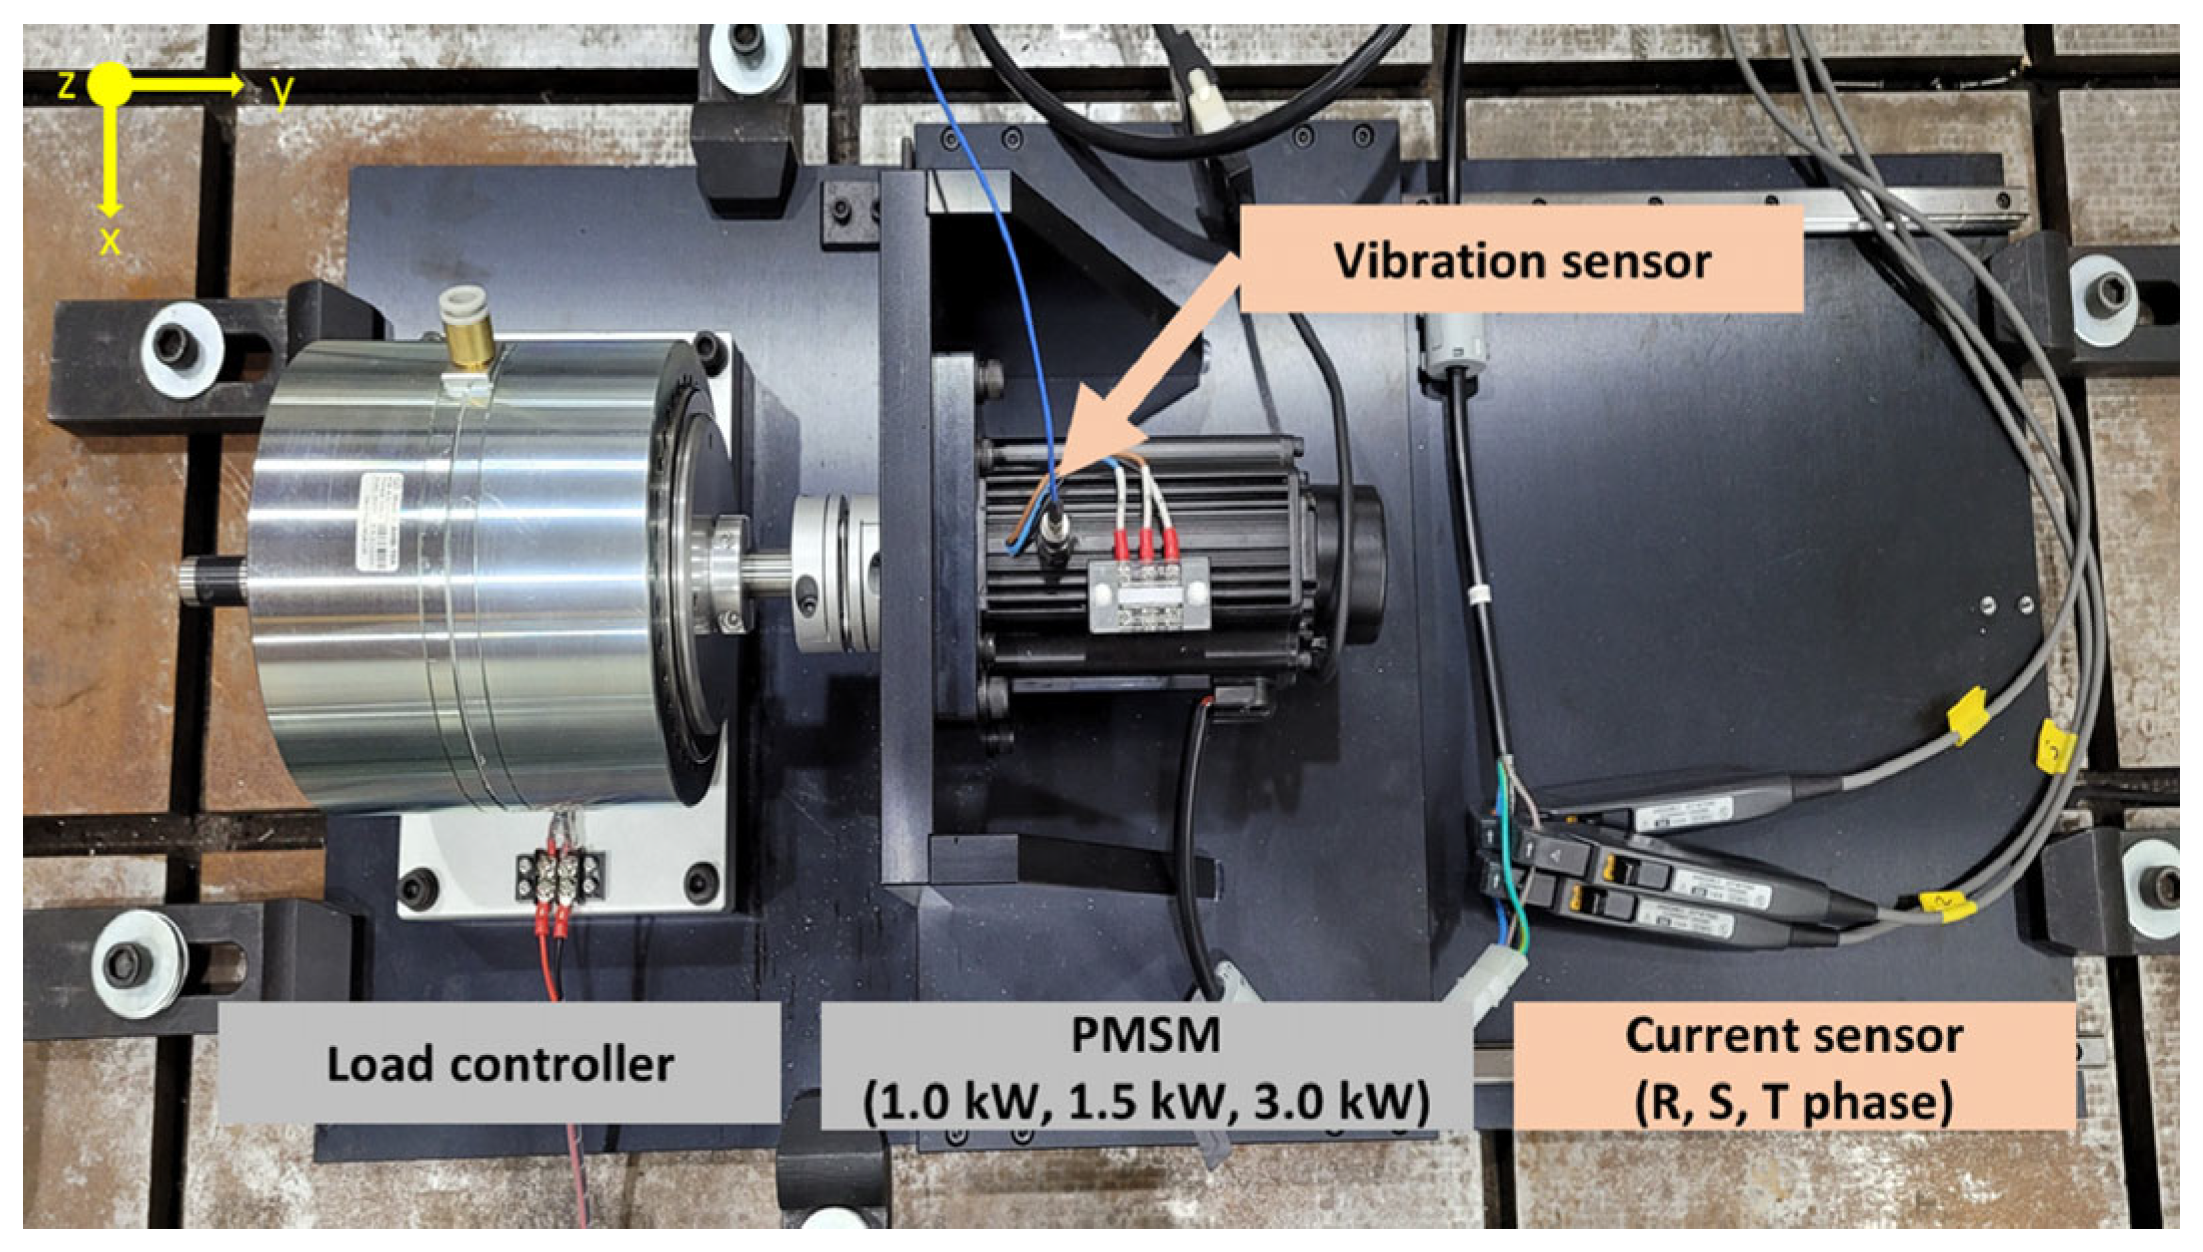
Figure 13, the test rig comprised a load controller made of hysteresis brakes, permanent magnet synchronous motor, and sensors. A hysteresis brake (AHB-10A) made by Valid Magnetics Ltd. can apply a torque load of up to 10 Nm to the PMSM. Flexible couplings and linear guides were used to prevent connection misalignment failures between the load controller and the PMSM. Experiments were conducted using three three-phase, four-pole permanent magnet synchronous motors from the same manufacturer with the same speed (3000 RPM), allowing for 5% of the torque limit of 15.1 Nm with three motors of different powers (1.0 kW, 1.5 kW, and 3.0 kW).
Each motor comprised 16 stator faults: eight inter-coil circuit faults and eight inter-turn circuit faults. Three motors with different kinds of faults were selected in this paper, each with two classes, i.e., a total of 12 classes of faults, as shown in
Table 5. A total of 8593 training samples, 2455 validation samples, and 2456 test samples were obtained based on the 6:2:2 division of the training and the test sets and according to the window division of the increase in the data samples.
4.3.2. Comparative Analysis
Similar to data 1, in this section, experiments were conducted on the stator fault dataset with MWAL-CNN and five state-of-the-art models, whose method configurations were explained in
Section 4.1, to demonstrate the performance of these methods on different datasets. The anomaly detection results are shown in
Table 6. It can be seen that this dataset has simpler fault types than the PU dataset and more one-phase current signals, obtaining a higher accuracy.
The proposed MWAL-CNN still obtained the highest recognition accuracy in each trial compared to the other five methods; calculation time increased by 0.4 s compared to the longest time. The minimum accuracy of MWAL-CNN was as high as 99.959% across five trials, providing satisfactory results in fault diagnosis tasks.
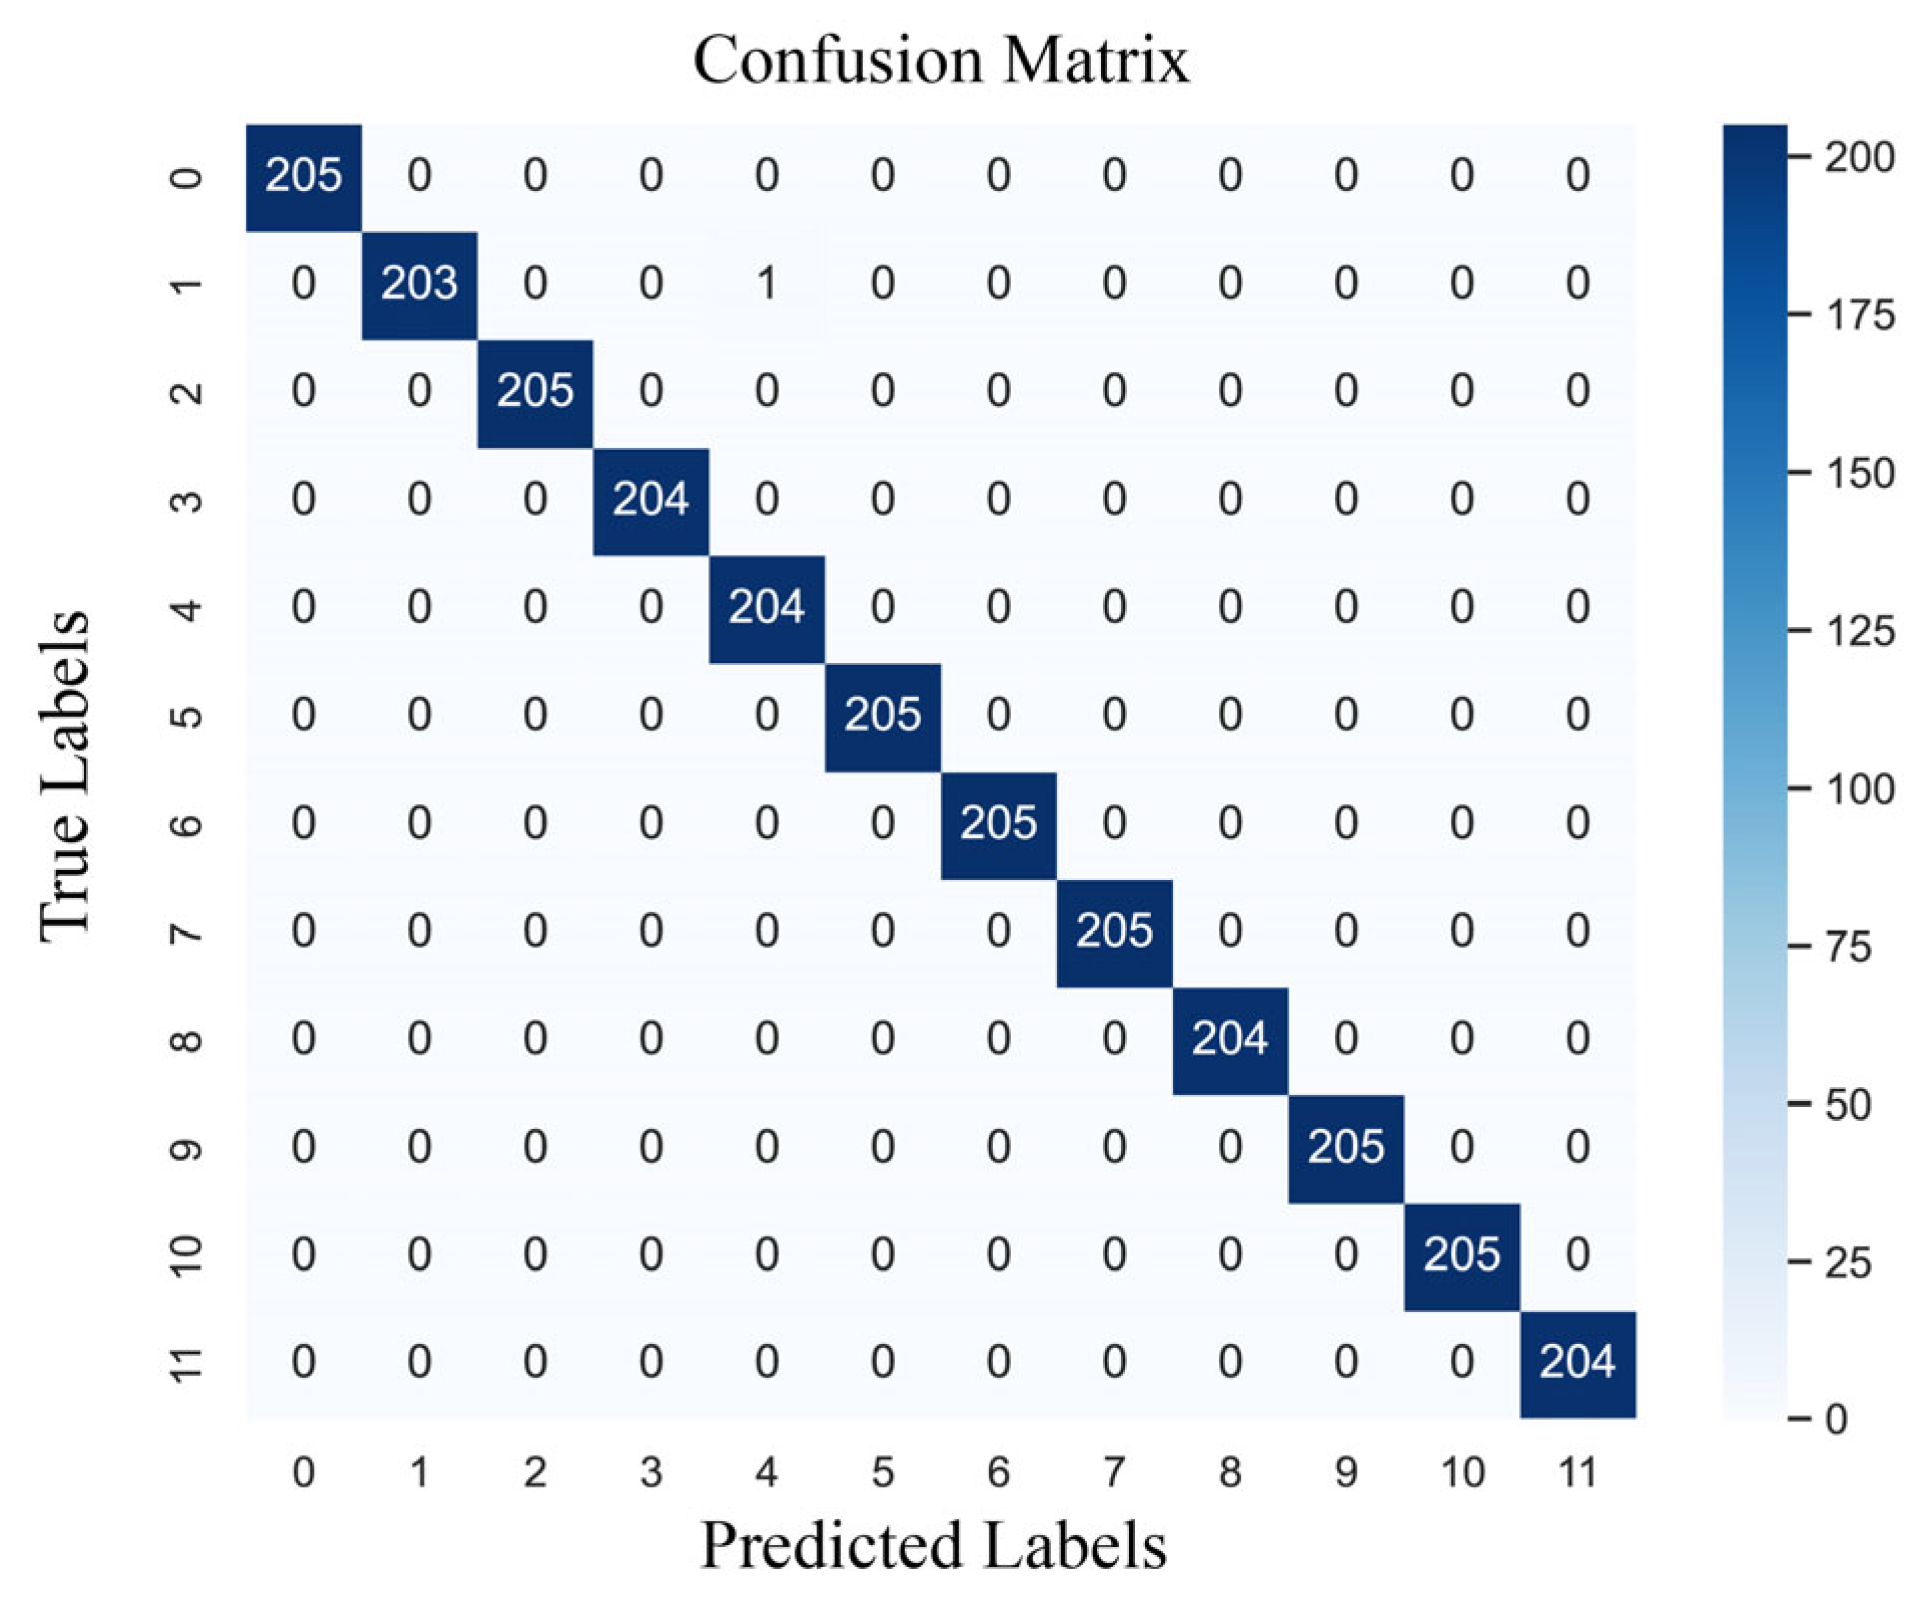
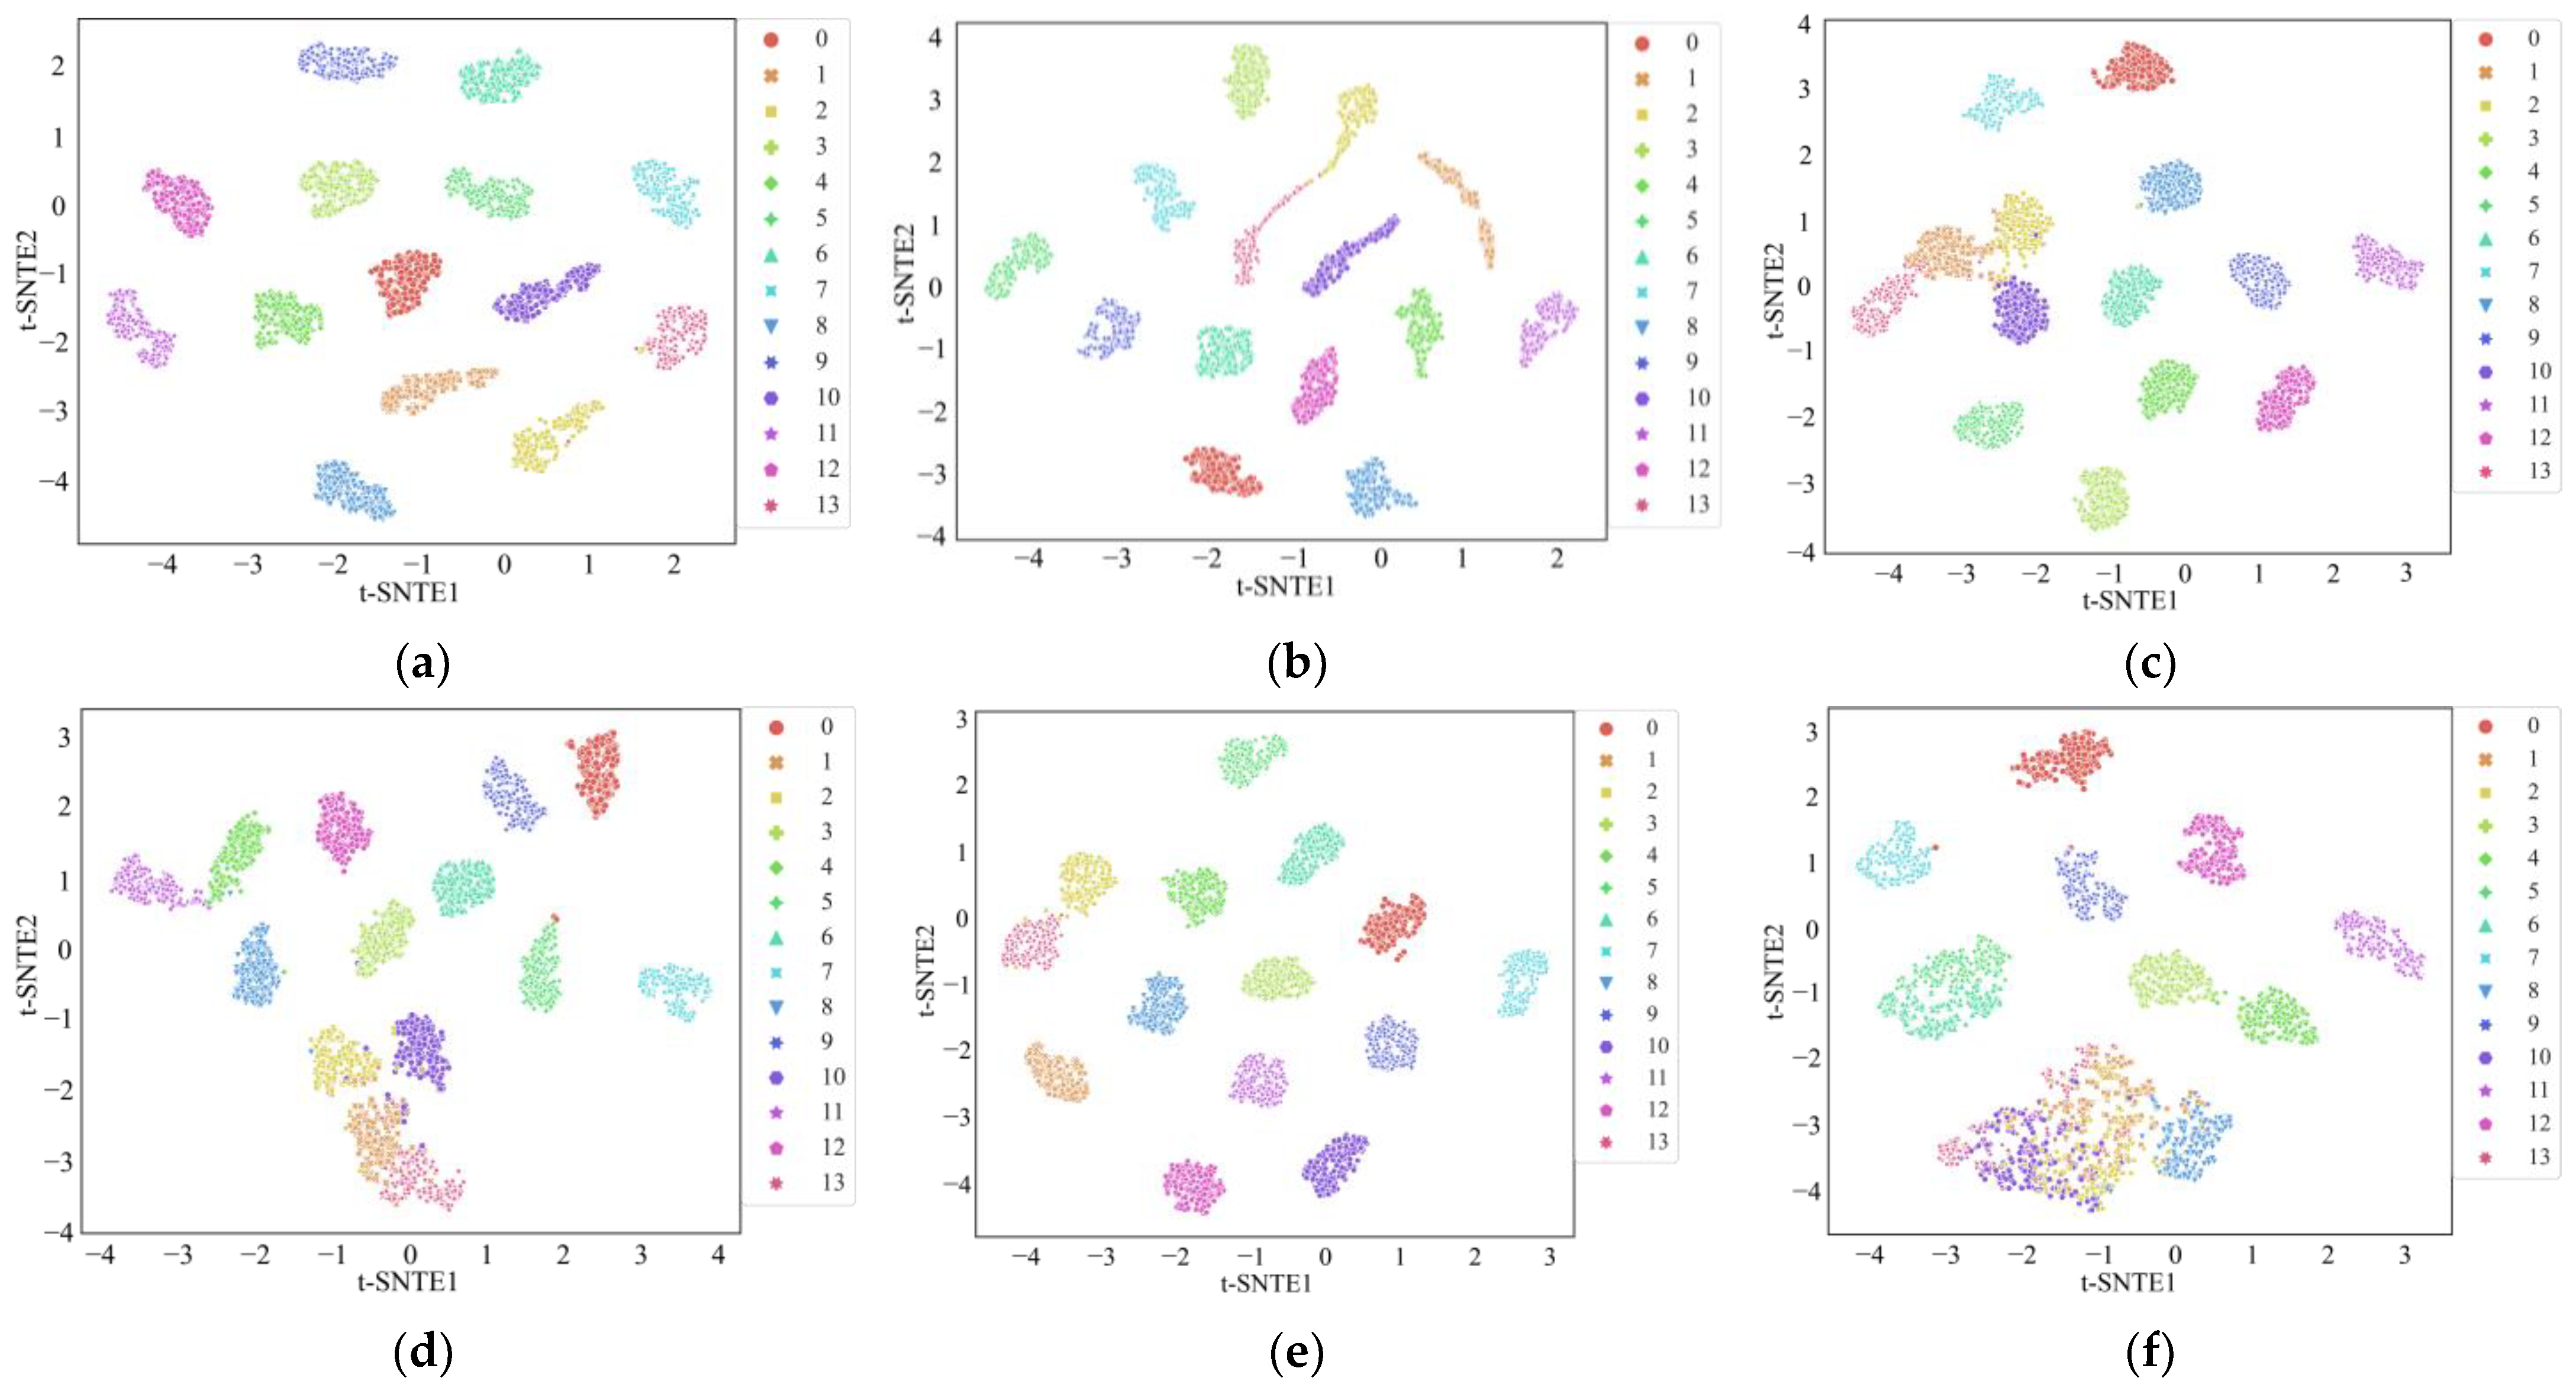
Similarly, the confusion matrix for the proposed model and the t-SNE plots for different models are provided in
Figure 14 and
Figure 15, respectively. In the confusion matrix, only one misclassification occurred in class 2, indicating that the model classification performance remained excellent. According to the t-SNE plots, several models were able to separate different stator faults. However, other models still exhibited some instances of misclassification. MLP, in particular, exhibited two clusters with significant overlap. In contrast, the proposed model attained the best performance, demonstrating that the fusion of three-phase currents contains richer information.
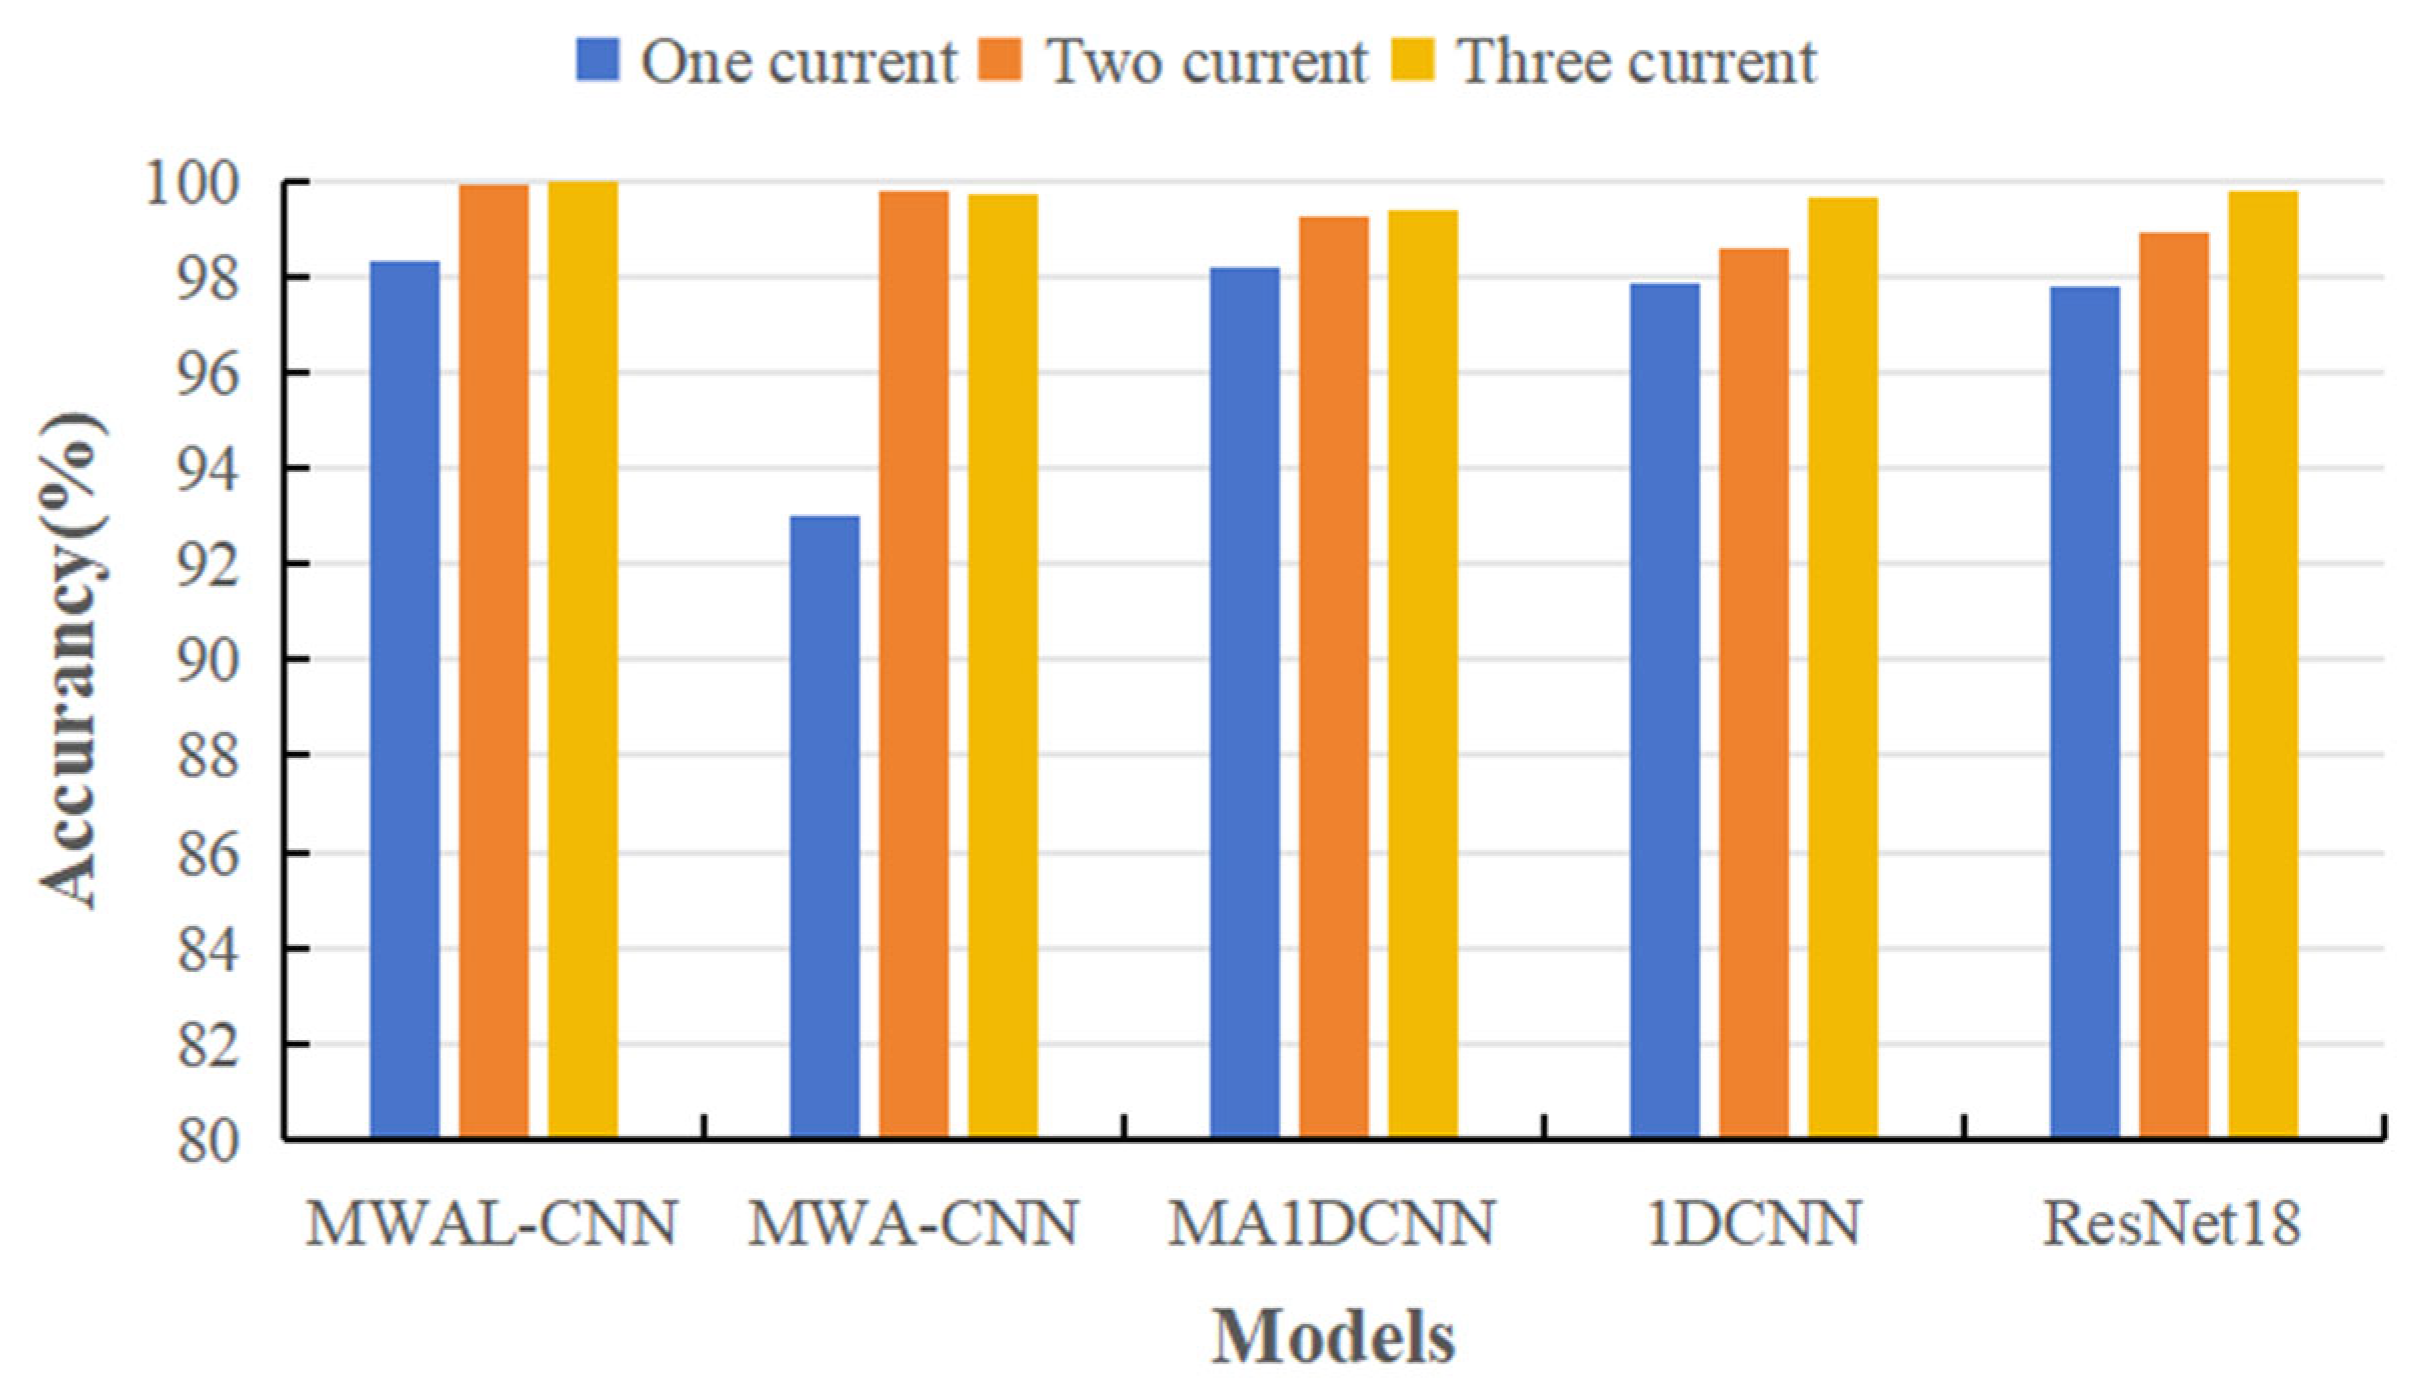
4.3.3. Validity of Multi-Current Signals
The PMSM stator dataset comprised current signals from standard three-phase currents, the PU bearing dataset comprised current signals from standard three-phase currents, and the PU bearing dataset comprised two-phase currents. Comparative experiments were conducted using single-phase, two-phase, and three-phase current datasets to demonstrate the model’s ability to fuse multiple current signals, as shown in
Table 7 and
Figure 16. According to the results, the current signals were able to effectively classify different stator fault types on simpler datasets. The bar chart indicates that the performance of single-phase currents was significantly lower than that of two-phase and three-phase currents. However, with respect to the MWA-CNN model, the accuracy of three-phase current signals was higher than that of two-phase currents, demonstrating better performance.
4.3.4. DWT Layer Validity
The effectiveness of different modules relative to the stator fault dataset is validated in this section, following the same experimental configuration as in
Section 4.2.4. The results are shown in
Table 8 and are generally consistent with those from the PU dataset. However, one notable difference is that, in the case of simpler data, where only the high- and low-frequency DWT modules were added, the performance was not as outstanding as in the case of the PU dataset, particularly for the three-phase current scenario. Here, the improvement from various modules was relatively small.
Furthermore, the accuracy curve for the test set and the loss curve for the training set are provided in
Figure 17. The results, again, are quite similar to those obtained with the PU dataset. However, one noticeable difference is that the vibration amplitudes were smaller in this dataset, resulting in less pronounced overfitting. The curves were smoother and converged more quickly compared to those obtained with the PU dataset. The advantage of the DWT module for high- and low-frequency separation was not as prominent. Additional significant oscillations occurred when the module with the weight-updated LSTM layer was added, especially in datasets with fewer data points where even minor weight changes could lead to more significant fluctuations in the model’s accuracy. This highlights the importance of the synergy among the three modules.
4.4. Computational Burden Analysis
This section analyzes the computational burden of the proposed MWAL-CNN and six other network models. All of them, except for the MWAL-CNN, had five or six CNN layers, and
Table 8 shows the parameters and Multiply Accumulate Operations (MAC) of these methods. From the table, it can be seen that, although the added DWT layer and hybrid attention layer of MWAL-CNN increased the model computation, owing to it containing only three layers of cyclic DWT and CNN compared to the five CNN layers found in the other models, the proposed model had low MACs of only 12.86 M, and the parameter was only 706.31 K, which is a slight reduction relative to the other models.
MWAL-CNN was able to train a single batch on the PU dataset in 10.69 s, with a total of 35,064 training samples. It also trained a single batch on the PMSM synchronous stator fault dataset in 3.16 s, with a total of 13,504 training samples, which is an acceptable time relative to the improvement in the accuracy rate. However, when MWAL-CNN was embedded in the fault diagnosis system, and when the data volume increased, the training time also increased by about 3 s for each additional 10,000 samples, and the training time doubled for each additional fault condition or faulty device. However, when the fault data included more than 90,000 samples, the training time of a single batch of MWAL-CNN was close to 30 s, a time that is too long. Therefore, federated learning could be used to distribute the data of different working conditions or other ways to improve the training efficiency.
4.5. Discussion
In this paper, two case studies were assessed using the benchmark motor bearing dataset and the permanent magnet synchronous motor stator fault dataset to validate the effectiveness and practicality of the proposed MAWL-CNN method for collecting two-phase and three-phase current data.
The experimental results demonstrated that the MAWL-CNN model achieved recognition rates of 99.772% and 99.959% on these two datasets, respectively, indicating that MAWL-CNN can deliver excellent diagnostic results in these scenarios. It is worth noting that MAWL-CNN significantly outperformed five other competitive methods, highlighting the superiority of the proposed approach.
Comparative experiments were conducted using single, double, and triple signal combinations to investigate the model fusion effect for different currents with different current fusion effects. The results indicate that three-phase signals yield the best performance. Moreover, two-phase currents can also better identify the location of anomalies. Ablation studies were performed to verify the effectiveness of the remaining high- and low-frequency separation DWT layer, the hybrid attention layer, and the weight-updated LSTM layer, showing that each layer is indispensable. It is expected that the proposed method could be successfully applied to industrial scenarios of permanent magnet synchronous motors with low speed and high torque, and could be embedded into fault monitoring systems for anomaly detection of permanent magnet synchronous motors, and the memory of the fault monitoring system should be more than 8 G and 4 core CPU.
To study the model computation time and model complexity, the per-epoch model running time and MAC were used as evaluation indices. The experimental results show that, with the limited number of datasets in the open dataset, the computation time added by the DWT hybrid attention mechanism of MAWL-CNN is short. The MWAL-CNN runs on both datasets in a controllable running time range, with lower model complexity.


