
Comparison of Metabolic Power and Energy Cost of Submaximal and Sprint Running Efforts Using Different Methods in Elite Youth Soccer Players: A Novel Energetic Approach


Abstract
1. Introduction
2. Materials and Methods
2.1. Study Design
2.2. Participants
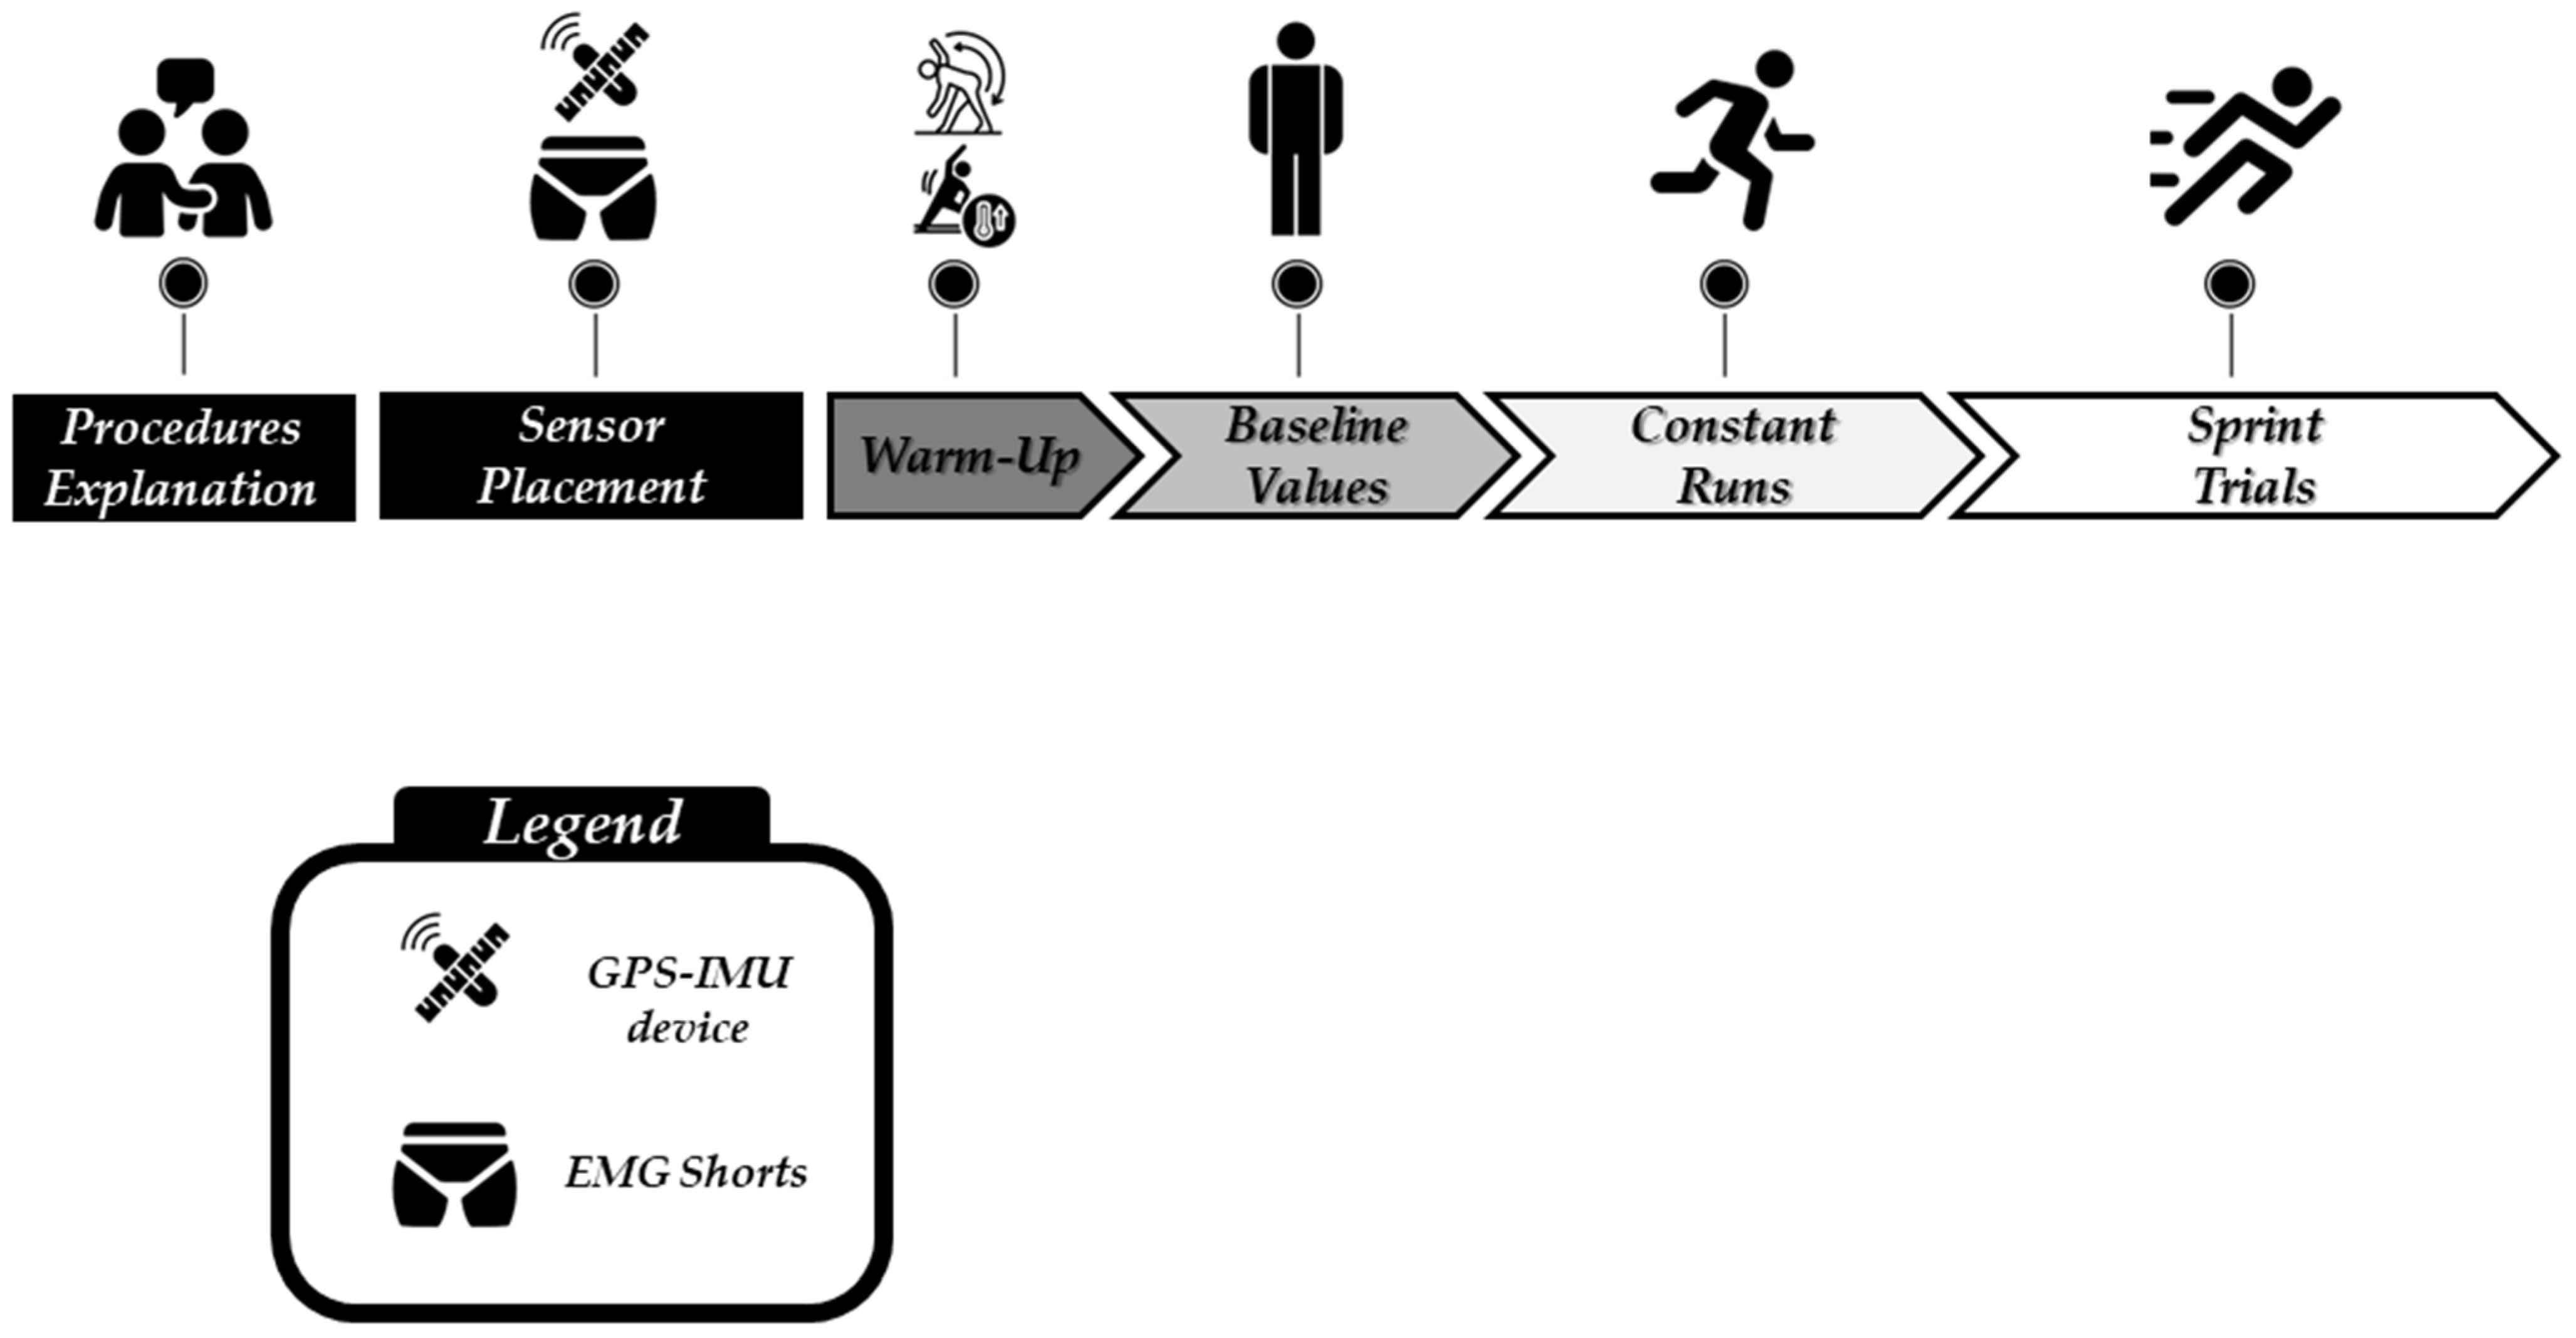
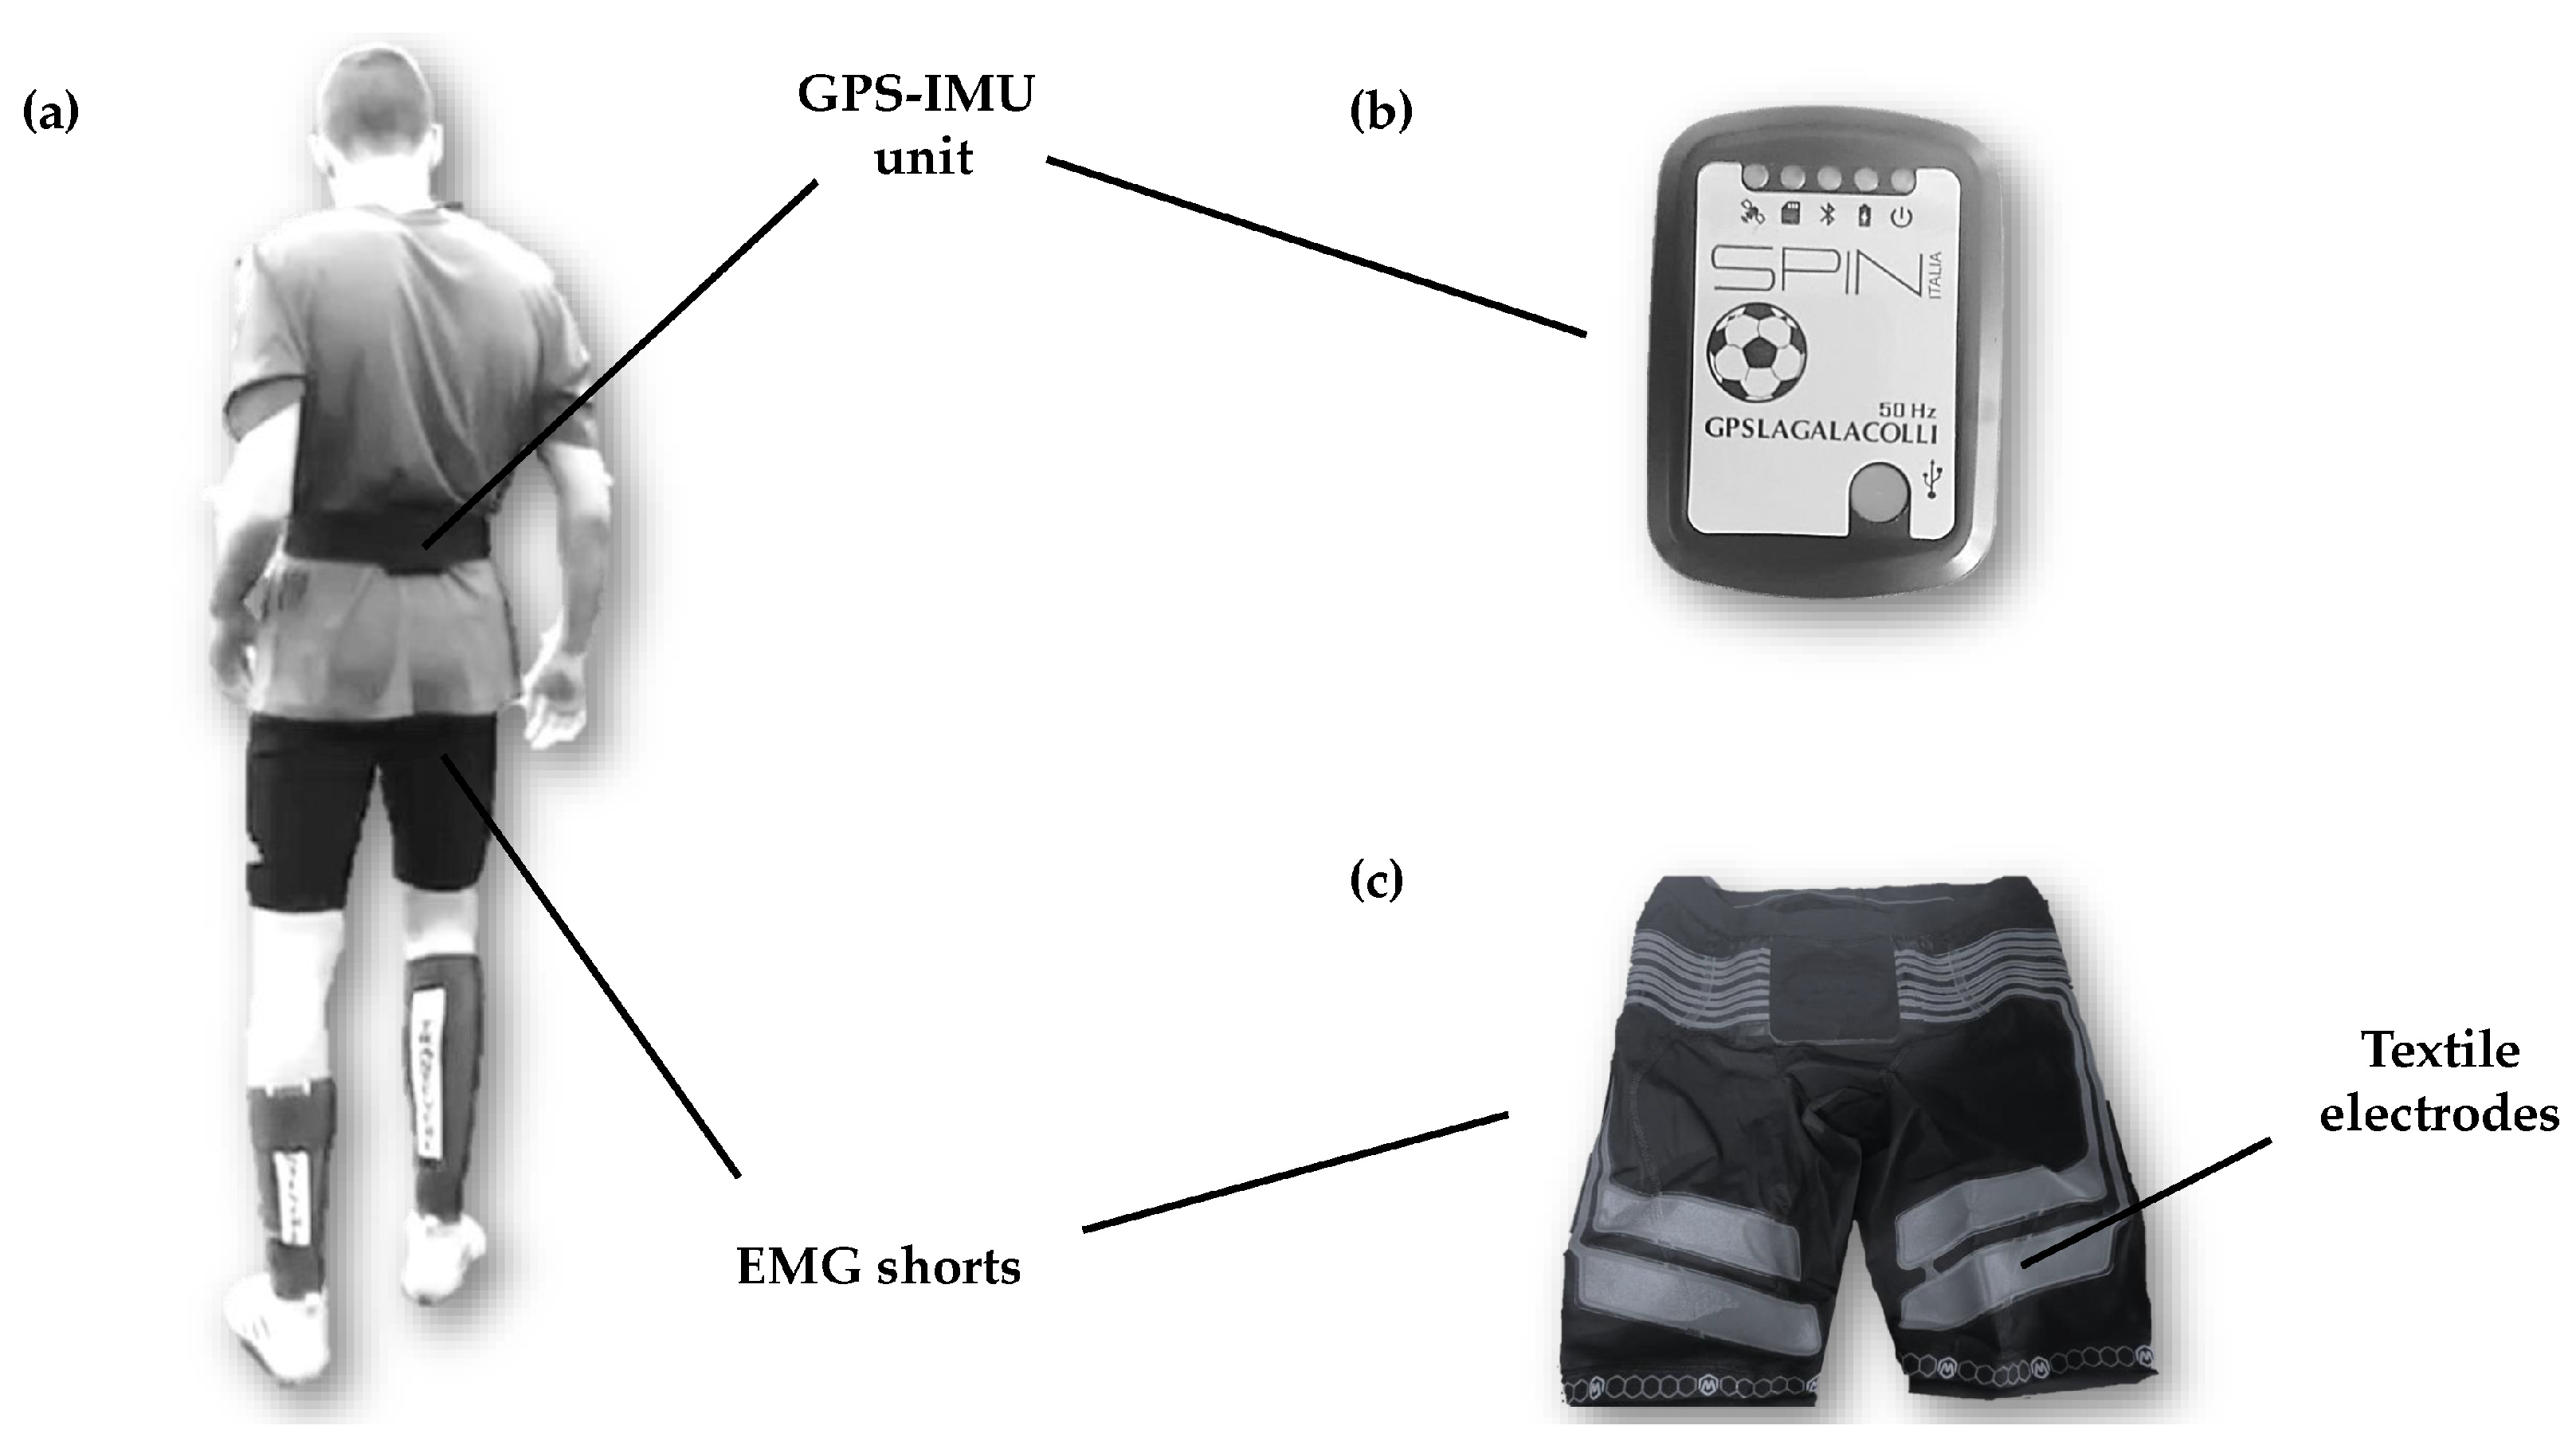
2.3. Procedures
2.3.1. Constant Running and Sprint Testing
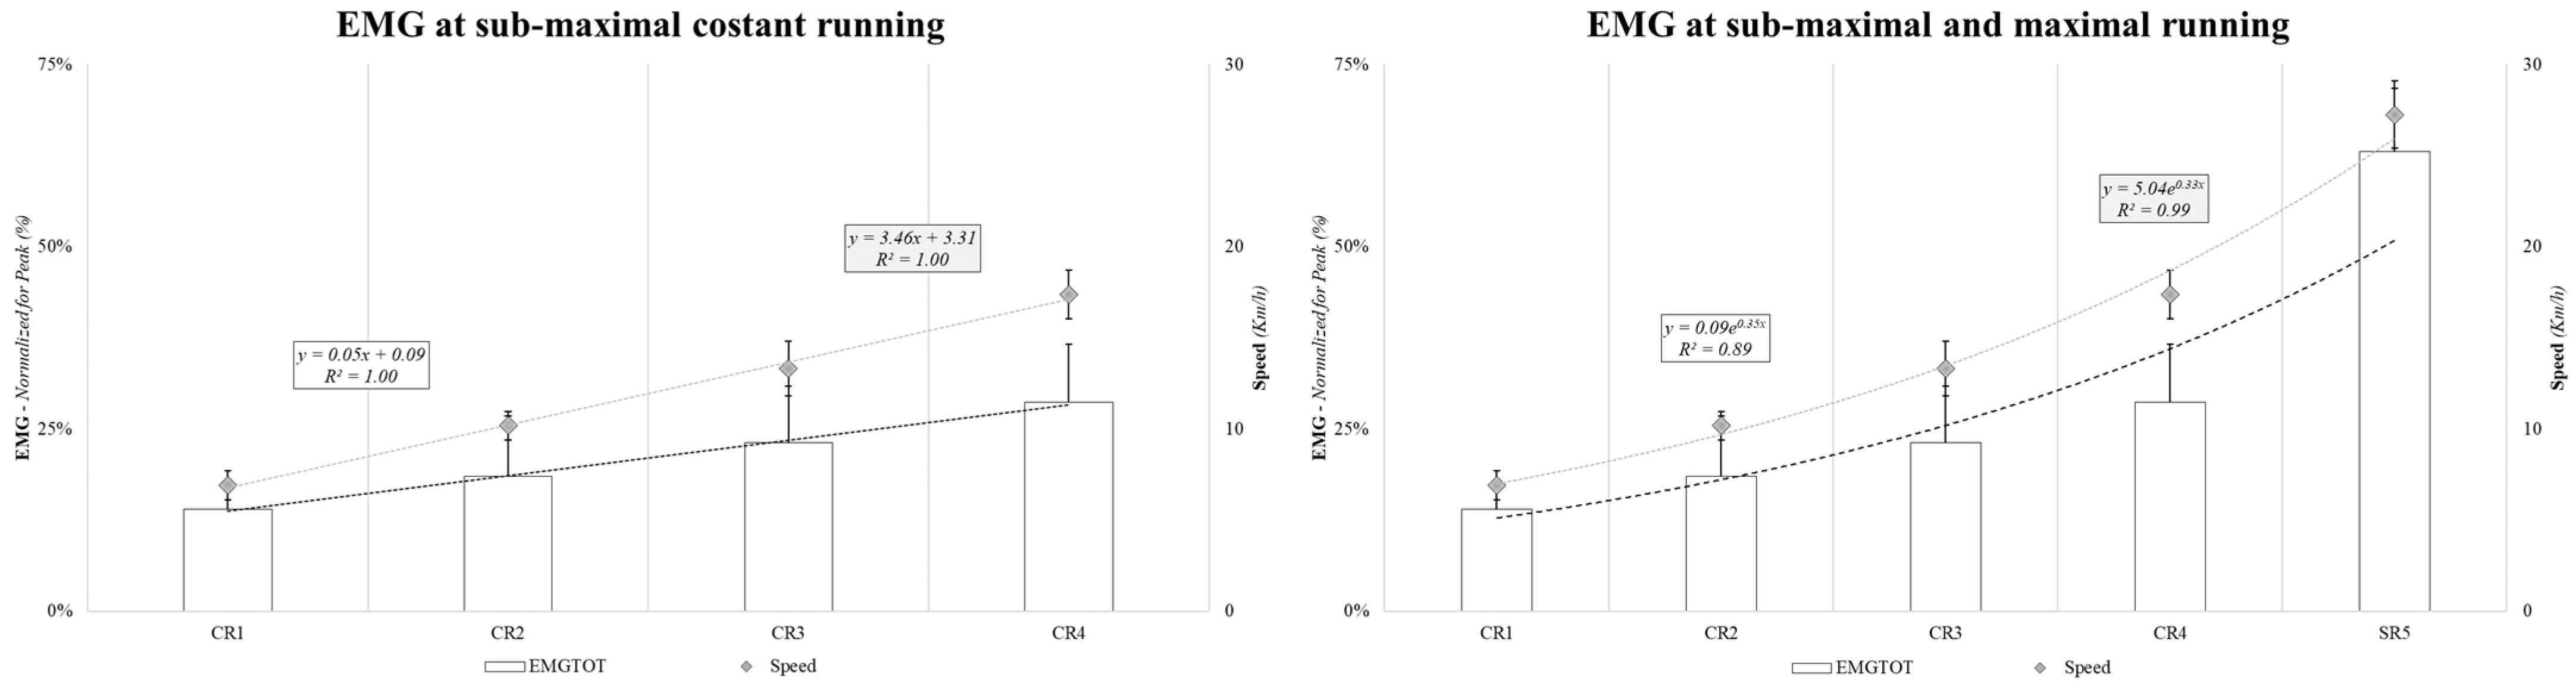
2.3.2. Electromyography Recording and Analysis
2.3.3. Ad Hoc Profiling and Metabolic Power Calculation
2.4. Statistical Analysis
3. Results
4. Discussion
5. Conclusions
Supplementary Materials
Author Contributions
Funding
Institutional Review Board Statement
Informed Consent Statement
Data Availability Statement
Acknowledgments
Conflicts of Interest
References
- Minetti, A.E.; Ardigò, L.P.; Saibene, F. Mechanical determinants of the minimum energy cost of gradient running in humans. J. Exp. Biol. 1994, 195, 211–225. [Google Scholar] [CrossRef]
- Minetti, A.E.; Ardigò, L.P.; Saibene, F. The transition between walking and running in humans: Metabolic and mechanical aspects at different gradients. Acta Physiol. Scand. 1994, 150, 315–323. [Google Scholar] [CrossRef]
- Minetti, A.E.; Moia, C.; Roi, G.S.; Susta, D.; Ferretti, G. Energy cost of walking and running at extreme uphill and downhill slopes. J. Appl. Physiol. (1985) 2002, 93, 1039–1046. [Google Scholar] [CrossRef]
- Zamparo, P.; Pavei, G.; Nardello, F.; Bartolini, D.; Monte, A.; Minetti, A.E. Mechanical work and efficiency of 5 + 5 m shuttle running. Eur. J. Appl. Physiol. 2016, 116, 1911–1919. [Google Scholar] [CrossRef]
- Minetti, A.E.; Pavei, G. Update and extension of the e‘quivalent slope’ of speed-changing level locomotion in humans: A computational model for shuttle running. J. Exp. Biol. 2018, 221 Pt 15, jeb182303. [Google Scholar] [CrossRef]
- Van Hooren, B.; Meijer, K.; McCrum, C. Attractive Gait Training: Applying Dynamical Systems Theory to the Improvement of Locomotor Performance Across the Lifespan. Front. Physiol. 2019, 9, 1934. [Google Scholar] [CrossRef]
- Zamparo, P.; Pavei, G.; Monte, A.; Nardello, F.; Otsu, T.; Numazu, N.; Fujii, N.; Minetti, A.E. Mechanical work in shuttle running as a function of speed and distance: Implications for power and efficiency. Hum. Mov. Sci. 2019, 66, 487–496. [Google Scholar] [CrossRef]
- Furusawa, K.; Hill, A.V.; Parkinson, J.L. The Dynamics of Sprint Running. Proc. R. Soc. B Biol. Sci. 1927, 102, 29–42. [Google Scholar]
- Fenn, W.O. Frictional and kinetic factors in the work of sprint running. Am. J. Physiol. Leg. Content 1930, 92, 583–611. [Google Scholar]
- Fenn, W.O. Work against gravity and work due to velocity changes in running: Movements of the center of gravity within the body and foot pressure on the ground. Am. J. Physiol. Leg. Content 1930, 93, 433–462. [Google Scholar]
- Hill, A.V. The heat of shortening and the dynamic constants of muscle. Proc. R. Soc. Lond. Ser. B-Biol. Sci. 1938, 126, 136–195. [Google Scholar]
- Margaria, R. Sulla fisiologia e specialmente sul consumo energetico della marcia e della corsa a varia velocità ed inclinazione del terreno. Atti Accad. Nazionale dei Lincei 1938, 7, 299–368. [Google Scholar]
- Margaria, R.; Cerretelli, P.; Aghemo, P.; Sassi, G. Energy cost of running. J. Appl. Physiol. 1963, 18, 367–370. [Google Scholar] [CrossRef] [PubMed]
- Margaria, R. La fisiologia della locomozione. Le Scienze 1970, V, 11–21. Available online: http://vivicitta.uisp.it/home/wp-content/uploads/1970_025_1.pdf (accessed on 17 March 2024).
- Marey, E.J.; Demeny, G. Variations de travail mécanique dépensé dans les différentes allures de l‘homme. Comptes Rendus Hebd. Séances L‘académie Sci. 1885, 101, 910–915. [Google Scholar]
- Cavagna, G.A.; Kaneko, M. Mechanical work and efficiency in level walking and running. J. Physiol. 1977, 268, 467–481. [Google Scholar] [CrossRef] [PubMed]
- Pinnington, H.C.; Dawson, B. The energy cost of running on grass compared to soft dry beach sand. J. Sci. Med. Sport 2001, 4, 416–430. [Google Scholar] [CrossRef] [PubMed]
- Colli, R.; Buglione, A.; Introini, E.; D‘Ottavio, S. L’allenamento intermittente tra scienza e prassi. SdS Sc. Dello Sport 2007, 72, 45–52. [Google Scholar]
- di Prampero, P.E.; Botter, A.; Osgnach, C. The energy cost of sprint running and the role of metabolic power in setting top performances. Eur. J. Appl. Physiol. 2015, 115, 451–469. [Google Scholar] [CrossRef]
- Deutsch, F. Analytic posturology. Psychoanal. Q. 1952, 21, 196–214. [Google Scholar] [CrossRef]
- Cavagna, G.A.; Komarek, L.; Mazzoleni, S. The mechanics of sprint running. J. Physiol. 1971, 217, 709–721. [Google Scholar] [CrossRef] [PubMed]
- di Prampero, P.E.; Fusi, S.; Sepulcri, L.; Morin, J.B.; Belli, A.; Antonutto, G. Sprint running: A new energetic approach. J. Exp. Biol. 2005, 208 Pt 14, 2809–2816. [Google Scholar] [CrossRef] [PubMed]
- Buglione, A.; di Prampero, P.E. The energy cost of shuttle running. Eur. J. Appl. Physiol. 2013, 113, 1535–1543. [Google Scholar] [CrossRef]
- Piras, A.; Raffi, M.; Atmatzidis, C.; Merni, F.; Di Michele, R. The Energy Cost of Running with the Ball in Soccer. Int. J. Sports Med. 2017, 38, 877–882. [Google Scholar] [CrossRef]
- Monte, A.; Zamparo, P. Correlations between muscle-tendon parameters and acceleration ability in 20 m sprints. PLoS ONE 2019, 14, e0213347. [Google Scholar] [CrossRef]
- Pavei, G.; Zamparo, P.; Fujii, N.; Otsu, T.; Numazu, N.; Minetti, A.E.; Monte, A. Comprehensive mechanical power analysis in sprint running acceleration. Scand. J. Med. Sci. Sports 2019, 29, 1892–1900. [Google Scholar] [CrossRef]
- Monte, A.; Baltzopoulos, V.; Maganaris, C.N.; Zamparo, P. Gastrocnemius Medialis and Vastus Lateralis in vivo muscle-tendon behavior during running at increasing speeds. Scand. J. Med. Sci. Sports 2020, 30, 1163–1176. [Google Scholar] [CrossRef] [PubMed]
- Minetti, A.E. A model equation for the prediction of mechanical internal work of terrestrial locomotion. J. Biomech. 1998, 31, 463–468. [Google Scholar] [CrossRef] [PubMed]
- Osgnach, C.; Poser, S.; Bernardini, R.; Rinaldo, R.; di Prampero, P.E. Energy cost and metabolic power in elite soccer: A new match analysis approach. Med. Sci. Sports Exerc. 2010, 42, 170–178. [Google Scholar] [CrossRef]
- Buglione, A.; di Prampero, P.E. Energy Cost of Elite Soccer Players Before and During Season. In Proceedings of the XXXII World Congress of Sports Medicine, Rome, Italy, 27–30 September 2012. [Google Scholar]
- Osgnach, C.; Paolini, E.; Roberti, V.; Vettor, M.; di Prampero, P.E. Metabolic Power and Oxygen Consumption in Team Sports: A Brief Response to Buchheit et al. Int. J. Sports Med. 2016, 37, 77–81. [Google Scholar] [CrossRef]
- Licciardi, A.; Grassadonia, G.; Monte, A.; Ardigò, L.P. Match metabolic power over different playing phases in a young professional soccer team. J. Sports Med. Phys. Fitness 2020, 60, 1170–1171. [Google Scholar] [CrossRef] [PubMed]
- Savoia, C.; Padulo, J.; Colli, R.; Marra, E.; McRobert, A.; Chester, N.; Azzone, V.; Pullinger, S.A.; Doran, D.A. The Validity of an Updated Metabolic Power Algorithm Based upon di Prampero’s Theoretical Model in Elite Soccer Players. Int. J. Environ. Res. Public Health 2020, 17, 9554. [Google Scholar] [CrossRef] [PubMed]
- Spyrou, K.; Alcaraz, P.E.; Marín-Cascales, E.; Herrero-Carrasco, R.; Cohen, D.D.; Freitas, T.T. Neuromuscular Performance Changes in Elite Futsal Players Over a Competitive Season. J. Strength Cond. Res. 2023, 37, 1111–1116. [Google Scholar] [CrossRef] [PubMed]
- Montini, M.; Felici, F.; Nicolò, A.; Sacchetti, M.; Bazzucchi, I. Neuromuscular demand in a soccer match assessed by a continuous electromyographic recording. J. Sports Med. Phys. Fitness 2017, 57, 345–352. [Google Scholar] [CrossRef] [PubMed]
- Mero, A.; Komi, P.V. Electromyographic activity in sprinting at speeds ranging from sub-maximal to supra-maximal. Med. Sci. Sports Exerc. 1987, 19, 266–274. [Google Scholar] [CrossRef] [PubMed]
- Savoia, C.; Iellamo, F.; Caminiti, G.; Doran, D.A.; Pullinger, S.; Innaurato, M.R.; Annino, G.; Manzi, V. Rethinking training in elite soccer players: Comparative evidence of small-sided games and official match play in kinematic parameters. J. Sports Med. Phys. Fitness 2021, 61, 763–770. [Google Scholar] [CrossRef]
- Ju, W.; Doran, D.; Hawkins, R.; Gómez-Díaz, A.; Martin-Garcia, A.; Ade, J.; Laws, A.; Evans, M.; Bradley, P. Contextualised peak periods of play in English Premier League matches. Biol. Sport 2022, 39, 973–983. [Google Scholar] [CrossRef] [PubMed]
- Rodriguez-Barbero, S.; González Ravé, J.M.; Juárez Santos-García, D.; Rodrigo-Carranza, V.; Santos-Concejero, J.; González-Mohíno, F. Effects of a Regular Endurance Training Program on Running Economy and Biomechanics in Runners. Int. J. Sports Med. 2023, 44, 1059–1066. [Google Scholar] [CrossRef] [PubMed]
- di Prampero, P.E.; Osgnach, C.; Morin, J.B.; Zamparo, P.; Pavei, G. Mechanical and Metabolic Power in Accelerated Running-PART I: The 100-m dash. Eur. J. Appl. Physiol. 2023, 123, 2473–2481. [Google Scholar] [CrossRef]
- Osgnach, C.; di Prampero, P.E.; Zamparo, P.; Morin, J.B.; Pavei, G. Mechanical and metabolic power in accelerated running-Part II: Team sports. Eur. J. Appl. Physiol. 2024, 124, 417–431. [Google Scholar] [CrossRef]
- Van Hooren, B.; Jukic, I.; Cox, M.; Frenken, K.G.; Bautista, I.; Moore, I.S. The Relationship between Running Biomechanics and Running Economy: A Systematic Review and Meta-Analysis of Observational Studies. Sports Med. 2024, 1–48. [Google Scholar] [CrossRef] [PubMed]
- Van Hooren, B.; Willems, P.; Plasqui, G.; Meijer, K. Changes in running economy and running technique following 6 months of running with and without wearable-based real-time feedback. Scand. J. Med. Sci. Sports 2024, 34, e14565. [Google Scholar] [CrossRef] [PubMed]
- Colyer, S.L.; McGuigan, P.M. Textile Electrodes Embedded in Clothing: A Practical Alternative to Traditional Surface Electromyography when Assessing Muscle Excitation during Functional Movements. J. Sports Sci. Med. 2018, 17, 101–109. [Google Scholar] [PubMed]
- Finni, T.; Hu, M.; Kettunen, P.; Vilavuo, T.; Cheng, S. Measurement of EMG activity with textile electrodes embedded into clothing. Physiol. Meas. 2007, 28, 1405–1419. [Google Scholar] [CrossRef] [PubMed]
- Kyröläinen, H.; Avela, J.; Komi, P.V. Changes in muscle activity with increasing running speed. J. Sports Sci. 2005, 23, 1101–1109. [Google Scholar] [CrossRef] [PubMed]
- Cohen, J. A power primer. Psychol. Bull. 1992, 112, 155–159. [Google Scholar] [CrossRef] [PubMed]
- Cohen, J. Statistical Power Analysis for the Behavioral Sciences, 2nd ed.; Lawrence Erlbaum Associates: Hillside, NJ, USA, 1988. [Google Scholar]
- Sonderegger, K.; Tschopp, M.; Taube, W. The Challenge of Evaluating the Intensity of Short Actions in Soccer: A New Methodological Approach Using Percentage Acceleration. PLoS ONE 2016, 11, e0166534. [Google Scholar] [CrossRef]
- Hoppe, M.W.; Baumgart, C.; Slomka, M.; Polglaze, T.; Freiwald, J. Variability of Metabolic Power Data in Elite Soccer Players During Pre-Season Matches. J. Hum. Kinet. 2017, 58, 233–245. [Google Scholar] [CrossRef] [PubMed]
- Bosco, C. La Forza Muscolare; Società Stampa Sportiva: Roma, Italy, 1997. [Google Scholar]
- Grant, K.A.; Habes, D.J. An electromyographic study of strength and upper extremity muscle activity in simulated meat cutting tasks. Appl. Ergon. 1997, 28, 129–137. [Google Scholar] [CrossRef]
- Hautier, C.A.; Arsac, L.M.; Deghdegh, K.; Souquet, J.; Belli, A.; Lacour, J.R. Influence of fatigue on EMG/force ratio and cocontraction in cycling. Med. Sci. Sports Exerc. 2000, 32, 839–843. [Google Scholar] [CrossRef]
- Madeleine, P.; Bajaj, P.; Søgaard, K.; Arendt-Nielsen, L. Mechanomyography and electromyography force relationships during concentric, isometric and eccentric contractions. J. Electromyogr. Kinesiol. 2001, 11, 113–121. [Google Scholar] [CrossRef] [PubMed]
- Oksanen, A.; Pöyhönen, T.; Ylinen, J.J.; Metsähonkala, L.; Anttila, P.; Laimi, K.; Hiekkanen, H.; Aromaa, M.; Salminen, J.J.; Sillanpää, M. Force production and EMG activity of neck muscles in adolescent headache. Disabil. Rehabil. 2008, 30, 231–239. [Google Scholar] [CrossRef]
- Polglaze, T.; Dawson, B.; Peeling, P. Gold Standard or Fool’s Gold? The Efficacy of Displacement Variables as Indicators of Energy Expenditure in Team Sports. Sports Med. 2016, 46, 657–670. [Google Scholar] [CrossRef] [PubMed]
- Hoppe, M.W.; Baumgart, C.; Polglaze, T.; Freiwald, J. Validity and reliability of GPS and LPS for measuring distances covered and sprint mechanical properties in team sports. PLoS ONE 2018, 13, e0192708. [Google Scholar] [CrossRef] [PubMed]
- Rumpf, M.C.; Lockie, R.G.; Cronin, J.B.; Jalilvand, F. Effect of Different Sprint Training Methods on Sprint Performance Over Various Distances: A Brief Review. J. Strength Cond. Res. 2016, 30, 1767–1785. [Google Scholar] [CrossRef] [PubMed]
- Matusiński, A.; Gołas, A.; Zajac, A.; Maszczyk, A. Acute effects of resisted and assisted locomotor activation on sprint performance. Biol. Sport 2022, 39, 1049–1054. [Google Scholar] [CrossRef] [PubMed]
- Zabaloy, S.; Carlos-Vivas, J.; Freitas, T.T.; Pareja-Blanco, F.; Loturco, I.; Comyns, T.; Gálvez-González, J.; Alcaraz, P.E. Muscle Activity, Leg Stiffness, and Kinematics During Unresisted and Resisted Sprinting Conditions. J. Strength Cond. Res. 2022, 36, 1839–1846. [Google Scholar] [CrossRef] [PubMed]


Disclaimer/Publisher’s Note: The statements, opinions and data contained in all publications are solely those of the individual author(s) and contributor(s) and not of MDPI and/or the editor(s). MDPI and/or the editor(s) disclaim responsibility for any injury to people or property resulting from any ideas, methods, instructions or products referred to in the content. |
© 2024 by the authors. Licensee MDPI, Basel, Switzerland. This article is an open access article distributed under the terms and conditions of the Creative Commons Attribution (CC BY) license (https://creativecommons.org/licenses/by/4.0/).
Share and Cite
Grassadonia, G.; Alcaraz, P.E.; Freitas, T.T. Comparison of Metabolic Power and Energy Cost of Submaximal and Sprint Running Efforts Using Different Methods in Elite Youth Soccer Players: A Novel Energetic Approach. Sensors 2024, 24, 2577. https://doi.org/10.3390/s24082577
Grassadonia G, Alcaraz PE, Freitas TT. Comparison of Metabolic Power and Energy Cost of Submaximal and Sprint Running Efforts Using Different Methods in Elite Youth Soccer Players: A Novel Energetic Approach. Sensors. 2024; 24(8):2577. https://doi.org/10.3390/s24082577
Chicago/Turabian StyleGrassadonia, Gabriele, Pedro E. Alcaraz, and Tomás T. Freitas. 2024. "Comparison of Metabolic Power and Energy Cost of Submaximal and Sprint Running Efforts Using Different Methods in Elite Youth Soccer Players: A Novel Energetic Approach" Sensors 24, no. 8: 2577. https://doi.org/10.3390/s24082577
APA StyleGrassadonia, G., Alcaraz, P. E., & Freitas, T. T. (2024). Comparison of Metabolic Power and Energy Cost of Submaximal and Sprint Running Efforts Using Different Methods in Elite Youth Soccer Players: A Novel Energetic Approach. Sensors, 24(8), 2577. https://doi.org/10.3390/s24082577