Abstract
The operational integrity of the BeiDou-3 Navigation Satellite System (BDS-3) has been significantly challenged by electromagnetic interference, particularly from Distance Measuring Equipment (DME) ground beacons to the newly implemented B2a signal, since its full operational deployment in 2020. This study developed a comprehensive interference evaluation model based on receiver signal processing principles to quantify the degradation of B2a signal reception performance under DME interference scenarios. Leveraging empirical data from the DME beacon network in the Chinese mainland, we systematically analyzed the interference effects through an effective carrier-to-noise ratio (), signal detection probability, carrier tracking accuracy, and demodulation bit error rate (BER). The results demonstrate that the effective of the B2a signal degrades by up to 3.25 dB, the detection probability decreases by 33%, and the carrier tracking errors and BER increase by 2.57° and 5.1%, respectively, in worst-case interference scenarios. Furthermore, significant spatial correlation was observed between the interference hotspots and regions of high aircraft density. DME interference adversely affected the accuracy, availability, continuity, and integrity of the airborne BeiDou navigation system, thereby compromising civil aviation flight safety. These findings establish a scientific foundation for developing Minimum Operational Performance Standards for B2a signal receivers and for strategically optimizing DME beacon deployment throughout the Chinese mainland.
1. Introduction
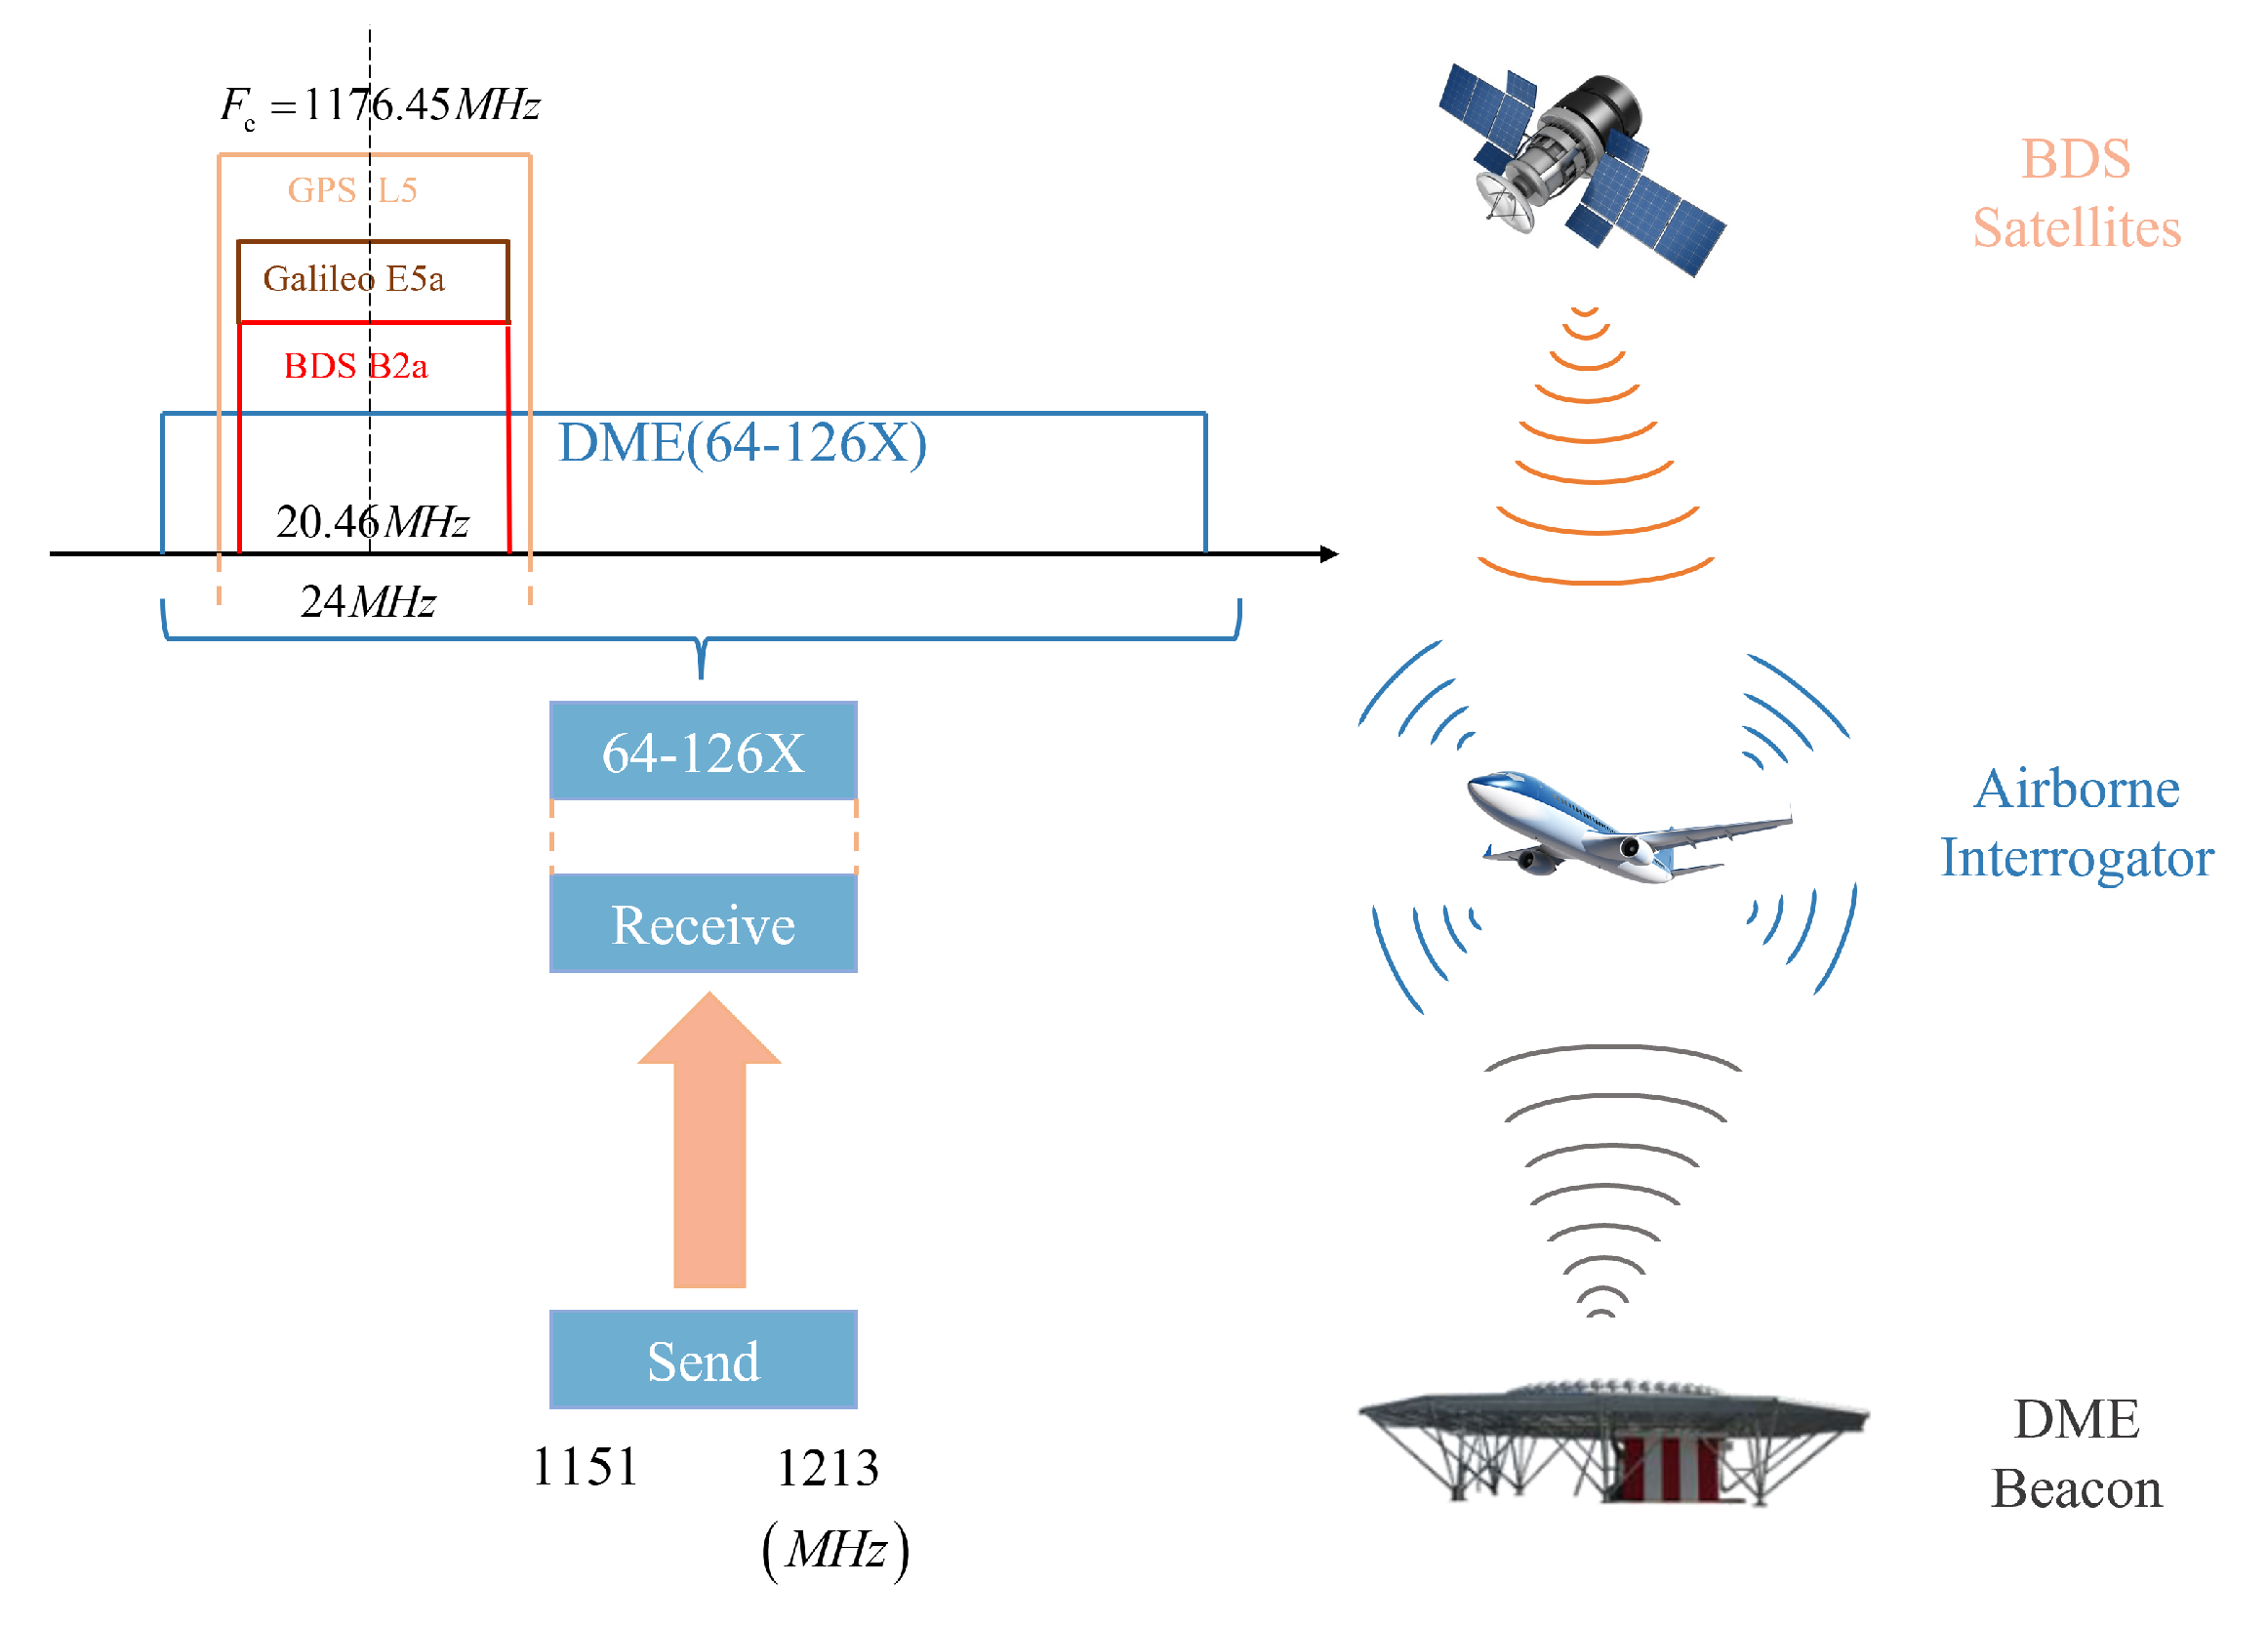
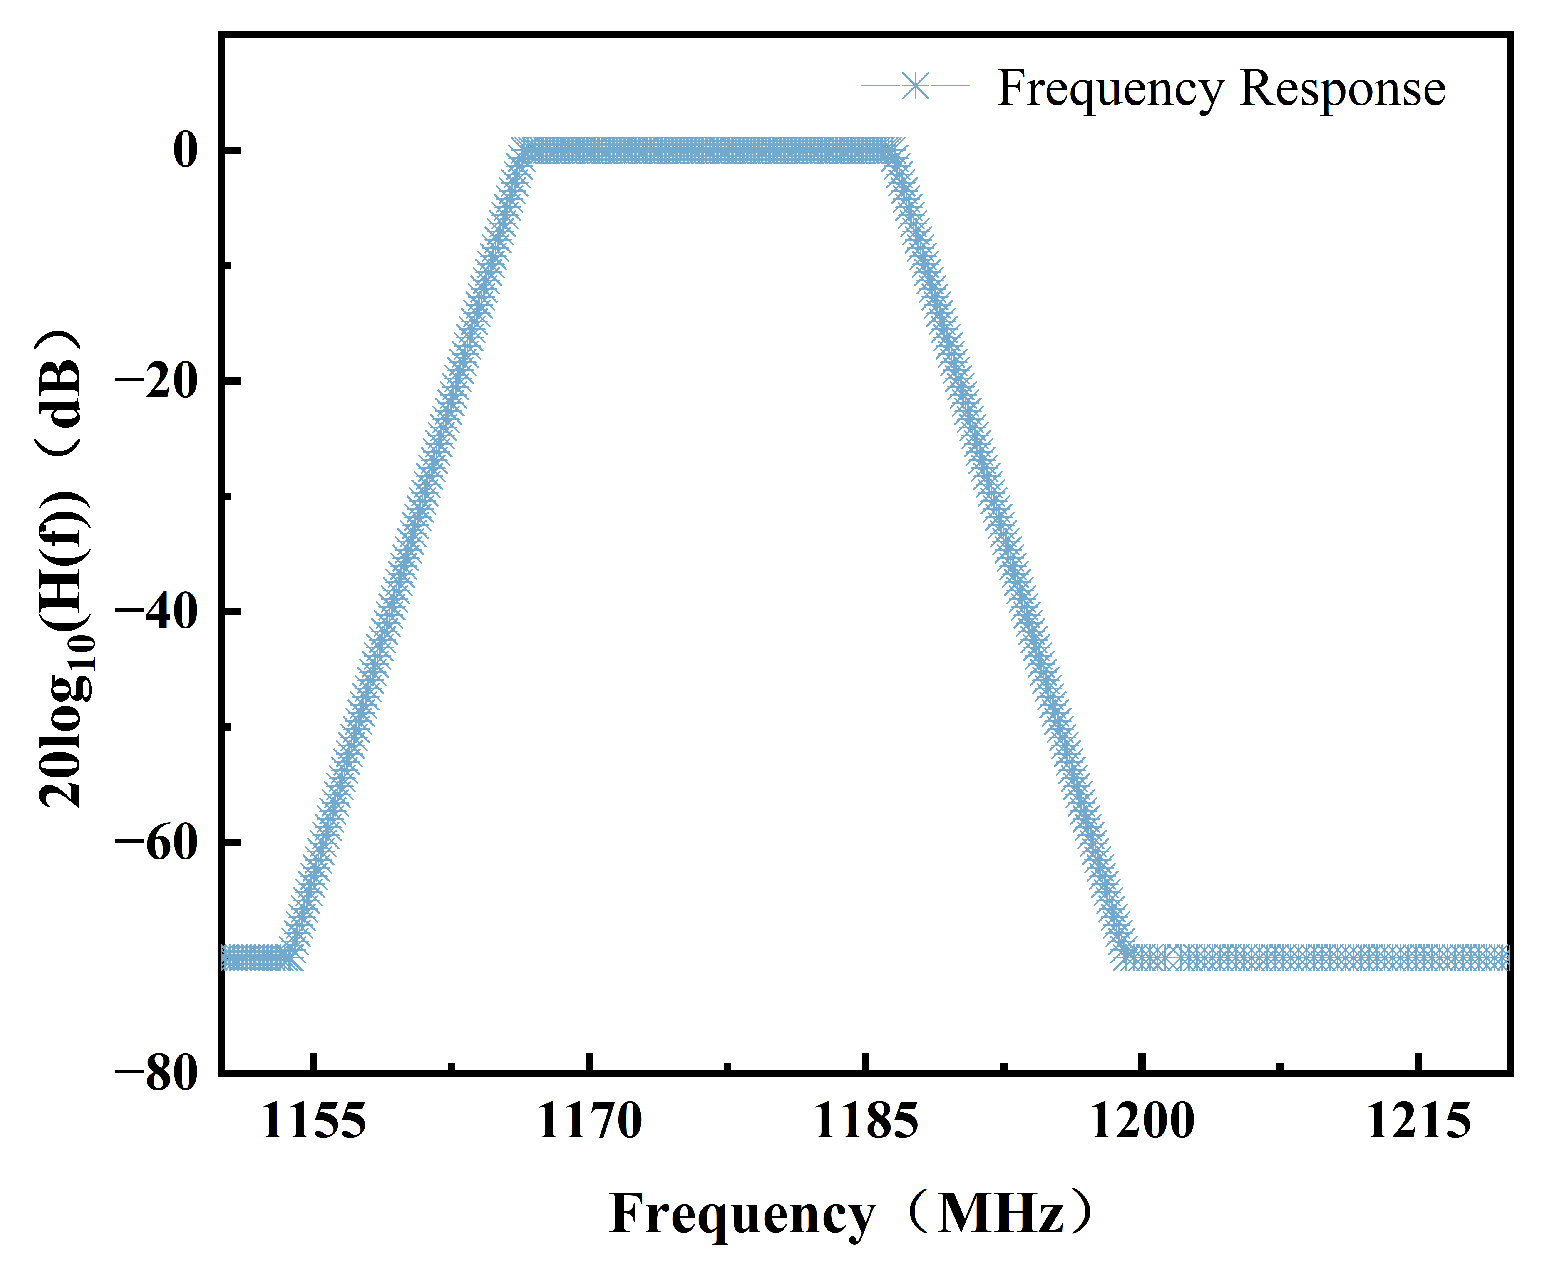
Global Navigation Satellite Systems (GNSS) signal processing is susceptible to electromagnetic interference, which can severely degrade signal quality, positioning accuracy, and overall system reliability [1,2,3]. In the context of civil aviation, identifying and quantifying the impact of radio frequency interference (RFI) on the performance of navigation signals reception is essential [4,5]. The BeiDou-3 Navigation Satellite System (BDS-3), which achieved full operational capability in 2020, marked a major milestone in China’s satellite navigation technology. Operating at 1176.45 MHz, the newly implemented B2a signal is spectrally compatible with Global Positioning System (GPS) L5 and Galileo E5a signals through identical frequency allocation and similar modulation characteristics. This enables improved positioning accuracy and precise timing for airborne navigation systems [6]. However, the frequency resources available for aeronautical radio navigation services are highly constrained and exhibit significant overlap with the operating frequency bands of ground-based navigation systems. Distance Measuring Equipment (DME), serving as essential ground-based navigation infrastructure, operates in the 1151–1213 MHz frequency band. This range creates substantial spectral overlap with the B2a signal (Figure 1), potentially causing significant interference. Consequently, DME has emerged as a primary RFI source for B2a signal in aviation applications [7].
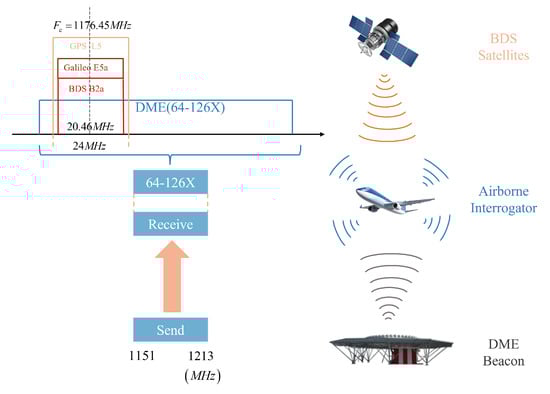
Figure 1.
The spectrum conflict between DME and GNSS signals.
Previous studies have confirmed the existence of RFI between DME and GNSS signals (GPS L5/BeiDou B2 bands) [8,9]. It has been shown that the level of interference caused by DME beacons to aeronautical users is closely related to the geographical distribution of DME ground beacons [10,11]. In high-altitude flight scenarios, aeronautical users are subject to the greater interference that results from the simultaneous reception of multiple DME ground beacon signals [12]. To quantify the interference effects of DME under worst-case scenarios, the Radio Technical Commission for Aeronautics (RTCA) evaluated the degradation of the carrier-to-noise ratio () of GNSS L5/E5a signals in high-altitude flight conditions [13]. The International Civil Aviation Organization (ICAO) conducted further studies on DME beacons in Europe and the United States, which clarified the impact distribution of European and US DME ground beacons on L5/E5a signal performance at high altitudes [14,15].
The global deployment of BDS-3 has driven intensified research into B2a signal interference characteristics, particularly in aeronautical navigation contexts [16,17,18]. Wang et al. proposed a method to evaluate B2a signal degradation. Their approach specifically analyzed the interference from DME beacons in potential interference hotspots of the Chinese mainland, with particular consideration given to complex terrain effects [16]. Liu et al. conducted a systematic analysis of DME-induced degradation mechanisms in airborne receivers across different parameter configurations, extending the investigation to its consequential effects on aviation protection level performance [17]. Zhang et al. conducted a quantitative analysis of B2a signal interference from DME beacons co-located with VORs in the Chinese mainland based on the RTCA assessment framework [18]. However, this model is limited to single-parameter () evaluation and exhibits conservative estimations under multi-DME interference scenarios [19]. While significant progress has been made in interference assessment approaches and impact quantification, several critical issues remain to be addressed. The current evaluation systems primarily focus on a single dimension of degradation, lacking systematic consideration of the impacts that are present throughout the entire signal processing chain. The spatial scope was limited to preliminary analyses of specific hotspots or localized regions, with no comprehensive quantitative assessment of the DME beacons across the entire Chinese mainland, and it was also found that signal propagation loss factors need to be more thoroughly incorporated into existing models. The research related to investigating the DME effects on B2a, compared with GPS and Galileo, is still relatively limited. The general aim of this paper was, thus, to develop an enhanced evaluation model for quantifying the impact of DME beacons on B2a signal reception performance across the whole area of the Chinese mainland. Quantitative analysis of the multi-parameter performance degradation for airborne users caused by multiple DME interference in high-altitude scenarios was conducted with determination of the worst-case interference values.
In this study, a mathematical model was first constructed based on the principle of pulse blanker to quantify the B2a signal degradation under DME interference scenarios. Taking into account the signal processing process of BeiDou receivers, an evaluation model was established to assess the degradation of B2a signal reception performance. Subsequently, the degradation of B2a signal reception performance and the distribution of interference hotspots were evaluated using empirical data from the DME beacon network in the Chinese mainland and the interference budget model. The findings establish a scientific foundation for developing Minimum Operational Performance Standards for B2a signal receivers and strategically optimizing DME beacon deployment across the Chinese mainland.
2. DME Interference Model
DME operates across the 962–1213 MHz frequency spectrum, utilizing 252 discrete channels with 1 MHz inter-channel spacing. The system employs two distinct operational modes: X-mode and Y-mode. For airborne equipment, the transmission frequency for channels 1X to 126X ranges from 1025 MHz to 1150 MHz, while the reception frequencies range from 962 MHz to 1024 MHz (for channels 1X–63X) and from 1151 MHz to 1213 MHz (for channels 64X–126X) [20]. The B2a signal completely falls within 1151 MHz to 1213 MHz, and the DME interference is mainly from ground beacons [13]. Consequently, this study specifically examined the interference from DME ground beacons operating in channels 64X–126X (1154–1213 MHz).
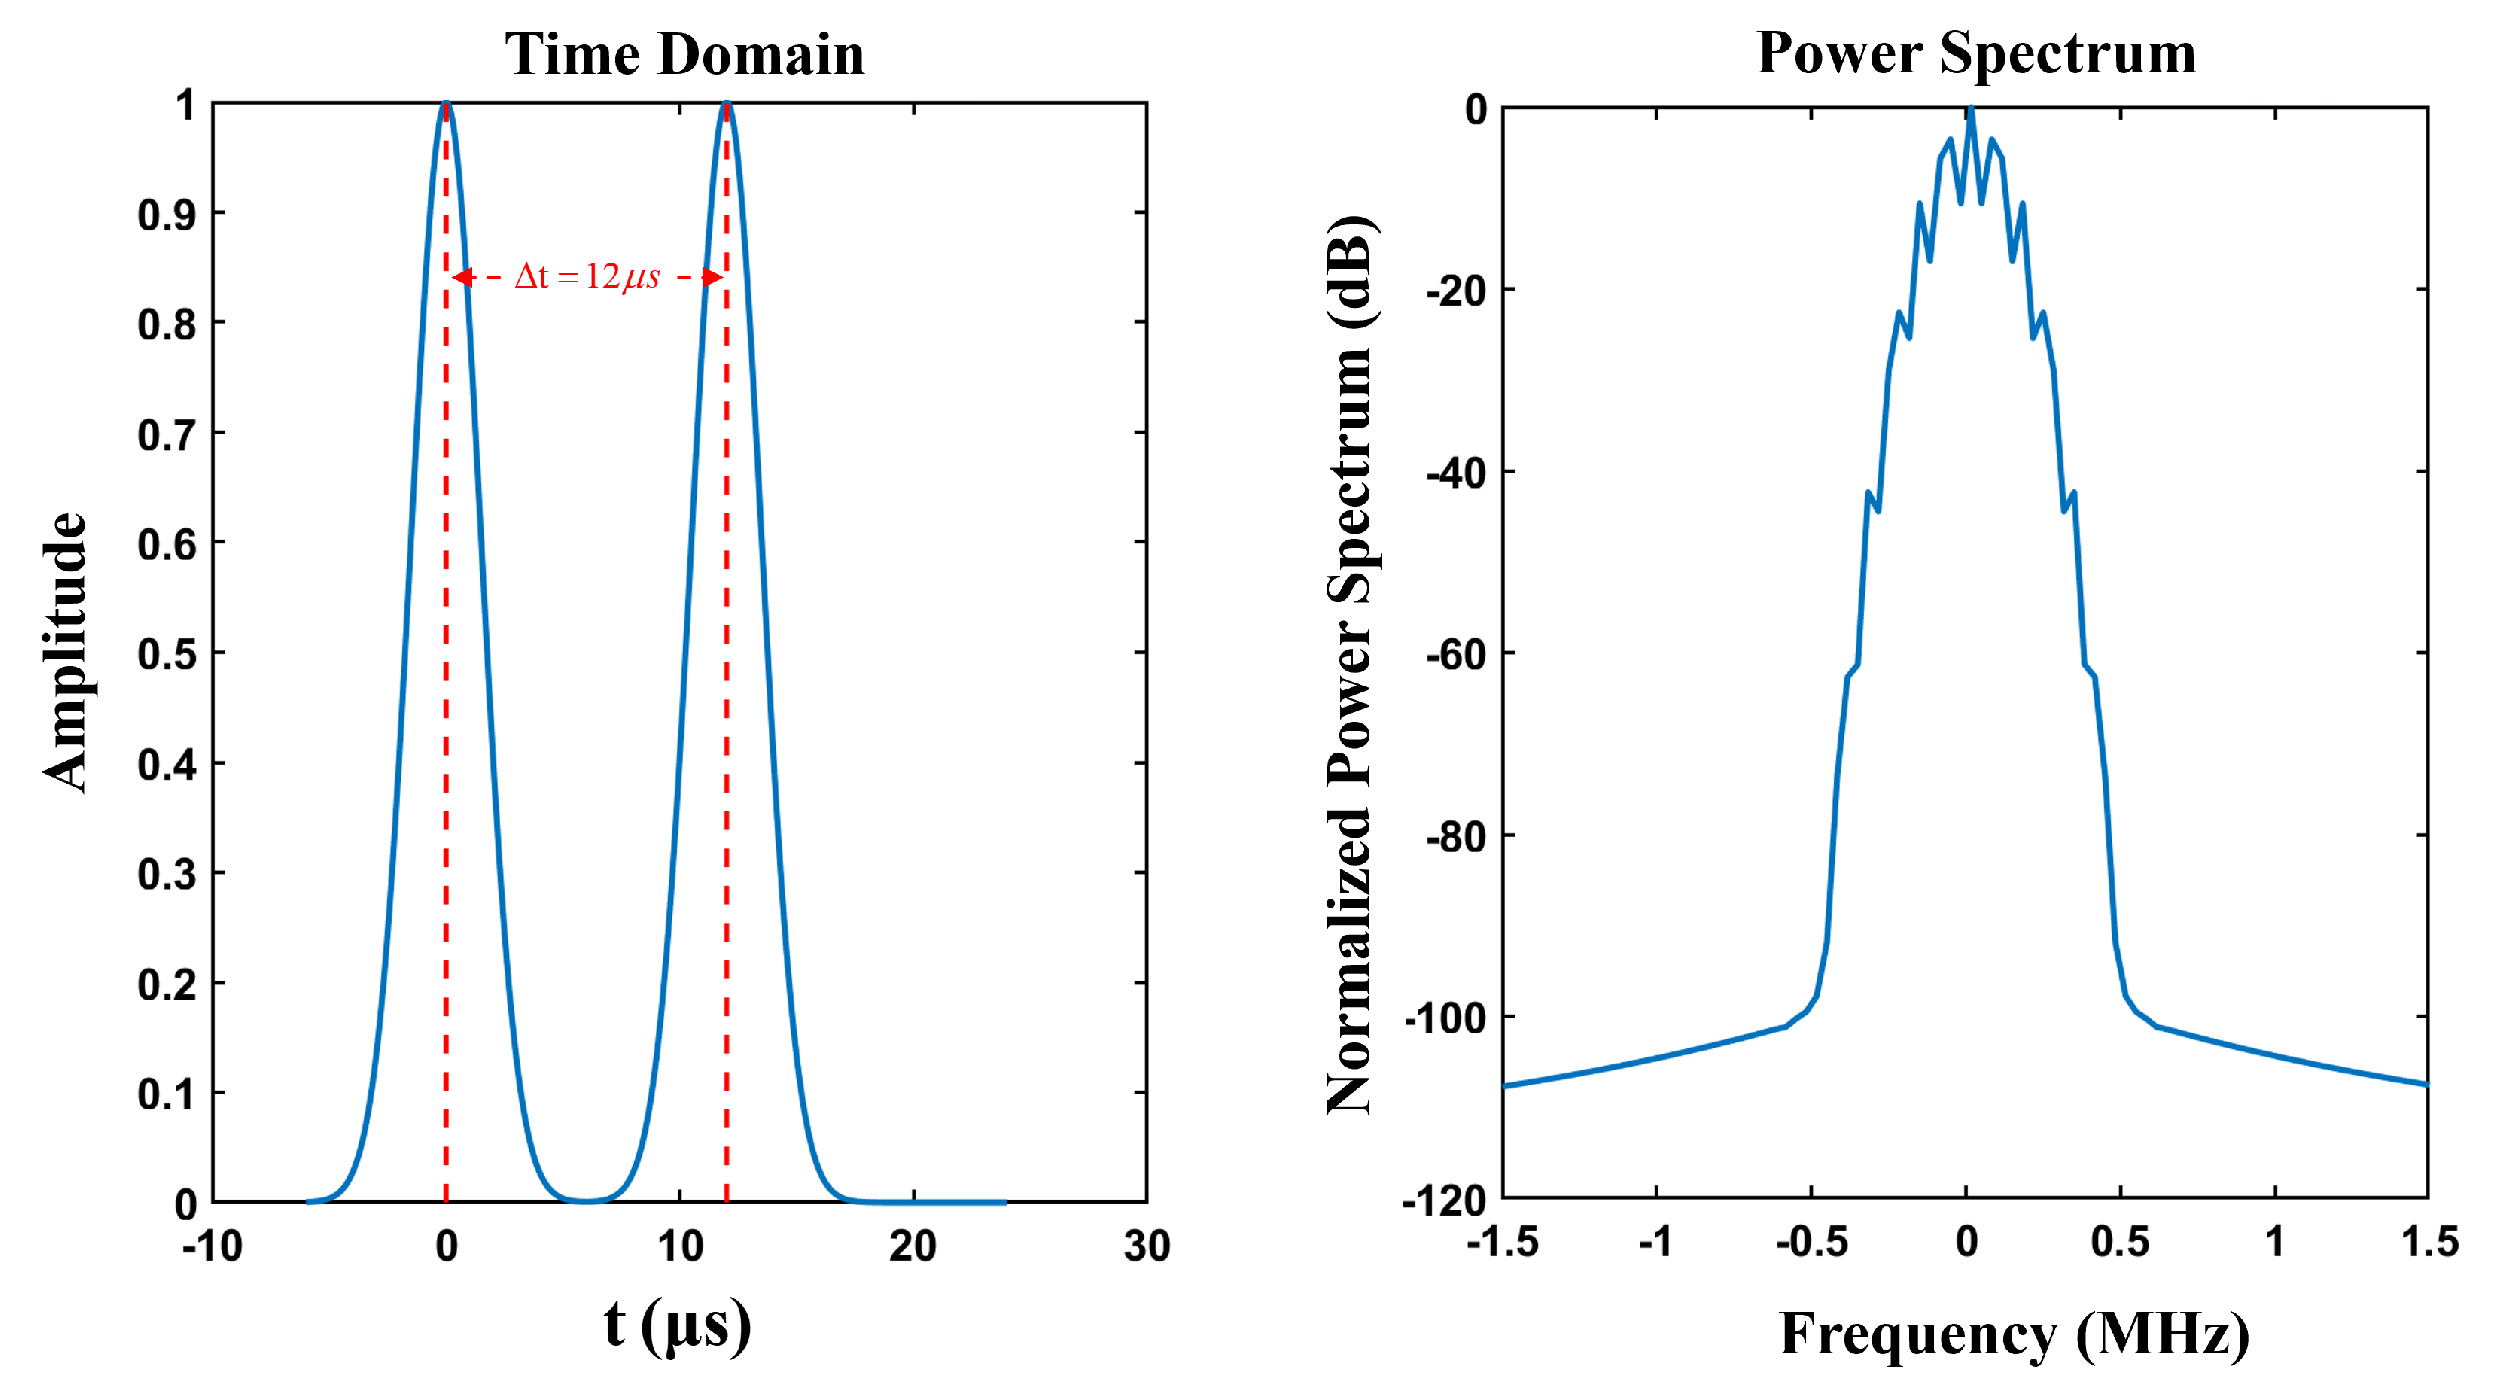
The DME signal consists of repetitive pulse pairs, and the time interval between the X-mode pulse pairs is 12 . The signal expression for the DME X-mode can be expressed by
where is , indicating the width of the pulse; and is the time interval between two pulses. The time-domain waveform and spectral characteristics of the simulated signal are shown in Figure 2. Pulse pairs arrived randomly at the aircraft, and the output peak power was 1 kW.
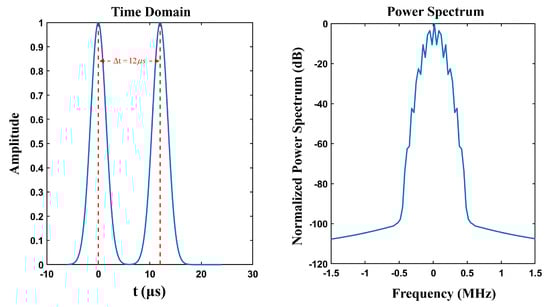
Figure 2.
The time domain waveform and spectral characteristics of the DME pulse pairs.
To describe the pulse pairs’ transmission rate of the ground beacon, the number of pulse pairs transmitted by a ground beacon per second, i.e., the pulse repeat rate (PRR), was usually used. As aircrafts may experience interference from different ground beacons at the same time, we designate the beacons as 1, 2, …, I. The DME radio frequency signal as interference can be defined as follows [15]:
where denotes the complete baseband signal transmitted by the DME beacon; and , , and denote the peak power, carrier frequency, and carrier phase of the DME signal, respectively.
If only the influence of DME interference is considered, the signal received by the BDS receiver antenna can be expressed by
where denotes the BeiDou signal, and denotes white noise.
3. Interference Evaluation Model
While the aforementioned DME interference model characterized the interference source properties, its actual impact on B2a signal reception performance required further quantification through the receiver processing chain. This section analyzes how DME pulses affect the carrier-to-noise ratio and reception performance of the B2a signal through critical modules, including the pulse blanker. The derivation of the interference evaluation model was finally completed.
The reception performance of the GNSS signals primarily encompasses acquisition, tracking, and demodulation, which mainly depends on the signal-to-noise-plus-interference-ratio (SNIR) at the output of the instant correlator in the receiver. However, due to the complexity of analyzing the SNIR, the was frequently utilized to characterize the signal [21,22]. The degradation in signal reception performance can be further calculated once the degradation is known.
3.1. Generic Airborne Civil Aviation BDS Receiver
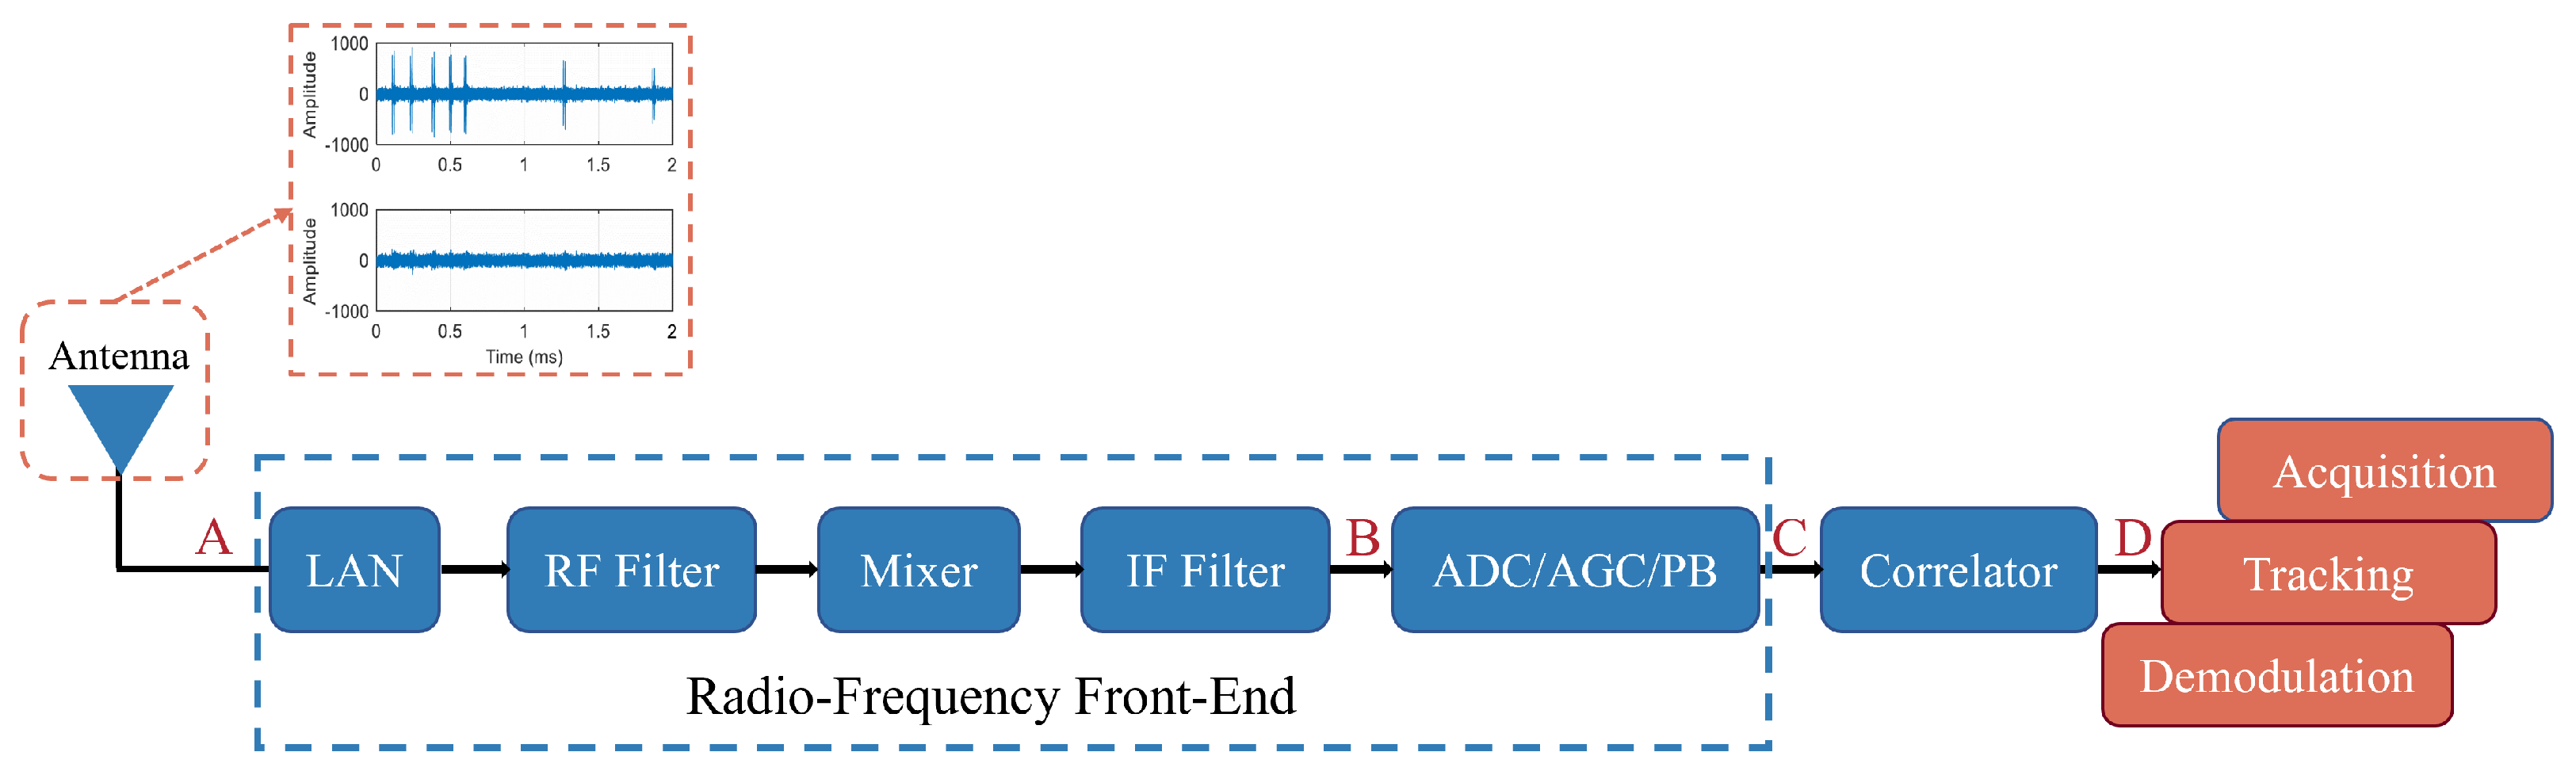
To support the evaluation model, this paper described a generic structure of the airborne civil aviation BDS receiver (as shown in Figure 3) and analyzed the impact of its key components on the received signal.

Figure 3.
The structure of a general civil aviation BDS receiver.
The composite received signals were captured at the antenna port (Point A) and processed by the radio frequency front-end (RFFE) block (Point B). Within the RFFE, the signal underwent low-noise amplification, and this was followed by frequency downconversion to an intermediate frequency (IF) and multi-stage filtering for image rejection and spurious signal suppression. A digital pulse blanker (PB) was introduced after the RFFE block (Point C), which is key for the pulse interference suppression in the receiver [23]. The ideal PB operates as a zero-latency comparator that suppresses the signal to zero when the input power exceeds a predefined threshold. The blanking operation nullifies all input components, including useful signals, interference, and noise. While effectively reducing noise power, it also diminishes the peak amplitudes of useful signals. Consequently, the overall experiences degradation [24]. The digitized and blanked signals are then fed to the correlator. At this stage, the residual RFI components present at the correlator output (Point D) will degrade the navigation signal reception performance.
3.2. Effective Carrier-to-Noise Ratio Degradation
Considering the impact of receiver components on the signals, the was defined as the ratio of the carrier signal power to the noise power at the correlator output of the receiver’s carrier tracking loop [25,26]. The degradation of the effective carrier-to-noise ratio, denoted as , was defined as the difference between , which only represents the carrier-to-noise ratio when the desired signal is present at the receiver antenna port, and , which corresponds to the carrier-to-noise ratio when a mixture of the desired signal and RFI is present (with pulse blanking enabled). This parameter is crucial for characterizing the impact of interference on navigation signals. The caused by DME interference is derived as [13]
where represents the total continuous aeronautical RFI power spectral density (PSD), and is the thermal noise power spectral density of the GNSS receiver. The key parameters governing DME interference are the pulse blanker duty cycle () and the interference-to-noise power spectral density ratio below the blanking threshold (), both of which are determined by the receiver’s pulse blanker characteristics. Assuming that the received peak power of the DME pulse signal is and that it is converted into an equivalent rectangular pulse, with the PB threshold set to , the modeling of and is as follows.
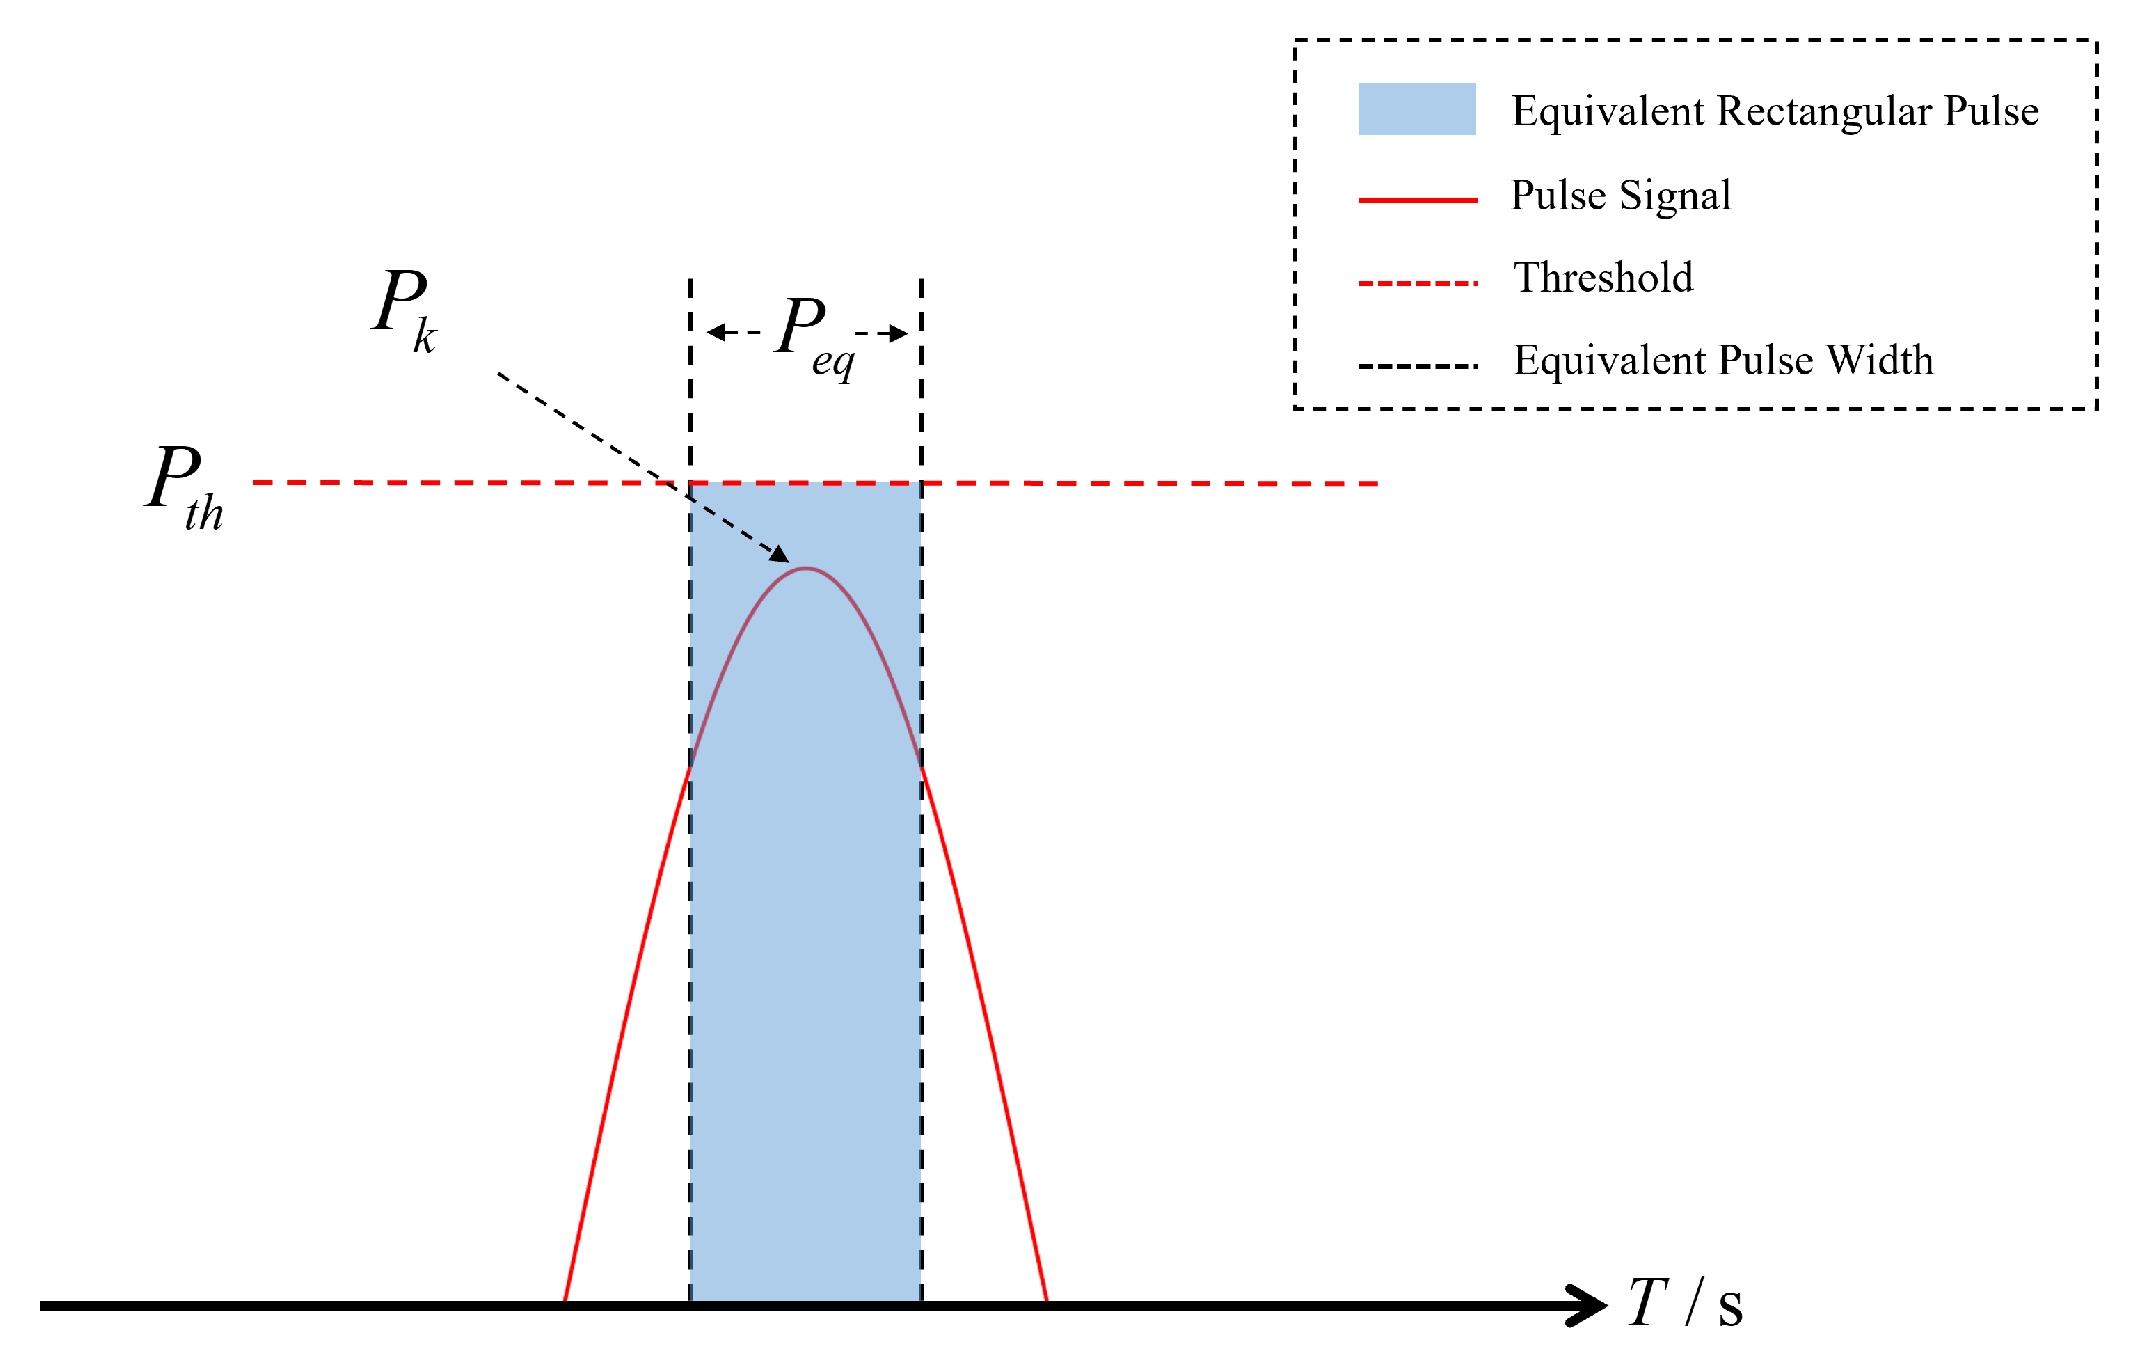
3.2.1. Single DME Signal Interference
For the case where , as shown in Figure 4, we have the following:
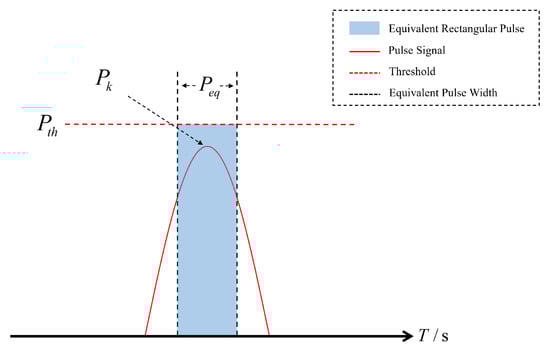
Figure 4.
Blanking of a weak pulse signal.
When the received signal power remains below the blanking threshold, the PB maintains inactive status, resulting in . The width of the equivalent rectangular pulse can be obtained by directly integrating the signal:
The equivalent rectangular pulse width of a single pulse is .
The DME pulse transmits 2700 pulse pairs per second (), and the equivalent pulse signal power per second is
According to the RTCA calculations, the thermal noise power spectral density of the GNSS receiver was −200 dBW [13]. For the B2a signal receiver, the bandwidth was 20 MHz [6], where can be expressed as
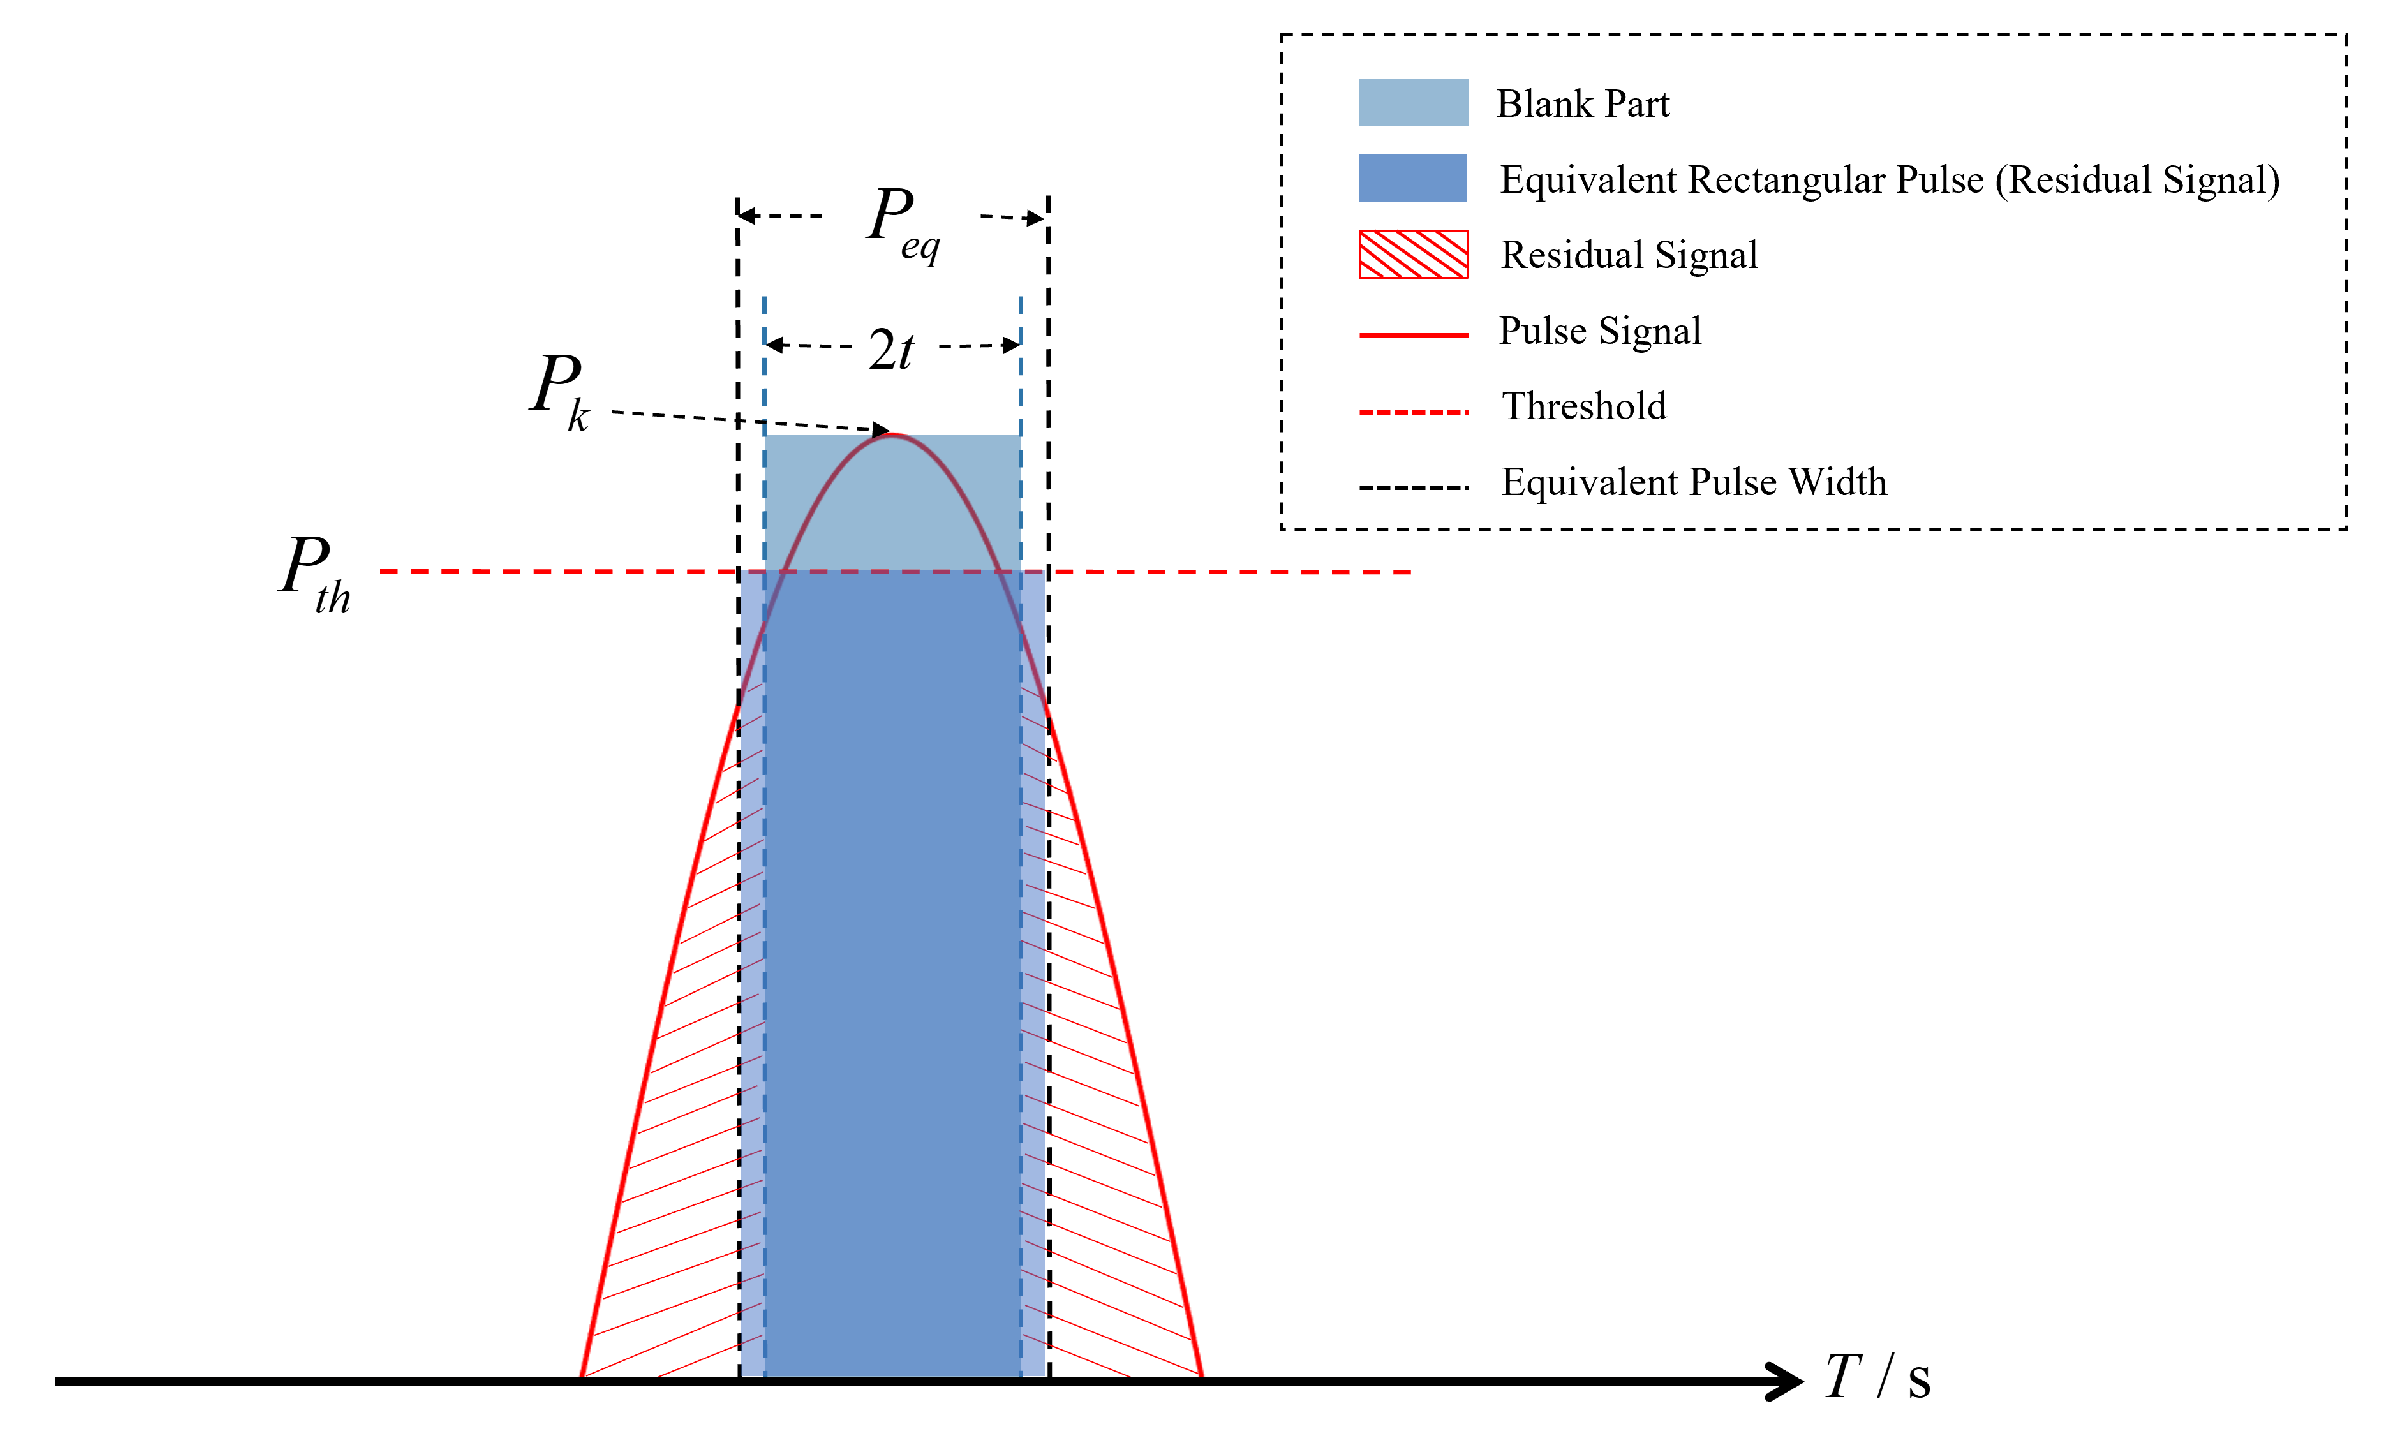
For another case where , as shown in Figure 5, we have the following:
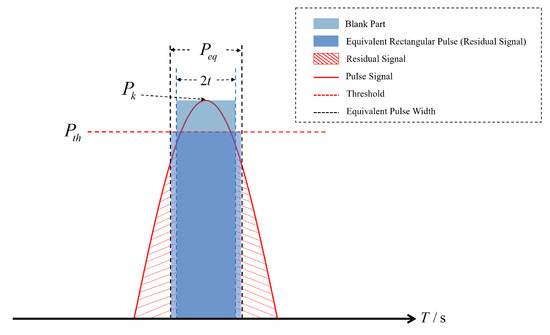
Figure 5.
Blanking of a strong pulse signal.
It must be noted that and follow Formulas (6) and (7). Since the PB was triggered, the equivalent rectangular pulse width could not be determined through integration. For the pulse width of the blanking part, the power of a single pulse pair was made equal to the threshold:
It can be calculated that
After pulse blanking, the signal only retains residual components beyond the eliminated main lobe, as shown in the red shaded part in Figure 5. The area of the equivalent rectangular pulse in the figure is equal to the area of the signal residual part. The equivalent rectangular pulse width of the residual signal can be obtained from the complementary error function (ERCF):
where w is half of the pulse blanking width, which is equal to t in value. Subsequently, the equivalent rectangular pulse width was used to calculate the value of :
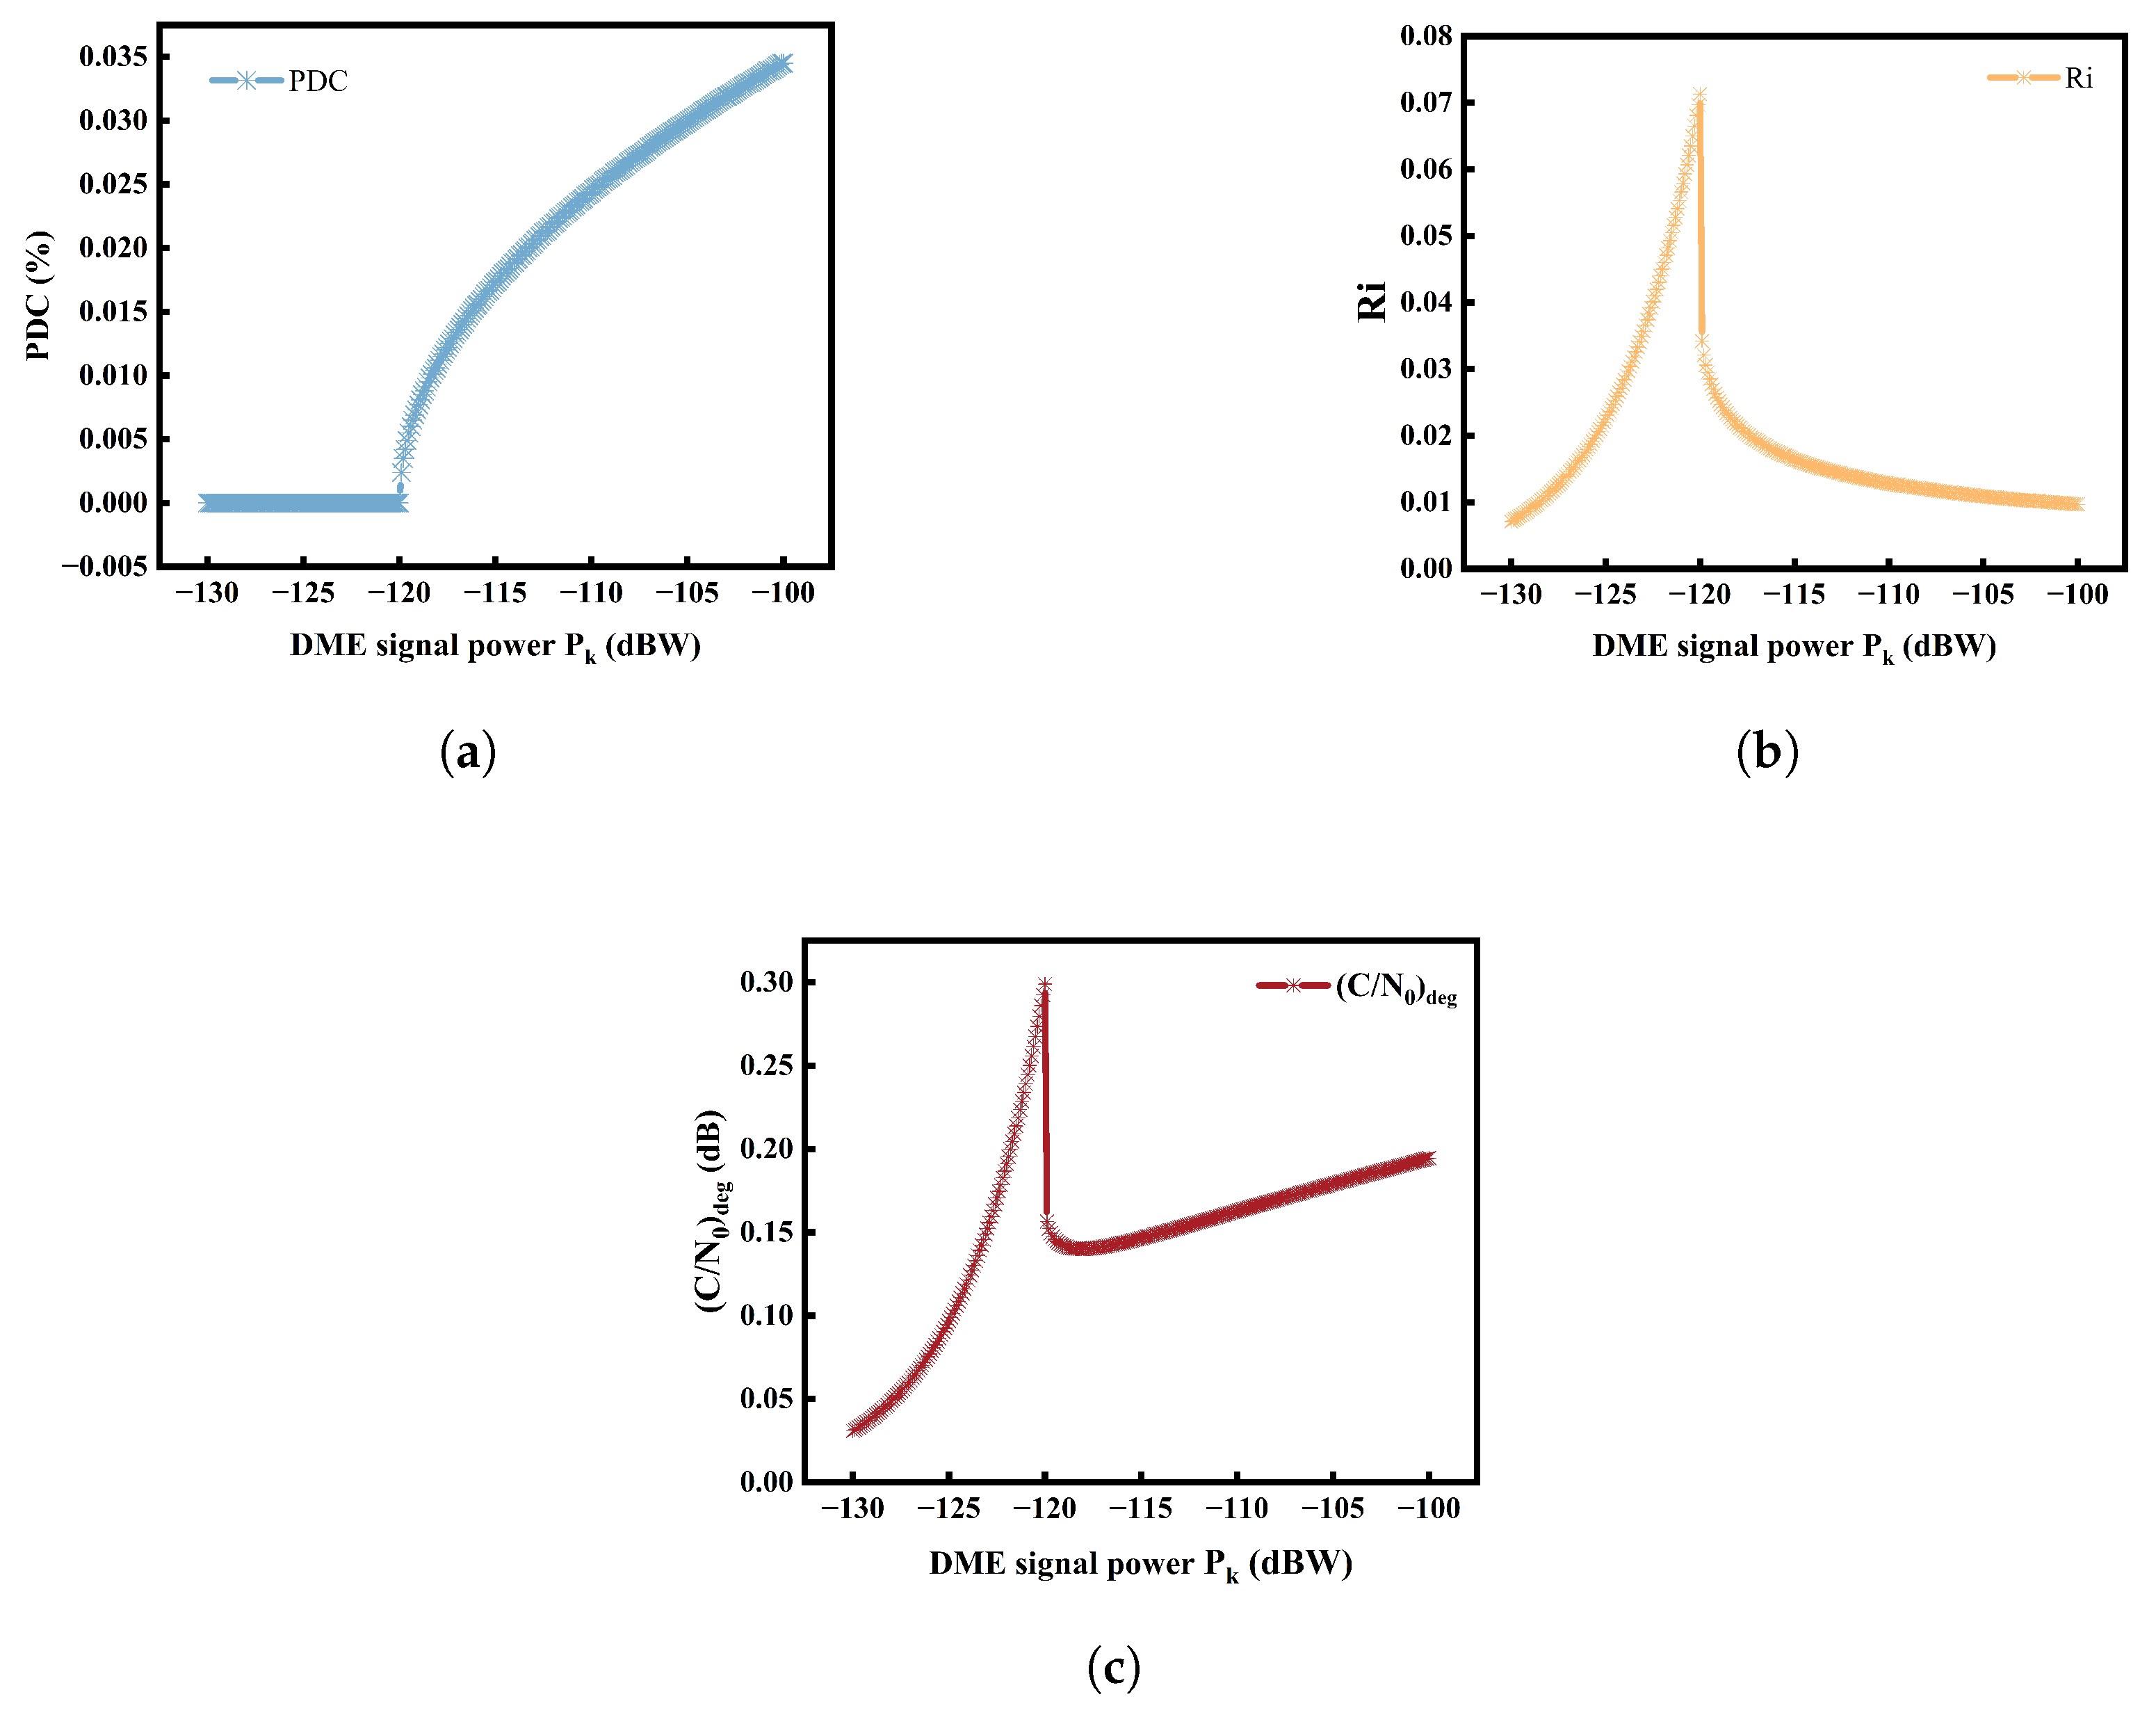
The performance of the PB was directly related to the selection of the pulse blanking threshold. According to RTCA validation, the receiver achieved better overall performance when dBW [13], and this value has been implemented in practical receivers. Additionally, the calculated total continuous aviation RFI power spectral density was dBW/Hz [13]. By incorporating these parameters, the values under different interference power levels for a single DME signal were obtained, as illustrated in Figure 6.
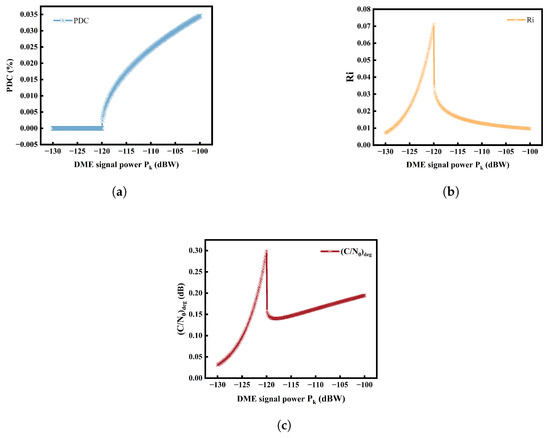
Figure 6.
The impact of the DME signal received power on (a), (b), and (c).
The remained a zero value before the PB was triggered. However, both and exhibited increases progressively as the interfering signal persisted and gradually increased. and reached the maximum value when equaled . When , began to show positive values due to the blanking effect of PB, while and decreased as the interference signals diminished. However, when became excessively large, the overactive blanking effect led to a significant reduction in the B2a signal power, while the gradually resumed an upward trend.
3.2.2. Multiple DME Signal Interference
Aviation users can receive signals from different DME beacons at a given position in real flight scenarios. Assuming that the arrival times of different DME pulse signals at the receiver are uniformly distributed and do not interact, the total and can be calculated as
where i denotes the number of DME interference signals received by the airborne receiver.
3.3. B2a Signal Reception Performance Degradation
Detection probability is a key parameter of signal acquisition and determines the acquisition performance [27]. If represents noise only and represents a composite signal consisting of both interference and noise, the power of the input signal, which is defined as the detection metric, can be expressed as
The intermediate frequency (IF) signal received by the receiver is mixed with the in-phase and quadrature carriers, respectively, to obtain the I-channel and Q-channel signals. and are the coherent integration results for the I and Q paths, respectively, while M is the number of incoherent integrations.
The detection threshold was , and the false alarm probability and detection probability of the signal can be expressed by
where is the gamma function; is the noncentral parameter of the noncentral chi-squared distribution; represents the pre-detection integration time; and is the first class of order Bessel functions.
In the practical acquisition process, the false alarm probability for signal detection should be minimized; typically, it is set to . And the detection probability of the signal under different detection integration times can be further calculated if and are known.
The acquired navigation signal iswas passed into the carrier tracking loop, where its performance governed both tracking precision and dynamic response. The most commonly used carrier tracking ring was a phase locked loop (PLL), and its tracking quality was quantified by the carrier tracking measurement error [28]. The jitter sources of the PLL are generally transient for generic airborne civil aviation BDS receivers, and carrier tracking errors are typically attributed to thermal noise. When interference exists, its contribution to carrier tracking error must be additionally accounted for. The final carrier tracking error caused by thermal noise and interference can be determined by
where is the carrier loop noise bandwidth. In order to conservatively evaluate the performance degradation of the receiver under the DME interference scenario, was taken to be 20 Hz for the simulation [29], and was taken to represent the pre-detection integration time for carrier tracking.
The data demodulation of the signal is important for the performance, accuracy, and reliability of the whole navigation system. The demodulation bit error rate (BER) quantifies the probability of bit errors (Pe) during the demodulation of navigation signal data, and it is a key metric for assessing signal demodulation performance [5]. When the B2a signal is affected by interference from DME pulses, the equivalent noise power is assumed to be . The equivalent noise can be approximated as a Gaussian noise with mean 0 and a variance of . Assuming the receiver’s judgment threshold is 0, the Pe can be expressed as
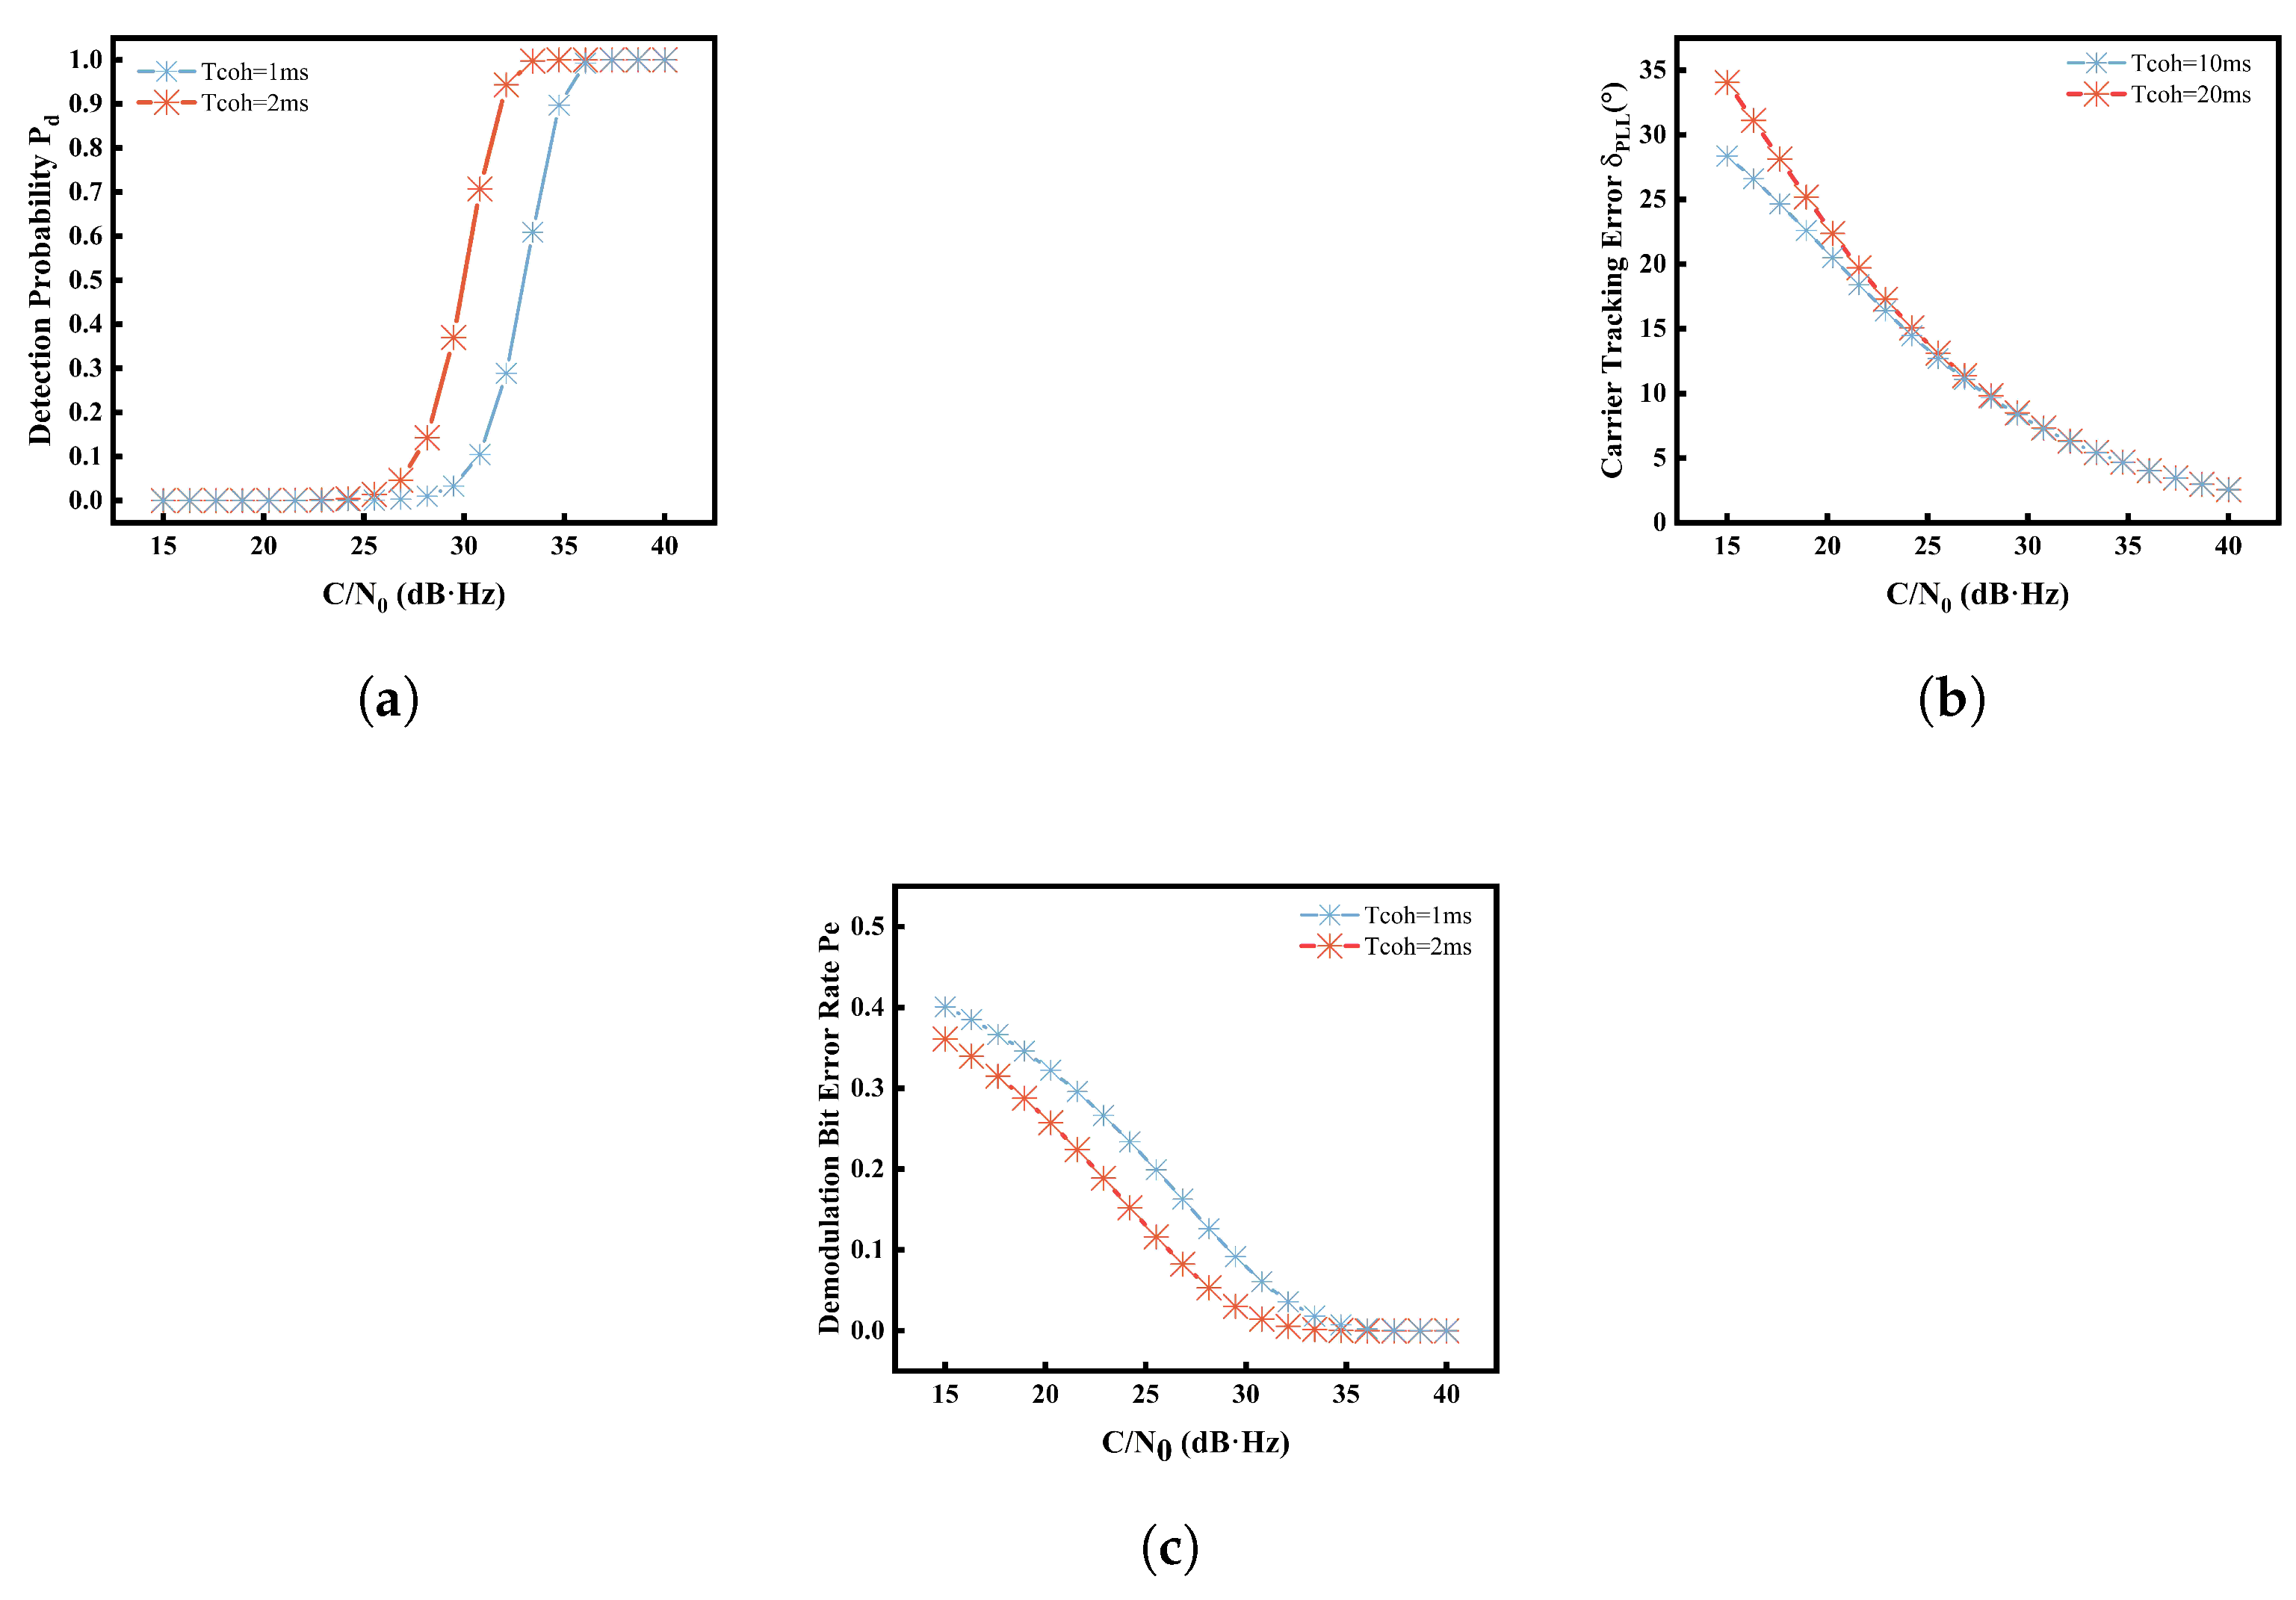
where C represents the signal power, and represents the integration duration of the carrier tracking loop. Different integration times were selected to carry out the simulations to verify the usability of the model, and the variations of , , and as functions of under different integration times are shown in Figure 7.
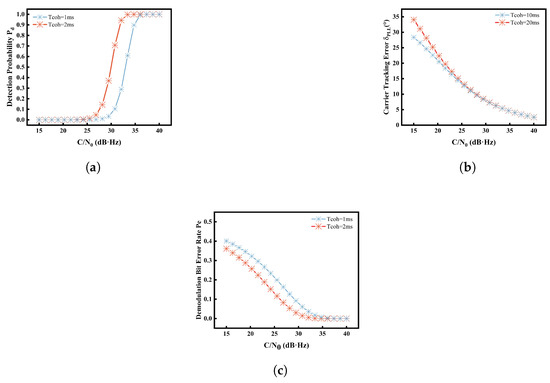
Figure 7.
The impact of on the B2a signal detection probability (a), carrier tracking error (b), and the demodulation bit error rate (c).
The results reveal a pronounced degradation in signal reception performance when the carrier-to-noise ratio drops below a certain threshold (30–35 dB·Hz). Specifically, the signal detection probability decreases significantly, while the carrier tracking error and demodulation bit error rate exhibit an increasing trend. However, the detection probability is more sensitive to changes. Notably, increasing the pre-detection integration time can partially mitigate the degradation in detection probability and demodulation error rate, particularly for the detection probability. This demonstrates that interference can significantly degrade receiver performance, but adjusting the integration time can influence the extent of this degradation.
4. Evaluation of B2a Signal Reception Performance
Building upon the established evaluation framework, this section quantitatively assesses B2a signal reception performance degradation under representative high-altitude flight conditions (FL400). The analysis integrates DME beacon network data (including transmit power, spatial distribution, etc.), propagation losses, and receiver characteristics to simulate the interference evaluation results at FL400.
The RFI threat to the B2a signal primarily originates from DME beacons co-located with VOR stations. According to the latest 2022 statistics from the Civil Aviation Administration of China (CAAC) on en-route radio navigation aids in the Chinese mainland, there are currently 274 operational DME ground beacons, with 212 co-located with VORs. After excluding 98 beacons that present no direct interference risk, the evaluation of DME beacon impacts on B2a signal focuses on 176 ground-based beacons operating in the 64X–126X channels that are co-located with VOR stations.
4.1. DME Signal Reception Power Budget
The signal power budget constitutes a critical component of the interference evaluation framework, necessitating comprehensive characterization of the complete transmission channel from DME beacon emission to receiver acquisition.
According to the “MH/T4006.3-1998 Aviation Radio Navigation Equipment Part 3: Rangefinder (DME) Technical Requirements” [30], the peak output power of DME beacons is specified as 1000 W (90 dBW). The maximum antenna gain is 9 dB (at an elevation angle of ), and the feed line loss is dB.
The dominant factor in signal power attenuation is space loss in the propagation path, which comprises four key components: free-space path loss, lens effect loss, polarization, and rain attenuation loss. From the radar equation, the free-space path loss of the transmitted signal from DME beacon is calculated as follows:
where represents the wavelength of the signal emitted by the DME beacon, and R represents the slant distance from the DME beacon.
While DME signal propagation is fundamentally limited by line-of-sight constraints, ground station transmissions located slightly beyond the radio horizon remain detectable. This phenomenon occurs due to terrain diffraction effects at the horizon boundary, although additional losses due to this diffraction effect mount rapidly. In high-altitude analysis, in addition to calculating the path loss using Formula (19), additional losses caused by terrain diffraction and multipath effects due to terrain and distance must also be considered. When the terrain on the radio horizon just grazes the propagation path, an additional loss of 7-to-10 dB may occur [13].
The lens effect loss is the different degree of refraction of radio waves radiated from different elevation angles of the earth’s surface, resulting in signal loss. For the DME signal, when the antenna elevation angle is , the lens effect loss is as shown in Table 1.

Table 1.
The lens effect loss of the DME signal.
The antenna polarization loss and rain attenuation loss for the L-band signal is generally set to 1 dB [18].
Within the receiver part, the receiver pre-selection filter insertion loss is a key consideration. When the bandwidth is 20 MHz, the equivalent filter transfer function response characteristics of the two front-end filters and the antenna are as shown in Figure 8 [13]. The gain of the receiver antenna for the DME signals was conservatively estimated at 0 dB.
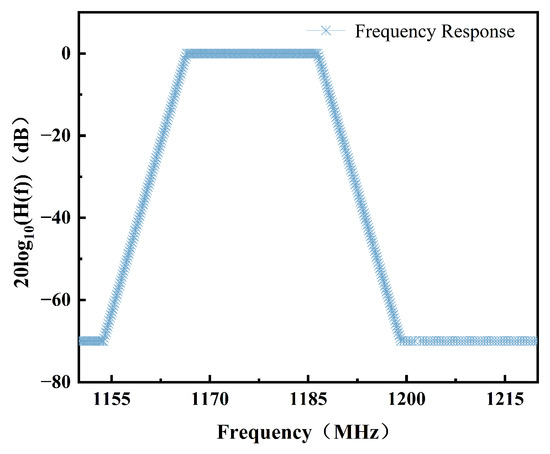
Figure 8.
Equivalent filter transfer function response characteristics.
Through the above analysis, the DME signal power received by the airborne BDS receiver is
4.2. Evaluation Results
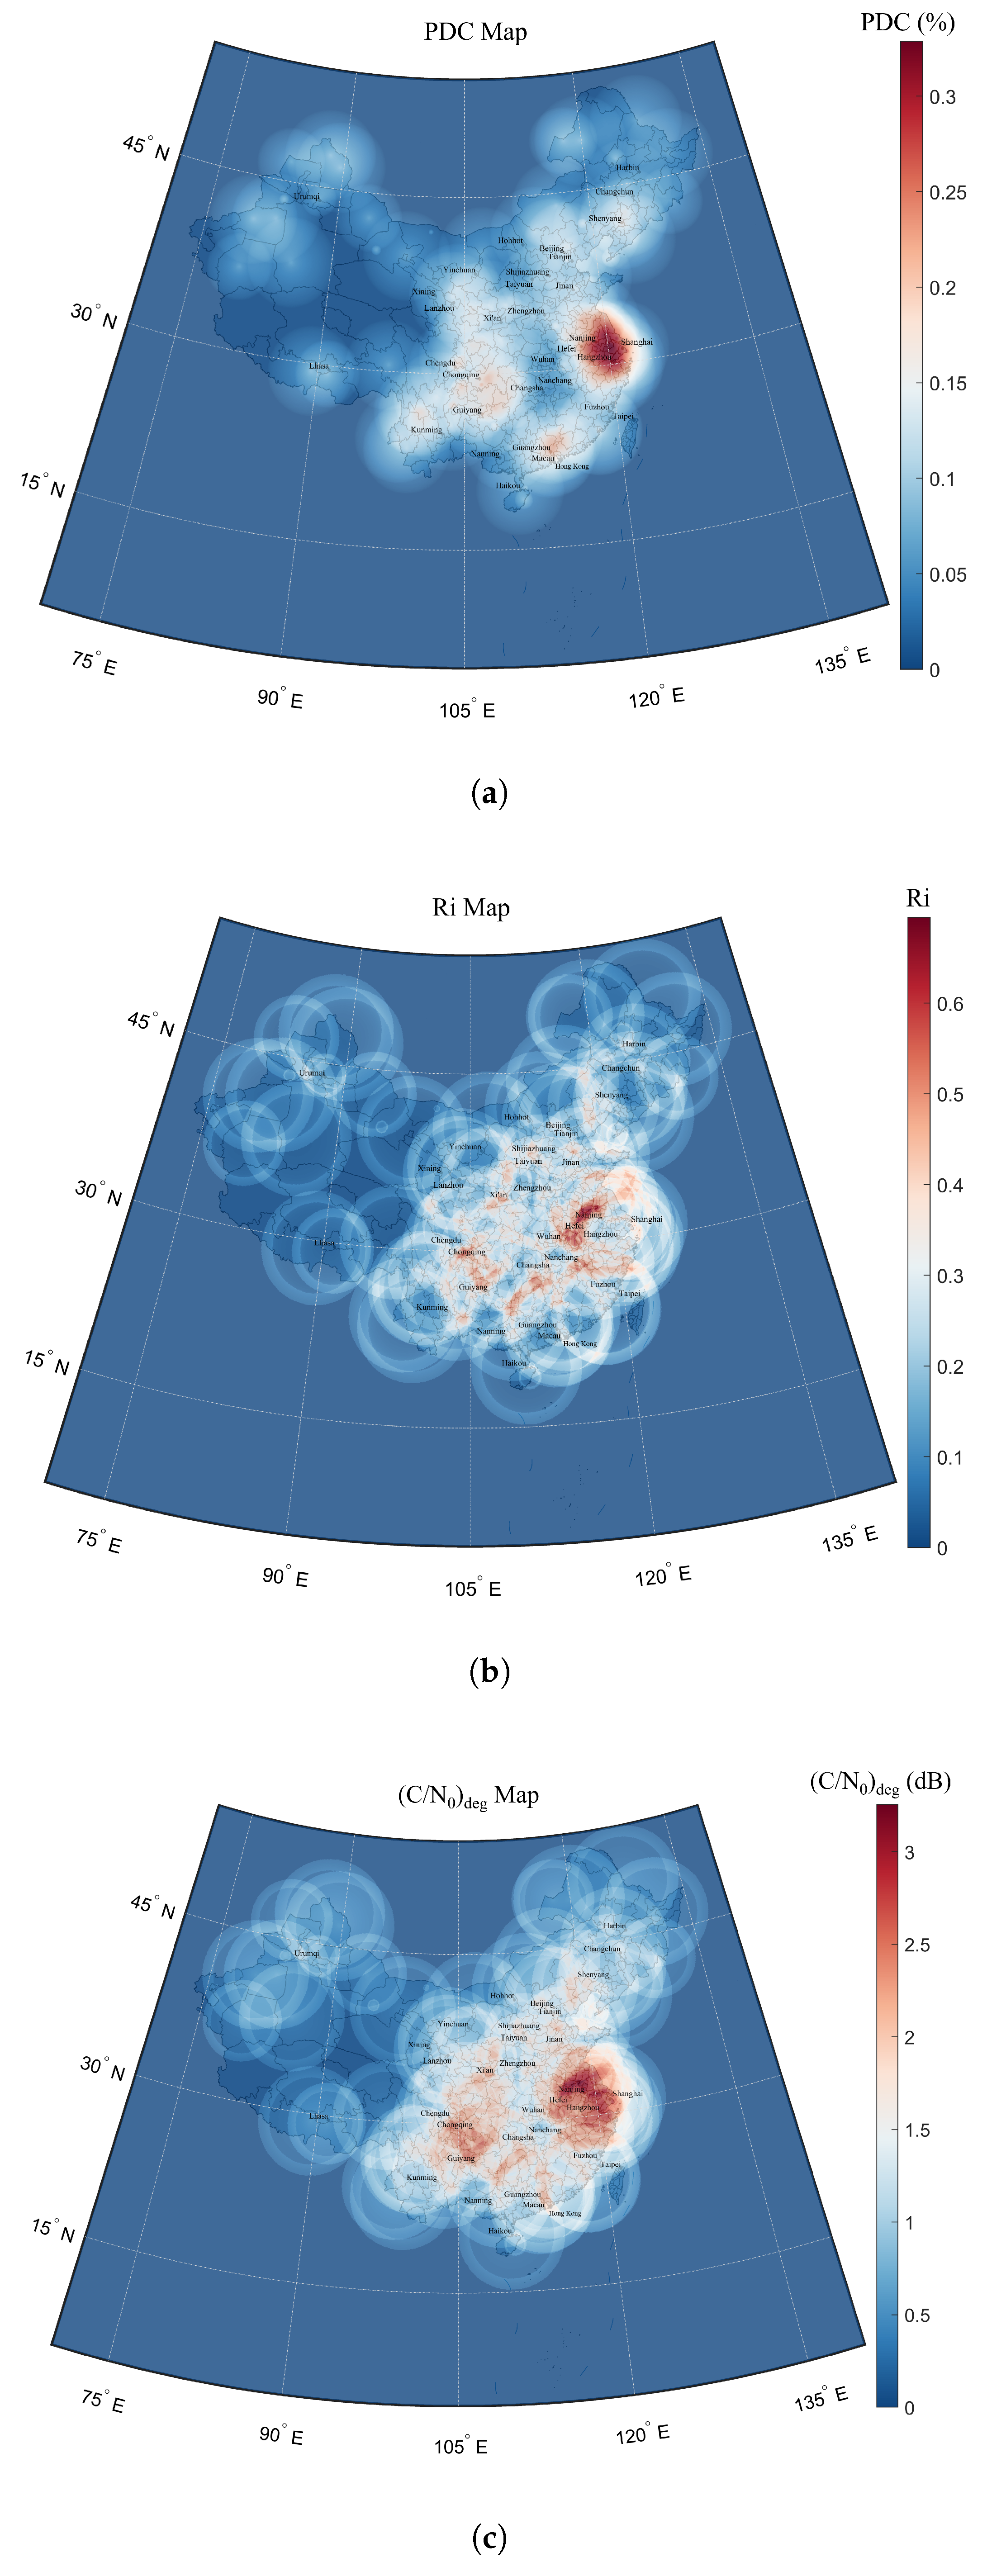
A simulation evaluation platform for the B2a signal reception performance under DME interference was built based on the empirical data from the DME beacon network. The B2a signal reception performance degradation and budget were considered. The platform divides the areas from -to- N latitude and -to- E longitude into 1000 × 1000 grids. For each grid cell, the process begins with budgeting the received power of the DME signal, followed with using the interference evaluation model to calculate the degradation in B2a signal reception performance, and, finally, the heatmap values are then visualized.
Figure 9 shows the spatial distribution of effective degradation for the B2a signal induced by DME beacons across the Chinese mainland at an FL400 altitude, approximately 12,192 meters above standard barometric altitude. The calculations of , and only consider the interference from DME signals, with .
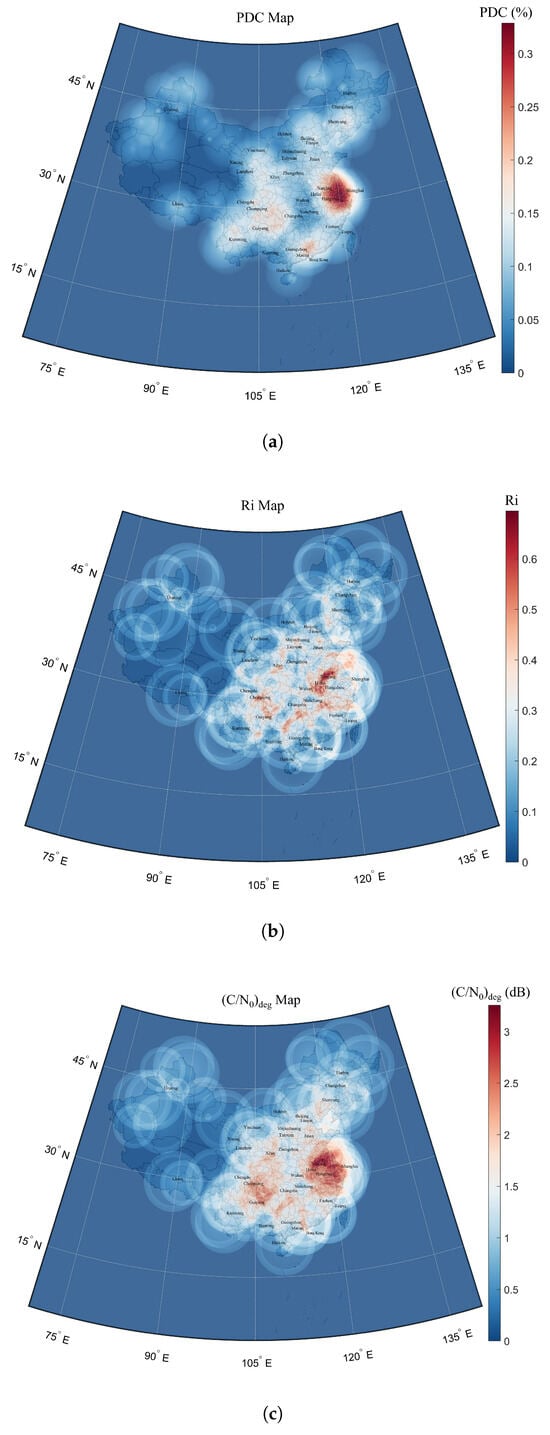
Figure 9.
A heatmap of (a), (b), and (c) degradation at FL400 altitude.
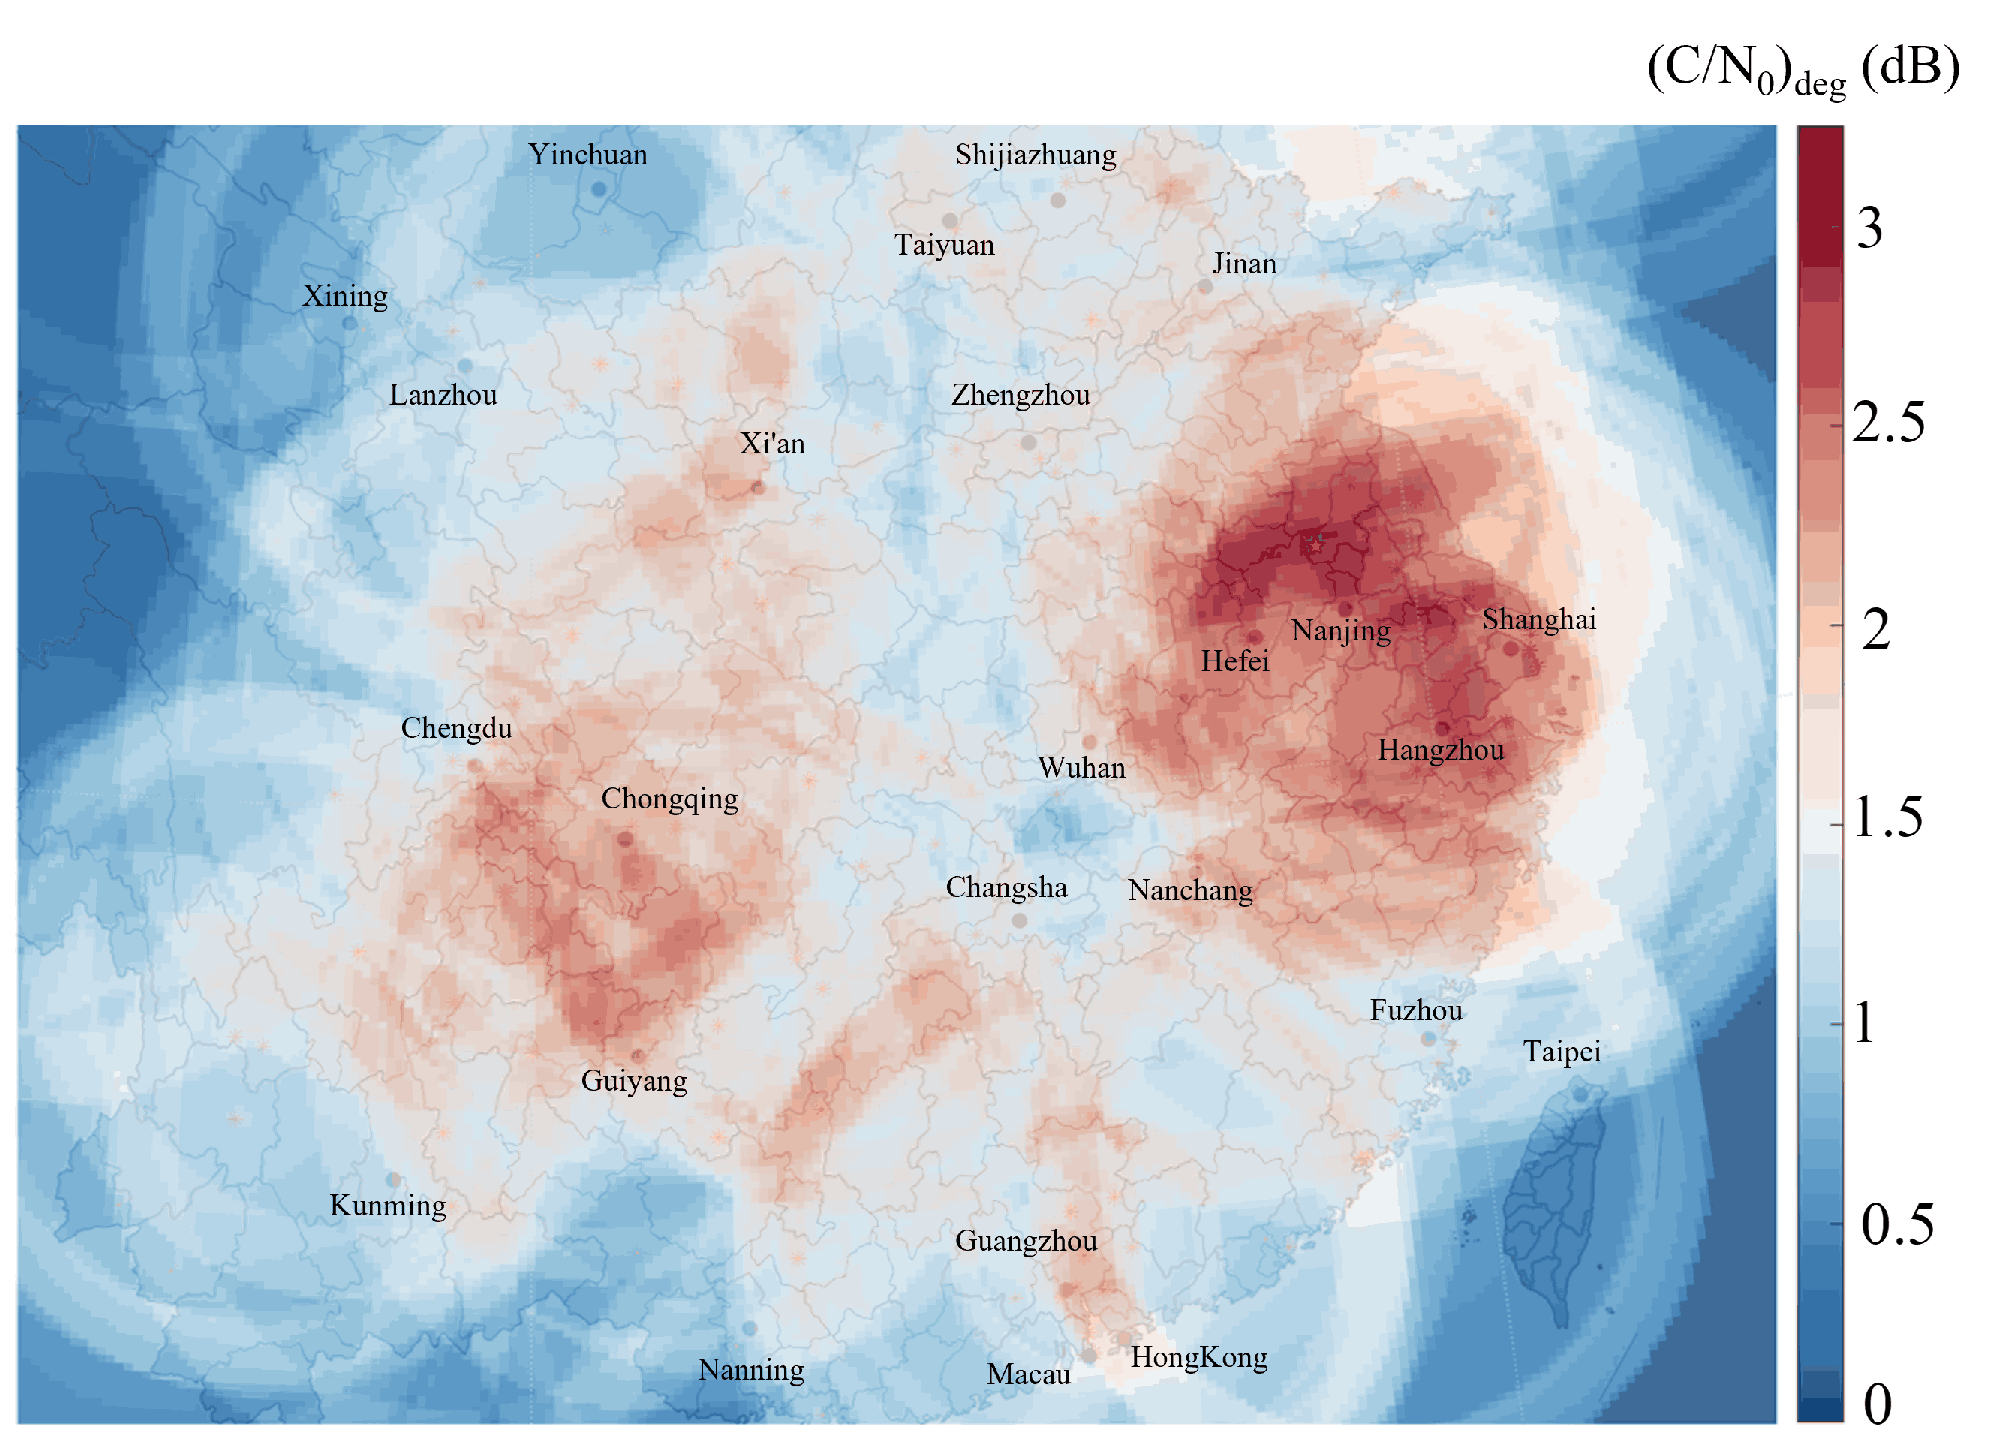
Figure 10 indicates that the most severe effective degradation at FL400 altitude occurs in China’s major aviation hubs, particularly the Yangtze River Delta (e.g., Shanghai, Nanjing, and Hangzhou), the Pearl River Delta (Guangzhou), and the area around Chongqing. These regions exhibit both the high air traffic density and stringent navigation precision requirements, and they are particularly susceptible to significant DME interference. The peak degradation value of 3.25 dB in occurs at N, E (a location proximate to Nanjing, Jiangsu Province). In the worst-case scenario, the airborne antenna can receive signals from up to 17 DME ground beacons. Parameters for several areas experiencing severe interference are presented in Table 2.
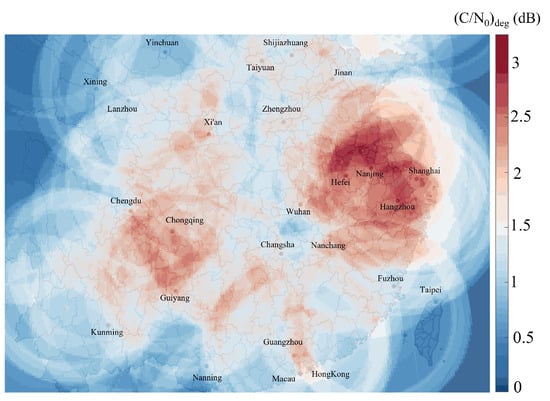
Figure 10.
The DME interference hotspots in the Chinese mainland at FL400 altitude.
Table 2.
The , , and parameters at FL400 altitude in major areas.
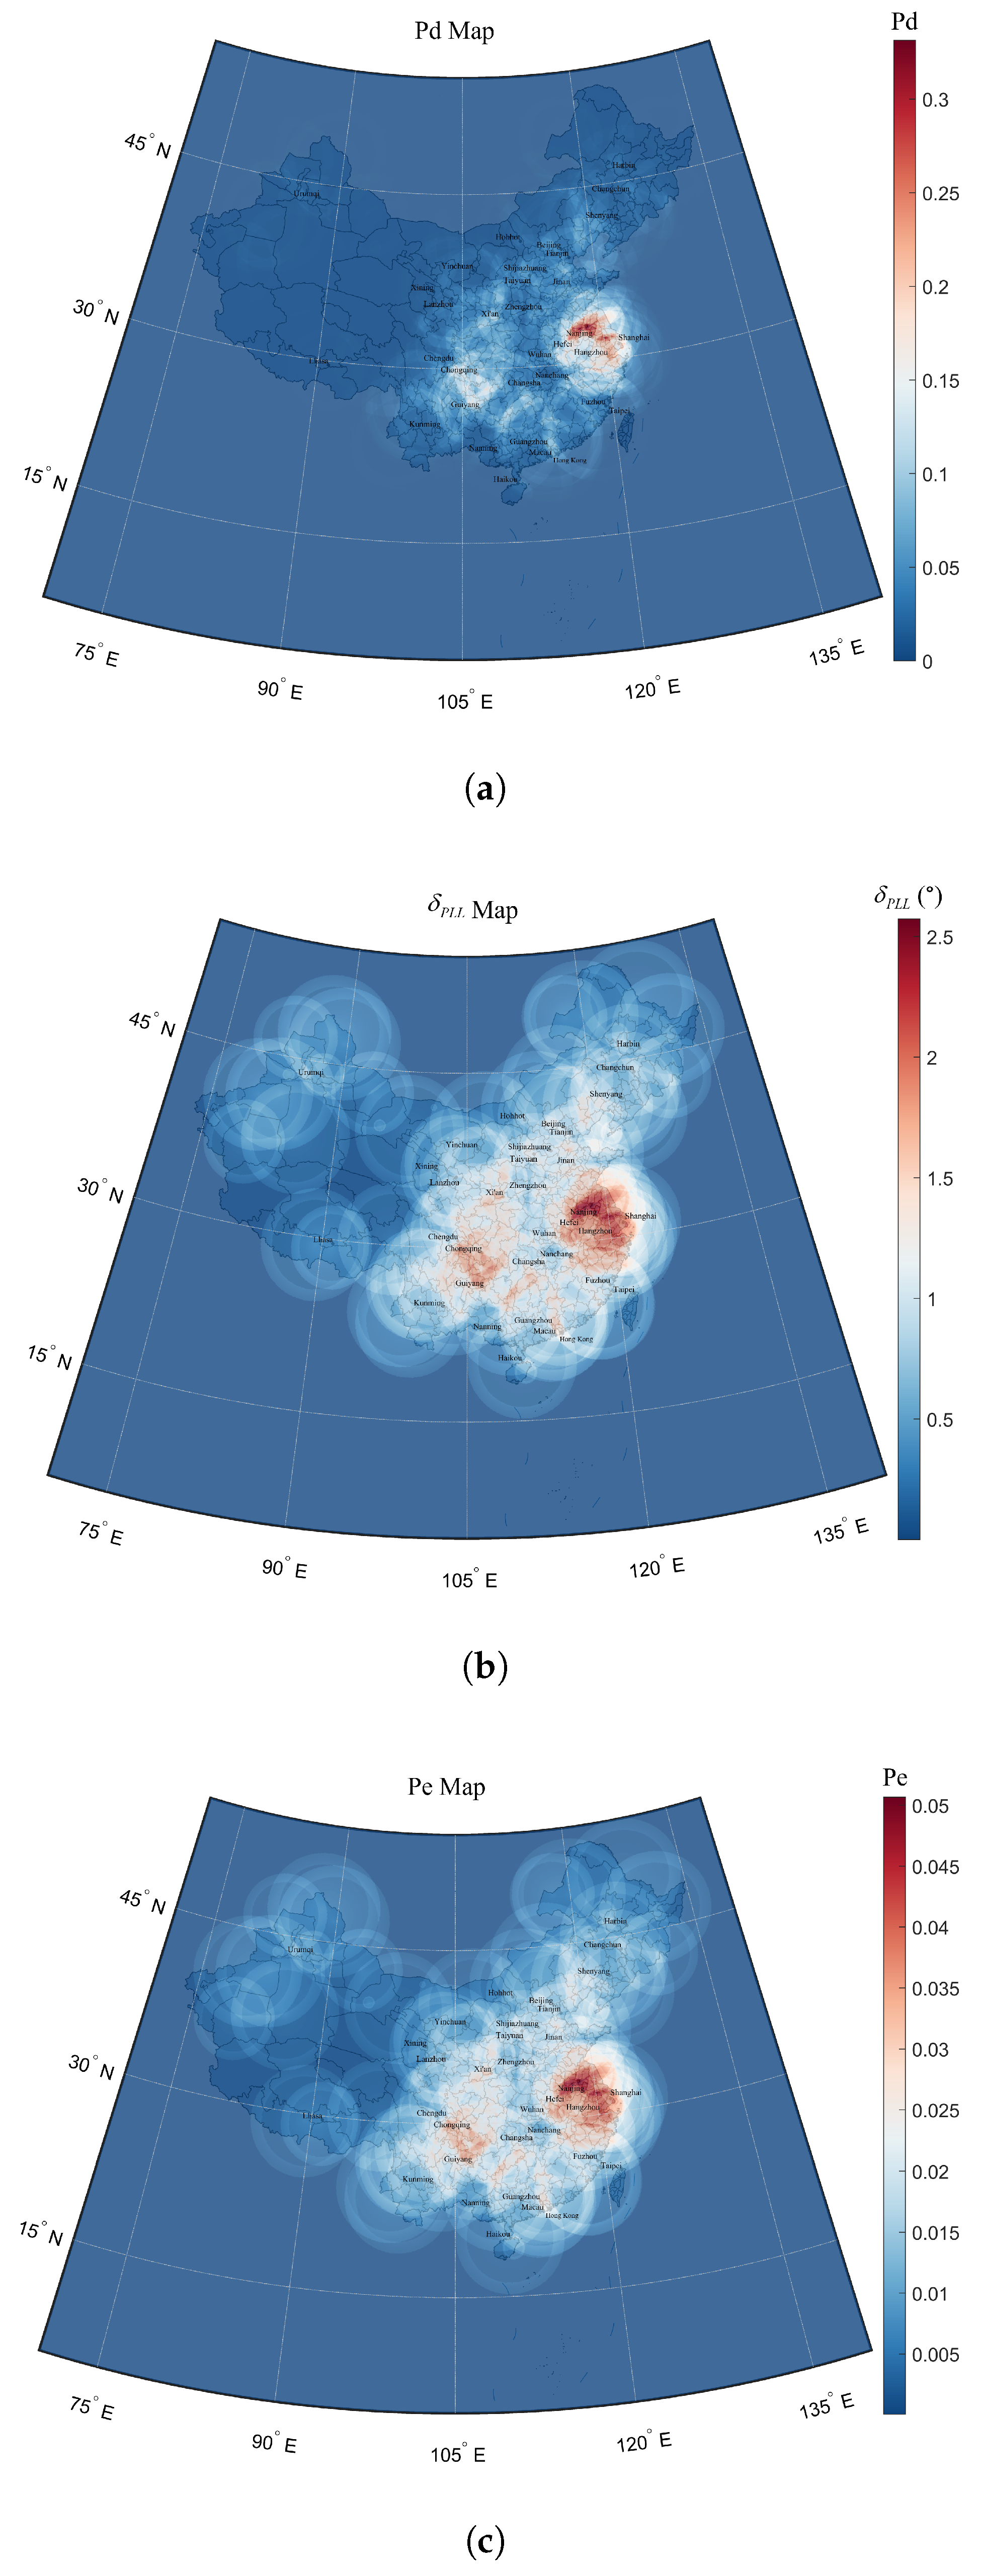
The theoretical at the front end of the B2a receiver is 33.898 without the interference of the DME [17]. Taking into account the caused by DME, the remaining is calculated and can be used for further evaluation of B2a signal reception performance degradation. The pre-detection integration times for the acquisition and tracking phases were set to ms and ms respectively, while the carrier tracking loop integration time for demodulation was set to ms to specify the worst scenario. The results of B2a signal reception performance degradation are shown in Figure 11.

Figure 11.
Heatmap of the B2a signal detection probability (a), carrier tracking error (b), and the demodulation bit error rate (c) degradation at FL400 altitude.
The spatial distribution of the B2a signal reception performance degradation at FL400 altitude strongly correlated with regions exhibiting significant effective degradation. These interference hotspots predominantly coincide with China’s developed regions and busy air traffic zones, where DME ground beacon density reaches high levels. The most severely interfered region was located at N, E (near Nanjing, Jiangsu Province), and it experienced a 33% decrease in signal detection probability, a increase in carrier tracking error, and a 5.1% increase in demodulation bit error rate. Parameters for other severely interfered areas are presented in Table 3.
Table 3.
, , and parameters at the FL400 altitude in major areas.
5. Conclusions
Building upon receiver signal processing principles, this study establishes a comprehensive interference evaluation model capable of quantitatively evaluating B2a signal performance degradation in DME interference scenarios. The model extends the conventional RTCA assessment framework and explicitly formulates the computational method for cumulative interference effects in multi-DME scenarios. The evaluation systematically analyses the interference effects and hotspot distributions through four key metrics: , signal detection probability, carrier tracking accuracy, and demodulation bit error rate (BER). The analysis utilizes empirical data from the DME beacon network in the Chinese mainland combined with an interference budget model.
The evaluation results reveal substantial degradation in the B2a signal reception performance within regions characterized by dense DME beacon deployments. Moreover, interference hotspots show significant overlap with regions that have high air traffic density. Under the worst-case interference conditions, the effective of B2a signal decreases by 3.25 dB, leading to a 33% reduction in signal detection probability, a increase in carrier tracking error, and a 5.1% increase in demodulation bit error rate. The degradation in navigation signal reception performance adversely impacts the accuracy, availability, continuity, and integrity of the navigation system, jeopardizing the flight safety of civil aviation aircraft. Furthermore, the hotspot mapping evaluation method proposed in this study is also applicable to assessing the interference effects of other L-band signals (e.g., TACAN, JTIDS/MIDS, and ADS-B) on the BeiDou navigation system.
Author Contributions
Conceptualization, Y.L. and J.C.; methodology, Y.L.; software, Z.M.; validation, J.C., Z.M. and Z.D.; formal analysis, Y.L. and Z.M.; investigation, Y.L. and J.C.; resources, Z.M.; data curation, Z.D.; writing—original draft preparation, J.C.; writing—review and editing, Y.L. and Z.M.; visualization, Z.M. and J.C.; supervision, Z.D.; project administration, Y.L. All authors have read and agreed to the published version of the manuscript.
Funding
This research was funded by the Civil Aviation Administration of China (contract no. 61 (2023)).
Institutional Review Board Statement
Not applicable.
Informed Consent Statement
Not applicable.
Data Availability Statement
The data presented in this study are available on request from the corresponding authors.
Conflicts of Interest
The authors declare no conflicts of interest.
References
- Sokolova, N.; Morrison, A.; Diez, A. Characterization of the GNSS RFI Threat to DFMC GBAS Signal Bands. Sensors 2022, 22, 8587. [Google Scholar] [CrossRef] [PubMed]
- Wu, Q. A two-fault detection and elimination approach to the receiver autonomous integrity monitoring. GPS Solut. 2024, 28, 160. [Google Scholar] [CrossRef]
- Setlak, L.; Kowalik, R. Study and Analysis of Interference Signals of the LTE System of the GNSS Receiver. Sensors 2021, 21, 4901. [Google Scholar] [CrossRef] [PubMed]
- Bai, Y. Research on GNSS Space Signal Interference Evaluation and Mitigation Methods. Ph.D. Thesis, University of Chinese Academy of Sciences, Beijing, China, 2014. [Google Scholar]
- Radoš, K.; Brkić, M.; Begušić, D. Recent advances on jamming and spoofing detection in GNSS. Sensors 2024, 24, 4210. [Google Scholar] [CrossRef] [PubMed]
- China Satellite Navigation Office. BeiDou Navigation Satellite System Space Signal Interface Control File Public Service Signal B2a (Version 1.0); China Satellite Navigation Office: Beijing, China, 2017. [Google Scholar]
- International Civil Aviation Organization. Annex 10—Aeronautical Telecommunications—Volume I—Radio Navigational Aids; ICAO: Montreal, QC, Canada, 2018. [Google Scholar]
- Hegarty, C.; Kim, T.; Ericson, S.; Reddan, P.; Morrissey, T.; Van Dierendonck, A. Methodology for determining compatibility of GPS L5 with existing systems and preliminary results. In Proceedings of the 55th Annual Meeting of The Institute of Navigation (1999), Cambridge, MA, USA, 27–30 June 1999; pp. 635–644. [Google Scholar]
- Tran, M.; Kim, T.; Hegarty, C.J.; Devincentis, J.; Ericson, S.D. Validation of the Feasibility of Coexistence of the New Civil GPS Signal (L5) with Existing Systems; Technical Report, Project No. 02011103-03; The MITRE Corporation: McLean, VA, USA, 2001. [Google Scholar]
- Gault, N.; Chabory, A.; Garcia-Pena, A.; Macabiau, C. DME/TACAN Multipath Impact on GNSS L5/E5a Airborne Receivers Part II: Air-Ground Channel Model and Application. IEEE Trans. Aerosp. Electron. Syst. 2024, 60, 6765–6786. [Google Scholar] [CrossRef]
- Lestarquit, L.; Dulery, C.; Prévost, R.; Iervolino, M. Mitigation of TACAN/DME Interferences for L5/E5 Space-borne GNSS Receivers in LEO. First Simulation Results with Focus on Radio-Occultation Missions. In Proceedings of the NAVITEC 2022, ESA/ESTEC, Noordwijk, The Netherlands, 5–7 April 2022. [Google Scholar]
- Kim, T.; Grabowski, J. Validation of GPS L5 coexistence with DME/TACAN and link-16 systems. In Proceedings of the 16th International Technical Meeting of the Satellite Division of the Institute of Navigation (ION GPS/GNSS 2003), Portland, OR, USA, 9–12 September 2003; pp. 1455–1469. [Google Scholar]
- DO-292; Assessment of Radio Frequency Interference Relevant to the GNSS L5/E5A Frequency Band. RTCA, Inc.: Washington, DC, USA, 20 July 2004.
- Garcia-Pena, A.; Macabiau, C.; Novella, G.; Julien, O.; Mabilleau, M.; Durel, P. RFI GNSS L5/E5a Mask Derivation. In Proceedings of the 33rd International Technical Meeting of the Satellite Division of The Institute of Navigation (ION GNSS+ 2020), Online, 22–25 September 2020; pp. 188–205. [Google Scholar]
- Garcia-Pena, A.; Macabiau, C.; Julien, O.; Mabilleau, M.; Durel, P. Impact of DME/TACAN on GNSS L5/E5a receiver. In Proceedings of the 2020 International Technical Meeting of The Institute of Navigation, San Diego, CA, USA, 21–24 January 2020; pp. 207–221. [Google Scholar]
- Wang, Y.; Jia, Q.; Guo, K.; Wang, Z.; Zhu, Y. Evaluation of the Effects of the DME Beacons on BDS B2a Signals in China Hotspots. In Proceedings of the 2023 International Technical Meeting of The Institute of Navigation, Long Beach, CA, USA, 24–26 January 2023; pp. 385–398. [Google Scholar]
- Liu, Y.; Fang, K.; Dan, Z.; Zhu, Y.; Wang, Z. Research on the Impact of DME on the Integrity of BDS B2a Signal. In Proceedings of the 36th International Technical Meeting of the Satellite Division of The Institute of Navigation (ION GNSS+ 2023), Denver, CO, USA, 11–15 September 2023; pp. 1890–1904. [Google Scholar]
- Zhang, J.M.; Xu, F.; Li, S.C. The Interference Analysis and Evaluation of DME to BeiDou-3/B2a. In Proceedings of the China Satellite Navigation Conference, Jinan, China, 22–24 May 2024; Springer: Berlin/Heidelberg, Germany, 2024; pp. 305–321. [Google Scholar]
- Garcia-Pena, A.; Julien, O.; Macabiau, C.; Mabilleau, M.; Durel, P. GNSS degradation model in presence of continuous wave and pulsed interference. Navigation 2021, 68, 75–91. [Google Scholar] [CrossRef]
- Anyaegbu, E.; Brodin, G.; Cooper, J.; Aguado, E.; Boussakta, S. An integrated pulsed interference mitigation for GNSS receivers. J. Navig. 2008, 61, 239–255. [Google Scholar] [CrossRef]
- Huang, X. Research on GNSS Radio Frequency Compatibility and the Impact of High-Power Amplifier Nonlinear Effects. PhD Thesis, Huazhong University of Science and Technology, Wuhan, China, 2009. [Google Scholar]
- Guo, H.; Lu, Z.; Chen, F.; Liu, X.; Zhuang, Z. Impact of Narrowband and Pulse Interference on Carrier-to-Noise Ratio of Satellite Navigation Signals. GNSS World China 2021, 46, 50–56. [Google Scholar]
- Garcia-Pena, A.; Julien, O.; Gakne, P.V.; Macabiau, C.; Mabilleau, M.; Durel, P. Efficient DME/TACAN blanking method for GNSS-based navigation in civil aviation. In Proceedings of the 32nd International Technical Meeting of the Satellite Division of The Institute of Navigation (ION GNSS+ 2019), Miami, FL, USA, 16–20 September 2019; pp. 1438–1452. [Google Scholar]
- Garcia-Pena, A.; Macabiau, C.; Ashley, J.; Baraban, D.; Durel, P.; Mabilleau, M. Model and observation of the impact of JTIDS/MIDS on GNSS C/N0 degradation. In Proceedings of the 2020 IEEE/ION Position, Location and Navigation Symposium (PLANS), Portland, OR, USA, 20–23 April 2020; IEEE: Piscataway, NJ, USA, 2020; pp. 584–595. [Google Scholar]
- Garcia-Pena, A.; Novella, G.; Macabiau, C. C/N0 degradation in presence of chirp interference: Statistical, real and estimated C/N0. GPS Solut. 2024, 28, 197. [Google Scholar] [CrossRef]
- Novella, G.; Garcia-Pena, A.; Macabiau, C. C/N0 degradation in presence of chirp interference: Theoretical model. GPS Solut. 2024, 28, 161. [Google Scholar] [CrossRef]
- Deng, X.; Lyu, Z.; Zhou, W.; Ke, Y. Design of GNSS Spoofing Detection Algorithm Using Carrier-to-Noise Ratio. J. Navig. Position. 2022, 10, 109–118. [Google Scholar]
- Razavi, A.; Gebre-Egziabher, D.; Akos, D.M. Carrier loop architectures for tracking weak GPS signals. IEEE Trans. Aerosp. Electron. Syst. 2008, 44, 697–710. [Google Scholar] [CrossRef]
- Pany, T. Navigation Signal Processing for GNSS Software Receivers; Artech House: Norwood, MA, USA, 2010. [Google Scholar]
- ITU-R. Calculation Method to Determine Aggregate Interference Parameters of Pulsed RF Systems Operating in and Near the Bands 1164–1215 MHz and 1215–1300 MHz That May Impact Radio Navigation-Satellite Service Airborne and Ground-Based Receivers Operating in Those Frequency Bands; Technical Report; International Telecommunication Union, Radiocommunication Sector (ITU-R): Geneva, Switzerland, 2021. [Google Scholar]
Disclaimer/Publisher’s Note: The statements, opinions and data contained in all publications are solely those of the individual author(s) and contributor(s) and not of MDPI and/or the editor(s). MDPI and/or the editor(s) disclaim responsibility for any injury to people or property resulting from any ideas, methods, instructions or products referred to in the content. |
© 2025 by the authors. Licensee MDPI, Basel, Switzerland. This article is an open access article distributed under the terms and conditions of the Creative Commons Attribution (CC BY) license (https://creativecommons.org/licenses/by/4.0/).