
Estimating Speed Error of Commercial Radar Tracking to Inform Whale–Ship Strike Mitigation Efforts


Abstract
1. Introduction
Related Work
2. Materials and Methods
2.1. Data Collection
2.1.1. Radar
2.1.2. AIS
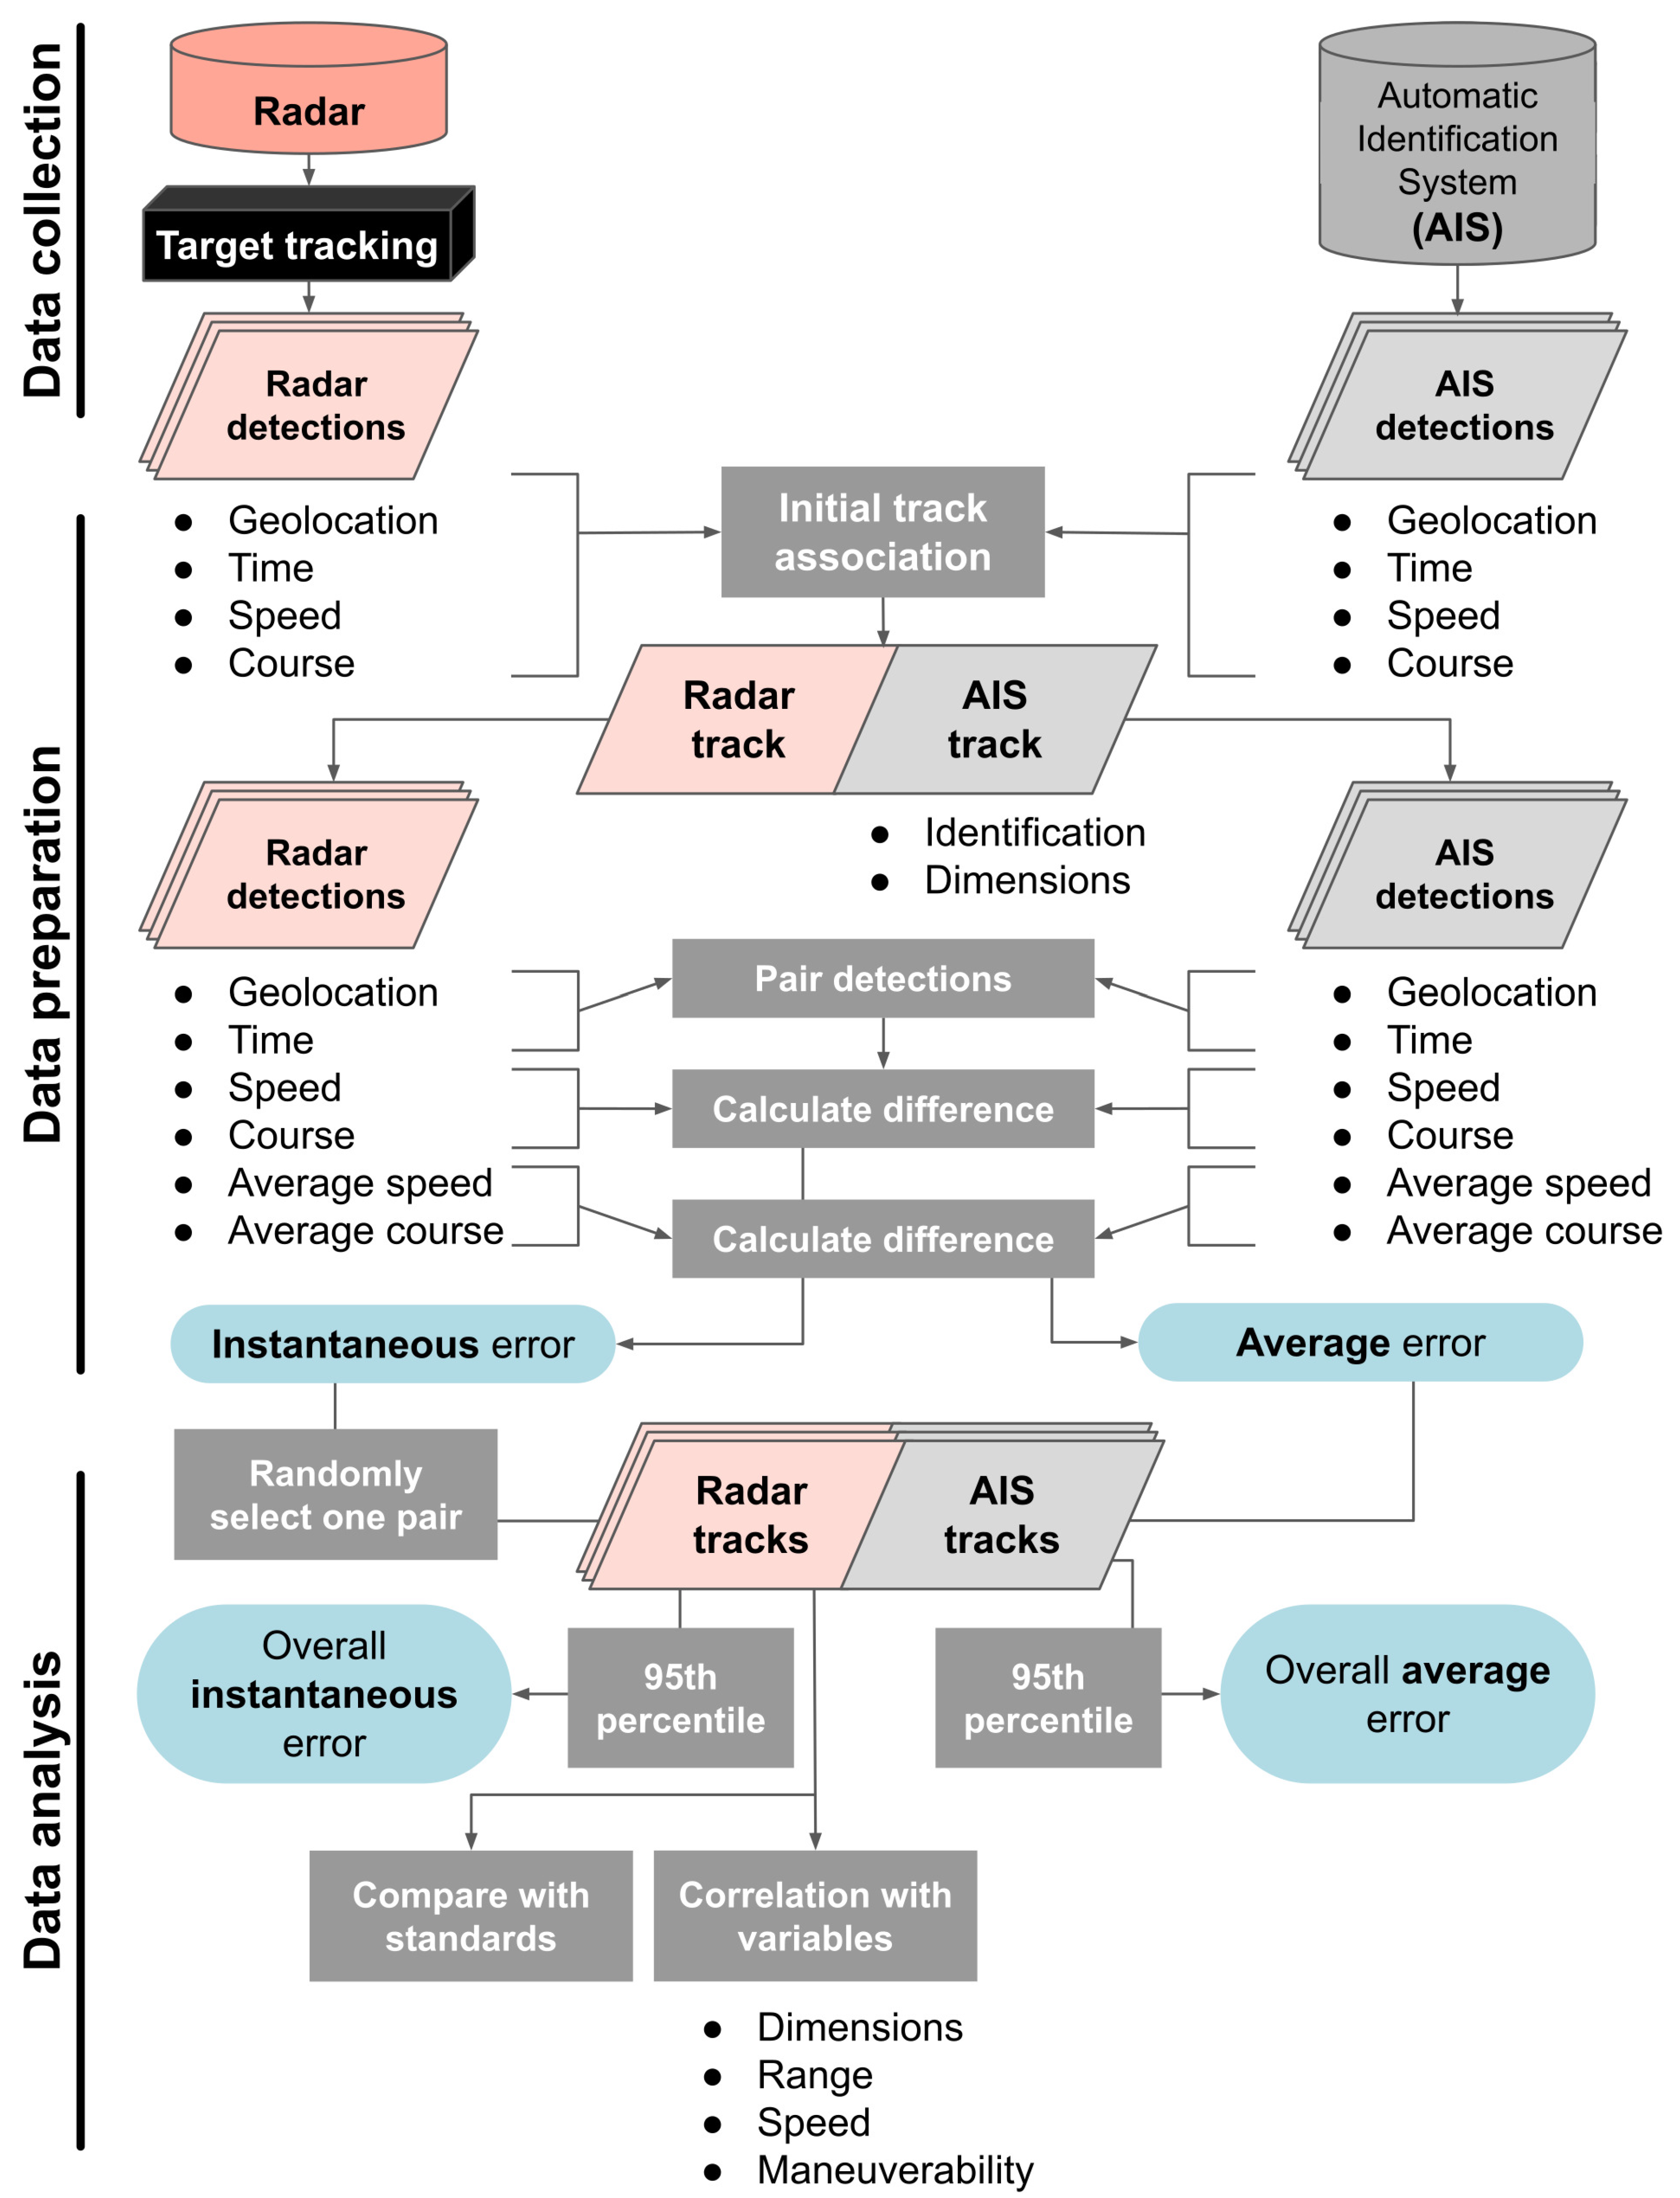
2.2. Data Preparation
2.2.1. Radar and AIS Track Association
- detections are within 100 m in geolocation;
- detected within 15 s;
- difference in SOG of less than 1.5 knots (0.77 m/s); and
- difference in COG of less than 10 degrees.

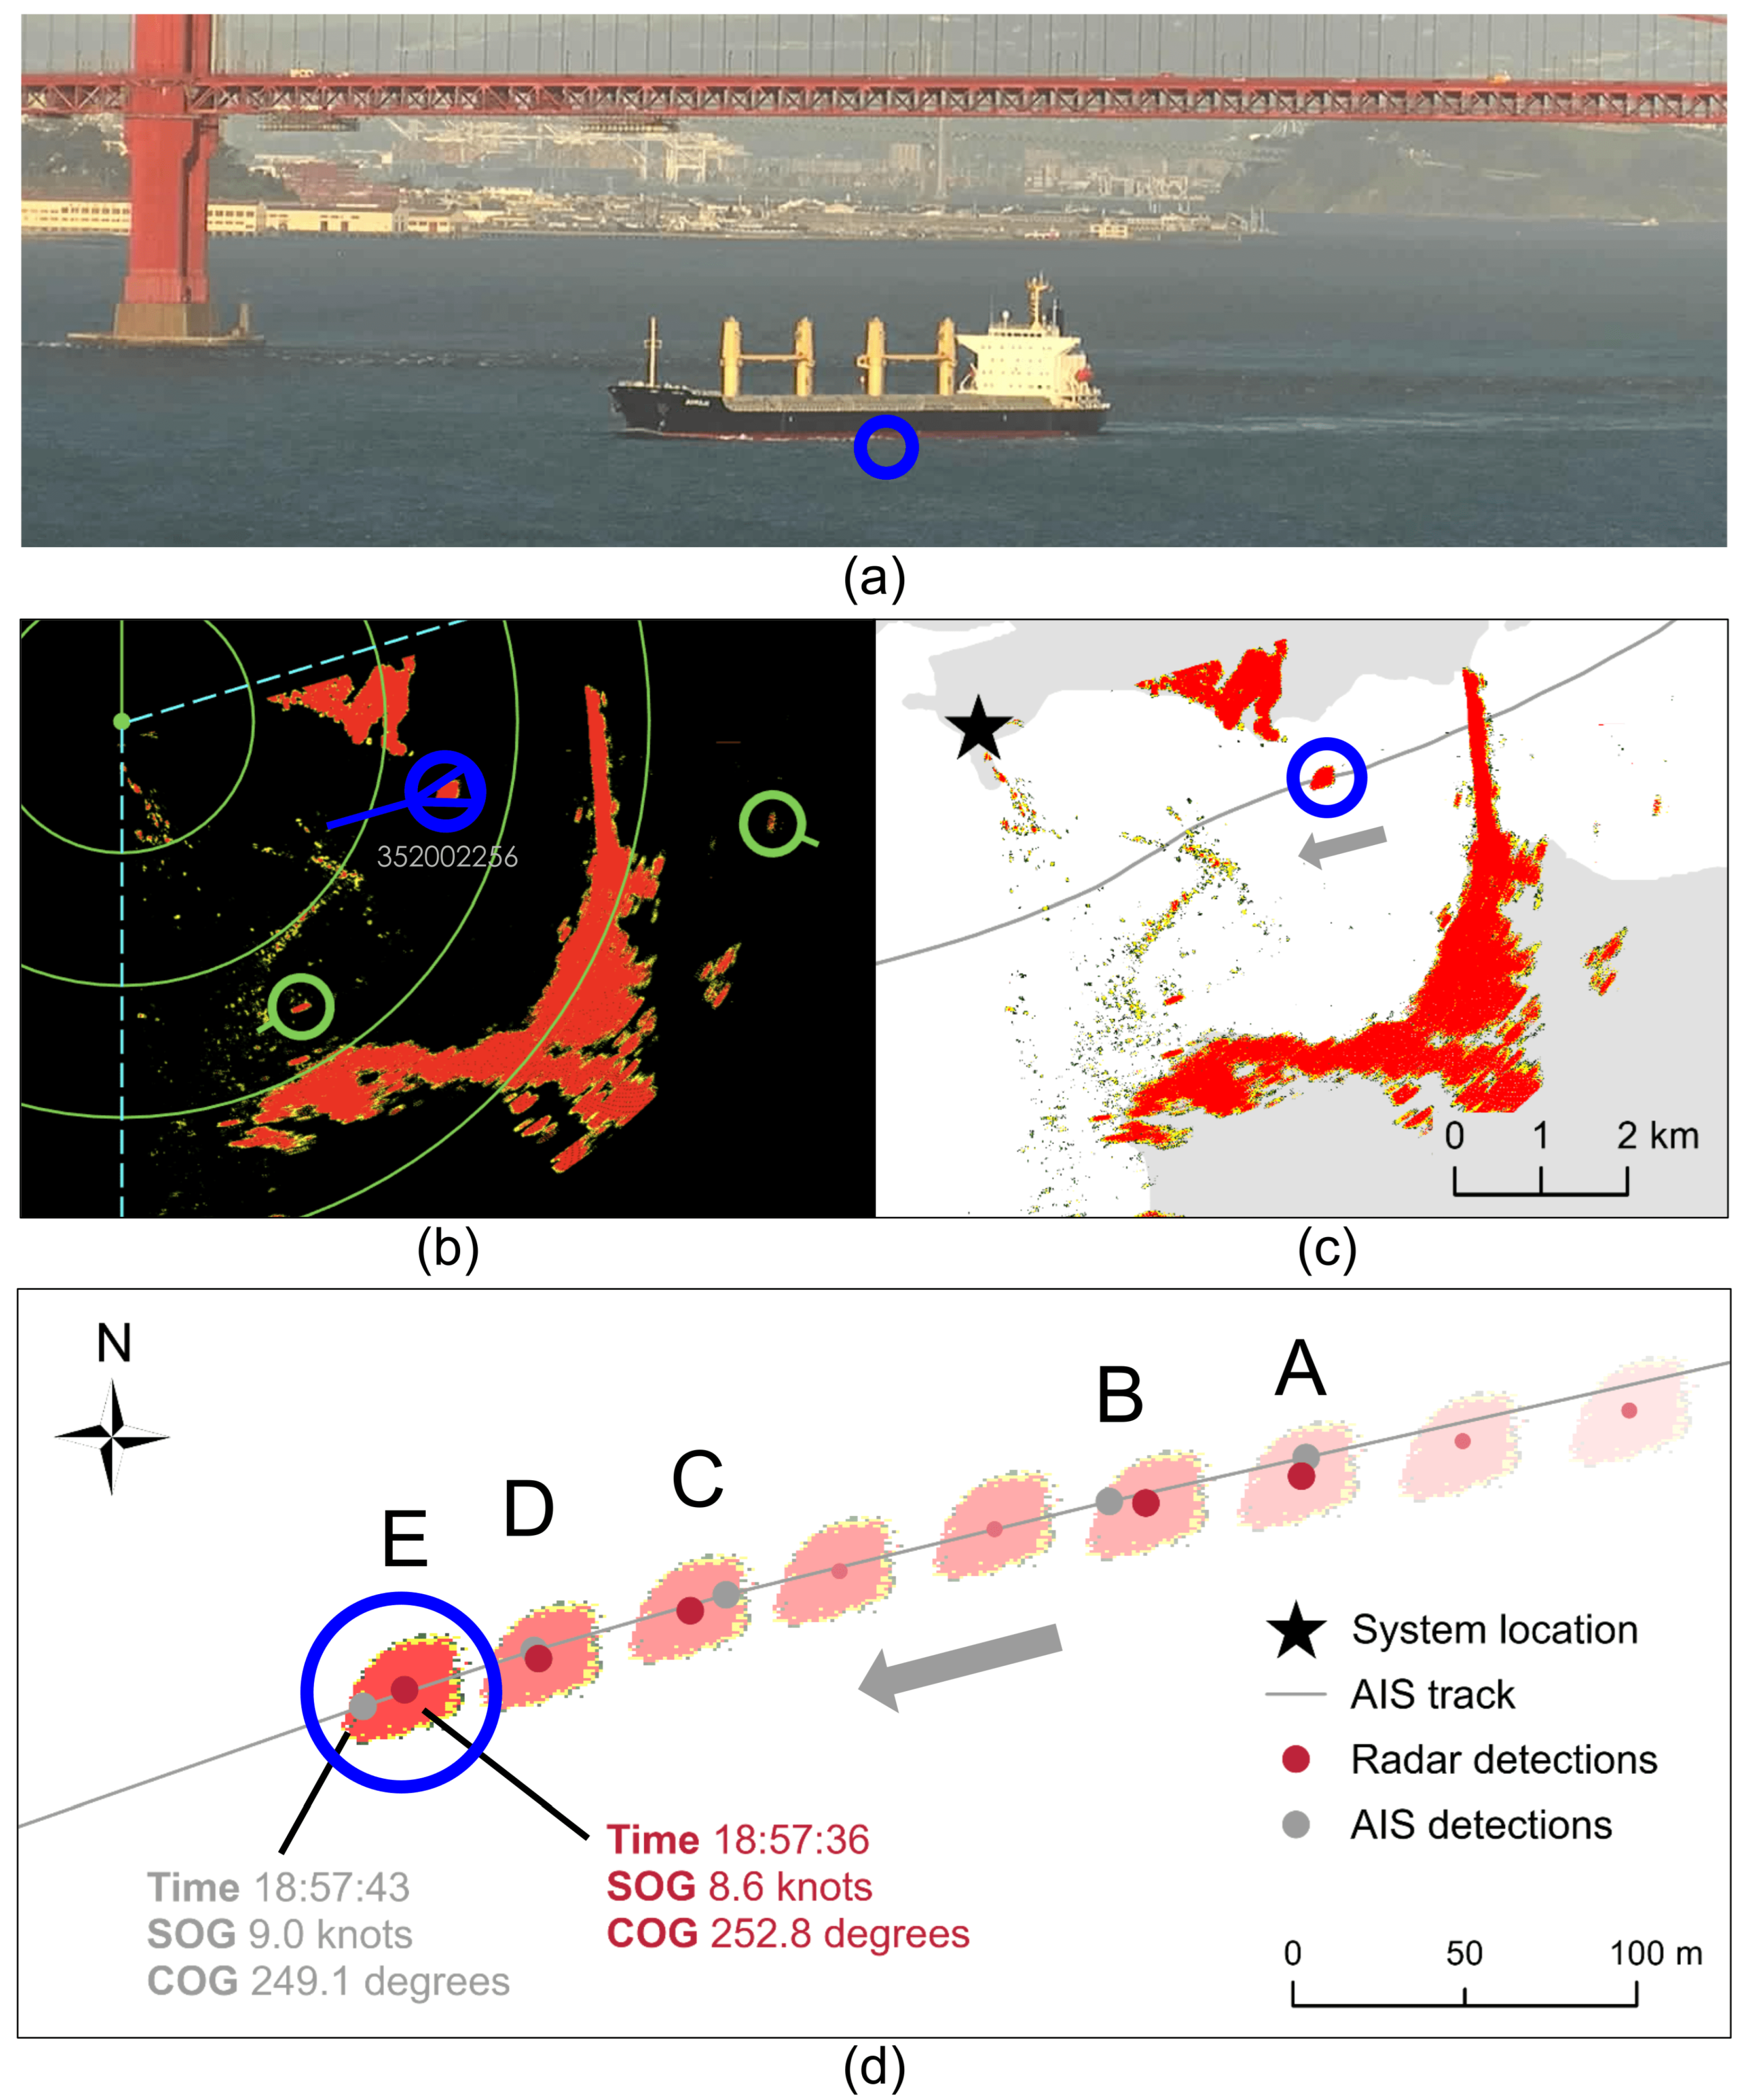
| Track Number | Latitude (Decimal Degrees) | Longitude (Decimal Degrees) | Time | SOG (Knots) | COG (Degrees) |
|---|---|---|---|---|---|
| 26810252 | 37.815915 | −122.493363 | 18:56:32 | 8.7 | 254.6 |
| 26810252 | 37.815835 | −122.493798 | 18:56:40 | 9.0 | 255.1 |
| 26810252 A | 37.815743 | −122.494220 | 18:56:48 | 8.9 | 255.2 |
| 26809029 A | 37.815792 | −122.494208 | 18:56:54 | 9.0 | 254.0 |
| 26810252 B | 37.815673 | −122.494627 | 18:56:56 | 8.9 | 255.8 |
| 26809029 B | 37.815677 | −122.494722 | 18:57:03 | 9.1 | 254.2 |
| 26810252 | 37.815605 | −122.495022 | 18:57:05 | 8.8 | 256.2 |
| 26810252 | 37.815495 | −122.495427 | 18:57:13 | 8.9 | 254.8 |
| 26810252 C | 37.815392 | −122.495817 | 18:57:20 | 8.9 | 253.9 |
| 26809029 C | 37.815433 | −122.495723 | 18:57:23 | 9.1 | 253.1 |
| 26810252 D | 37.815267 | −122.496213 | 18:57:28 | 9.0 | 252.2 |
| 26809029 D | 37.815288 | −122.496225 | 18:57:34 | 9.1 | 250.8 |
| 26810252 E | 37.815185 | −122.496563 | 18:57:36 | 8.6 | 252.8 |
| 26809029 E | 37.815142 | −122.496672 | 18:57:43 | 9.0 | 249.1 |
2.2.2. Radar and AIS Detection Pairing
2.3. Data Analysis
2.3.1. Error Calculations
2.3.2. Comparison with Standards
2.3.3. Correlation with Variables
3. Results
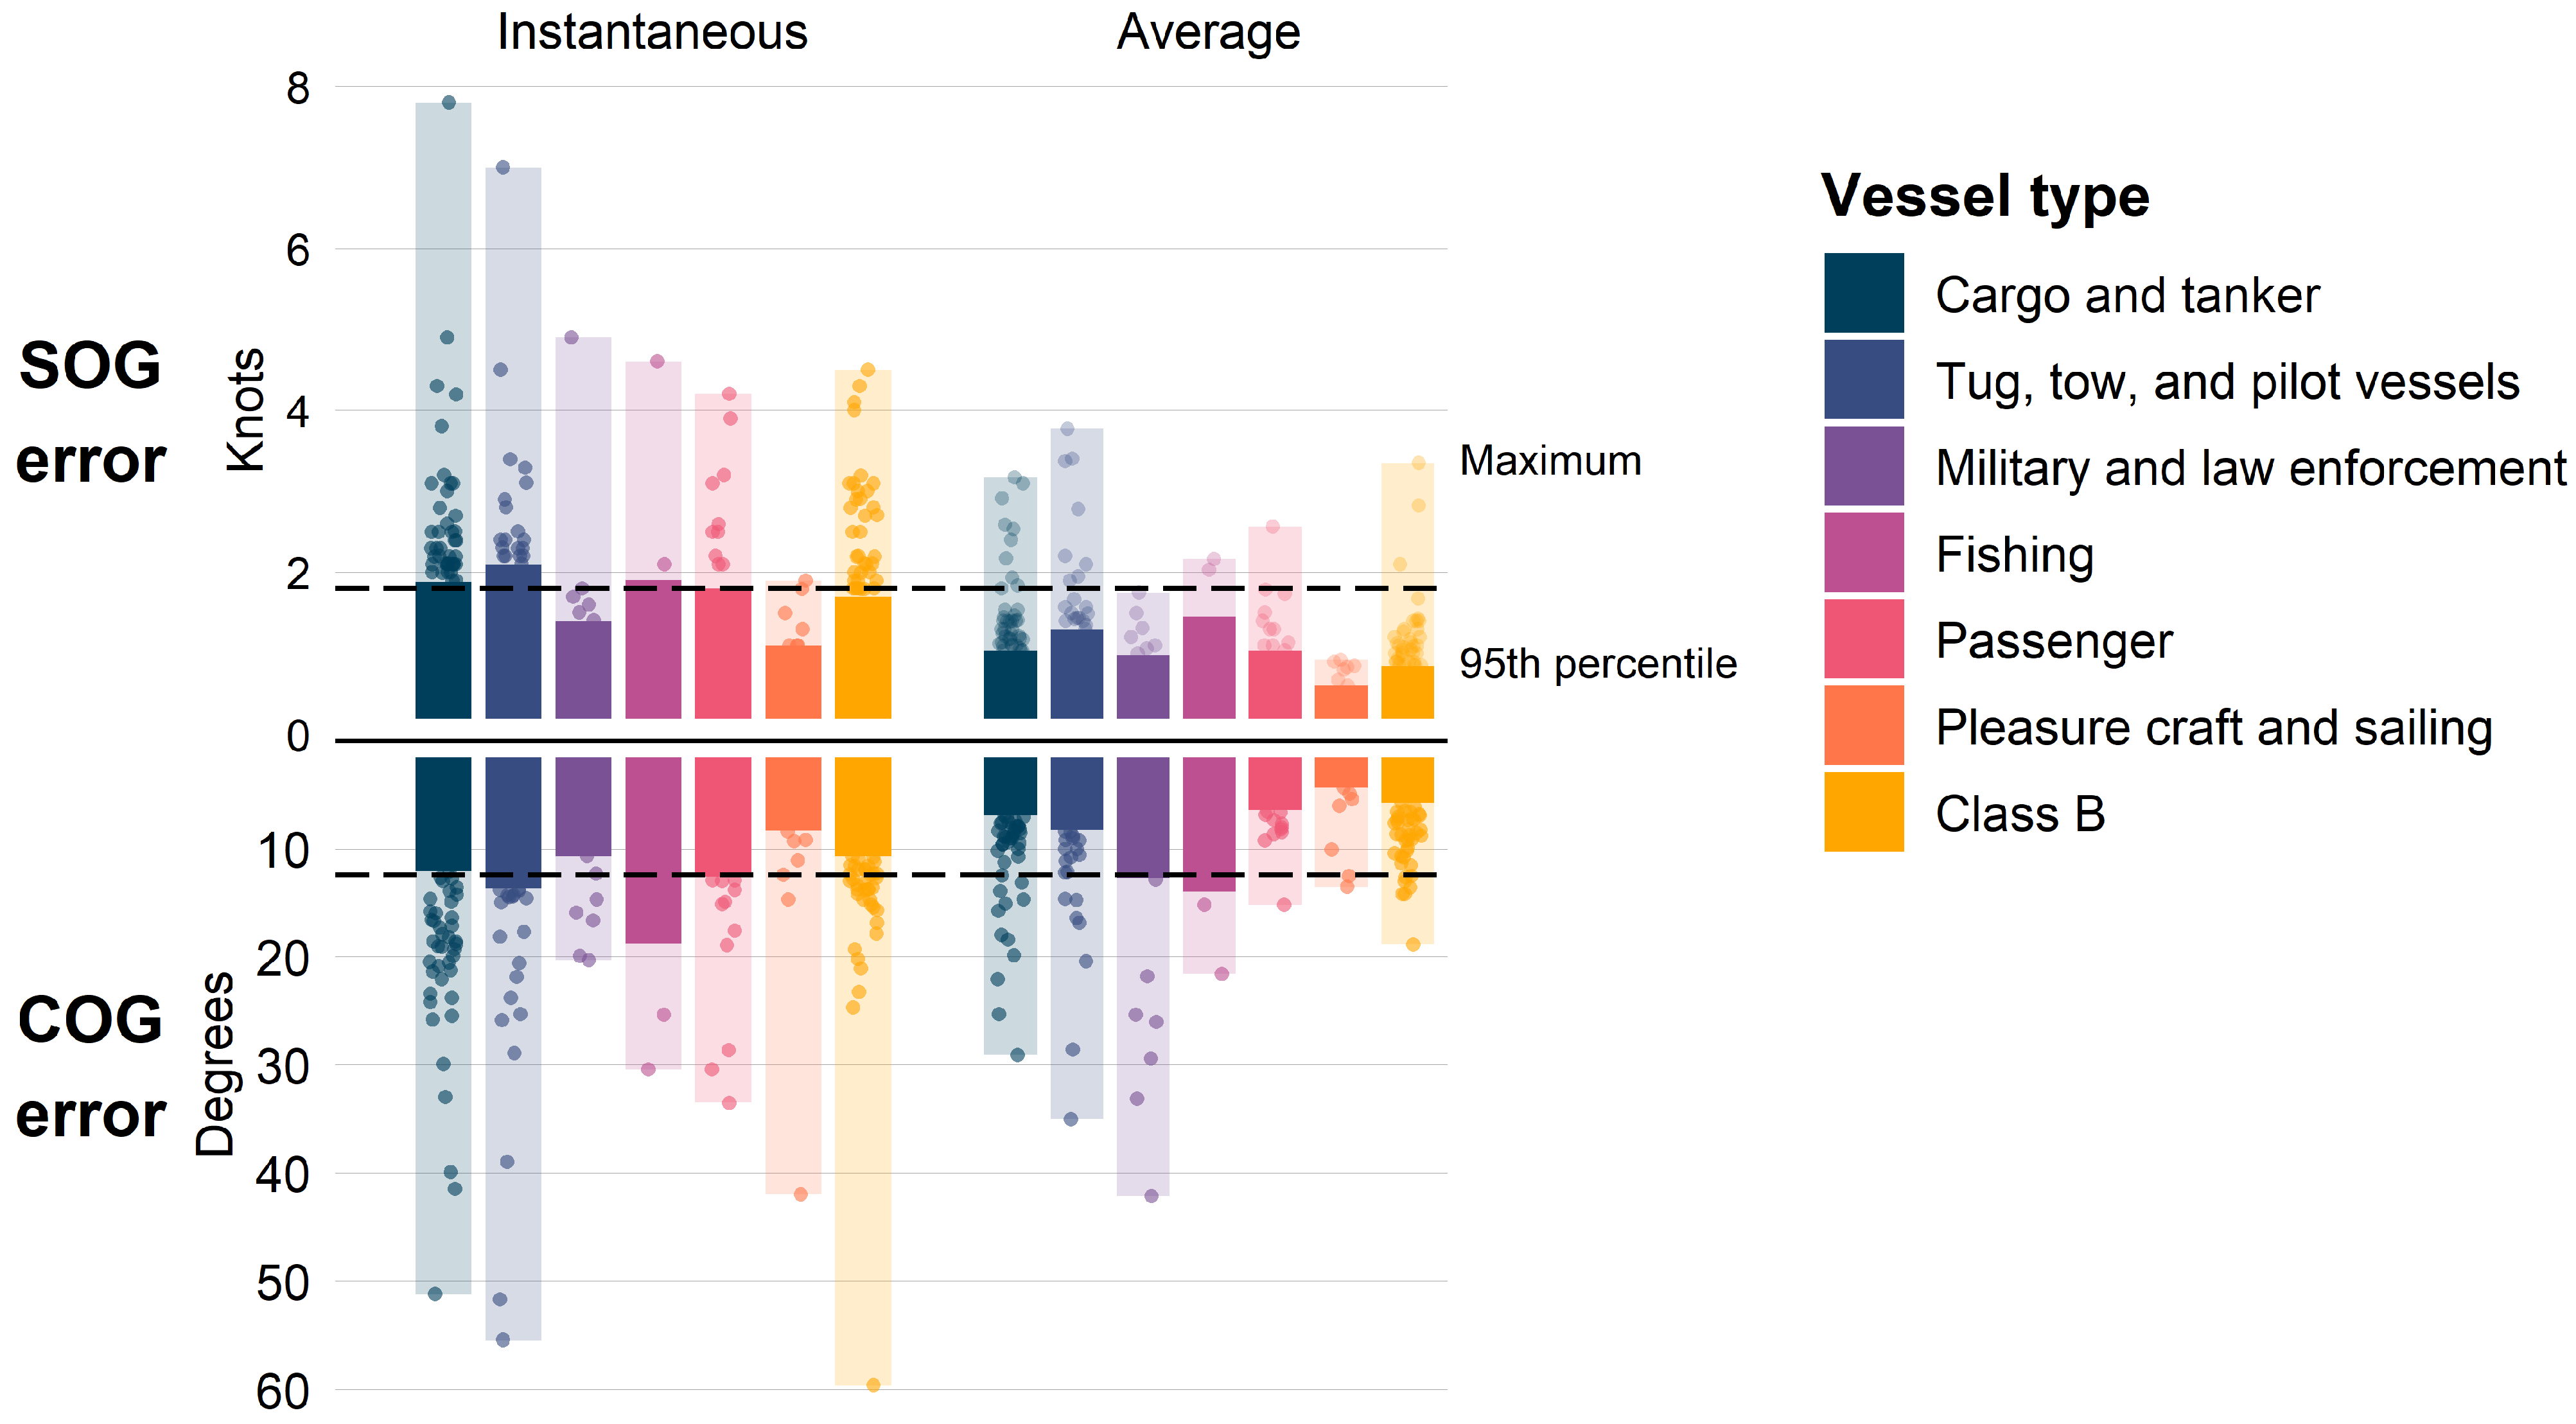
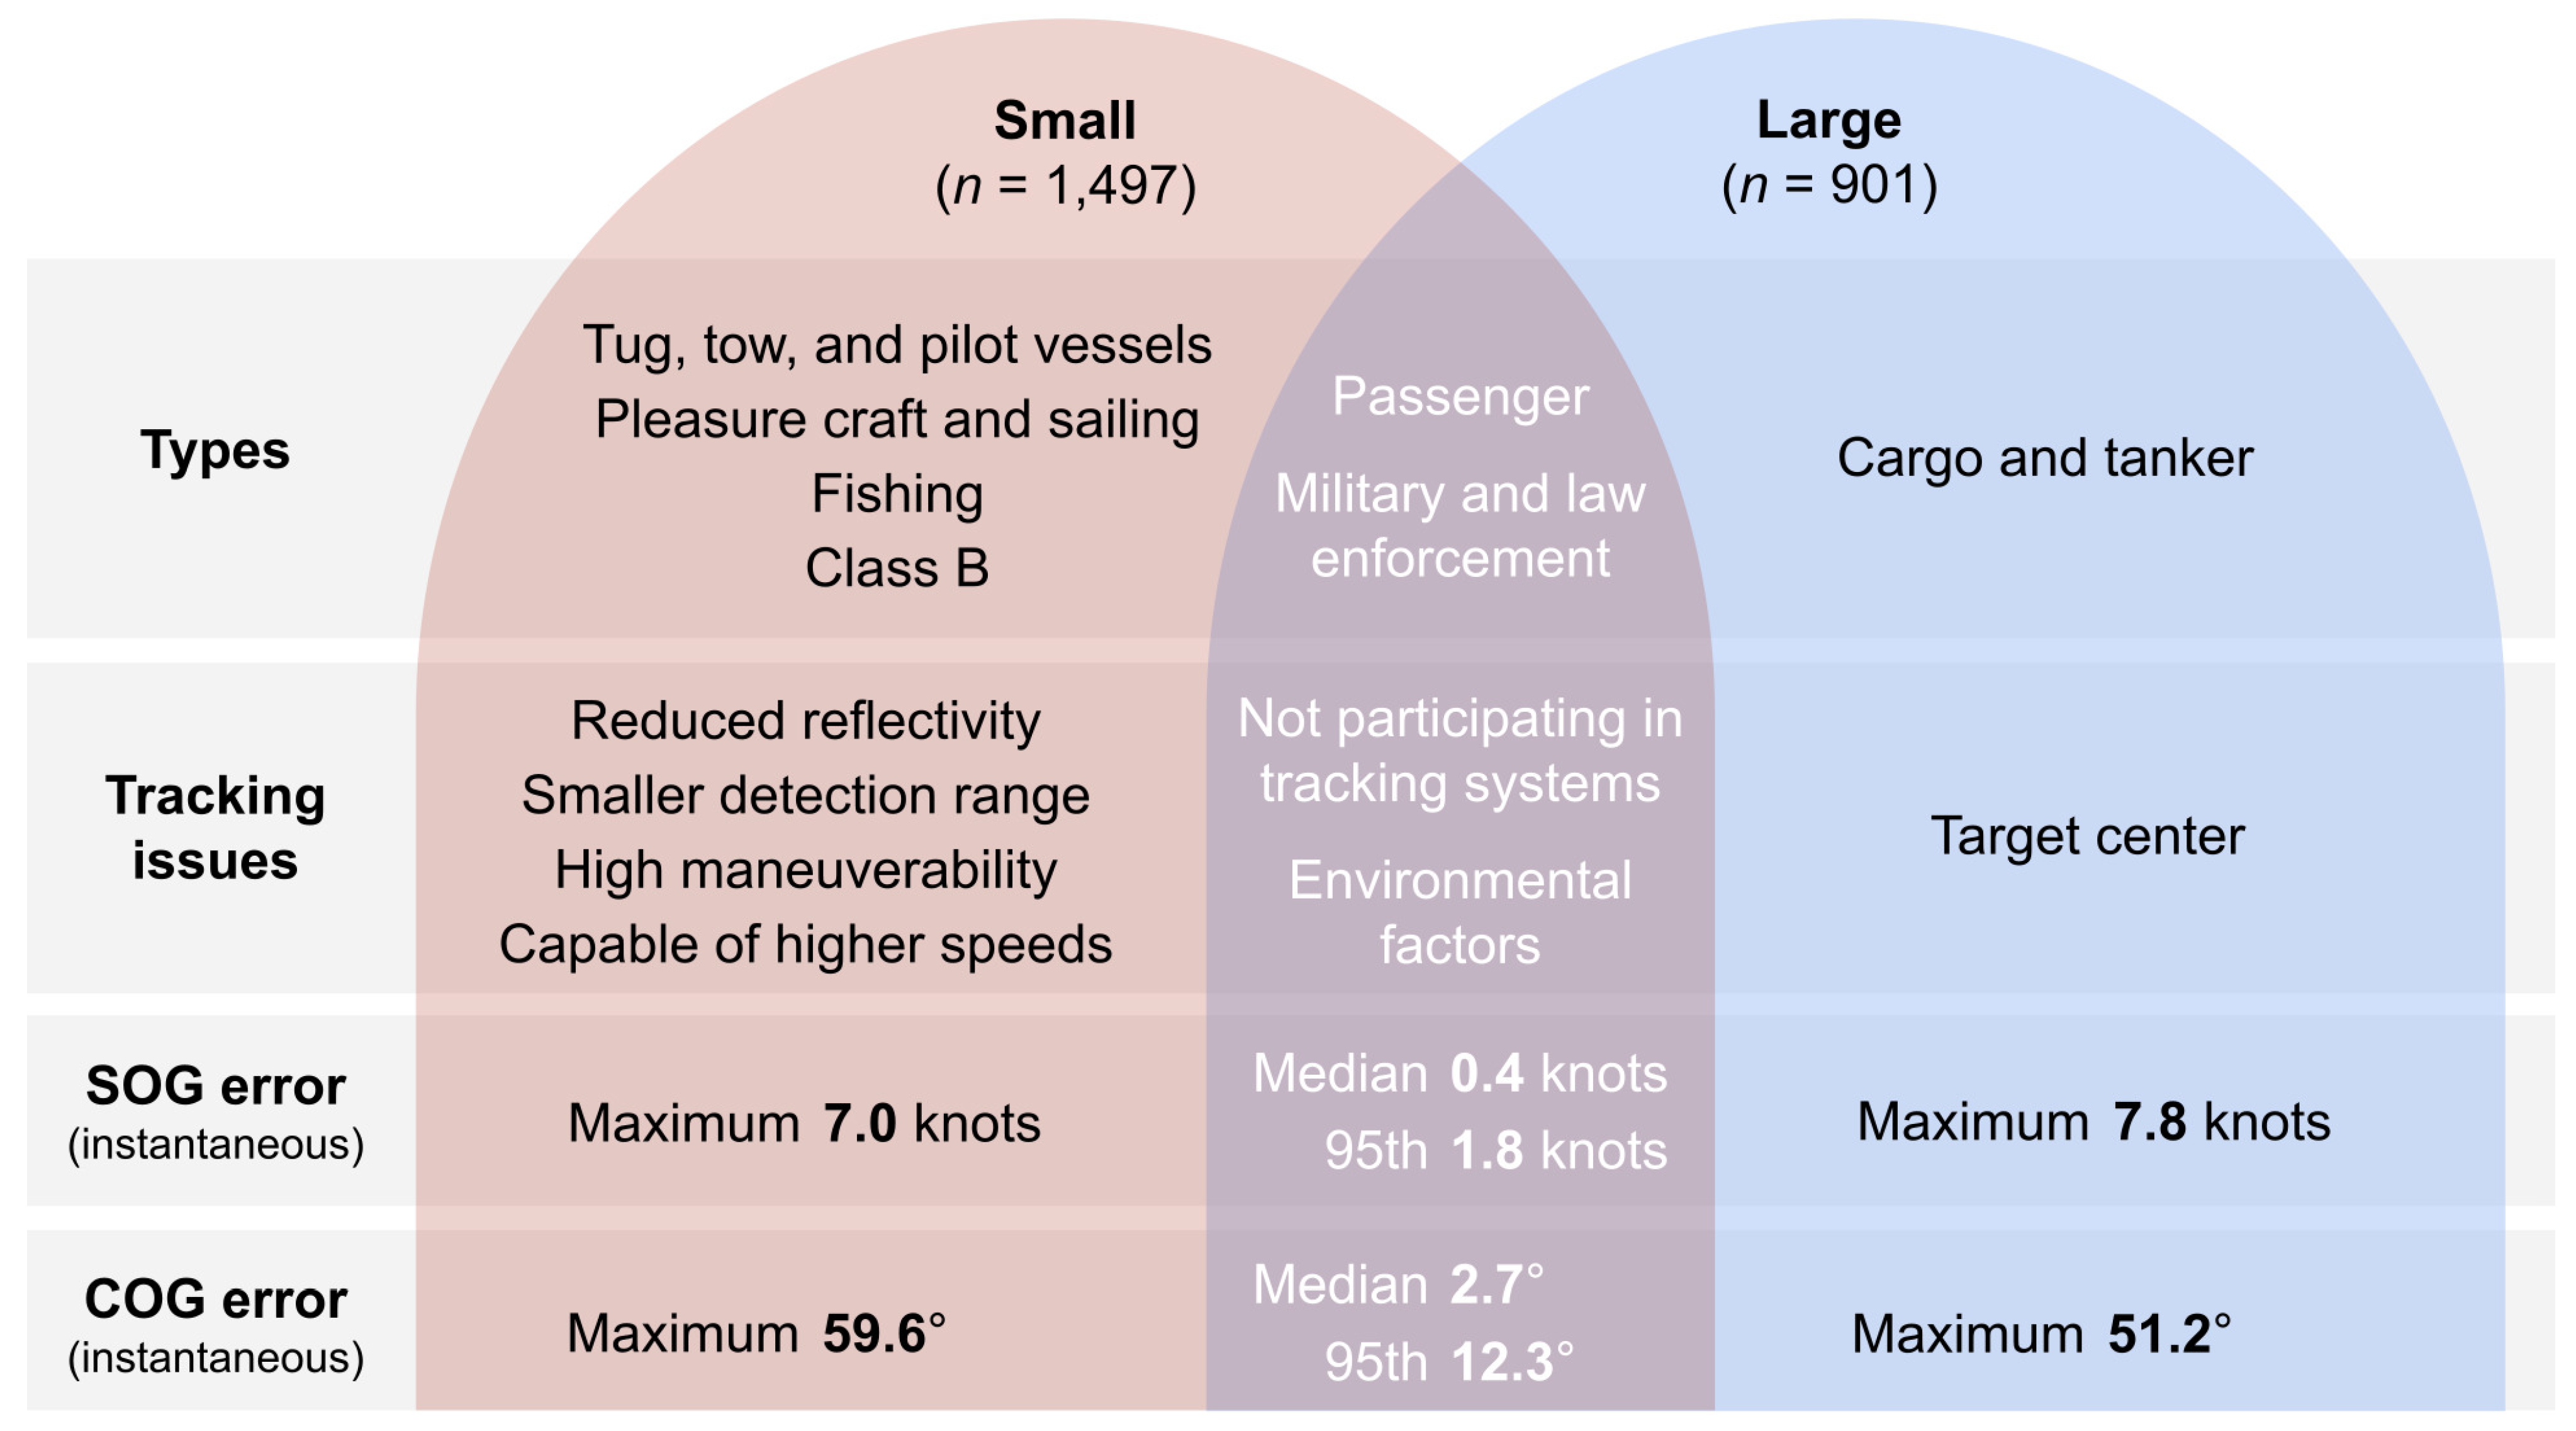
3.1. Error
3.2. Comparison with Standards
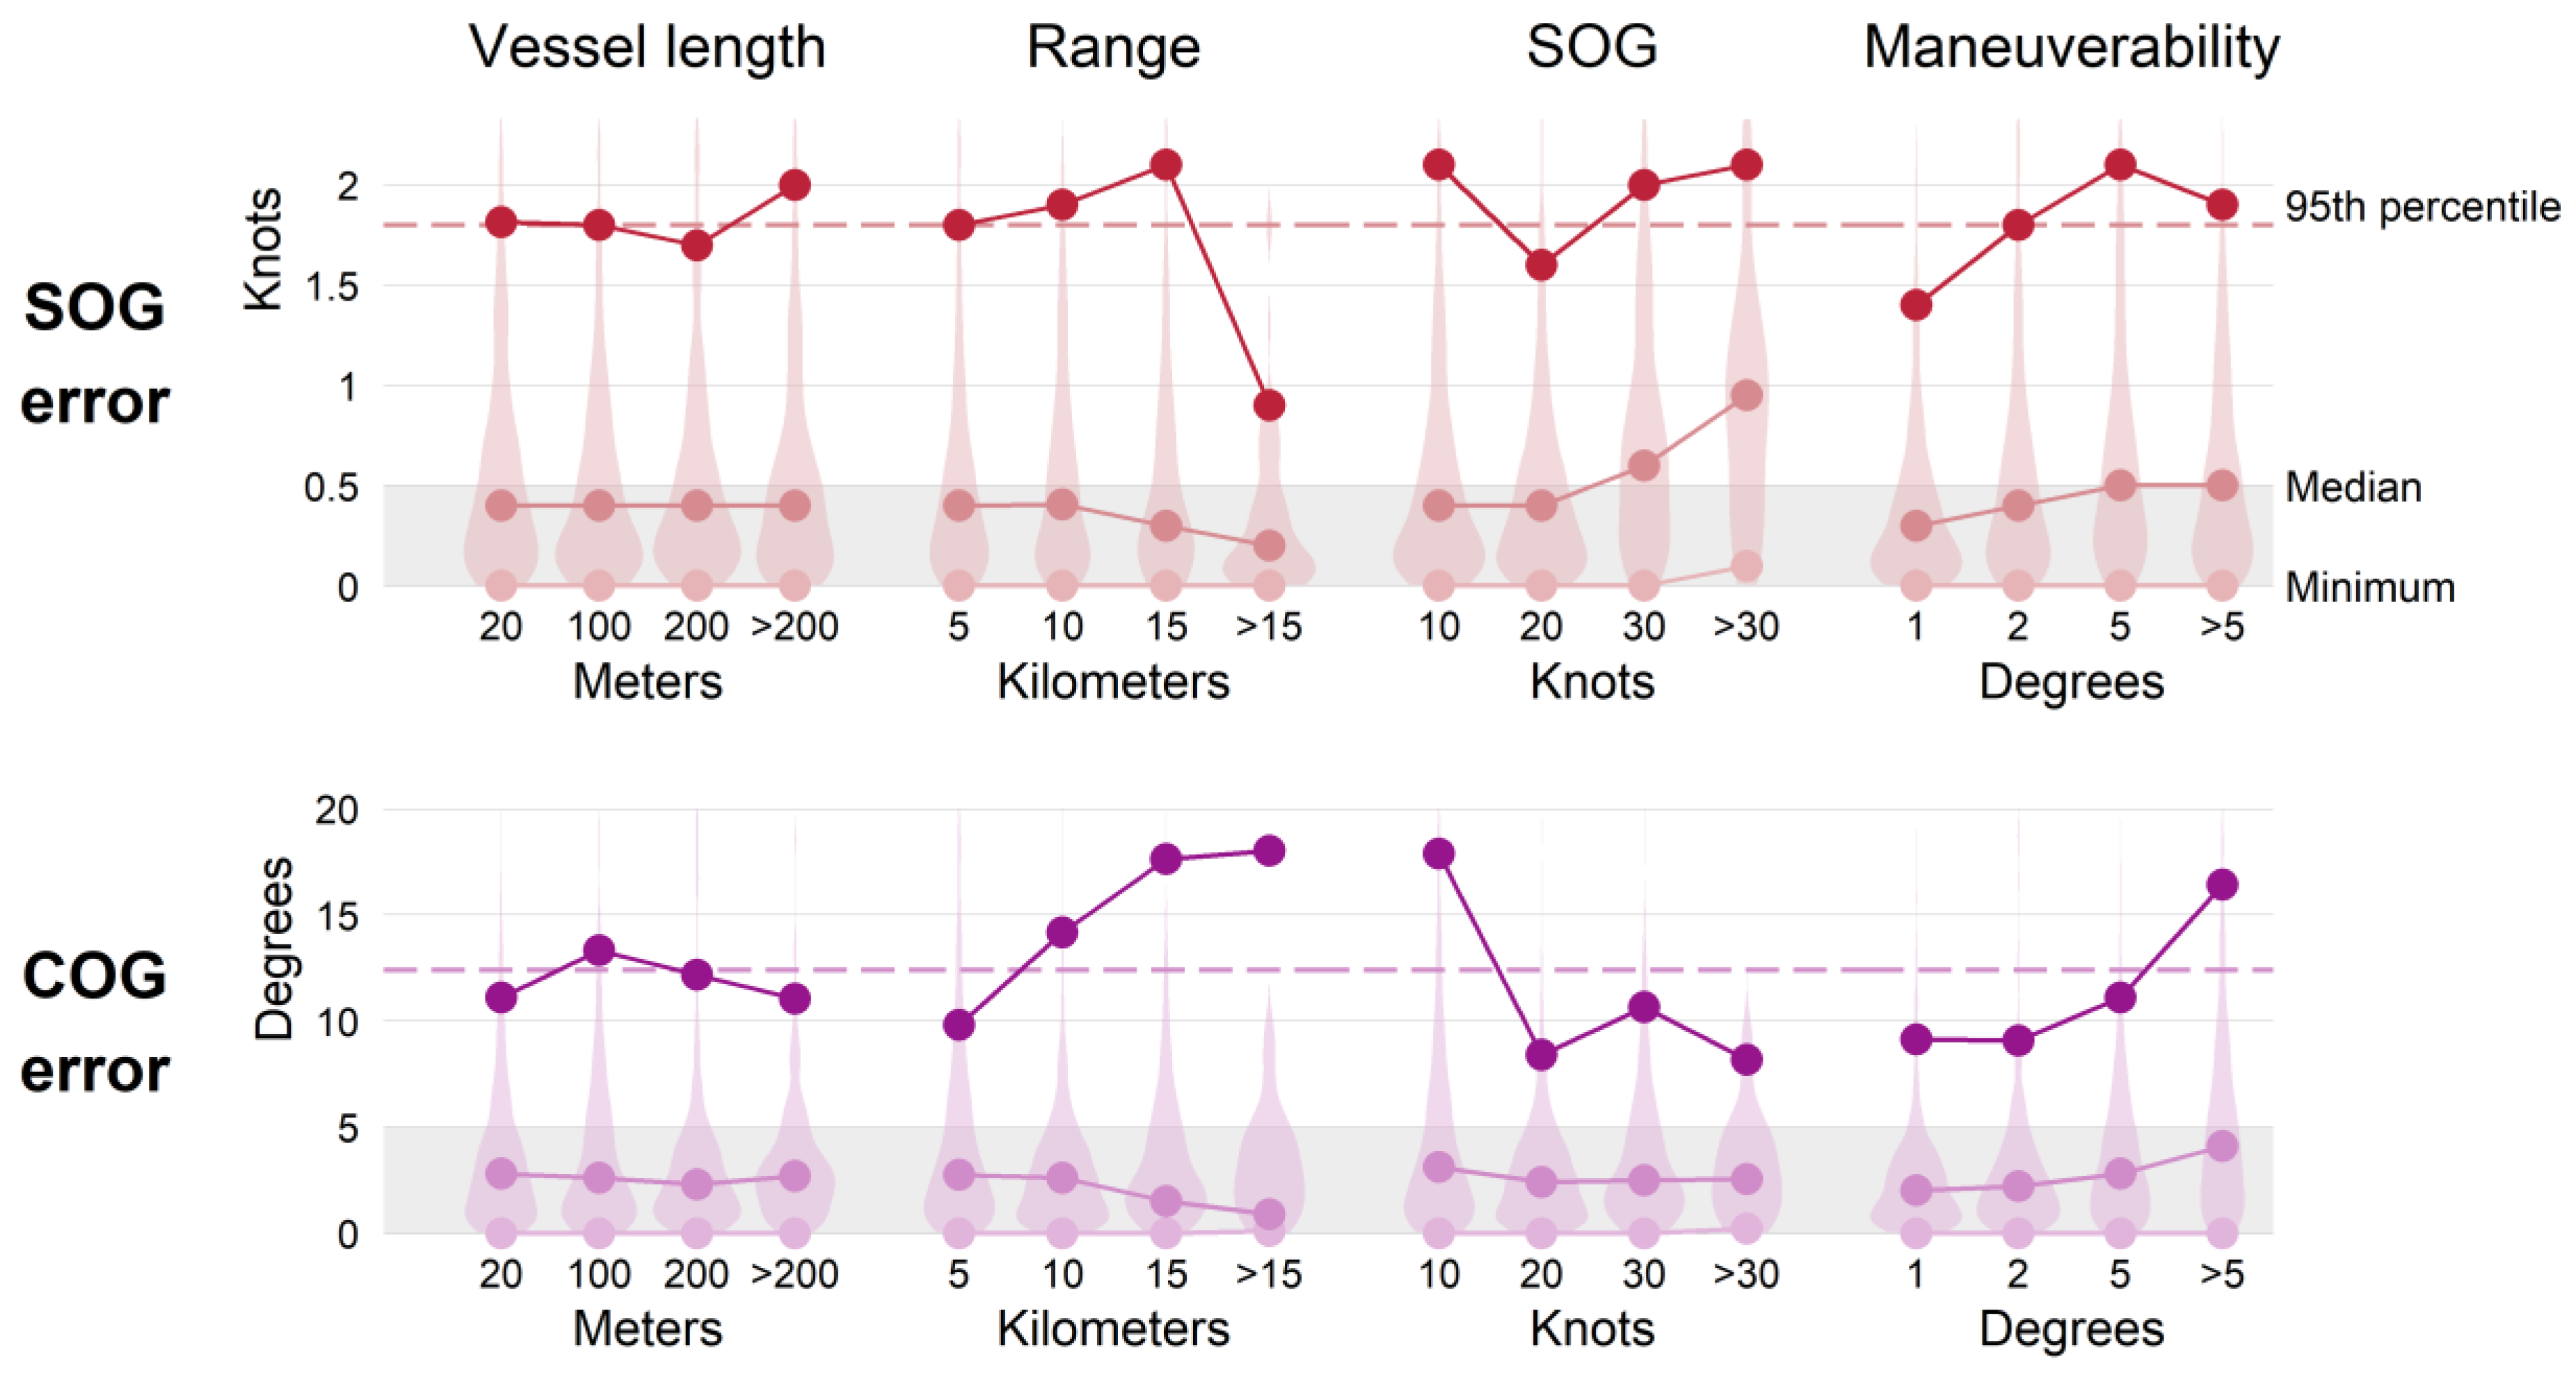
3.3. Comparison with Variables
4. Discussion
5. Conclusions
Author Contributions
Funding
Institutional Review Board Statement
Informed Consent Statement
Data Availability Statement
Acknowledgments
Conflicts of Interest
References
- IMO Publishing. SOLAS Consolidated Edition 2020; IMO Publishing: London, UK, 2020. [Google Scholar]
- International Maritime Organization. Revised Guidelines for the Onboard Operational Use of Shipborne Automatic Identification Systems (AIS); International Maritime Organization: London, UK, 2015. [Google Scholar]
- Robards, M.; Silber, G.; Adams, J.; Arroyo, J.; Lorenzini, D.; Schwehr, K.; Amos, J. Conservation science and policy applications of the marine vessel Automatic Identification System (AIS)—A review. Bull. Mar. Sci. 2016, 92, 75–103. [Google Scholar] [CrossRef]
- Emmens, T.; Amrit, C.; Abdi, A.; Ghosh, M. The promises and perils of Automatic Identification System data. Expert Syst. Appl. 2021, 178, 114975. [Google Scholar] [CrossRef]
- Laist, D.; Knowlton, A.; Pendleton, D. Effectiveness of mandatory vessel speed limits for protecting North Atlantic right whales. Endanger. Species Res. 2014, 23, 133–147. [Google Scholar] [CrossRef]
- Van Der Hoop, J.M.; Vanderlaan, A.S.M.; Cole, T.V.N.; Henry, A.G.; Hall, L.; Mase-Guthrie, B.; Wimmer, T.; Moore, M.J. Vessel Strikes to Large Whales Before and After the 2008 Ship Strike Rule. Conserv. Lett. 2015, 8, 24–32. [Google Scholar] [CrossRef]
- Silber, G.K.; Adams, J.D.; Fonnesbeck, C.J. Compliance with vessel speed restrictions to protect North Atlantic right whales. PeerJ 2014, 2, e399. [Google Scholar] [CrossRef]
- Guzman, H.M.; Hinojosa, N.; Kaiser, S. Ship’s compliance with a traffic separation scheme and speed limit in the Gulf of Panama and implications for the risk to humpback whales. Mar. Policy 2020, 120, 104113. [Google Scholar] [CrossRef]
- National Marine Fisheries Service. North Atlantic Right Whale (Eubalaena glacialis) Vessel Speed Rule Assessment; Technical Report; National Marine Fisheries Service, Office of Protected Resources: Silver Spring, MD, USA, 2020. [Google Scholar]
- Burnham, R.E.; Vagle, S.; O’Neill, C.; Trounce, K. The Efficacy of Management Measures to Reduce Vessel Noise in Critical Habitat of Southern Resident Killer Whales in the Salish Sea. Front. Mar. Sci. 2021, 8, 664691. [Google Scholar] [CrossRef]
- Morten, J.; Freedman, R.; Adams, J.D.; Wilson, J.; Rubinstein, A.; Hastings, S. Evaluating Adherence With Voluntary Slow Speed Initiatives to Protect Endangered Whales. Front. Mar. Sci. 2022, 9, 833206. [Google Scholar] [CrossRef]
- Read, R.; Briefs, C.B.; Cases, C.C.C. Final Rule to Remove the Sunset Provision of the Final Rule Implementing Vessel Speed Restrictions to Reduce the Threat of Ship Collisions with North Atlantic Right Whales. Federal Register, 6 June 2013. [Google Scholar]
- Transport Canada. Interim Order for the Protection of North Atlantic Right Whales (Eubalaena glacialis) in the Gulf of St. Lawrence, 2023; Transport Canada: North York, ON, Canada, 2023. [Google Scholar]
- Cope, S.; Hines, E.; Bland, R.; Davis, J.D.; Tougher, B.; Zetterlind, V. Application of a New Shore-Based Vessel Traffic Monitoring System Within San Francisco Bay. Front. Mar. Sci. 2020, 7, 86. [Google Scholar] [CrossRef]
- O’Hara, P.D.; Serra-Sogas, N.; McWhinnie, L.; Pearce, K.; Le Baron, N.; O’Hagan, G.; Nesdoly, A.; Marques, T.; Canessa, R. Automated identification system for ships data as a proxy for marine vessel related stressors. Sci. Total Environ. 2023, 865, 160987. [Google Scholar] [CrossRef]
- Mayaud, R.; Peel, D.; Smith, J.N.; Wilson, C.; Nash, S.B. The need to consider recreational vessels in risk assessments of vessel strikes to humpback whales (Megaptera novaeangliae). Ocean Coast. Manag. 2024, 259, 107419. [Google Scholar] [CrossRef]
- Fraser, M.D.; McWhinnie, L.H.; Canessa, R.R.; Darimont, C.T. Compliance of small vessels to minimum distance regulations for humpback and killer whales in the Salish Sea. Mar. Policy 2020, 121, 104171. [Google Scholar] [CrossRef]
- Hague, E.L.; Halliday, W.D.; Dawson, J.; Ferguson, S.H.; Heide-Jørgensen, M.P.; Serra Sogas, N.; Gormley, K.; Young, B.G.; McWhinnie, L.H. Not all maps are equal: Evaluating approaches for mapping vessel collision risk to large baleen whales. J. Appl. Ecol. 2024, 61, 2576–2593. [Google Scholar] [CrossRef]
- United Nations. International Convention for the Safety of Life at Sea, 1974; United Nations: New York, NY, USA, 1980. [Google Scholar]
- International Association of Marine Aids to Navigation and Lighthouse Authorities. IALA VTS Manual Ed. 8.2.; Technical Report; International Association of Marine Aids to Navigation and Lighthouse Authorities: Saint-Germain-en-Laye, France, 2022. [Google Scholar]
- Cope, S.; Hines, E.; Bland, R.; Davis, J.D.; Tougher, B.; Zetterlind, V. Multi-sensor integration for an assessment of underwater radiated noise from common vessels in San Francisco Bay. J. Acoust. Soc. Am. 2021, 149, 2451–2464. [Google Scholar] [CrossRef]
- Kemsley, A.; Pukini, C. Marine Protected Area Watch and Marine Monitor (M2) RADAR Technology: Case Studies in Anthropogenic Use Monitoring in California’s Marine Protected Areas. In Proceedings of the OCEANS 2021: San Diego–Porto, San Diego, CA, USA, 20–23 September 2021; pp. 1–5, ISSN 0197-7385. [Google Scholar] [CrossRef]
- Cope, S.; Tougher, B.; Morten, J.; Pukini, C.; Zetterlind, V. Coastal radar as a tool for continuous and fine-scale monitoring of vessel activities of interest in the vicinity of marine protected areas. PLoS ONE 2022, 17, e0269490. [Google Scholar] [CrossRef] [PubMed]
- Zainuddin, S.; Pasya, I.; Rashid, N.E.A.; Zaiaami, N.; Maryam, A.; Abdullah, R.S.A.R.; Ali, M.S.A.M. Maritime Radar: A Review on Techniques for Small Vessels Detection. Int. J. Electr. Electron. Syst. Res. 2019, 14, 30–45. [Google Scholar]
- Bhatkar, S.; Shivalkar, M.; Tandale, B.; Joshi, P. Survey of Various Methods used for Speed Calculation of a Vehicle. Int. J. Recent Innov. Trends Comput. Commun. 2015, 3, 1558–1561. [Google Scholar] [CrossRef]
- Dujmich, L. Radar Speed Detection: Homing in on New Evidentiary Problems. Fordham Law Rev. 1980, 48, 1138. [Google Scholar]
- International Maritime Organization. Adoption of the Revised Performance Standards for Radar Equipment; International Maritime Organization: London, UK, 2004. [Google Scholar]
- Bole, A.; Wall, A.; Norris, A. Radar and ARPA Manual; Elsevier: Amsterdam, The Netherlands, 2014. [Google Scholar] [CrossRef]
- Lawton, J.A.; Jesionowski, R.J.; Zarchan, P. Comparison of Four Filtering Options for a Radar Tracking Problem. J. Guid. Control Dyn. 1998, 21, 618–623. [Google Scholar] [CrossRef]
- Kazimierski, W.; Stateczny, A. Radar and Automatic Identification System Track Fusion in an Electronic Chart Display and Information System. J. Navig. 2015, 68, 1141–1154. [Google Scholar] [CrossRef]
- Kalman, R.E. A New Approach to Linear Filtering and Prediction Problems. J. Basic Eng. 1960, 82, 35–45. [Google Scholar] [CrossRef]
- Arturi, D.; Crocco, L.; Serafino, F. X band radar target tracking in marine environment: A comparison of different algorithms in a real scenario. In Proceedings of the 2016 10th European Conference on Antennas and Propagation (EuCAP), Davos, Switzerland, 10–15 April 2016; pp. 1–3. [Google Scholar] [CrossRef]
- Vivone, G.; Braca, P.; Granström, K.; Natale, A.; Chanussot, J. Converted measurements Bayesian extended target tracking applied to X-band marine radar data. J. Adv. Inf. Fusion 2019, 12, 189–210. [Google Scholar]
- Fowdur, J.S.; Baum, M.; Heymann, F. Real-World Marine Radar Datasets for Evaluating Target Tracking Methods. Sensors 2021, 21, 4641. [Google Scholar] [CrossRef]
- Laws, K.; Vesecky, J.; Paduan, J. Monitoring coastal vessels for environmental applications: Application of Kalman filtering. In Proceedings of the 2011 IEEE/OES 10th Current, Waves and Turbulence Measurements (CWTM), Monterey, CA, USA, 20–23 March 2011; pp. 39–46. [Google Scholar] [CrossRef]
- Jiabao, W.; Guochen, Y.; Liqing, G.; Yongxin, L.; Xiaomin, N. HFSWR ship trajectory tracking and fusion with AIS using Kalman filter. In Proceedings of the 2017 29th Chinese Control And Decision Conference (CCDC), Chongqing, China, 28–30 May 2017; pp. 456–461, ISSN 1948-9447. [Google Scholar] [CrossRef]
- Daeipour, E.; Bar-Shalom, Y. An interacting multiple model approach for target tracking with glint noise. IEEE Trans. Aerosp. Electron. Syst. 1995, 31, 706–715. [Google Scholar] [CrossRef]
- Julier, S.; Uhlmann, J.; Durrant-Whyte, H. A new approach for filtering nonlinear systems. In Proceedings of the 1995 American Control Conference—ACC’95, Seattle, WA, USA, 21–23 June 1995; Volume 3, pp. 1628–1632. [Google Scholar] [CrossRef]
- Clunie, T.; DeFilippo, M.; Sacarny, M.; Robinette, P. Development of a Perception System for an Autonomous Surface Vehicle using Monocular Camera, LIDAR, and Marine RADAR. In Proceedings of the 2021 IEEE International Conference on Robotics and Automation (ICRA), Xi’an, China, 30 May–5 June 2021; pp. 14112–14119. [Google Scholar] [CrossRef]
- Fan, Y.; Qiao, S.; Wang, G.; Chen, S.; Zhang, H. A modified adaptive Kalman filtering method for maneuvering target tracking of unmanned surface vehicles. Ocean Eng. 2022, 266, 112890. [Google Scholar] [CrossRef]
- Qiao, S.; Fan, Y.; Wang, G.; Mu, D.; He, Z. Radar Target Tracking for Unmanned Surface Vehicle Based on Square Root Sage–Husa Adaptive Robust Kalman Filter. Sensors 2022, 22, 2924. [Google Scholar] [CrossRef]
- Kim, H.; Kim, D.; Lee, S.M. Marine Object Segmentation and Tracking by Learning Marine Radar Images for Autonomous Surface Vehicles. IEEE Sens. J. 2023, 23, 10062–10070. [Google Scholar] [CrossRef]
- Chen, X.; Su, N.; Huang, Y.; Guan, J. False-Alarm-Controllable Radar Detection for Marine Target Based on Multi Features Fusion via CNNs. IEEE Sens. J. 2021, 21, 9099–9111. [Google Scholar] [CrossRef]
- Liu, C.; Antypenko, R.; Sushko, I.; Zakharchenko, O.; Wang, J. Marine Distributed Radar Signal Identification and Classification Based on Deep Learning. Trait. Du Signal 2021, 38, 1541–1548. [Google Scholar] [CrossRef]
- Su, N.; Chen, X.; Guan, J.; Huang, Y. Maritime Target Detection Based on Radar Graph Data and Graph Convolutional Network. IEEE Geosci. Remote Sens. Lett. 2022, 19, 3133473. [Google Scholar] [CrossRef]
- Liu, J.; Wang, Z.; Cheng, D.; Chen, W.; Chen, C. Marine Extended Target Tracking for Scanning Radar Data Using Correlation Filter and Bayes Filter Jointly. Remote Sens. 2022, 14, 5937. [Google Scholar] [CrossRef]
- Vo, X.H.; Nguyen, T.K.; Nguyen, P.B.; Duong, V.M. Advanced Method for Improving Marine Target Tracking Based on Multiple-Plot Processing of Radar Images. Electronics 2024, 13, 2548. [Google Scholar] [CrossRef]
- Lin, B.; Huang, C.H. Comparison between ARPA radar and AIS characteristics for vessel traffic services. J. Mar. Sci. Technol. 2006, 14, 7. [Google Scholar] [CrossRef]
- Heymann, F.; Bany, P.; Noack, T.; Engler, E. Is ARPA Suitable for Automatic Assessment of AIS Targets? In Marine Navigation and Safety of Sea Transportation; Weintrit, A., Ed.; CRC Press: Boca Raton, FL, USA, 2013; pp. 223–232. [Google Scholar] [CrossRef]
- Jankowski, D.; Lamm, A.; Hahn, A. Determination of AIS Position Accuracy and Evaluation of Reconstruction Methods for Maritime Observation Data. IFAC-PapersOnLine 2021, 54, 97–104. [Google Scholar] [CrossRef]
- Naus, K.; Wąż, M.; Szymak, P.; Gucma, L.; Gucma, M. Assessment of ship position estimation accuracy based on radar navigation mark echoes identified in an Electronic Navigational Chart. Measurement 2021, 169, 108630. [Google Scholar] [CrossRef]
- Kim, T.H.; Yang, C.S. Ship Monitoring around the Ieodo Ocean Research Station Using FMCW Radar and AIS: 23–30 November 2013. Korean J. Remote Sens. 2022, 38, 45–56. [Google Scholar] [CrossRef]
- Witte, T.; Wilson, A. Accuracy of non-differential GPS for the determination of speed over ground. J. Biomech. 2004, 37, 1891–1898. [Google Scholar] [CrossRef]
- Last, P.; Bahlke, C.; Hering-Bertram, M.; Linsen, L. Comprehensive Analysis of Automatic Identification System (AIS) Data in Regard to Vessel Movement Prediction. J. Navig. 2014, 67, 791–809. [Google Scholar] [CrossRef]
- Felski, A.; Jaskólski, K.; Banyś, P. Comprehensive Assessment of Automatic Identification System (AIS) Data Application to Anti-collision Manoeuvring. J. Navig. 2015, 68, 697–717. [Google Scholar] [CrossRef]
- Wawruch, R. Comparative Study of the Accuracy of AIS and ARPA Indications. Part 2. Accuracy of the Opposite Vessel True Course and True Speed Indication. TransNav Int. J. Mar. Navig. Saf. Sea Transp. 2018, 12, 673–678. [Google Scholar] [CrossRef]
- Juszkiewicz, W. Verification of the accuracy requirements for relative course and closest point of approach. Sci. J. Marit. Univ. Szczec. 2016, 117, 108–113. [Google Scholar] [CrossRef]
- Juszkiewicz, W.; Nowy, A. The verification of automatic drift calculation accuracy in ARPA. In Proceedings of the the 16th International Scientific and Technical Conference on Marine Traffic Engineering (MTE) and International Symposium Information on Ships, Kołobrzeg, Poland, 14–16 October 2015; pp. 314–322. [Google Scholar]
- Kroodsma, D.A.; Hochberg, T.; Davis, P.B.; Paolo, F.S.; Joo, R.; Wong, B.A. Revealing the global longline fleet with satellite radar. Sci. Rep. 2022, 12, 21004. [Google Scholar] [CrossRef]
- Paolo, F.S.; Kroodsma, D.; Raynor, J.; Hochberg, T.; Davis, P.; Cleary, J.; Marsaglia, L.; Orofino, S.; Thomas, C.; Halpin, P. Satellite mapping reveals extensive industrial activity at sea. Nature 2024, 625, 85–91. [Google Scholar] [CrossRef] [PubMed]
- Rowlands, G.; Brown, J.; Soule, B.; Boluda, P.T.; Rogers, A.D. Satellite surveillance of fishing vessel activity in the Ascension Island Exclusive Economic Zone and Marine Protected Area. Mar. Policy 2019, 101, 39–50. [Google Scholar] [CrossRef]
- Kang, K.M.; Kim, D.J. Ship Velocity Estimation From Ship Wakes Detected Using Convolutional Neural Networks. IEEE J. Sel. Top. Appl. Earth Obs. Remote Sens. 2019, 12, 4379–4388. [Google Scholar] [CrossRef]
- Wu, S.; Wang, Y.; Li, Q.; Zhang, Y.; Bai, Y.; Zheng, H. Simulation of Synthetic Aperture Radar Images for Ocean Ship Wakes. Remote Sens. 2023, 15, 5521. [Google Scholar] [CrossRef]
- Cope, S.; Tougher, B.; Zetterlind, V.; Gilfillan, L.; Aldana, A. Building a Practical Multi-Sensor Platform for Monitoring Vessel Activity near Marine Protected Areas: Case Studies from Urban and Remote Locations. Remote Sens. 2023, 15, 3216. [Google Scholar] [CrossRef]
- Furuno Marine Radar Products. Available online: https://www.furuno.com/en/products/radar (accessed on 7 August 2024).
- Nobeltec TimeZero User Guide v 3.1. Available online: https://userguide.mytimezero.com/tz-coastal-monitoring/Welcome.htm (accessed on 14 November 2024).
- Pilté, M.; Bonnabel, S.; Barbaresco, F. Fully adaptive update rate for non-linear trackers. IET Radar Sonar Navig. 2018, 12, 1419–1428. [Google Scholar] [CrossRef]
- International Telecommunication Union. Technical Characteristics for an Automatic Identification System Using Time Division Multiple Access in the VHF Maritime Mobile Frequency Band; Technical Report Recommendation M.1371-5; International Telecommunication Union: Geneva, Switzerland, 2014. [Google Scholar]
- Jaskólski, K.; Marchel, Ł.; Felski, A.; Jaskólski, M.; Specht, M. Automatic Identification System (AIS) Dynamic Data Integrity Monitoring and Trajectory Tracking Based on the Simultaneous Localization and Mapping (SLAM) Process Model. Sensors 2021, 21, 8430. [Google Scholar] [CrossRef]
- International Electrotechnical Commission. Maritime Navigation and Radiocommunication Equipment and Systems—Automatic Identification Systems (AIS)—Part 2: Class A Shipborne Equipment of the Automatic Identification System (AIS)—Operational and Performance Requirements, Methods of Test and Required Test Results; International Electrotechnical Commission: Geneva, Switzerland, 2018. [Google Scholar]
- International Electrotechnical Commission. Maritime Navigation and Radiocommunication Equipment and Systems—Class B Shipborne Equipment of the Automatic Identification System (AIS)—Part 1: Carrier-Sense Time Division Multiple Access (CSTDMA) Techniques; International Electrotechnical Commission: Geneva, Switzerland, 2017. [Google Scholar]
- International Electrotechnical Commission. Maritime Navigation and Radiocommunication Equipment and Systems—Class B Shipborne Equipment of the Automatic Identification System (AIS)—Part 2: Self-Organising Time Division Multiple Access (SOTDMA) Techniques; International Electrotechnical Commission: Geneva, Switzerland, 2017. [Google Scholar]
- International Maritime Organization. Adoption of the Revised Performance Standards for Shipborne Global Positioning System (GPS) Receiver Equipment; International Maritime Organization: London, UK, 2000. [Google Scholar]
- Silber, G.K.; Bettridge, S. Vessel Operations in Right Whale Protection Areas in 2009; NOAA Technical Memorandum NMFS-OPR-44; U.S. Department of Commerce: Washington, DC, USA, 2010. [Google Scholar]
- R Core Team. R: A Language and Environment for Statistical Computing; R Core Team: Vienna, Austria, 2024. [Google Scholar]
- Patroumpas, K.; Alevizos, E.; Artikis, A.; Vodas, M.; Pelekis, N.; Theodoridis, Y. Online event recognition from moving vessel trajectories. GeoInformatica 2017, 21, 389–427. [Google Scholar] [CrossRef]
- Lei, J.; Sun, Y.; Wu, Y.; Zheng, F.; He, W.; Liu, X. Association of AIS and Radar Data in Intelligent Navigation in Inland Waterways Based on Trajectory Characteristics. J. Mar. Sci. Eng. 2024, 12, 890. [Google Scholar] [CrossRef]
- Lund, U.; Agostinelli, C.; Arai, H.; Gagliardi, A.; García-Portugués, E.; Giunchi, D.; Irisson, J.O.; Pocernich, M.; Rotolo, F. Circular: Circular Statistics. 2022. Available online: https://cran.r-project.org/web/packages/circular/index.html (accessed on 7 August 2024).
- Rodger, M.; Guida, R. Classification-Aided SAR and AIS Data Fusion for Space-Based Maritime Surveillance. Remote Sens. 2020, 13, 104. [Google Scholar] [CrossRef]
- Zhao, Z.; Ji, K.; Xing, X.; Zou, H.; Zhou, S. Ship Surveillance by Integration of Space-borne SAR and AIS—Further Research. J. Navig. 2014, 67, 295–309. [Google Scholar] [CrossRef]
- Pelich, R.; Chini, M.; Hostache, R.; Matgen, P.; Lopez-Martinez, C.; Nuevo, M.; Ries, P.; Eiden, G. Large-Scale Automatic Vessel Monitoring Based on Dual-Polarization Sentinel-1 and AIS Data. Remote Sens. 2019, 11, 1078. [Google Scholar] [CrossRef]
- Galdelli, A.; Mancini, A.; Ferrà, C.; Tassetti, A.N. A Synergic Integration of AIS Data and SAR Imagery to Monitor Fisheries and Detect Suspicious Activities. Sensors 2021, 21, 2756. [Google Scholar] [CrossRef]
- Jammalamadaka, S.R.; Sengupta, A.; Sengupta, A. Topics in Circular Statistics; World Scientific: Singapore, 2001. [Google Scholar]
- Federal Register. Automatic Identification System; Vessel Carriage Requirement. 2003. Available online: https://www.federalregister.gov/documents/2003/07/01/03-16191/automatic-identification-system-vessel-carriage-requirement (accessed on 2 March 2025).
- Furuno. Radar Basics. Available online: https://www.furuno.com/en/technology/radar/basic/ (accessed on 2 March 2025).
- Mardia, K.V. Statistics of Directional Data. J. R. Stat. Soc. Ser. B Stat. Methodol. 1975, 37, 349–371. [Google Scholar] [CrossRef]
- U.S. Department of Transportation. Speed-Measuring Device Specifications: Down-the-Road Radar Module; Technical Report DOT HS 812 266; National Highway Traffic Safety Administration: Washington, DC, USA, 2016. [Google Scholar]
- International Maritime Organization. Performance Standards for Devices to Indicate Speed and Distance; International Maritime Organization: London, UK, 1995. [Google Scholar]
- Fossen, T.I.; Perez, T. Kalman filtering for positioning and heading control of ships and offshore rigs. IEEE Control Syst. 2009, 29, 32–46. [Google Scholar] [CrossRef]
- Silva-Campillo, A.; Pérez-Arribas, F. Numerical Analysis of Structural Vibrations in Masts—A Practical Study Applied to a 28-Meter Tugboat. Appl. Sci. 2024, 14, 5751. [Google Scholar] [CrossRef]
- Laster, D.R. Ship’s Speed-Measurement Uncertainties Caused by Localized Water Movements; Technical Report; Defense Technical Information Center: Fort Belvoir, VA, USA, 1973. [Google Scholar] [CrossRef]
- Kim, M.; Hizir, O.; Turan, O.; Day, S.; Incecik, A. Estimation of added resistance and ship speed loss in a seaway. Ocean Eng. 2017, 141, 465–476. [Google Scholar] [CrossRef]
- de Souza, E.N.; Boerder, K.; Matwin, S.; Worm, B. Improving Fishing Pattern Detection from Satellite AIS Using Data Mining and Machine Learning. PLoS ONE 2016, 11, e0158248. [Google Scholar] [CrossRef]
- Taconet, M.; Kroodsma, D.; Fernandes, J.A. Global Atlas of AIS-Based Fishing Activity: Challenges and Opportunities; Food and Agriculture Organization of the United Nations: Rome, Italy, 2019. [Google Scholar]
- Welch, H.; Clavelle, T.; White, T.D.; Cimino, M.A.; Van Osdel, J.; Hochberg, T.; Kroodsma, D.; Hazen, E.L. Hot spots of unseen fishing vessels. Sci. Adv. 2022, 8, eabq2109. [Google Scholar] [CrossRef] [PubMed]
- Gaglione, D.; Soldi, G.; Meyer, F.; Hlawatsch, F.; Braca, P.; Farina, A.; Win, M.Z. Bayesian information fusion and multitarget tracking for maritime situational awareness. IET Radar Sonar Navig. 2020, 14, 1845–1857. [Google Scholar] [CrossRef]
- Wall, A.; Loughney, S.; Ma, F.; Wang, J. Vessel Collision Threat Detection for Offshore Oil and Gas Installations; Research Report RR1153; Health and Safety Executive: Bootle, UK, 2019. [Google Scholar]
- Nisi, A.C.; Welch, H.; Brodie, S.; Leiphardt, C.; Rhodes, R.; Hazen, E.L.; Redfern, J.V.; Branch, T.A.; Barreto, A.S.; Calambokidis, J.; et al. Ship collision risk threatens whales across the world’s oceans. Science 2024, 386, 870–875. [Google Scholar] [CrossRef]
- Blondin, H.; Abrahms, B.; Crowder, L.B.; Hazen, E.L. Combining high temporal resolution whale distribution and vessel tracking data improves estimates of ship strike risk. Biol. Conserv. 2020, 250, 108757. [Google Scholar] [CrossRef]
- Ebdon, P.; Riekkola, L.; Constantine, R. Testing the efficacy of ship strike mitigation for whales in the Hauraki Gulf, New Zealand. Ocean Coast. Manag. 2020, 184, 105034. [Google Scholar] [CrossRef]
- Smith, J.N.; Kelly, N.; Childerhouse, S.; Redfern, J.V.; Moore, T.J.; Peel, D. Quantifying Ship Strike Risk to Breeding Whales in a Multiple-Use Marine Park: The Great Barrier Reef. Front. Mar. Sci. 2020, 7, 67. [Google Scholar] [CrossRef]
- Rockwood, R.C.; Adams, J.D.; Hastings, S.; Morten, J.; Jahncke, J. Modeling Whale Deaths From Vessel Strikes to Reduce the Risk of Fatality to Endangered Whales. Front. Mar. Sci. 2021, 8, 649890. [Google Scholar] [CrossRef]
- Redfern, J.V.; Hodge, B.C.; Pendleton, D.E.; Knowlton, A.R.; Adams, J.; Patterson, E.M.; Good, C.P.; Roberts, J.J. Estimating reductions in the risk of vessels striking whales achieved by management strategies. Biol. Conserv. 2024, 290, 110427. [Google Scholar] [CrossRef]


| Location | Start Date | End Date |
|---|---|---|
| A | 1 August 2023 | 10 August 2023 |
| B | 1 April 2023 | 5 June 2023 |
| C | 1 November 2022 | 5 July 2023 |
| D | 1 April 2022 | 30 May 2023 |
| E | 15 September 2022 | 30 July 2023 |
| F | 1 June 2021 | 30 May 2022 |
| G | 15 April 2022 | 30 July 2023 |
| H | 15 January 2023 | 30 March 2023 |
| I | 1 December 2020 | 15 August 2021 |
| Point Bonita | 1 March 2023 | 15 May 2023 |
| DRS4D-NXT (Solid-State) | DRS25A X-Class (Magnetron) | DRS25A-NXT (Solid-State) | |
|---|---|---|---|
| Minimum range | 20 m | 25 m | 10 m |
| Range resolution | 20 m | 20 m | 10 m |
| Bearing resolution | 3.9 degrees | 1.4–2.3 degrees * | 1.35–2.3 degrees * |
| Radial velocity resolution | 1 knot | Not applicable | 1 knot |
| Range accuracy | 1% of range in use | 1% of range in use | 1% of range in use |
| Bearing accuracy | ±1 degree | ±1 degree | ±1 degree |
| Rotation speed | 24 rotations/minute | 24 rotations/minute | 24 rotations/minute |
| Locations | A, B, C | Point Bonita, D, E, F | G, H, I |
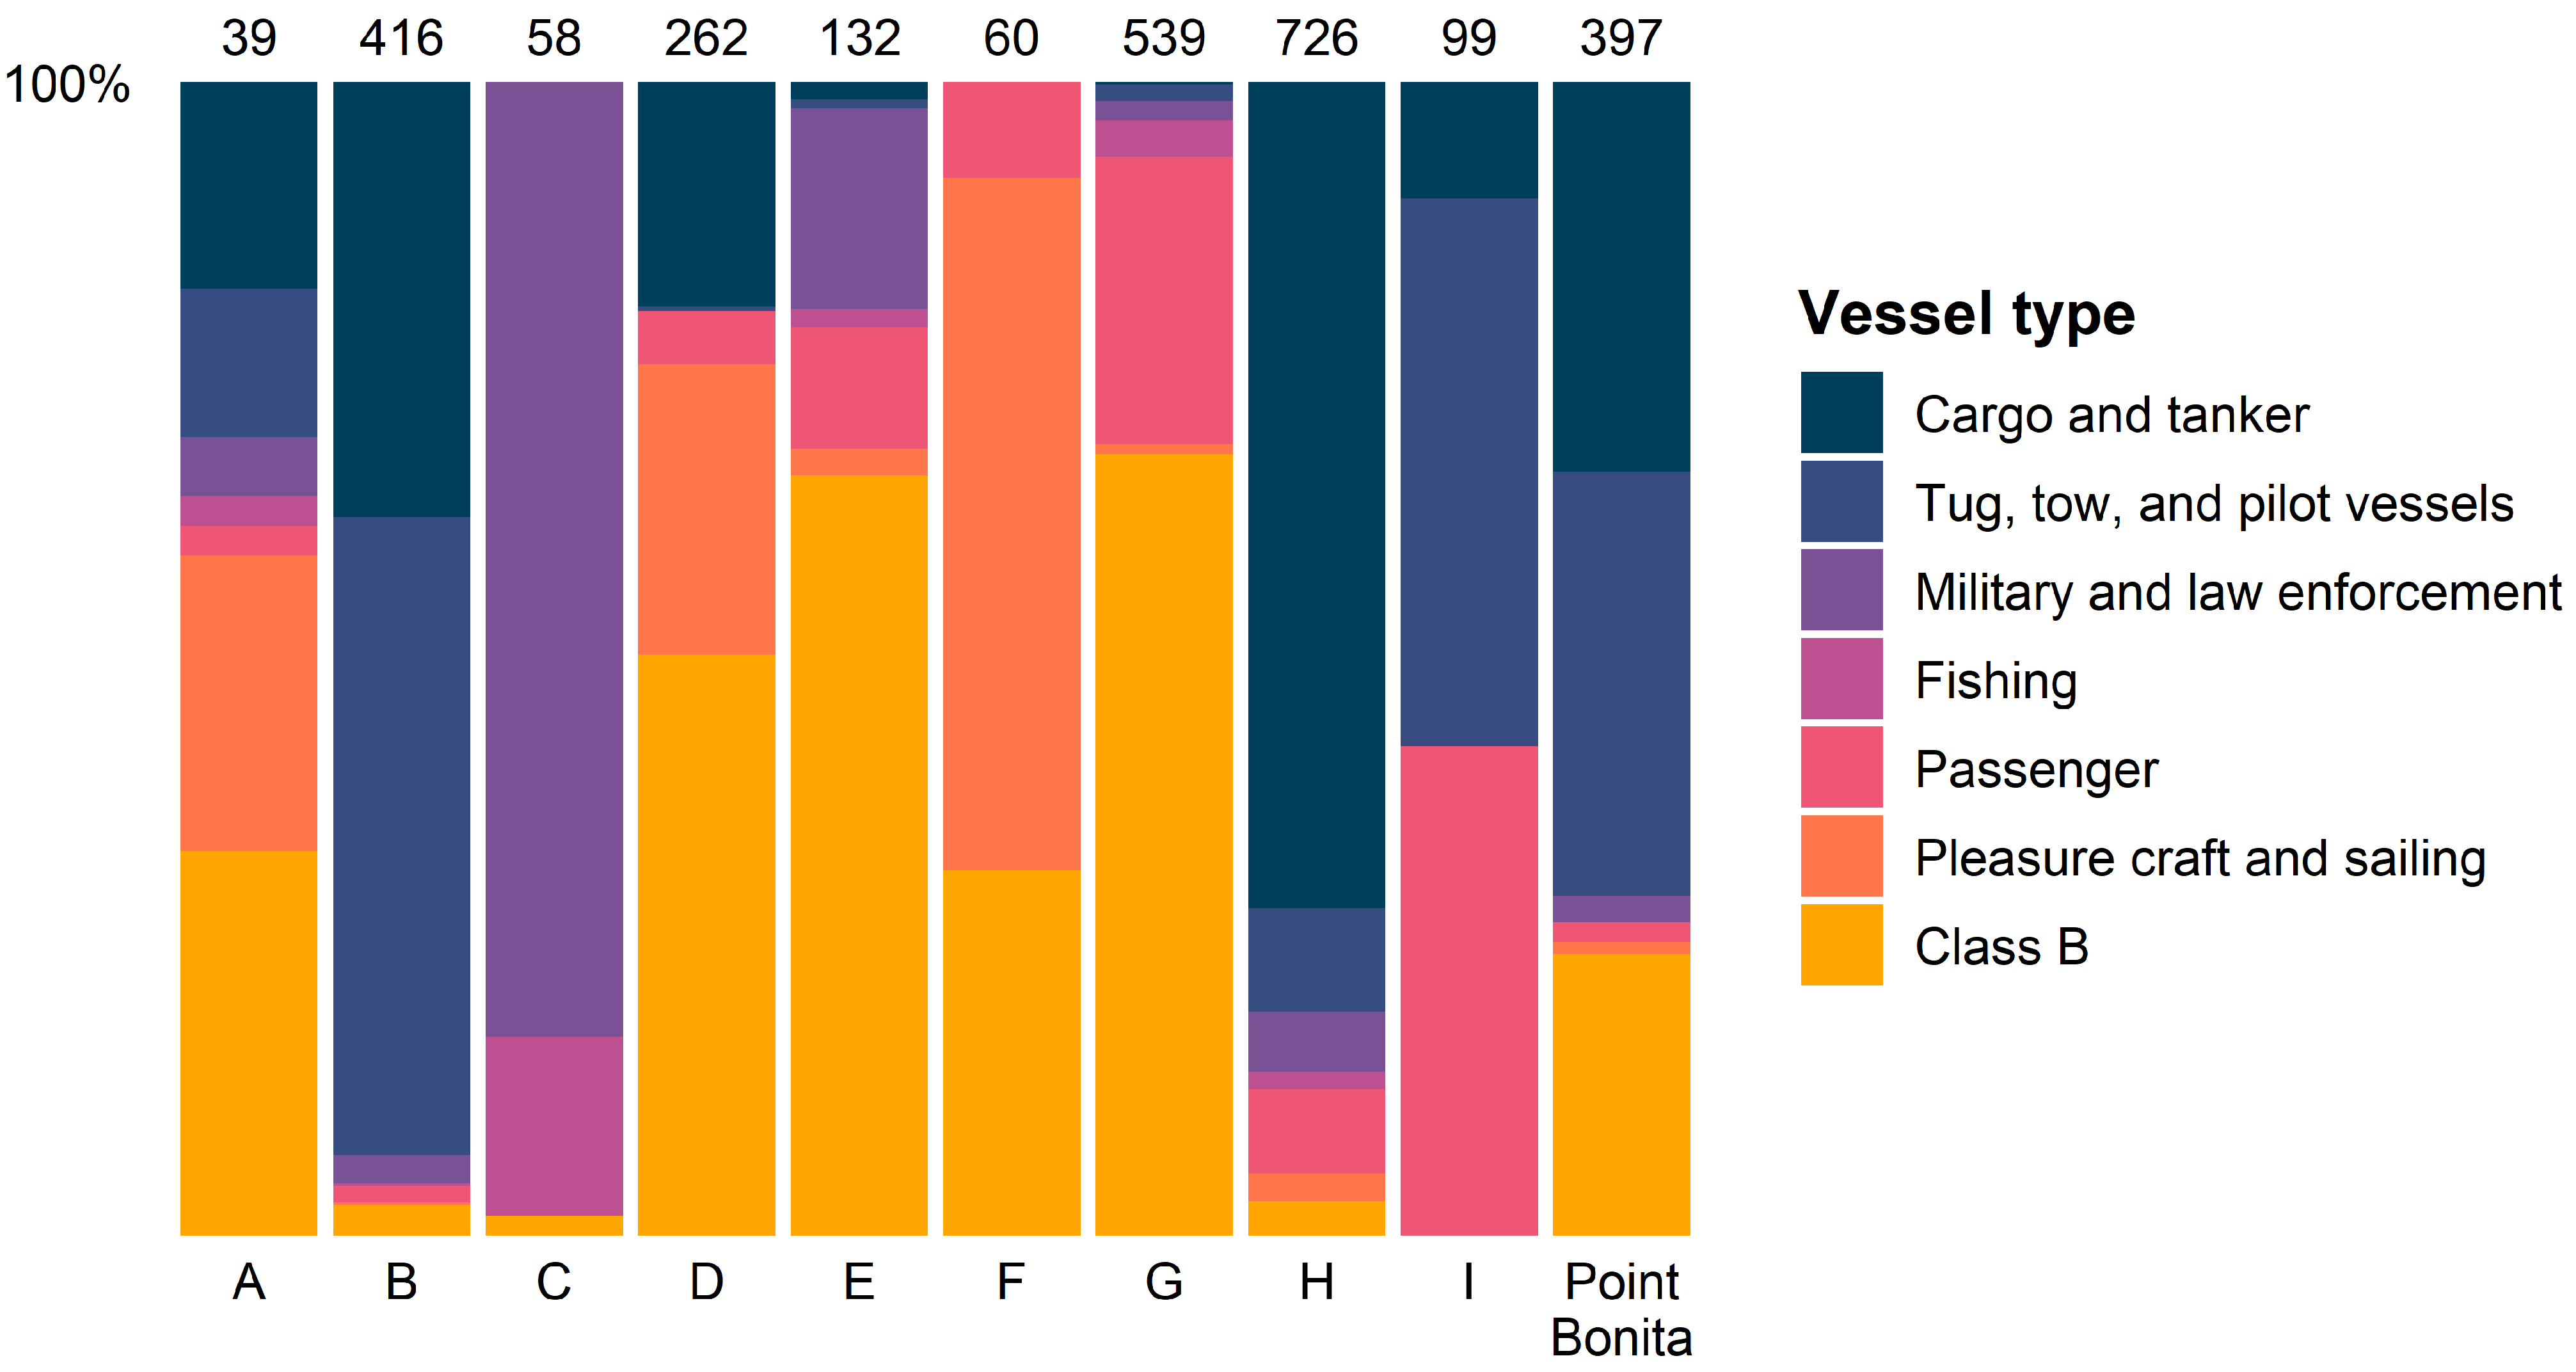
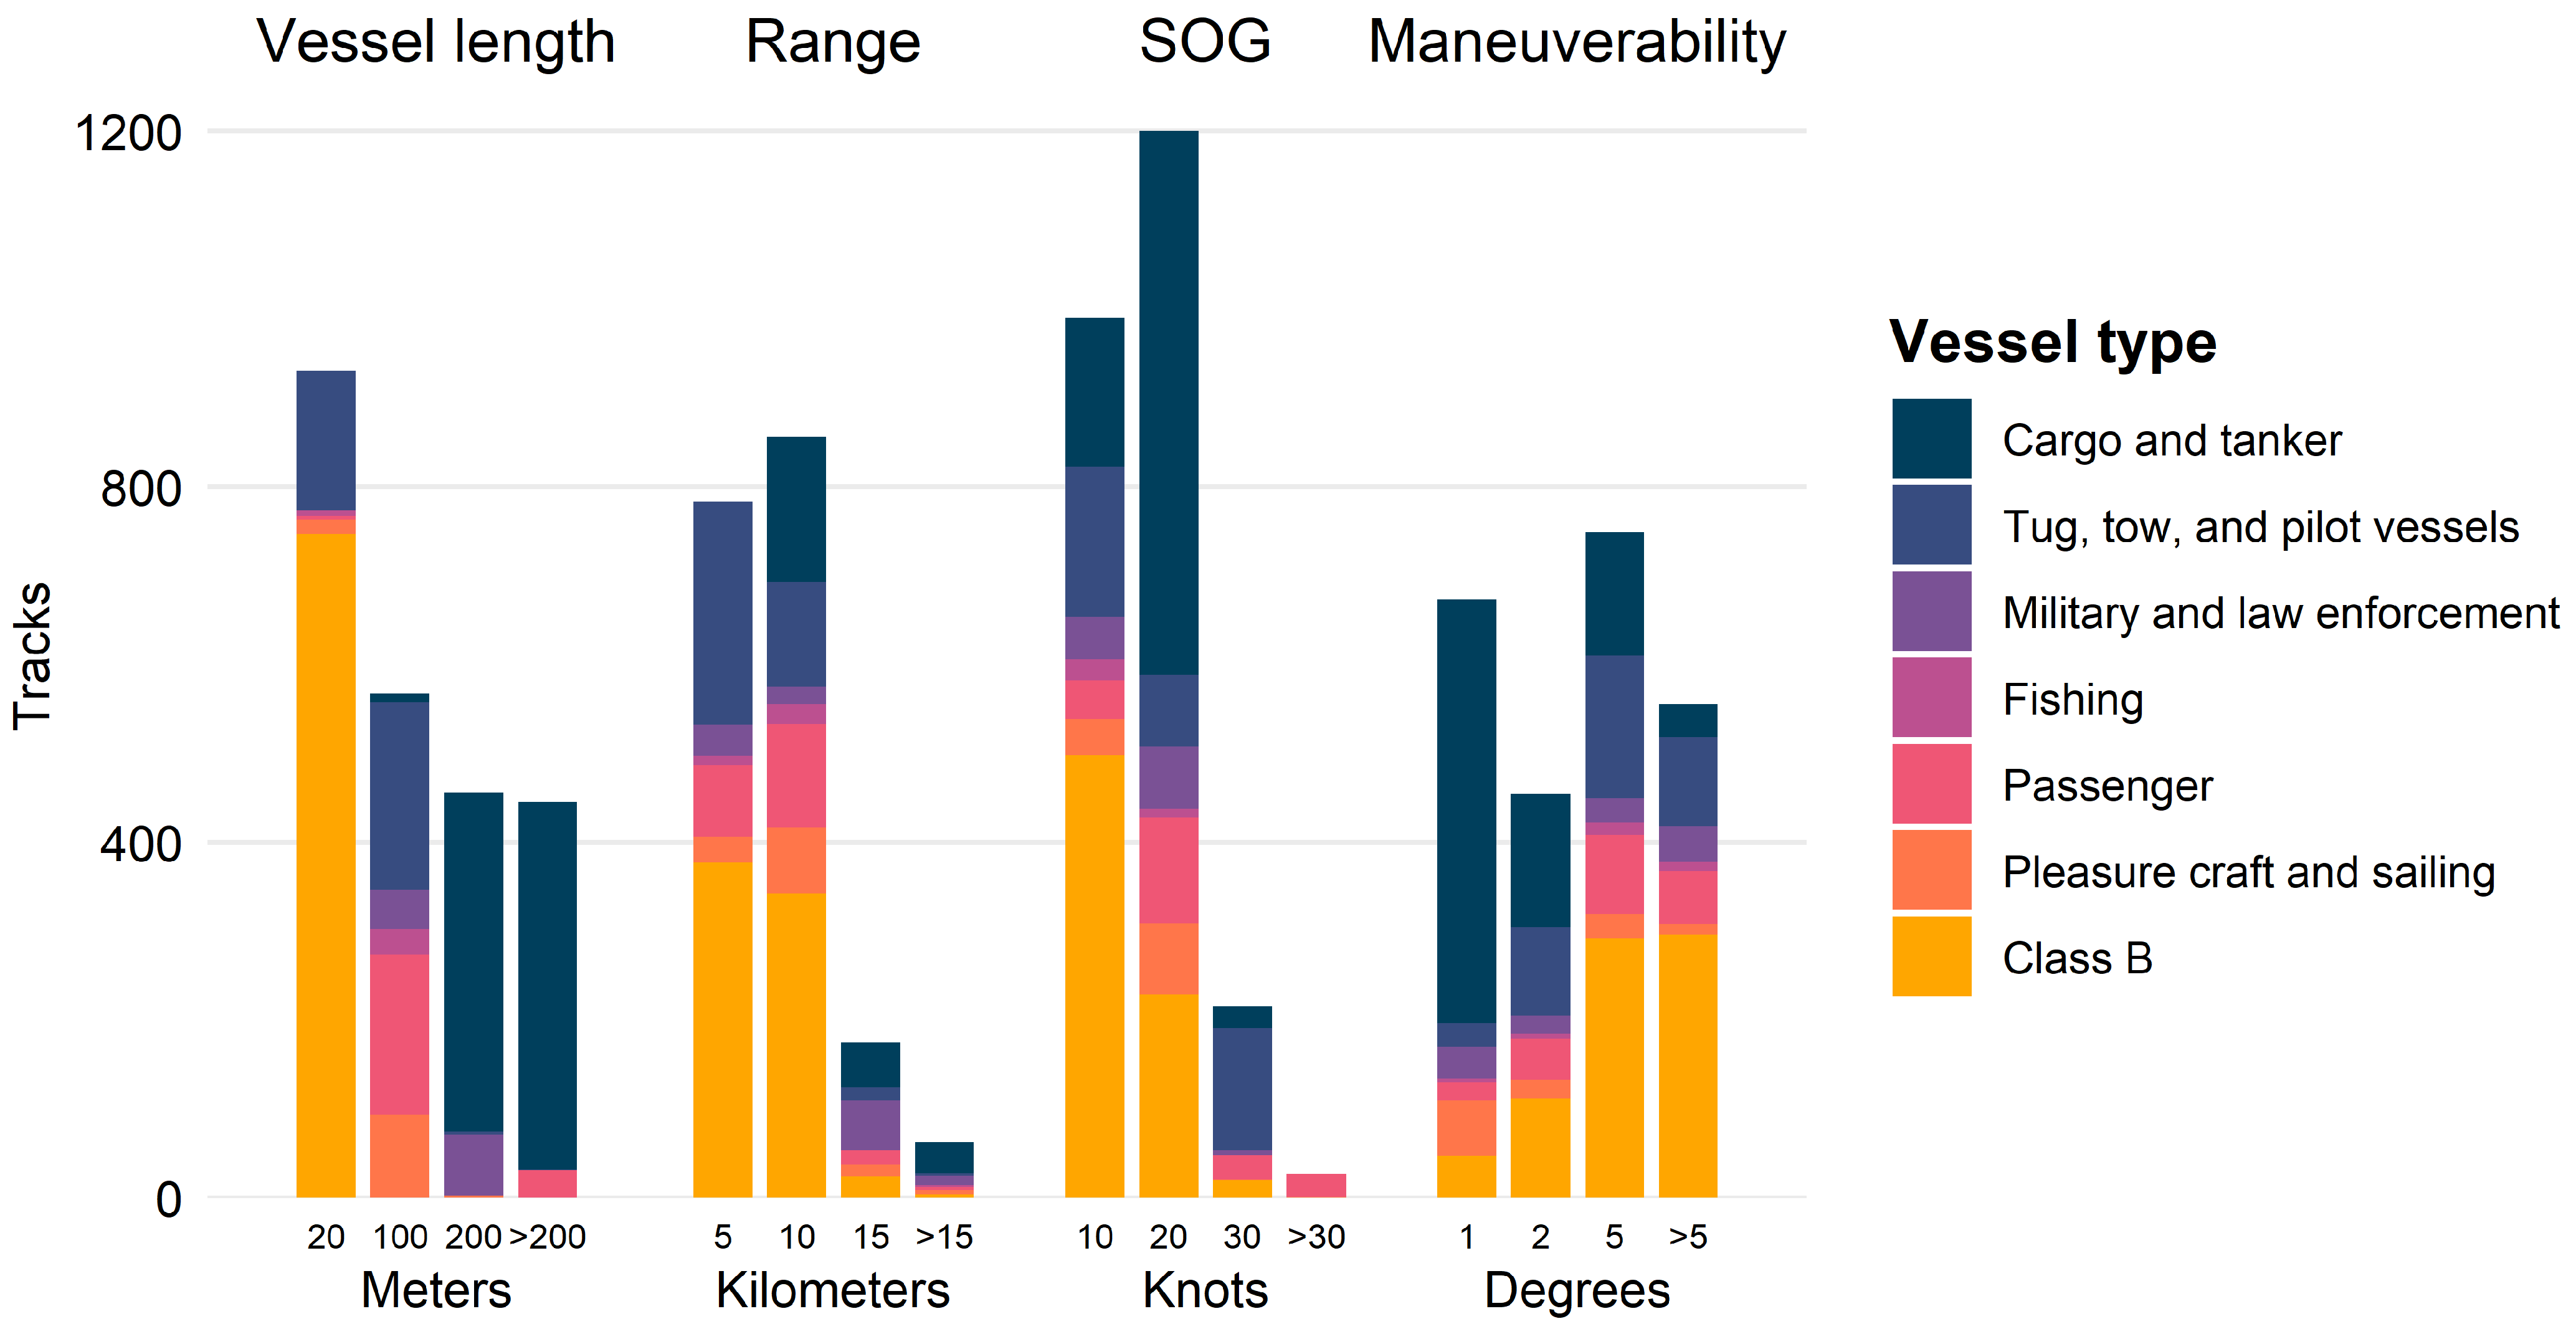
| Vessel Type | Track Count | Associated Detections per Track | Length (m) | Range (km) | SOG (Knots) | Maneuverability (Degrees) |
|---|---|---|---|---|---|---|
| Cargo and tanker | 882 | 18 ± 31 | 217 ± 65 | 8.1 ± 5.5 | 12.3 ± 3.2 | 1.9 ± 3.4 |
| Military and law enforcement | 139 | 48 ± 115 | 159 ± 63 | 12.8 ± 4.6 | 10.6 ± 2.7 | 7.3 ± 14.7 |
| Pleasure craft and sailing | 142 | 50 ± 52 | 56 ± 22 | 7.9 ± 3.1 | 11.6 ± 2.8 | 2.4 ± 5.1 |
| Passenger | 274 | 44 ± 54 | 55 ± 82 | 7.0 ± 3.0 | 11.5 ± 4.8 | 7.7 ± 13.2 |
| Tug, tow, and pilot vessels | 503 | 21 ± 23 | 28 ± 13 | 5.6 ± 3.3 | 11.6 ± 7.2 | 13.2 ± 29.2 |
| Fishing | 41 | 17 ± 18 | 22 ± 9 | 6.6 ± 4.5 | 8.4 ± 1.5 | 6.2 ± 14.1 |
| Class B | 747 | 21 ± 19 | - | 5.5 ± 2.2 | 8.8 ± 3.9 | 7.0 ± 11.6 |
| Variable | Degrees of Freedom | Correlation Coefficient () | Significance (p) | |
|---|---|---|---|---|
| SOG error | Length | 2996 | −0.028 | 0.1197 |
| Range | 3095 | 0.000 | 0.9828 | |
| SOG | 3095 | 0.058 | <0.01 | |
| Maneuverability | 3095 | 0.164 | <0.001 | |
| COG error | Length | 2996 | −0.022 | 0.2181 |
| Range | 3095 | −0.064 | <0.001 | |
| SOG | 3095 | −0.113 | <0.001 | |
| Maneuverability | 3095 | 0.255 | <0.001 |
| Range Scale (Nautical Miles) | Range Error (m) | Bearing Error (m) |
|---|---|---|
| 0.25 | 4.63 | 8.08 |
| 0.5 | 9.26 | 16.16 |
| 0.75 | 13.89 | 24.24 |
| 1.5 | 27.78 | 48.49 |
| 3 | 55.56 | 96.67 |
| 6 | 111.12 | 193.94 |
| 12 | 222.24 | 387.88 |
| 24 | 444.48 | 775.76 |
Disclaimer/Publisher’s Note: The statements, opinions and data contained in all publications are solely those of the individual author(s) and contributor(s) and not of MDPI and/or the editor(s). MDPI and/or the editor(s) disclaim responsibility for any injury to people or property resulting from any ideas, methods, instructions or products referred to in the content. |
© 2025 by the authors. Licensee MDPI, Basel, Switzerland. This article is an open access article distributed under the terms and conditions of the Creative Commons Attribution (CC BY) license (https://creativecommons.org/licenses/by/4.0/).
Share and Cite
King, S.C.; Tougher, B.; Zetterlind, V. Estimating Speed Error of Commercial Radar Tracking to Inform Whale–Ship Strike Mitigation Efforts. Sensors 2025, 25, 1676. https://doi.org/10.3390/s25061676
King SC, Tougher B, Zetterlind V. Estimating Speed Error of Commercial Radar Tracking to Inform Whale–Ship Strike Mitigation Efforts. Sensors. 2025; 25(6):1676. https://doi.org/10.3390/s25061676
Chicago/Turabian StyleKing, Samantha Cope, Brendan Tougher, and Virgil Zetterlind. 2025. "Estimating Speed Error of Commercial Radar Tracking to Inform Whale–Ship Strike Mitigation Efforts" Sensors 25, no. 6: 1676. https://doi.org/10.3390/s25061676
APA StyleKing, S. C., Tougher, B., & Zetterlind, V. (2025). Estimating Speed Error of Commercial Radar Tracking to Inform Whale–Ship Strike Mitigation Efforts. Sensors, 25(6), 1676. https://doi.org/10.3390/s25061676