
Smartphone-Based Analysis for Early Detection of Aging Impact on Gait and Stair Negotiation: A Cross-Sectional Study


Abstract
1. Introduction
2. Methods
2.1. Participants
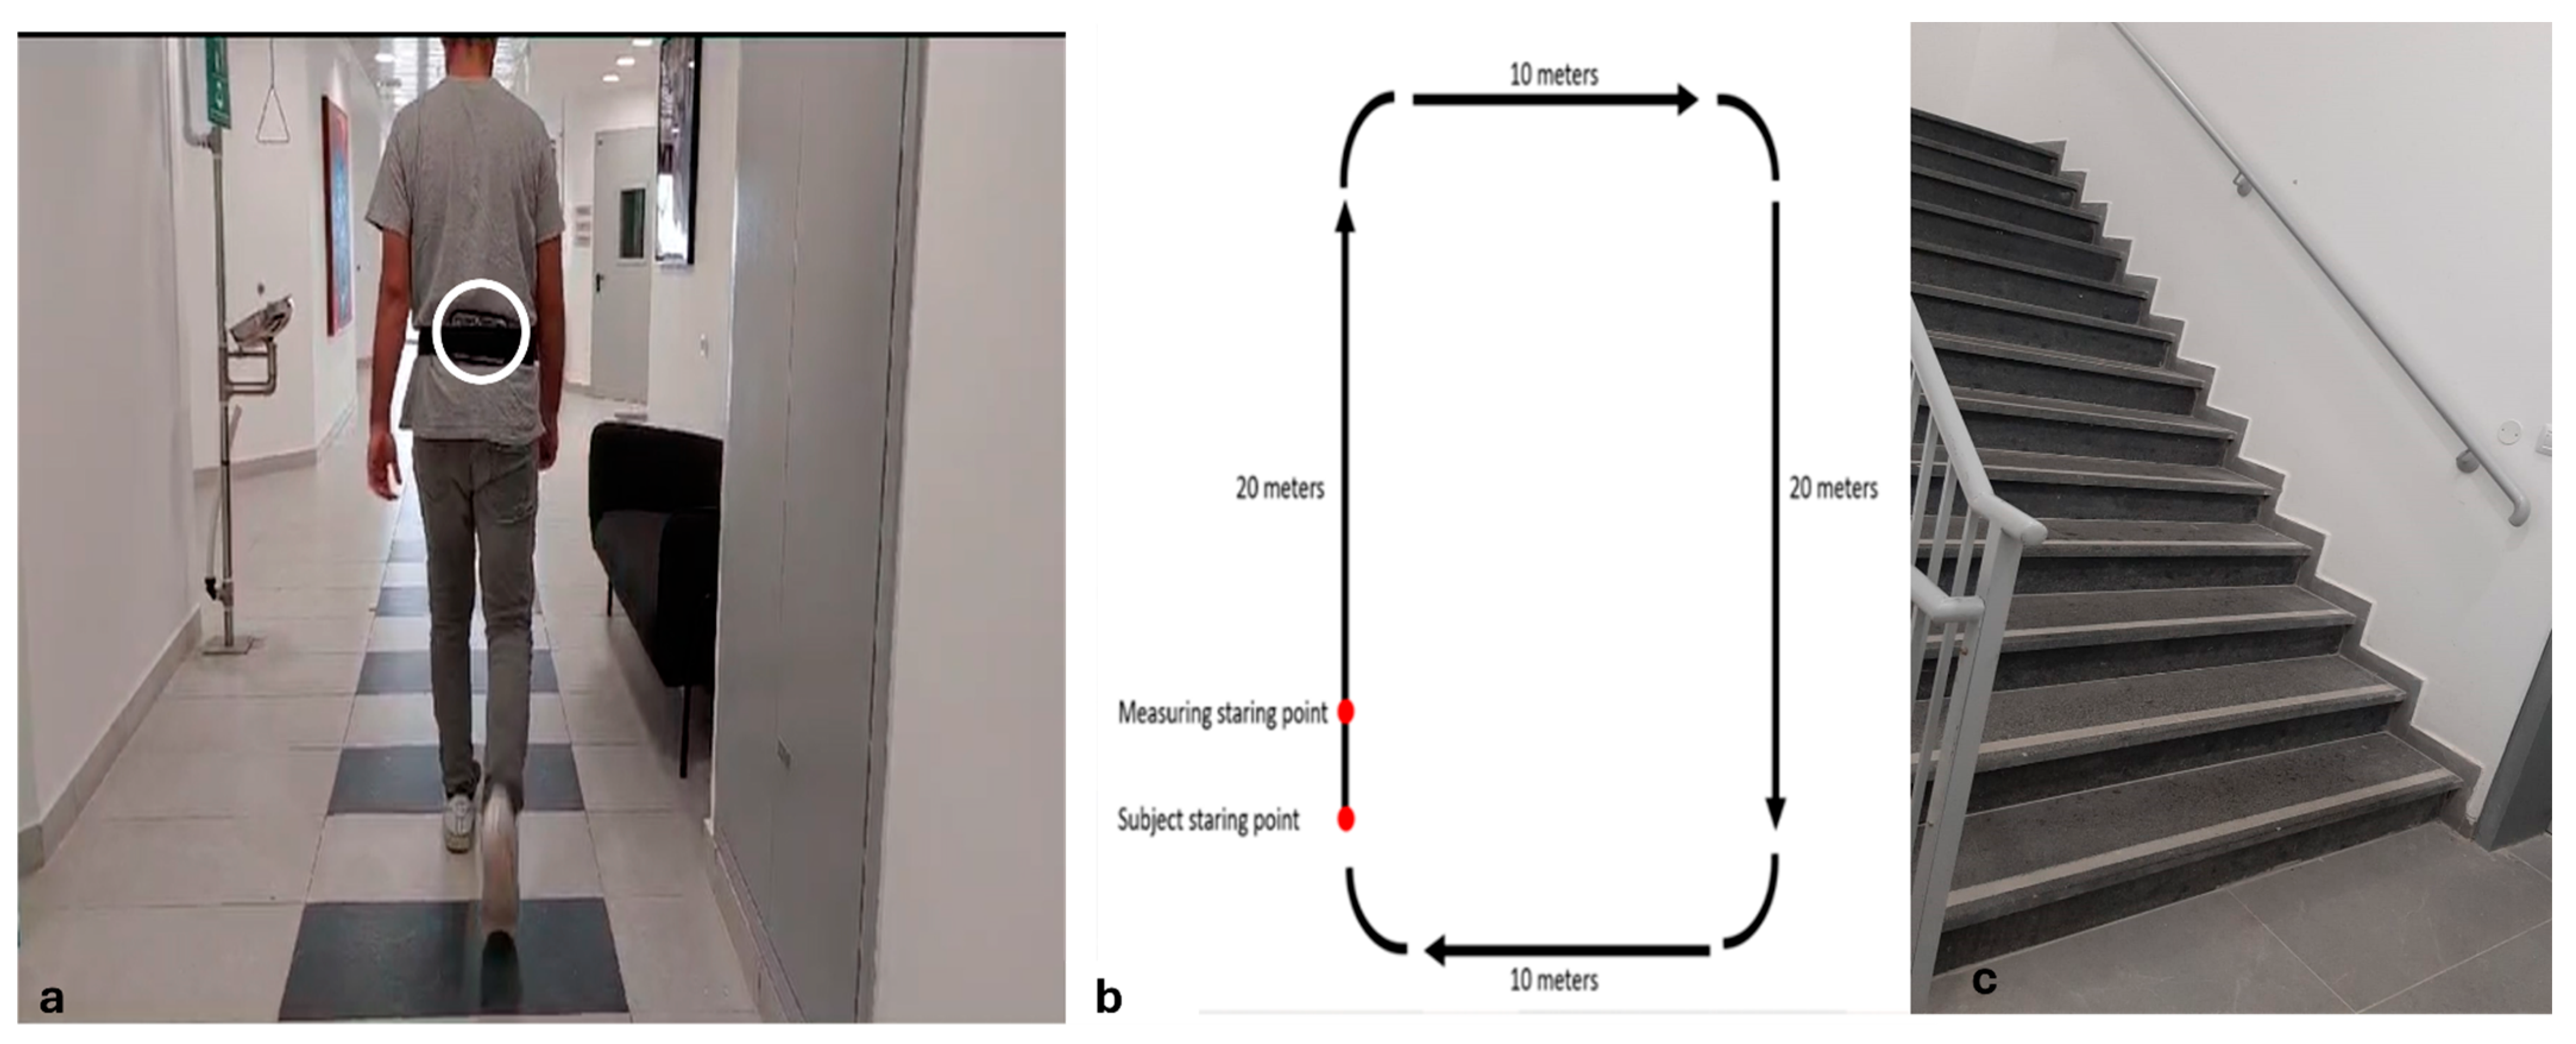
2.2. Procedure
2.3. Gait and Stairs Negotiation Measures and Data Processing
2.4. Statistical Analysis
3. Results
3.1. Baseline Characteristics
3.2. Gait and Stair Negotiation
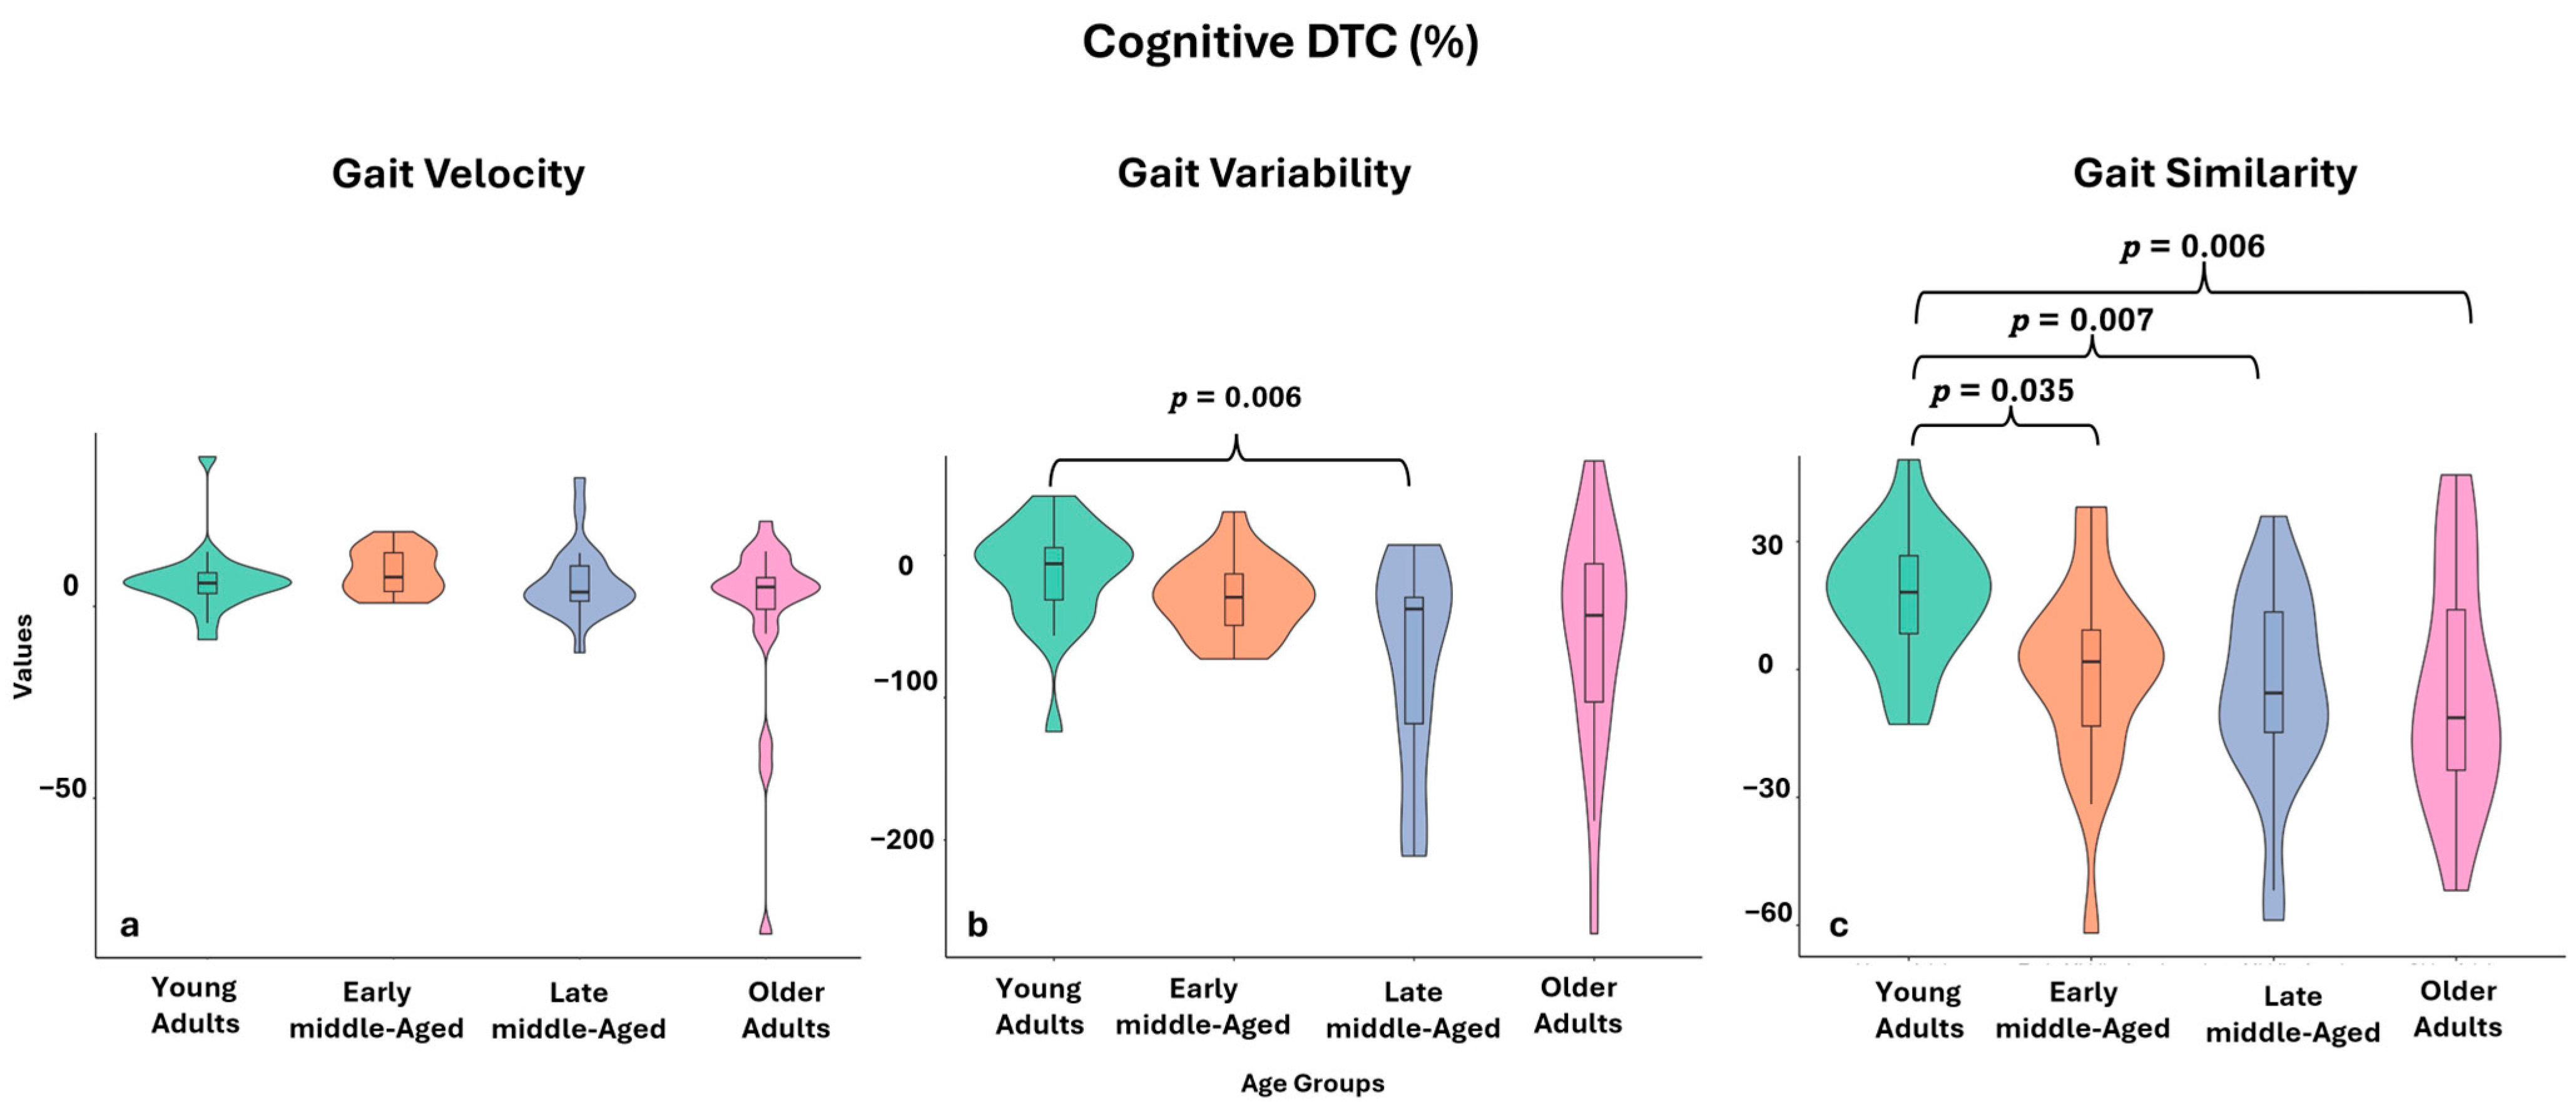
3.3. Gait Velocity
3.4. Gait Variability
3.5. Gait Similarity
3.6. Stairs Ascend and Descend Time
3.7. Muscle Power During Stairs Negotiation
3.8. Stairs-Negotiation Similarity
3.9. The Relationship Between Movement Similarity of Stair Climbing to the Cognitive DTC of Walking and Muscle Power
4. Discussion
5. Conclusions
Author Contributions
Funding
Institutional Review Board Statement
Informed Consent Statement
Data Availability Statement
Conflicts of Interest
References
- Satariano, W.A.; Guralnik, J.M.; Jackson, R.J.; Marottoli, R.A.; Phelan, E.A.; Prohaska, T.R. Mobility and aging: New directions for public health action. Am. J. Public Health 2012, 102, 1508–1515. [Google Scholar] [CrossRef] [PubMed]
- Rezaei, A.; Bhat, S.G.; Cheng, C.-H.; Pignolo, R.J.; Lu, L.; Kaufman, K.R. Age-related changes in gait, balance, and strength parameters: A cross-sectional study. PLoS ONE 2024, 19, e0310764. [Google Scholar] [CrossRef]
- Seals, D.R.; Justice, J.N.; LaRocca, T.J. Physiological geroscience: Targeting function to increase healthspan and achieve optimal longevity. J. Physiol. 2015, 594, 2001–2024. [Google Scholar] [CrossRef]
- Shen, X.; Wang, C.; Zhou, X.; Zhou, W.; Hornburg, D.; Wu, S.; Snyder, M.P. Nonlinear dynamics of multi-omics profiles during human aging. Nat. Aging 2024, 4, 1619–1634. [Google Scholar] [CrossRef] [PubMed]
- Bowling, C.B.; Deng, L.; Sakhuja, S.; Morey, M.C.; Jaeger, B.C.; Muntner, P. Prevalence of Activity Limitations and Association with Multimorbidity Among US Adults 50 to 64 Years Old. J. Gen. Intern. Med. 2019, 34, 2390–2396. [Google Scholar] [CrossRef]
- Gardener, E.A.; Huppert, F.A.; Guralnik, J.M.; Melzer, D. Middle-aged and mobility-limited: Prevalence of disability and symptom attributions in a national survey. J. Gen. Intern. Med. 2006, 21, 1091–1096. [Google Scholar] [CrossRef]
- Baranes, G.; Hayek, R.; Gutman, I.; Frenkel-Toledo, S.; Springer, S. Use of the Brief-BESTest partially instrumented with accelerometry to detect balance deterioration in middle-age. Aging Clin. Exp. Res. 2024, 36, 214. [Google Scholar] [CrossRef] [PubMed]
- Cai, Y.; Tian, Q.; Gross, A.L.; Wang, H.; Jian-Yu, E.; Agrawal, Y.; Simonsick, E.M.; Ferrucci, L.; Schrack, J.A. Motor and Physical Function Impairments as Contributors to Slow Gait Speed and Mobility Difficulty in Middle-Aged and Older Adults. J. Gerontol. A Biol. Sci. Med. Sci. 2022, 77, 1620–1628. [Google Scholar] [CrossRef]
- Peeters, G.; van Schoor, N.M.; Cooper, R.; Tooth, L.; Kenny, R.A. Should prevention of falls start earlier? Co-ordinated analyses of harmonised data on falls in middle-aged adults across four population-based cohort studies. PLoS ONE 2018, 13, e0201989. [Google Scholar] [CrossRef]
- Elliott, S.; Painter, J.; Hudson, S. Living alone and fall risk factors in community-dwelling middle age and older adults. J. Community Health 2009, 34, 301–310. [Google Scholar] [CrossRef]
- Hayek, R.; Gutman, I.; Baranes, G.; Nudelman, Y.; Springer, S. Smartphone-Based Sit-to-Stand Analysis for Mobility Assessment in Middle Age. Innov. Aging 2024, 8, igae079. [Google Scholar] [CrossRef] [PubMed]
- Lachman, M.E. Mind the Gap in the Middle: A Call to Study Midlife. Res. Hum. Dev. 2015, 12, 327–334. [Google Scholar] [CrossRef] [PubMed]
- Herssens, N.; Verbecque, E.; Hallemans, A.; Vereeck, L.; Van Rompaey, V.; Saeys, W. Do spatiotemporal parameters and gait variability differ across the lifespan of healthy adults? A systematic review. Gait Posture 2018, 64, 181–190. [Google Scholar] [CrossRef]
- Rössler, R.; Wagner, J.; Knaier, R.; Rommers, N.; Kressig, R.W.; Schmidt-Trucksäss, A.; Hinrichs, T. Spatiotemporal gait characteristics across the adult lifespan: Reference values from a healthy population–Analysis of the COmPLETE cohort study. Gait Posture 2024, 109, 101–108. [Google Scholar] [CrossRef] [PubMed]
- Niederer, D.; Engeroff, T.; Fleckenstein, J.; Vogel, O.; Vogt, L. The age-related decline in spatiotemporal gait characteristics is moderated by concerns of falling, history of falls & diseases, and sociodemographic-anthropometric characteristics in 60-94 years old adults. Eur. Rev. Aging Phys. Act. Off. J. Eur. Group Res. Elder. Phys. Act. 2021, 18, 19. [Google Scholar] [CrossRef]
- Fritz, S.; Lusardi, M. White paper: “Walking speed: The sixth vital sign”. J. Geriatr. Phys. Ther. 2001 2009, 32, 46–49. [Google Scholar] [CrossRef]
- Middleton, A.; Fritz, S.L.; Lusardi, M. Walking Speed: The Functional Vital Sign. J. Aging Phys. Act. 2015, 23, 314–322. [Google Scholar] [CrossRef]
- Noce Kirkwood, R.; de Souza Moreira, B.; Mingoti, S.A.; Faria, B.F.; Sampaio, R.F.; Alves Resende, R. The slowing down phenomenon: What is the age of major gait velocity decline? Maturitas 2018, 115, 31–36. [Google Scholar] [CrossRef]
- Weston, A.R.; Lohse, K.R.; Kittelson, A.; King, L.A.; Carlson-Kuhta, P.; Dibble, L.E.; Mancini, M. Turning speed as a more responsive metric of age-related decline in mobility: A comparative study with gait speed. Clin. Biomech. Bristol Avon 2024, 113, 106196. [Google Scholar] [CrossRef]
- Alapatt, L.J.; Peel, N.M.; Reid, N.; Gray, L.C.; Hubbard, R.E. The Effect of Age on Gait Speed When Texting. Int. J. Environ. Res. Public Health 2020, 17, 599. [Google Scholar] [CrossRef]
- Zhou, J.; Cattaneo, G.; Yu, W.; Lo, O.Y.; Gouskova, N.A.; Delgado-Gallén, S.; Redondo-Camós, M.; España-Irla, G.; Solana-Sánchez, J.; Tormos, J.M.; et al. The age-related contribution of cognitive function to dual-task gait in middle-aged adults in Spain: Observations from a population-based study–PubMed. Lancet Healthy Longev. 2023, 4, e98–e106. [Google Scholar] [PubMed]
- Lee, H.-S. Application of dynamic time warping algorithm for pattern similarity of gait. J. Exerc. Rehabil. 2019, 15, 526–530. [Google Scholar] [CrossRef]
- Zhang, B.; Jiang, S.; Yan, K.; Wei, D. Human Walking Analysis, Evaluation and Classification Based on Motion Capture System. In Health Management–Different Approaches and Solutions; InTech: London, UK, 2011; ISBN 978-953-307-296-8. [Google Scholar]
- Terrier, P.; Reynard, F. Effect of age on the variability and stability of gait: A cross-sectional treadmill study in healthy individuals between 20 and 69 years of age. Gait Posture 2015, 41, 170–174. [Google Scholar] [CrossRef]
- Job, M.; Dottor, A.; Viceconti, A.; Testa, M. Ecological Gait as a Fall Indicator in Older Adults: A Systematic Review. Gerontologist 2020, 60, e395–e412. [Google Scholar] [CrossRef]
- Hausdorff, J.M.; Schweiger, A.; Herman, T.; Yogev-Seligmann, G.; Giladi, N. Dual-task decrements in gait: Contributing factors among healthy older adults. J. Gerontol. A Biol. Sci. Med. Sci. 2008, 63, 1335–1343. [Google Scholar] [CrossRef] [PubMed]
- Bruyneel, A.-V.; Duclos, N.C. Effects of the use of mobile phone on postural and locomotor tasks: A scoping review. Gait Posture 2020, 82, 233–241. [Google Scholar] [CrossRef] [PubMed]
- Anwer, S.; Li, H.; Antwi-Afari, M.F.; Umer, W.; Mehmood, I.; Wong, A.Y.L. Effects of load carrying techniques on gait parameters, dynamic balance, and physiological parameters during a manual material handling task. Eng. Constr. Archit. Manag. 2021, 29, 3415–3438. [Google Scholar] [CrossRef]
- Demur, T.; Demura, S. Relationship among Gait Parameters while Walking with Varying Loads. J. Physiol. Anthropol. 2010, 29, 29–34. [Google Scholar] [CrossRef]
- Das, R.; Dhume, R.; Iyer, S. Effect of Carrying Symmetric and Asymmetric Weights on Gait Parameters and Lateral Spinal Flexion. Int. J. Eng. Sci. Technol. 2012, 4, 4571. [Google Scholar]
- Dasgupta, P.; VanSwearingen, J.; Godfrey, A.; Redfern, M.; Montero-Odasso, M.; Sejdic, E. Acceleration Gait Measures as Proxies for Motor Skill of Walking: A Narrative Review. IEEE Trans. Neural Syst. Rehabil. Eng. 2020, 29, 249–261. [Google Scholar] [CrossRef]
- Benson, L.C.; Räisänen, A.M.; Clermont, C.A.; Ferber, R. Is This the Real Life, or Is This Just Laboratory? A Scoping Review of IMU-Based Running Gait Analysis. Sensors 2022, 22, 1722. [Google Scholar] [CrossRef]
- Straczkiewicz, M.; James, P.; Onnela, J.-P. A systematic review of smartphone-based human activity recognition methods for health research. NPJ Digit. Med. 2021, 4, 148. [Google Scholar] [CrossRef] [PubMed]
- Silsupadol, P.; Teja, K.; Lugade, V. Reliability and validity of a smartphone-based assessment of gait parameters across walking speed and smartphone locations: Body, bag, belt, hand, and pocket. Gait Posture 2017, 58, 516–522. [Google Scholar] [CrossRef] [PubMed]
- Di Bacco, V.E.; Gage, W.H. Monitoring Age-Related Changes in Gait Complexity in the Wild with a Smartphone Accelerometer System. Sensors 2024, 24, 7175. [Google Scholar] [CrossRef]
- Dixon, P.C.; Stirling, L.; Xu, X.; Chang, C.C.; Dennerlein, J.T.; Schiffman, J.M. Aging may negatively impact movement smoothness during stair negotiation. Hum. Mov. Sci. 2018, 60, 78–86. [Google Scholar] [CrossRef]
- Jacobs, J.V. A review of stairway falls and stair negotiation: Lessons learned and future needs to reduce injury. Gait Posture 2016, 49, 159–167. [Google Scholar] [CrossRef]
- Van Roie, E.; Van Driessche, S.; Huijben, B.; Baggen, R.; van Lummel, R.C.; Delecluse, C. A body-fixed-sensor-based analysis of stair ascent and sit-to-stand to detect age-related differences in leg-extensor power. PLoS ONE 2019, 14, e0210653. [Google Scholar] [CrossRef]
- Meulemans, L.; Seghers, J.; Hoorelbeke, A.; Van Dijck, T.; Delecluse, C.; Van Roie, E. Minimal power required to ascend a flight of stairs versus actual power measured with body-fixed sensors in adults aged 19-85 years. Scand. J. Med. Sci. Sports 2024, 34, e14601. [Google Scholar] [CrossRef]
- Faul, F.; Erdfelder, E.; Lang, A.-G.; Buchner, A. G*Power 3: A flexible statistical power analysis program for the social, behavioral, and biomedical sciences. Behav. Res. Methods 2007, 39, 175–191. [Google Scholar] [CrossRef]
- Hayek, R.; Gottlieb, U.; Gutman, I.; Kingma, I.; Springer, S. Can stabilization analysis following a single leg drop jump be compared between young and middle-aged adults. J. Biomech. 2022, 143, 111269. [Google Scholar] [CrossRef]
- Naaman, T.; Hayek, R.; Gutman, I.; Springer, S. Young, but not in the dark—The influence of reduced lighting on gait stability in middle-aged adults. PLoS ONE 2023, 18, e0280535. [Google Scholar] [CrossRef]
- Your Smartphone Is a Mobile Lab. Available online: https://phyphox.org (accessed on 30 January 2023).
- Staacks, S.; Hütz, S.; Heinke, H.; Stampfer, C. Advanced tools for smartphone-based experiments: Phyphox. Phys. Educ. 2018, 53, 045009. [Google Scholar] [CrossRef]
- Crowley, P.; Madeleine, P.; Vuillerme, N. The effects of mobile phone use on walking: A dual task study. BMC Res. Notes 2019, 12, 352. [Google Scholar] [CrossRef]
- Hollman, J.H.; Kovash, F.M.; Kubik, J.J.; Linbo, R.A. Age-related differences in spatiotemporal markers of gait stability during dual task walking. Gait Posture 2007, 26, 113–119. [Google Scholar] [CrossRef] [PubMed]
- Zhang, B.; Yan, K.; Jiang, S.; Wei, D. Walking stability analysis by age based on Dynamic Time Warping. In Proceedings of the 2008 8th IEEE International Conference on Computer and Information Technology, Sydney, NSW, Australia, 8–11 July 2008; pp. 544–548. [Google Scholar]
- Zijlstra, W.; Bisseling, R.W.; Schlumbohm, S.; Baldus, H. A body-fixed-sensor-based analysis of power during sit-to-stand movements. Gait Posture 2010, 31, 272–278. [Google Scholar] [CrossRef]
- Muscillo, R.; Conforto, S.; Schmid, M.; Caselli, P.; D’Alessio, T. Classification of Motor Activities through Derivative Dynamic Time Warping applied on Accelerometer Data. In Proceedings of the 2007 29th Annual International Conference of the IEEE Engineering in Medicine and Biology Society, Lyon, France, 22–26 August 2007; pp. 4930–4933. [Google Scholar]
- Weiske, F.; Böhme, M.; Jäkel, J.; Zentner, J.; Witt, M. Stair ascent comparison of lower limb kinematics with differing time normalization techniques. J. Biomech. 2021, 119, 110316. [Google Scholar] [CrossRef]
- Zhang, C.; Sun, W.; Song, Q.; Gu, H.; Mao, D. Performance of older adults under dual task during stair descent. J. Exerc. Sci. Fit. 2018, 16, 99–105. [Google Scholar] [CrossRef]
- Fritz, C.O.; Morris, P.E.; Richler, J.J. Effect size estimates: Current use, calculations, and interpretation. J. Exp. Psychol. Gen. 2012, 141, 2–18. [Google Scholar] [CrossRef]
- Al-Yahya, E.; Dawes, H.; Smith, L.; Dennis, A.; Howells, K.; Cockburn, J. Cognitive motor interference while walking: A systematic review and meta-analysis. Neurosci. Biobehav. Rev. 2011, 35, 715–728. [Google Scholar] [CrossRef]
- Schimpl, M.; Moore, C.; Lederer, C.; Neuhaus, A.; Sambrook, J.; Danesh, J.; Ouwehand, W.; Daumer, M. Association between Walking Speed and Age in Healthy, Free-Living Individuals Using Mobile Accelerometry—A Cross-Sectional Study. PLoS ONE 2011, 6, e23299. [Google Scholar] [CrossRef]
- Hennah, C.; Doumas, M. Dual-task walking on real-world surfaces: Adaptive changes in walking speed, step width and step height in young and older adults. Exp. Gerontol. 2023, 177, 112200. [Google Scholar] [CrossRef]
- Yogev-Seligmann, G.; Rotem-Galili, Y.; Mirelman, A.; Dickstein, R.; Giladi, N.; Hausdorff, J.M. How Does Explicit Prioritization Alter Walking During Dual-Task Performance? Effects of Age and Sex on Gait Speed and Variability. Phys. Ther. 2010, 90, 177–186. [Google Scholar] [CrossRef]
- Yang, M.; Leung, L.Y.; Lim, Z.Y.; Ang, R.W.; Ip, H.M.; Lee, X.Q.; Lim, K.Y.; Teoh, L.C.; Yeung, M.T. Reference Values for Habitual and Fast Gait Speed in Singapore Adults Aged 21 to 80. J. Clin. Med. 2024, 13, 3507. [Google Scholar] [CrossRef]
- Kobsar, D.; Olson, C.; Paranjape, R.; Hadjistavropoulos, T.; Barden, J.M. Evaluation of age-related differences in the stride-to-stride fluctuations, regularity and symmetry of gait using a waist-mounted tri-axial accelerometer. Gait Posture 2014, 39, 553–557. [Google Scholar] [CrossRef]
- Ravi, D.K.; Gwerder, M.; König Ignasiak, N.; Baumann, C.R.; Uhl, M.; van Dieën, J.H.; Taylor, W.R.; Singh, N.B. Revealing the optimal thresholds for movement performance: A systematic review and meta-analysis to benchmark pathological walking behaviour. Neurosci. Biobehav. Rev. 2020, 108, 24–33. [Google Scholar] [CrossRef]
- König, N.; Taylor, W.R.; Baumann, C.R.; Wenderoth, N.; Singh, N.B. Revealing the quality of movement: A meta-analysis review to quantify the thresholds to pathological variability during standing and walking. Neurosci. Biobehav. Rev. 2016, 68, 111–119. [Google Scholar] [CrossRef]
- Morrison, L.; Dyer, A.H.; Dolphin, H.; Killane, I.; Bourke, N.M.; Widdowson, M.; Woods, C.P.; Gibney, J.; Reilly, R.B.; Kennelly, S.P. Discrete Relationships between Spatiotemporal Gait Characteristics and Domain-Specific Neuropsychological Performance in Midlife. Sensors 2024, 24, 3903. [Google Scholar] [CrossRef]
- Asai, T.; Doi, T.; Hirata, S.; Ando, H. Dual tasking affects lateral trunk control in healthy younger and older adults. Gait Posture 2013, 38, 830–836. [Google Scholar] [CrossRef]
- Wurdeman, S.R.; Huben, N.B.; Stergiou, N. Variability of gait is dependent on direction of progression: Implications for active control. J. Biomech. 2012, 45, 653–659. [Google Scholar] [CrossRef]
- Tandon, R.; Javid, P.; Di Giulio, I. Mobile phone use is detrimental for gait stability in young adults. Gait Posture 2021, 88, 37–41. [Google Scholar] [CrossRef]
- Yang, C.-Y.; Chen, P.-Y.; Wen, T.-J.; Jan, G.E. IMU Consensus Exception Detection with Dynamic Time Warping-A Comparative Approach. Sensors 2019, 19, 2237. [Google Scholar] [CrossRef]
- Strongman, C.; Morrison, A. A scoping review of non-linear analysis approaches measuring variability in gait due to lower body injury or dysfunction. Hum. Mov. Sci. 2020, 69, 102562. [Google Scholar] [CrossRef]
- Harbourne, R.T.; Stergiou, N. Movement variability and the use of nonlinear tools: Principles to guide physical therapist practice. Phys. Ther. 2009, 89, 267–282. [Google Scholar] [CrossRef]
- Kribus-Shmiel, L.; Zeilig, G.; Sokolovski, B.; Plotnik, M. How many strides are required for a reliable estimation of temporal gait parameters? Implementation of a new algorithm on the phase coordination index. PLoS ONE 2018, 13, e0192049. [Google Scholar] [CrossRef]
- Barth, J.; Oberndorfer, C.; Kugler, P.; Schuldhaus, D.; Winkler, J.; Klucken, J.; Eskofier, B. Subsequence dynamic time warping as a method for robust step segmentation using gyroscope signals of daily life activities. In Proceedings of the 2013 35th Annual International Conference of the IEEE Engineering in Medicine and Biology Society (EMBC), Osaka, Japan, 3–7 July 2013; pp. 6744–6747. [Google Scholar]
- Bampouras, T.M.; Dewhurst, S. Carrying shopping bags does not alter static postural stability and gait parameters in healthy older females. Gait Posture 2016, 46, 81–85. [Google Scholar] [CrossRef]
- Kim, S.-G.; Nam, C.-W.; Yong, M.-S. The effect of increase in baggage weight on elderly women’s lower extremity muscle activation during gait. Arch. Gerontol. Geriatr. 2014, 59, 574–576. [Google Scholar] [CrossRef]
- Zech, A.; Steib, S.; Sportwiss, D.; Freiberger, E.; Pfeifer, K. Functional Muscle Power Testing in Young, Middle-Aged, and Community-Dwelling Nonfrail and Prefrail Older Adults. Arch. Phys. Med. Rehabil. 2011, 92, 967–971. [Google Scholar] [CrossRef]
- Psaltos, D.J.; Mamashli, F.; Adamusiak, T.; Demanuele, C.; Santamaria, M.; Czech, M.D. Wearable-Based Stair Climb Power Estimation and Activity Classification. Sensors 2022, 22, 6600. [Google Scholar] [CrossRef]
- Springer, S.; Giladi, N.; Peretz, C.; Yogev, G.; Simon, E.S.; Hausdorff, J.M. Dual-tasking effects on gait variability: The role of aging, falls, and executive function. Mov. Disord. 2006, 21, 950–957. [Google Scholar] [CrossRef]
- Shapiro, M.; Shaki, S.; Gottlieb, U.; Springer, S. Random walk: Random number generation during backward and forward walking- the role of aging. Front. Aging Neurosci. 2022, 14, 888979. [Google Scholar] [CrossRef]


| Young Adults (n = 22) | Early Middle-Aged Adults (n = 21) | Late Middle-Aged Adults (n = 22) | Older Adults (n = 21) | p-Value | |
|---|---|---|---|---|---|
| Age (years) | 24.7 ± 2.9 | 48.5 ± 2.8 | 59.8 ± 3.0 | 71.9 ± 4.6 | <0.001 |
| Female, n (%) | 12 (54%) | 12 (51%) | 10 (45%) | 11 (52%) | 0.884 |
| Height (m) | 1.69 ± 0.1 | 1.65 ± 0.1 | 1.68 ± 0.1 | 1.64 ± 0.1 | 0.372 |
| Weight (kg) | 70.4 ± 14.1 | 72.7 ± 14.0 | 77.7 ± 16.3 | 69.2 ± 12.2 | 0.528 |
| Body mass index (kg/m2) | 25.4 ± 2.7 | 26.5 ± 3.2 | 26.9 ± 3.6 | 25.7 ± 4.4 | 0.129 |
| Variable | Young Adults (Group #1, n = 22) | Early Middle-Aged (Group #2, n = 21) | Late Middle-Aged (Group #3, n = 22) | Older Adults (Group #4, n = 21) | Kruskal-Wallis H, p-Value | Pairwise Comparisons Compared Group, p, ES | |
|---|---|---|---|---|---|---|---|
| Gait Velocity | Single task (m/s) | 1.17 (1.14–1.18) | 1.12 (1.10–1.17) | 1.13 (1.09–1.15) | 1.04 (0.91–1.16) | 13.589, 0.004 | 1 vs. 4: p = 0.002, ES = 0.56 |
| DTC Cognitive (%) | 6.08 (2.83–9.11) | 7.65 (3.63–14.41) | 3.75 (1.12–11.47) | 5.06 (−3.47–9.96) | 5.422, 0.143 | None | |
| DTC Physical (%) | 1.90 (−0.00–3.24) | 3.05 (0.55–5.40) * | 0.25 (−1.20–1.51) + | −3.56 (−8.56 –- 1.14) | 27.332, <0.001 | 1 vs. 4: p < 0.001, ES = 0.65; 2 vs. 4: p < 0.001, ES = 0.74 | |
| Stride Time Variability | Single task (%) | 2.00 (1.69–2.46) | 1.98 (1.74–2.45) | 1.55 (1.37–1.92) | 2.65 (2.09–4.20) | 25.454, <0.001 | 3 vs. 1: p = 0.018, ES = 0.45; 3 vs. 2: p = 0.014, ES = 0.46; 3 vs. 4: p < 0.001, ES = 0.75 |
| DTC Cognitive (%) | −5.93 (−34.17–6.55) | −29.45 (−49.65–−9.58) * | −37.73 (−120.53–−22.78) * | −42.24 (−111.00–−2.37) * | 11.575, 0.009 | 1 vs. 3: p = 0.006, ES = 0.50 | |
| DTC Physical (%) | 17.38 (3.84–30.22) | 10.55 (−0.12–21.19) * | −8.33 (−19.52–15.87) * | 13.10 (−23.61–45.20) | 7.412, 0.060 | None | |
| DTW AP | Single task | 9.45 (9.15–11.19) | 8.66 (7.59–10.12) | 8.46 (7.73–10.07) | 9.83 (7.98–12.84) * | 7.967, 0.047 | None |
| DTC Cognitive (%) | 16.22 (7.96–27.10) | 1.81 (−16.26–10.53) | −5.53 (−15.84–15.564) | −11.30 (−26.22–23.28) + | 14.936, 0.002 | 1 vs. 2: p = 0.035, ES = 0.42; 1 vs. 3: p = 0.007, ES = 0.50; 1 vs. 4: p = 0.006, ES = 0.51 | |
| DTC Physical (%) | −4.63 (−18.06–10.63) | −0.40 (−12.70–4.71) | 2.37 (−9.53–10.73) * | −8.19 (−35.94 –12.37) + | 1.342, 0.724 | None | |
| DTW ML | Single task | 12.19 (10.32–14.74) | 11.64 (9.51–13.48) | 11.56 (9.28–13.15) * | 13.08 (11.57–15.23) + | 5.560, 0.135 | None |
| DTC Cognitive (%) | 12.59 (−6.24–24.39) | −5.98 (−20.51–11.43) | −5.63 (−23.06–9.67) * | 2.18 (−0.98–19.25) + | 7.145, 0.067 | None | |
| DTC Physical (%) | −8.35 (−22.44–5.23) | −7.39 (−19.33–9.64) | −3.76 (−19.69–4.36) * | 9.57 (−19.43–17.12) + | 3.730, 0.292 | None |
| Condition | Variable | Young Adults (Group #1, n = 22) | Early Middle-Aged (Group #2, n = 21) | Late Middle-Aged (Group #3, n = 22) | Older Adults (Group #4, n = 21) | Kruskal-Wallis H, p-Value | Pairwise Comparisons |
|---|---|---|---|---|---|---|---|
| Ascend | Total time (s) | 6.50 (5.94–6.77) | 6.52 (5.52–6.80) | 6.48 (5.69–7.00) | 6.98 (5.90–7.83) * | 2.260, 0.445 | None |
| Muscle Power normalized to body weight (watts/kg) | 3.32 (3.17–3.63) * | 3.47 (3.10–3.85) | 3.23 (2.78–3.79) | 3.65 (3.13–4.05) | 3.713, 0.294 | None | |
| DTW | 8.98 (8.65–9.13) | 11.42 (10.97–11.92) * | 10.99 (10.63–11.36) | 10.61 (10.51–10.76) | 57.126, <0.001 | 1 vs. 2: p < 0.001, ES = 1.09; 1 vs. 3: p < 0.001, ES = 0.87; 1 vs. 4: p < 0.001, ES = 0.63; 2 vs. 4: p < 0.001, ES = 0.46 | |
| Descend | Total time (s) | 5.94 (5.37–6.50) | 6.08 (4.74–9.07) | 6.15 (5.21–8.06) | 6.76 (5.37–7.15) * | 1.558, 0.669 | None |
| Muscle Power normalized to body weight (watts/kg) | 2.08 (1.93–2.30) | 2.02 (1.80–2.35) | 1.81 (1.45–2.24) | 1.65 (1.53–1.91) + | 17.240, <0.001 | 1 vs. 4: p < 0.001, ES = 0.57; 2 vs. 4: p = 0.007, ES = 0.51 | |
| DTW | 13.27 (13.11–13.36) + | 15.88 (15.48–16.44) * | 16.10 (15.40–16.93) | 15.59 (15.45–16.11) | 44.342, <0.001 | 1 vs. 2: p < 0.001, ES = 0.86; 1 vs. 3: p < 0.001, ES = 0.92; 1 vs. 4: p < 0.001, ES = 0.77 |
Disclaimer/Publisher’s Note: The statements, opinions and data contained in all publications are solely those of the individual author(s) and contributor(s) and not of MDPI and/or the editor(s). MDPI and/or the editor(s) disclaim responsibility for any injury to people or property resulting from any ideas, methods, instructions or products referred to in the content. |
© 2025 by the authors. Licensee MDPI, Basel, Switzerland. This article is an open access article distributed under the terms and conditions of the Creative Commons Attribution (CC BY) license (https://creativecommons.org/licenses/by/4.0/).
Share and Cite
Hayek, R.; Brown, R.T.; Gutman, I.; Baranes, G.; Springer, S. Smartphone-Based Analysis for Early Detection of Aging Impact on Gait and Stair Negotiation: A Cross-Sectional Study. Sensors 2025, 25, 2310. https://doi.org/10.3390/s25072310
Hayek R, Brown RT, Gutman I, Baranes G, Springer S. Smartphone-Based Analysis for Early Detection of Aging Impact on Gait and Stair Negotiation: A Cross-Sectional Study. Sensors. 2025; 25(7):2310. https://doi.org/10.3390/s25072310
Chicago/Turabian StyleHayek, Roee, Rebecca T. Brown, Itai Gutman, Guy Baranes, and Shmuel Springer. 2025. "Smartphone-Based Analysis for Early Detection of Aging Impact on Gait and Stair Negotiation: A Cross-Sectional Study" Sensors 25, no. 7: 2310. https://doi.org/10.3390/s25072310
APA StyleHayek, R., Brown, R. T., Gutman, I., Baranes, G., & Springer, S. (2025). Smartphone-Based Analysis for Early Detection of Aging Impact on Gait and Stair Negotiation: A Cross-Sectional Study. Sensors, 25(7), 2310. https://doi.org/10.3390/s25072310